Impact Factor ISSN: 1837-9664

 Global reach, higher impact
J Cancer 2020; 11(21):6213-6225. doi:10.7150/jca.46155 This issue Cite
Research Paper
Nomograms predicting Overall Survival and Cancer-specific Survival for Synchronous Colorectal Liver-limited Metastasis
Yuqiang Li1,2*, Wenxue Liu3,4, Lilan Zhao5, Cenap Güngör2, Yang Xu2, Xiangping Song1, Dan Wang1,2, Zhongyi Zhou1, Yuan Zhou1, Chenglong Li1, Qian Pei1, Fengbo Tan1 ![]() , Haiping Pei1
, Haiping Pei1 ![]()
1. Department of Gastrointestinal Surgery, Xiangya Hospital, Central South University, Changsha, China.
2. Department of General Visceral and Thoracic Surgery, University Medical Center Hamburg-Eppendorf, Hamburg, Germany.
3. Department of Cardiology, Xiangya Hospital, Central South University, Changsha, China.
4. Department of Rheumatology, Guangdong Provincial People's Hospital, Guangdong Academy of Medical Sciences, Guangzhou, China.
5. Department of Thoracic surgery, Fujian Provincial Hospital, Fuzhou, China.
*This author contributed mainly to this article as a first author.
Received 2020-3-19; Accepted 2020-8-16; Published 2020-8-27
Abstract

Background: Colorectal cancer (CRC) ranks as the third most frequent cancer type and the second leading cause of cancer-related death worldwide. The liver is the most common metastatic site of CRC with 20%-34% of patients suffering synchronous liver metastasis. Patients with colorectal liver-limited metastasis account for one-third of deaths from colorectal cancer. Moreover, some evidence indicated that CRC patients with synchronous liver disease encounter a worse prognosis and more disseminated disease state comparing with metastatic liver disease that develops metachronously.
Methods: Data in this retrospective analysis were extracted from the Surveillance, Epidemiology, and End Results (SEER) database. Nomograms were constructed with basis from a multivariate Cox regression analysis. The prognostic nomograms were validated by C-index, time-dependent receiver operating characteristic (ROC) curve, decision curve analysis (DCA) and calibration curves.
Results: A total of 9,958 CRC patients with synchronous liver-limited metastasis were extracted from the SEER database during 2010-2016. Both overall survival (OS) and cancer-specific survival (CSS) were significantly correlated with age, marital status, race, tumor location, pathological grade, histologic type, T stage, N stage, surgery for primary tumor, surgery for liver metastasis, chemotherapy and CEA. All of the significant variables were used to create the nomograms predicting OS and CSS. C-index values, time-dependent ROC curves, DCA curves and calibration curves, proved the superiority of the nomograms.
Conclusions: Our research investigated a national cohort of almost 10,000 patients to create and verify nomograms based on pathological, therapeutic and demographic features to predict OS and CSS for synchronous colorectal liver-limited metastasis (SCLLM). The nomograms may act as an excellent tool to integrate clinical characteristics to guide the therapeutic choice for SCLLM patients.
Keywords: Nomogram, colorectal cancer, liver metastasis, overall survival, cancer-specific survival
Introduction
Colorectal cancer (CRC) ranks as the third most frequent cancer type and the second leading cause of cancer-related death worldwide [1]. The liver is the most common metastatic site of CRC with 20%-34% of patients suffering synchronous liver metastasis [2, 3]. Meanwhile, hepatic metastasis is now the leading cause of death in CRC patients [4]. Patients with colorectal liver-limited metastasis account for one-third of deaths from colorectal cancer [5]. Moreover, some evidence indicated that CRC patients with synchronous liver disease encountered a worse prognosis and more disseminated disease state comparing with metastatic liver disease that develops metachronously [6]. Accordingly, this study focused on synchronous colorectal liver-limited metastasis (SCLLM).
Notwithstanding that technologies and therapeutic strategies have progressed over the last several decades, the survival of CRC patients with synchronous liver-limited metastasis still remains unsatisfactory. It is urgent to identify prognostic factors for patients with SCLLM. A nomogram, a simple graphical representation combining and quantifying all independent prognostic factors [7], plays an increasingly important role in medical research and clinical practice. Large public databases, like the Surveillance, Epidemiology, and End Results (SEER) database provide available, authentic and reliable data to explore clinical issues.
The purpose of this study was to construct nomograms predicting overall survival (OS) and cancer-specific survival (CSS) for patients with SCLLM based on the SEER database.
Materials and Methods
Patients
Data in this retrospective analysis were extracted from the SEER database. The SEER Program of the National Cancer Institute is an authoritative source of information on cancer incidence and survival in the United States (U.S.) that is updated annually. The definition of SCLLM is colorectal cancer with liver-limited metastases at the time of diagnosis. Therefore, colorectal adenocarcinoma patients (ICD-O-3: 8140, 8144, 8145, 8201, 8210, 8211, 8213, 8253, 8255, 8260, 8261, 8262, 8263, 8310, 8323, 8480, 8481, 8490) with liver metastasis were collected from the period 2010-2016, resulting in 32,353 patients in total. Exclusion criteria: diagnosed at autopsy or death certificate (n=26); survival months is 0 (n=3289); lack of positive histology (n=489); status of lung, bone and brain is yes, unknown or N/A (n=8488); T0, T4NOS, Tx, N1NOS, N2NOS, M1b, M1 and blank(s) in AJCC stage (n=10103). The final study sample contained 9,958 patients.
For each patient, the following data was acquired: age at diagnosis, marital status, insurance, gender, race, grade, histological type, T stage, N stage, regional nodes examined (RNE), CEA, surgery for primary tumor, surgery for hepatic metastasis, perineural invasion (PNI), radiotherapy and chemotherapy. We defined colectomy with RNE ≥12 as standard colectomy and colectomy with RNE <12/NOS as simplified colectomy. All patients were randomly separated into two groups (training group, n = 6639 and validation group, n = 3319).
Follow-up and outcome
The follow-up cutoff was December 31, 2016. The endpoint of this study was OS and CSS. OS was computed from the time of diagnosis to the time of death due to any cause or the time of last follow-up with the patient still alive. CSS was computed from the time of diagnosis to the time of death attributed to colorectal cancer or still alive at last follow-up censored. The OS and CSS curves were evaluated using the Kaplan-Meier method and compared using the log-rank test.
Statistical Analysis
An odds ratio (OR) and a 95% confidence interval (CI) were evaluated by univariable and multivariate Cox regression model. Variables with significant differences in univariate analysis were included in the Cox regression model for multivariate analysis. Nomograms were constructed with basis from the multivariate analysis results, using R 3.6.1 software (Institute for Statistics and Mathematics, Vienna, Austria; http://www.r-project.org/). The prognostic nomograms were validated by a C-index, time-dependent receiver operating characteristic (ROC) curve, decision curve analysis (DCA) and calibration curves. Statistical analyses were performed with IBM SPSS statistics trial ver. 22.0 (IBM, Armonk, NY, USA). All reported p-values lower than 0.05 were considered significant.
Results
Patient Characteristics
A total of 9,958 CRC patients with synchronous liver-limited metastasis were extracted from the SEER database for the period from 2010-2016. Characteristics of the target population were summarized in Table 1. A total 6,639 patients were divided into a training cohort and 3,319 into a validation cohort. Insurance covered 94.45% of SCLLM patients. The majority of patients were elderly (≥60 years), married, and white. The right colon (41.33%) was the most common tumor location in SCLLM. Interestingly, patients with T3 accounted for 57.41%, which was more than the ratio of T4 (28.67%). In addition, positive lymph nodes (68.77%) and CEA (58.24%) were detected in most patients. The median OS and CSS were 17-month and 18-month respectively.
Characteristics of patients with SCLLM in the training and validation group
| Characteristics | Total (n=9958) | Training group (n=6639) | Validation group (n=3319) | |||
|---|---|---|---|---|---|---|
| N | % | N | % | N | % | |
| Gender | ||||||
| Female | 4239 | 42.57% | 2828 | 42.60% | 1411 | 42.51% |
| Male | 5719 | 57.43% | 3811 | 57.40% | 1908 | 57.49% |
| Age (years) | ||||||
| ≤50 | 1734 | 17.41% | 1178 | 17.74% | 556 | 16.75% |
| 51-60 | 2398 | 24.08% | 1580 | 23.80% | 818 | 24.65% |
| 61-70 | 2692 | 27.03% | 1816 | 27.35% | 876 | 26.39% |
| 71-80 | 1899 | 19.07% | 1243 | 18.72% | 656 | 19.76% |
| >80 | 1235 | 12.40% | 822 | 12.38% | 413 | 12.44% |
| Marital status | ||||||
| Married | 5351 | 53.74% | 3598 | 54.19% | 1753 | 52.82% |
| Single | 1794 | 18.02% | 1188 | 17.89% | 606 | 18.26% |
| Divorced/Separated | 1129 | 11.34% | 729 | 10.98% | 400 | 12.05% |
| Widowed | 1198 | 12.03% | 796 | 11.99% | 402 | 12.11% |
| NOS | 486 | 4.88% | 328 | 4.94% | 158 | 4.76% |
| Insurance | ||||||
| Yes | 9405 | 94.45% | 6273 | 94.49% | 3132 | 94.37% |
| No/unknown | 553 | 5.55% | 366 | 5.51% | 187 | 5.63% |
| Race | ||||||
| White | 7556 | 75.88% | 5040 | 75.92% | 2516 | 75.81% |
| Black | 1531 | 15.37% | 1010 | 15.21% | 521 | 15.70% |
| Other/NOS | 871 | 8.75% | 589 | 8.87% | 282 | 8.50% |
| Tumor location | ||||||
| Right colon | 4116 | 41.33% | 2777 | 41.83% | 1339 | 40.34% |
| Left colon | 3367 | 33.81% | 2199 | 33.12% | 1168 | 35.19% |
| Rectum † | 2294 | 23.04% | 1549 | 23.33% | 745 | 22.45% |
| NOS | 181 | 1.82% | 114 | 1.72% | 67 | 2.02% |
| Pathological grade | ||||||
| I | 377 | 3.79% | 259 | 3.90% | 118 | 3.56% |
| II | 6637 | 66.65% | 4426 | 66.67% | 2211 | 66.62% |
| III | 1750 | 17.57% | 1181 | 17.79% | 569 | 17.14% |
| IV | 378 | 3.80% | 240 | 3.62% | 138 | 4.16% |
| Unknown | 816 | 8.19% | 533 | 8.03% | 283 | 8.53% |
| Histological type | ||||||
| Adenocarcinomas | 9397 | 94.37% | 6259 | 94.28% | 3138 | 94.55% |
| MCC/SRCC | 561 | 5.63% | 380 | 5.72% | 181 | 5.45% |
| T stage | ||||||
| T1 | 996 | 10.00% | 670 | 10.09% | 326 | 9.82% |
| T2 | 390 | 3.92% | 266 | 4.01% | 124 | 3.74% |
| T3 | 5717 | 57.41% | 3786 | 57.03% | 1931 | 58.18% |
| T4a | 1800 | 18.08% | 1218 | 18.35% | 582 | 17.54% |
| T4b | 1055 | 10.59% | 699 | 10.53% | 356 | 10.73% |
| N stage | ||||||
| N0 | 3110 | 31.23% | 2081 | 31.35% | 1029 | 31.00% |
| N1a | 1264 | 12.69% | 855 | 12.88% | 409 | 12.32% |
| N1b | 1805 | 18.13% | 1215 | 18.30% | 590 | 17.78% |
| N1c | 224 | 2.25% | 151 | 2.27% | 73 | 2.20% |
| N2a | 1660 | 16.67% | 1104 | 16.63% | 556 | 16.75% |
| N2b | 1895 | 19.03% | 1233 | 18.57% | 662 | 19.95% |
| Colectomy | ||||||
| Standard colectomy | 6866 | 68.95% | 4567 | 68.79% | 2299 | 69.27% |
| Simplified colectomy | 1413 | 14.19% | 946 | 14.25% | 467 | 14.07% |
| Non-colectomy/NOS | 1679 | 16.86% | 1126 | 16.96% | 553 | 16.66% |
| Hepatic surgery | ||||||
| Yes | 1941 | 19.49% | 1285 | 19.36% | 656 | 19.76% |
| No/unknown | 8017 | 80.51% | 5354 | 80.64% | 2663 | 80.24% |
| Radiotherapy | ||||||
| Yes | 963 | 9.67% | 638 | 9.61% | 325 | 9.79% |
| No/Unknown | 8995 | 90.33% | 6001 | 90.39% | 2994 | 90.21% |
| Chemotherapy | ||||||
| Yes | 7426 | 74.57% | 4958 | 74.68% | 2468 | 74.36% |
| No/Unknown | 2532 | 25.43% | 1681 | 25.32% | 851 | 25.64% |
| CEA | ||||||
| Negative | 1351 | 13.57% | 886 | 13.35% | 465 | 14.01% |
| Positive | 5800 | 58.24% | 3899 | 58.73% | 1901 | 57.28% |
| NOS | 2807 | 28.19% | 1854 | 27.93% | 953 | 28.71% |
| PNI | ||||||
| Negative | 5971 | 59.96% | 3977 | 59.90% | 1994 | 60.08% |
| Positive | 2188 | 21.97% | 1493 | 22.49% | 695 | 20.94% |
| NOS | 1799 | 18.07% | 1169 | 17.61% | 630 | 18.98% |
| OS (months) | 17 (7-31) | 17 (7-31) | 18 (8-32) | |||
| CSS (months) | 18 (8-32) | 18 (8-31) | 18 (8-32) | |||
MCC: mucinous cell carcinoma; SRCC: signet ring cell carcinoma; RNE: regional nodes examined; PNI: perineural invasion; NOS: not otherwise specified.
†: Rectum includes Rectosigmoid junction.
Most SCLLM patients underwent the surgery for primary tumor, including 68.95% of cases that received the colectomy with an RNE of more than 12 and 14.19% of patients accepted simplified colectomy. Meanwhile, hepatic surgery was performed for only 19.49% of SCLLM patients. Lastly, 2,532 (25.43%) patients missed chemotherapy in this study.
Independent prognostic factors for OS and CSS
Independent predictors were identified by univariable and multivariable Cox regression analyses. The multivariate Cox regression model was further applied to analyze the qualified variables in univariable one. As shown in Table 2 and 3, both of OS and CSS were significantly correlated with age, marital status, race, tumor location, pathological grade, histologic type, T stage, N stage, surgery for primary tumor, surgery for liver metastasis, chemotherapy and CEA.
Univariable and multivariable Cox regression model analyses of OS for nomogram
| Characteristics | Univariable analysis | Multivariable analysis | ||||||
|---|---|---|---|---|---|---|---|---|
| OR | 95% CI lower | 95% CI upper | p-value | OR | 95% CI lower | 95% CI upper | p-value | |
| Gender | 0.118 | |||||||
| Female | Reference | NA | ||||||
| Male | 0.952 | 0.895 | 1.013 | 0.118 | ||||
| Age (years) | <0.001 | <0.001 | ||||||
| ≤50 | Reference | Reference | ||||||
| 51-60 | 1.137 | 1.027 | 1.260 | 0.014 | 1.095 | 0.987 | 1.214 | 0.086 |
| 61-70 | 1.311 | 1.188 | 1.447 | <0.001 | 1.225 | 1.108 | 1.355 | <0.001 |
| 71-80 | 1.846 | 1.666 | 2.045 | <0.001 | 1.597 | 1.434 | 1.778 | <0.001 |
| >80 | 3.294 | 2.951 | 3.677 | <0.001 | 2.124 | 1.874 | 2.408 | <0.001 |
| Marital status | <0.001 | <0.001 | ||||||
| Married | Reference | Reference | ||||||
| Single | 1.238 | 1.139 | 1.345 | <0.001 | 1.259 | 1.155 | 1.372 | <0.001 |
| Divorced/Separated | 1.150 | 1.041 | 1.271 | 0.006 | 1.123 | 1.015 | 1.243 | 0.024 |
| Widowed | 1.887 | 1.722 | 2.067 | <0.001 | 1.102 | 0.998 | 1.218 | 0.056 |
| NOS | 1.141 | 0.989 | 1.316 | 0.071 | 1.065 | 0.923 | 1.230 | 0.389 |
| Insurance | 0.405 | |||||||
| Yes | Reference | NA | ||||||
| No/unknown | 0.944 | 0.825 | 1.081 | 0.405 | ||||
| Race | <0.001 | <0.001 | ||||||
| White | Reference | Reference | ||||||
| Black | 1.215 | 1.119 | 1.320 | <0.001 | 1.179 | 1.082 | 1.285 | <0.001 |
| Other/NOS | 0.890 | 0.795 | 0.996 | 0.042 | 0.892 | 0.797 | 1.000 | 0.049 |
| Tumor location | <0.001 | <0.001 | ||||||
| Right colon | Reference | Reference | ||||||
| Left colon | 0.645 | 0.600 | 0.692 | <0.001 | 0.743 | 0.689 | 0.800 | <0.001 |
| Rectum † | 0.682 | 0.630 | 0.738 | <0.001 | 0.787 | 0.719 | 0.862 | <0.001 |
| NOS | 1.372 | 1.104 | 1.705 | 0.004 | 1.227 | 0.985 | 1.527 | 0.068 |
| Pathological grade | <0.001 | <0.001 | ||||||
| I | Reference | Reference | ||||||
| II | 0.942 | 0.801 | 1.108 | 0.471 | 1.097 | 0.931 | 1.292 | 0.269 |
| III | 1.418 | 1.195 | 1.683 | <0.001 | 1.498 | 1.257 | 1.785 | <0.001 |
| IV | 1.903 | 1.539 | 2.353 | <0.001 | 2.066 | 1.661 | 2.568 | <0.001 |
| Unknown | 1.325 | 1.097 | 1.599 | 0.003 | 1.122 | 0.925 | 1.360 | 0.243 |
| Histological type | <0.001 | 0.018 | ||||||
| Adenocarcinomas | Reference | Reference | ||||||
| MCC/SRCC | 1.329 | 1.175 | 1.504 | <0.001 | 1.165 | 1.027 | 1.322 | 0.018 |
| T stage | <0.001 | <0.001 | ||||||
| T1 | Reference | Reference | ||||||
| T2 | 0.436 | 0.358 | 0.531 | <0.001 | 0.771 | 0.623 | 0.953 | 0.016 |
| T3 | 0.559 | 0.507 | 0.616 | <0.001 | 0.850 | 0.746 | 0.969 | 0.015 |
| T4a | 0.822 | 0.735 | 0.918 | 0.001 | 1.158 | 1.002 | 1.339 | 0.048 |
| T4b | 0.808 | 0.712 | 0.916 | 0.001 | 1.066 | 0.922 | 1.232 | 0.387 |
| N stage | <0.001 | <0.001 | ||||||
| N0 | Reference | Reference | ||||||
| N1a | 0.805 | 0.724 | 0.894 | <0.001 | 1.150 | 1.026 | 1.289 | 0.017 |
| N1b | 0.934 | 0.853 | 1.023 | 0.140 | 1.319 | 1.188 | 1.465 | <0.001 |
| N1c | 0.863 | 0.680 | 1.094 | 0.223 | 1.147 | .900 | 1.463 | 0.267 |
| N2a | 1.024 | 0.934 | 1.123 | 0.608 | 1.487 | 1.336 | 1.656 | <0.001 |
| N2b | 1.327 | 1.218 | 1.445 | <0.001 | 1.905 | 1.715 | 2.116 | <0.001 |
| Colectomy | <0.001 | <0.001 | ||||||
| Standard colectomy | Reference | Reference | ||||||
| Simplified colectomy | 1.245 | 1.142 | 1.358 | <0.001 | 1.343 | 1.229 | 1.469 | <0.001 |
| Non-colectomy/NOS | 1.964 | 1.817 | 2.123 | <0.001 | 2.599 | 2.288 | 2.953 | <0.001 |
| Hepatic surgery | <0.001 | <0.001 | ||||||
| Yes | Reference | Reference | ||||||
| No/unknown | 1.971 | 1.807 | 2.150 | <0.001 | 1.502 | 1.373 | 1.643 | <0.001 |
| Radiotherapy | <0.001 | .100 | ||||||
| Yes | Reference | Reference | ||||||
| No/Unknown | 1.476 | 1.319 | 1.651 | <0.001 | 1.110 | 0.980 | 1.256 | 0.100 |
| Chemotherapy | <0.001 | <0.001 | ||||||
| Yes | Reference | Reference | ||||||
| No/Unknown | 2.850 | 2.669 | 3.044 | <0.001 | 2.387 | 2.223 | 2.563 | <0.001 |
| CEA | <0.001 | <0.001 | ||||||
| Negative | Reference | Reference | ||||||
| Positive | 1.697 | 1.532 | 1.880 | <0.001 | 1.624 | 1.465 | 1.801 | <0.001 |
| NOS | 1.666 | 1.492 | 1.860 | <0.001 | 1.476 | 1.321 | 1.649 | <0.001 |
| PNI | <0.001 | 0.412 | ||||||
| Negative | Reference | Reference | ||||||
| Positive | 1.091 | 1.011 | 1.178 | 0.025 | 1.043 | 0.964 | 1.129 | 0.293 |
| NOS | 1.403 | 1.297 | 1.518 | <0.001 | 0.970 | 0.885 | 1.064 | 0.521 |
MCC: mucinous cell carcinoma; SRCC: signet ring cell carcinoma; RNE: regional nodes examined; PNI: perineural invasion; NOS: not otherwise specified; NA: Unavailable.
†: Rectum includes Rectosigmoid junction.
Univariable and multivariable Cox regression model analyses of CSS for nomogram
| Characteristics | Univariable analysis | Multivariable analysis | ||||||
|---|---|---|---|---|---|---|---|---|
| OR | 95% CI lower | 95% CI upper | p-value | OR | 95% CI lower | 95% CI upper | p-value | |
| Gender | 0.060 | |||||||
| Female | Reference | NA | ||||||
| Male | 0.935 | 0.872 | 1.003 | 0.060 | ||||
| Age (years) | <0.001 | <0.001 | ||||||
| ≤50 | Reference | Reference | ||||||
| 51-60 | 1.111 | 0.997 | 1.238 | 0.057 | 1.065 | 0.954 | 1.189 | 0.259 |
| 61-70 | 1.242 | 1.117 | 1.382 | <0.001 | 1.151 | 1.032 | 1.283 | 0.011 |
| 71-80 | 1.777 | 1.585 | 1.992 | <0.001 | 1.503 | 1.333 | 1.695 | <0.001 |
| >80 | 3.221 | 2.835 | 3.660 | <0.001 | 2.070 | 1.790 | 2.395 | <0.001 |
| Marital status | <0.001 | <0.001 | ||||||
| Married | Reference | Reference | ||||||
| Single | 1.261 | 1.150 | 1.383 | <0.001 | 1.262 | 1.147 | 1.388 | <0.001 |
| Divorced/Separated | 1.142 | 1.018 | 1.281 | 0.024 | 1.083 | 0.964 | 1.217 | 0.181 |
| Widowed | 1.949 | 1.749 | 2.171 | <0.001 | 1.159 | 1.030 | 1.304 | 0.015 |
| NOS | 1.127 | 0.959 | 1.326 | 0.147 | 1.030 | .875 | 1.213 | 0.722 |
| Insurance | 0.857 | |||||||
| Yes | Reference | NA | ||||||
| No/unknown | 0.987 | 0.852 | 1.142 | 0.857 | ||||
| Race | <0.001 | <0.001 | ||||||
| White | Reference | Reference | ||||||
| Black | 1.257 | 1.146 | 1.378 | <0.001 | 1.166 | 1.059 | 1.283 | 0.002 |
| Other/NOS | 0.902 | 0.795 | 1.023 | 0.109 | 0.852 | 0.750 | 0.968 | 0.014 |
| Tumor location | <0.001 | <0.001 | ||||||
| Right colon | Reference | Reference | ||||||
| Left colon | 0.621 | 0.572 | 0.673 | <0.001 | 0.719 | 0.660 | 0.782 | <0.001 |
| Rectum † | 0.674 | 0.616 | 0.737 | <0.001 | 0.751 | 0.677 | 0.833 | <0.001 |
| NOS | 1.408 | 1.096 | 1.810 | 0.007 | 1.244 | 0.965 | 1.604 | 0.092 |
| Pathological grade | <0.001 | <0.001 | ||||||
| I | Reference | Reference | ||||||
| II | 0.937 | 0.780 | 1.124 | 0.482 | 1.101 | 0.915 | 1.324 | 0.310 |
| III | 1.434 | 1.182 | 1.740 | <0.001 | 1.527 | 1.253 | 1.861 | <0.001 |
| IV | 1.899 | 1.493 | 2.415 | <0.001 | 1.942 | 1.517 | 2.485 | <0.001 |
| Unknown | 1.274 | 1.028 | 1.579 | .027 | 1.089 | 0.873 | 1.359 | 0.451 |
| Histological type | <0.001 | 0.017 | ||||||
| Adenocarcinomas | Reference | Reference | ||||||
| MCC/SRCC | 1.315 | 1.142 | 1.514 | <0.001 | 1.193 | 1.033 | 1.378 | 0.017 |
| T stage | <0.001 | <0.001 | ||||||
| T1 | Reference | Reference | ||||||
| T2 | 0.412 | 0.325 | 0.522 | <0.001 | 0.702 | 0.544 | 0.905 | 0.006 |
| T3 | 0.548 | 0.489 | 0.613 | <0.001 | 0.799 | 0.685 | 0.931 | 0.004 |
| T4a | 0.810 | 0.713 | 0.921 | 0.001 | 1.100 | 0.927 | 1.304 | 0.275 |
| T4b | 0.786 | 0.680 | 0.909 | 0.001 | 1.032 | 0.874 | 1.218 | 0.711 |
| N stage | <0.001 | <0.001 | ||||||
| N0 | Reference | Reference | ||||||
| N1a | 0.822 | 0.728 | 0.927 | 0.001 | 1.183 | 1.038 | 1.348 | 0.012 |
| N1b | 0.943 | 0.850 | 1.047 | 0.270 | 1.309 | 1.160 | 1.477 | <0.001 |
| N1c | 0.871 | 0.665 | 1.140 | 0.315 | 1.083 | 0.821 | 1.428 | 0.572 |
| N2a | 1.034 | 0.930 | 1.149 | 0.538 | 1.485 | 1.314 | 1.679 | <0.001 |
| N2b | 1.391 | 1.263 | 1.532 | <0.001 | 1.989 | 1.765 | 2.241 | <0.001 |
| Colectomy | <0.001 | <0.001 | ||||||
| Standard colectomy | Reference | Reference | ||||||
| Simplified colectomy | 1.222 | 1.106 | 1.350 | <0.001 | 1.338 | 1.207 | 1.484 | <0.001 |
| Non-colectomy/NOS | 1.984 | 1.814 | 2.170 | <0.001 | 2.714 | 2.349 | 3.136 | <0.001 |
| Hepatic surgery | <0.001 | <0.001 | ||||||
| Yes | Reference | Reference | ||||||
| No/unknown | 1.960 | 1.776 | 2.162 | <0.001 | 1.479 | 1.336 | 1.637 | <0.001 |
| Radiotherapy | <0.001 | 0.235 | ||||||
| Yes | Reference | Reference | ||||||
| No/Unknown | 0.666 | 0.586 | 0.757 | <0.001 | 1.090 | 0.945 | 1.258 | 0.235 |
| Chemotherapy | <0.001 | <0.001 | ||||||
| Yes | Reference | Reference | ||||||
| No/Unknown | 2.843 | 2.635 | 3.068 | <0.001 | 2.412 | 2.221 | 2.620 | <0.001 |
| CEA | <0.001 | <0.001 | ||||||
| Negative | Reference | Reference | ||||||
| Positive | 1.722 | 1.534 | 1.934 | <0.001 | 1.593 | 1.417 | 1.791 | <0.001 |
| NOS | 1.702 | 1.502 | 1.929 | <0.001 | 1.466 | 1.292 | 1.663 | <0.001 |
| PNI | <0.001 | 0.099 | ||||||
| Negative | Reference | Reference | ||||||
| Positive | 1.102 | 1.011 | 1.202 | 0.027 | 1.082 | 0.990 | 1.184 | 0.084 |
| NOS | 1.367 | 1.248 | 1.496 | <0.001 | 0.948 | 0.854 | 1.054 | 0.325 |
MCC: mucinous cell carcinoma; SRCC: signet ring cell carcinoma; RNE: regional nodes examined; PNI: perineural invasion; NOS: not otherwise specified; NA: Unavailable.
†: Rectum includes Rectosigmoid junction.
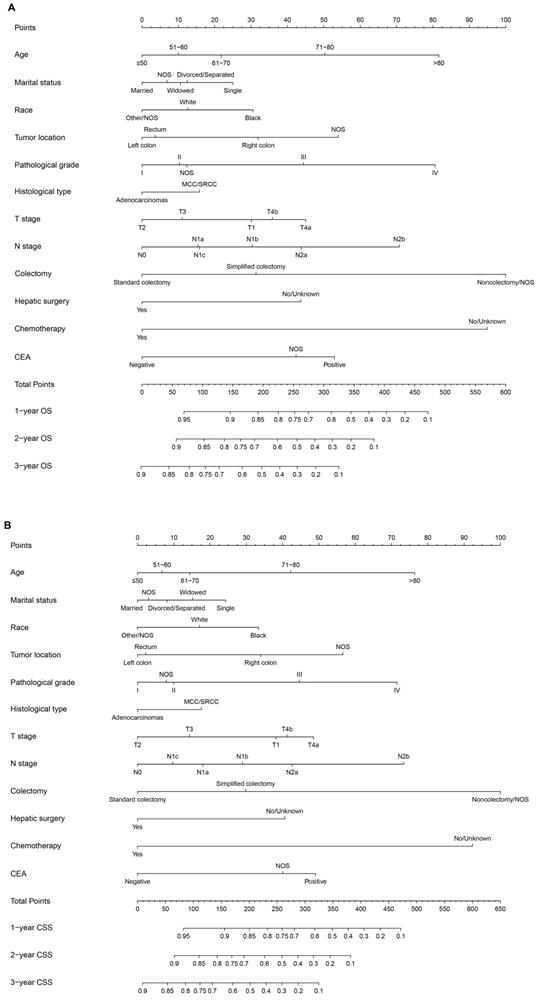
All of the significant variables were used to create the nomograms for OS and CSS. The prognostic nomogram for 1-, 2-, and 3-year OS was shown in Figure 1A. The prognostic nomogram for 1-, 2-, and 3-year CSS was shown in Figure 1B. By adding up the scores related to each variable and projecting total scores to the bottom scales, we were easily able to calculate the estimated 1-, 2-, and 3-year OS and CSS probabilities.
A. Nomogram of predicting OS for patients with SCLLM; B. Nomogram of predicting CSS for patients with SCLLM.
Calibration and Validation of Prognostic Nomograms
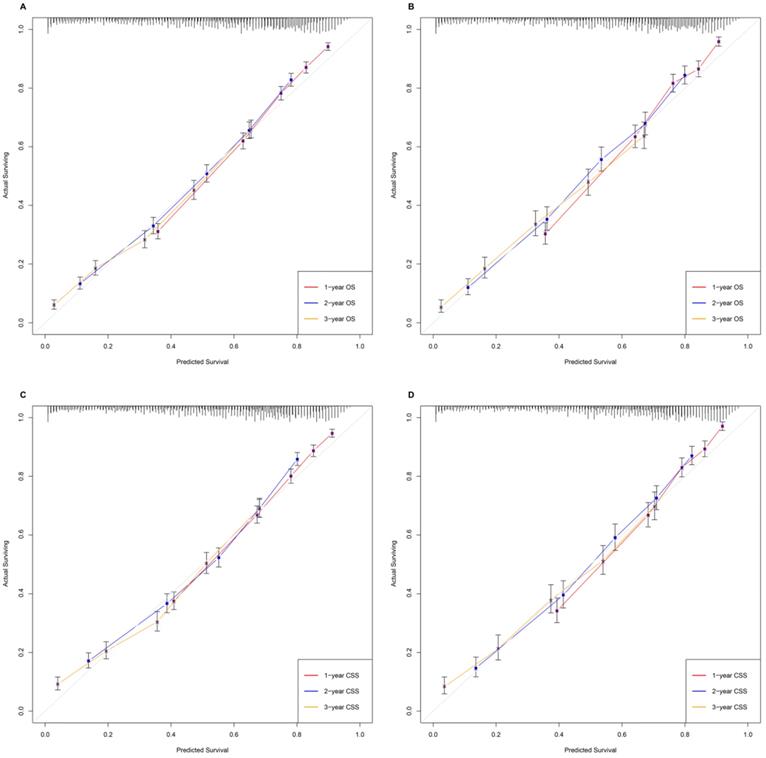
Various methods, including C-index values, time-dependent ROC curves, decision curve analysis (DCA) and calibration curves, were utilized to evaluate the discriminating superiority of nomograms. The C-indexes proved that the nomograms provided favorable predictive accuracy. The nomogram predicting OS obtained 0.744 (95%CI: 0.736-0.752) and 0.749 (95%CI: 0.738-0.760) regarding the C-index in the training and validation group, respectively. While the C-index values of the nomogram predicting CSS were 0.741 (95%CI: 0.732-0.750) and 0.753 (95%CI: 0.741-0.766) in the training and validation group, respectively (Table 4). Besides, the calibration curves were able to visually illustrate the relationship between actual probability and predicted probability. As shown in Figure 2, the calibration curves, without obvious deviations from the reference line, illustrated the optimal agreement between model prediction and actual observations for 1-, 2-, 3-year OS and CSS.
The calibration curves, without obviously deviations from the reference line, illustrated optimal agreement between model prediction and actual observations for 1-, 2-, 3-year OS and CSS. A. Predicting patients' OS at 1-year, 2-year, 3-year in the training group. B. Predicting patients' OS at 1-year, 2-year, 3-year in the validation group. C. Predicting patients' CSS at 1-year, 2-year, 3-year in the training group. D. Predicting patients' CSS at 1-year, 2-year, 3-year in the validation group.
The C-indices for predictions of overall survival and cancer-specific survival
| OS | CSS | |||
|---|---|---|---|---|
| C-index | 95% CI | C-index | 95% CI | |
| Training group | 0.744 | 0.736-0.752 | 0.741 | 0.732-0.750 |
| Validation group | 0.749 | 0.738-0.760 | 0.753 | 0.741-0.766 |
Abbreviations: OS, overall survival; CSS, cancer-specific survival; C-index, index of concordance; CI, confidence interval.
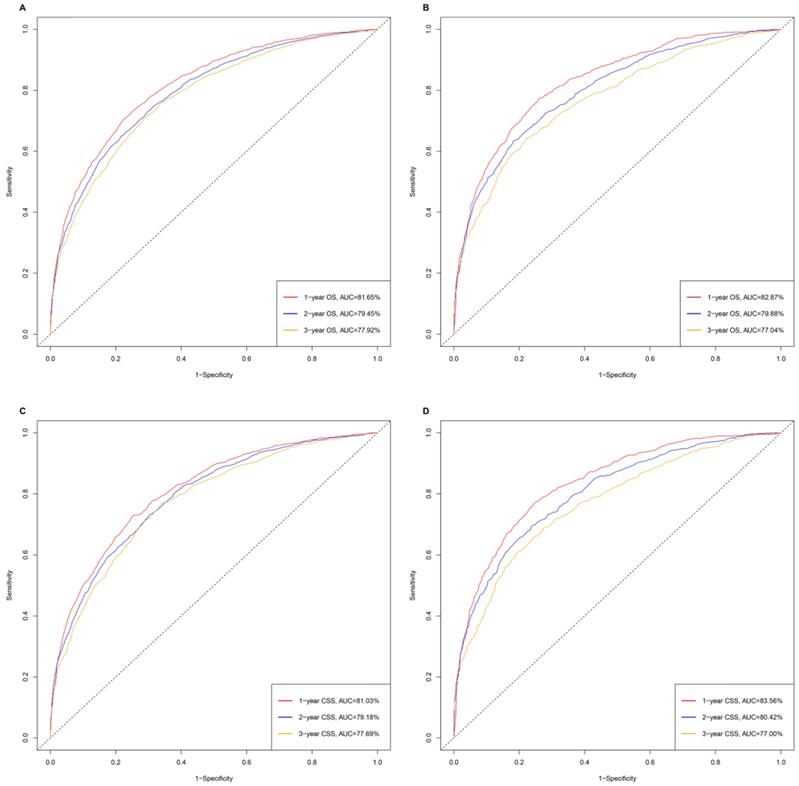
The time-dependent receiver operating characteristic (ROC) has been used widely to display sensitivity and specificity in predictive models. The area under the curve (AUC) values of ROC were 81.65%, 79.45% and 77.92% regarding for nomograms predicting 1-, 2- and 3- year OS, respectively, in the training cohort. While the 1-, 2-, and 3-year AUC values of the nomogram for OS were 82.87%, 79.88% and 77.04%, respectively, in the validation cohort. Similarly, the nomogram of CSS obtained the outstanding AUC values in training (AUC=81.03% for 1-year CSS; AUC=79.18% for 2-year CSS and AUC=77.69% for 3-year CSS) and the validation group (AUC=83.56% for 1-year CSS; AUC=80.42% for 2-year CSS and AUC=77.00% for 3-year CSS) (Figure 3).
The time-dependent ROC curves of nomograms. A. The AUC values of ROC were 81.65%, 79.45% and 77.92% regarding nomograms predicting 1-, 2- and 3- year OS in training cohort. B. The 1-, 2-, and 3-year AUC values of the nomogram for OS were 82.87%, 79.88% and 77.04% in validation cohort. C. The AUC values of ROC were 81.03%, 79.18% and 77.69% regarding nomograms predicting 1-, 2- and 3- year CSS in training cohort. D. The 1-, 2-, and 3-year AUC values of the nomogram for CSS were 83.56%, 80.42% and 77.00% in validation cohort.
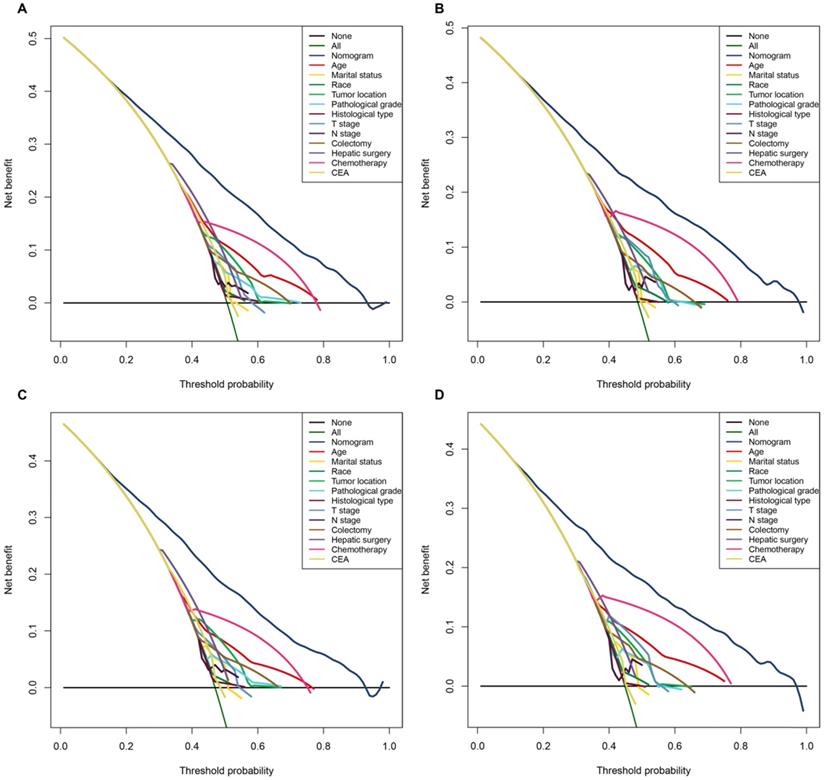
Moreover, in terms of clinical utility, DCA demonstrated that the nomograms, provided excellent net benefits and were superior to the any single prognostic factors across the wider range of reasonable threshold probabilities in OS and CSS (Figure 4).
The decision curve analysis (DCA) demonstrated that the nomograms owned excellent net benefits and was superior to the any single prognostic factors across the wider range of reasonable threshold probabilities in OS and CSS. A. The DCA of the nomogram and all prognostic factors for OS in the training cohort. B. The DCA of the nomogram and all prognostic factors for OS in the validation cohort. C. DCA of the nomogram and all prognostic factors for CSS in the training cohort. D. The DCA of the nomogram and all prognostic factors for CSS in the validation cohort.
Performance of the Nomograms in Stratifying on the Basis of Risk Scores
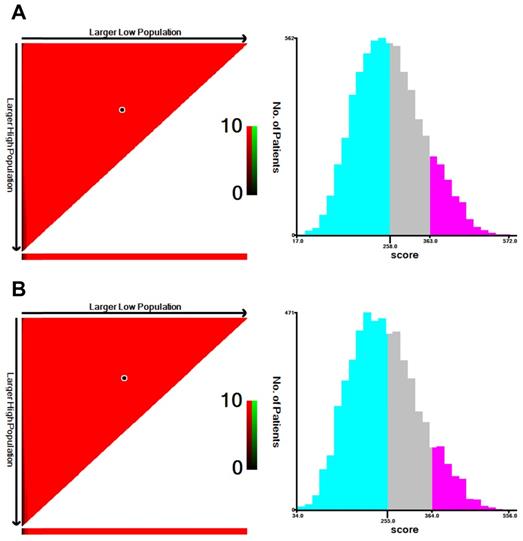
The prognostic scores of all independent predictors were assigned on the basis of the established nomogram, and optimal cut-off values were calculated by using X-tile based on the total scores of patients in the training cohort [8]. According to the cut-off values of the nomogram for OS, SCLLM were divided into low-risk (score < 258), moderate-risk (258 ≤ score < 363) and high-risk (score ≥ 363) (Figure 5). Similarly, patients were classified into three subgroups based on total score (< 255, 255 to 364, and ≥ 364) for CSS (Figure 5).
The cut-off values were calculated by using X-tile based on the total scores of patients in the training cohort. A. According to the cut-off values of the nomogram for OS, SCLLM were divided into low-risk (score < 258), moderate-risk (258 ≤ score < 363) and high-risk (score ≥ 363). B. According to the cut-off values of the nomogram for CSS, SCLLM were divided into low-risk (score < 255), moderate-risk (255 ≤ score < 364) and high-risk (score ≥ 364).
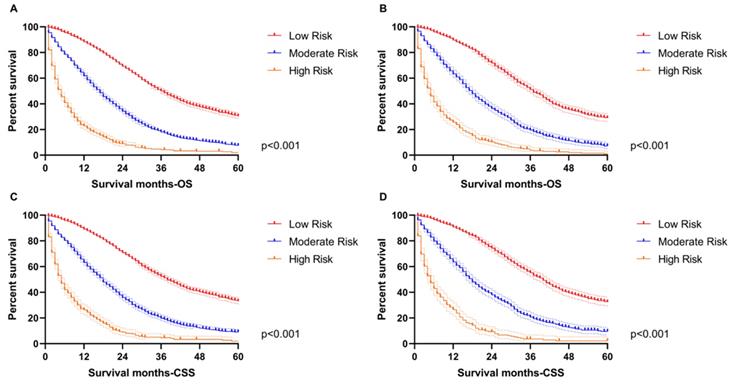
Additionally, the Kaplan-Meier survival curves were subsequently delineated and are shown in Figure 6. In the training group, the low-risk cohort owned the longest median OS (36-month) and CSS (38-month), followed by the moderate-risk cohort (17-month OS and 18-month CSS) and the high-risk cohort (5-month for OS and CSS). We obtained consistent results in the validation cohort (low-risk group: 37-month median OS and 40-month median CSS; moderate-risk group: 18-month median OS and CSS; high-risk group: 5-month median OS and CSS).
The survival analysis in the subgroup. A. The low-risk cohort owned the longest median OS (36-month) followed by the moderate-risk cohort (17-month OS) and high-risk cohort (5-month for OS) in the training group. B. The low-risk cohort owned the longest median OS (37-month) followed by the moderate-risk cohort (18-month OS) and high-risk cohort (5-month for OS) in the validation group. C. The low-risk cohort owned the longest median CSS (38-month) followed by the moderate-risk cohort (18-month CSS) and high-risk cohort (5-month for CSS) in the training group. D. The low-risk cohort owned the longest median CSS (40-month) followed by the moderate-risk cohort (18-month OS) and high-risk cohort (5-month for OS) in the validation group.
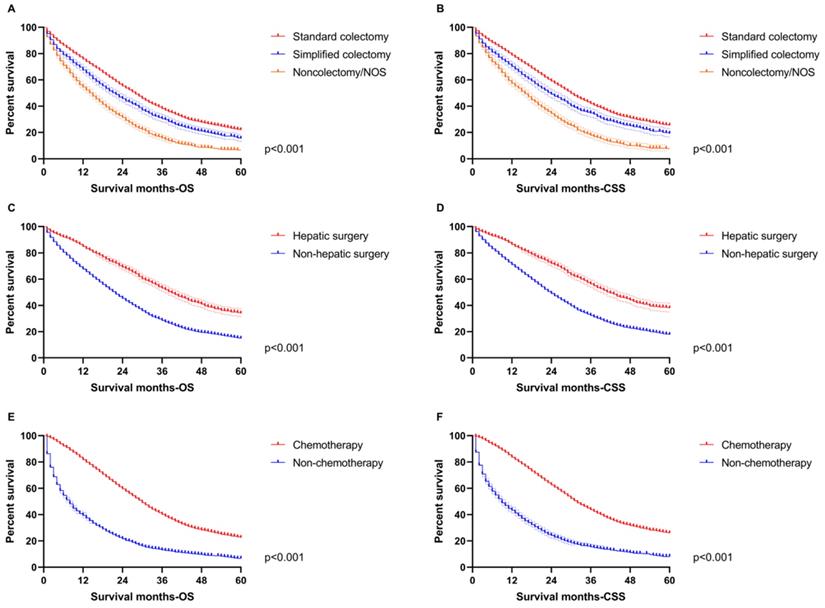
In order to highlight the role of therapeutic variables, survival curves were also drawn to indicate the benefit from treatment based on the total population in this study. All primary surgery, hepatic operation and chemotherapy improved OS and CSS distinctly (p<0.001, Figure 7), which was consistent with the nomograms.
The survival analysis for therapeutic features in the total population. A. The difference of OS among standard colectomy (median OS: 28-month), simplified colectomy (median OS: 22-month) and non-colectomy/NOS (median OS: 15-month). B. The difference of CSS among standard colectomy (median CSS: 30-month), simplified colectomy (median CSS: 24-month) and non-colectomy/NOS (median CSS: 16-month). C. The difference of OS between hepatic surgery (median OS: 39-month) and non-hepatic surgery (median OS: 22-month). D. The difference of CSS between hepatic surgery (median CSS: 42-month) and non-hepatic surgery (median CSS: 24-month). E. The difference of OS between chemotherapy (median OS: 30-month) and non-chemotherapy (median OS: 8-month). F. The difference of CSS between chemotherapy (median CSS: 32-month) and non-chemotherapy (median CSS: 9-month).
Discussion
This study provided a significant contribution through the use of a large cohort of patients with SCLLM who were treated in the U.S. from 2010 to 2016 to construct nomograms predicting OS and CSS, which were capable of providing individualized estimates of potential survival benefit and can aid individualized management decisions for SCLLM. Other scoring systems, including various clinicopathological factors, have been developed to evaluate survival for SCLLM [9], however, the limitations of such risk scoring systems included a lack of reproducibility when applied at other institutions [10]. The SEER database, with cancer incidence and survival data from population-based cancer registries covering approximately 34.6% of the population from U.S. [11], provides available, authentic and reliable data, which can make up for limitations regarding perfect reproducibility. Meanwhile, the comprehensive nomograms with an absolute net benefit advantage over any single prognostic factor in DCA curves provided excellent value for clinical practice. Moreover, the superior accuracy, sensitivity and specificity of nomograms predicting OS and CSS were able to ensure effectiveness in clinical practice.
Chemotherapy is recommended for all CRC patients with synchronous metastatic diseases. The nomograms demonstrated the ginormous risk in SCLLM patients without chemotherapy, which was similar in the survival curves. However, an optimal chemotherapy regimen remains controversial, along with the order of surgery and chemotherapy. Regrettably, this study failed to explore further due to limitations of the SEER database. Moreover, several researches suggested that surgical resection should not be performed unless all known tumors can be completely removed (R0 resection), because incomplete resection or debulking (R1/R2 resection) did not provide survival beneficial for CRC patients with metastatic diseases [12, 13]. Did patients with SCLLM really not get any survival beneficial from the separate primary resection? The multivariable Cox regression analyses believed that surgical resection for the primary tumor could be used as an independent predictor. Moreover, the proportion of primary resections was significantly higher than that of hepatic surgery in our study. We then delineated the survival curves to definitely compare the difference among non-colectomy, standard and simplified colectomy in patients without hepatic surgery (Figure S1). All the evidences indicated that SCLLM patients could receive survival benefit from the separate resection for a primary tumor. Results from one study also suggested that there may be some benefit in both OS and PFS from resection of the primary in the setting of unresectable colorectal metastases [14]. Separate analyses of the National Cancer Data Base also identified a survival benefit of primary tumor resection in this setting [15]. More importantly, colectomy with RNE ≥12 provided a longer OS and CSS than one without, reminding surgeons that lymph node dissection cannot be ignored in colorectal cancer with synchronous liver-limited metastasis.
Age was also an important prognostic factor in this study. Increasing age was accompanied by an elevated risk score, especially in patients over 70-year-old. Marital status was also able to affect the OS and CSS of patients with SCLLM. Single persons suffered the greatest risk, but persons with a stable marriage status owned the lowest risk. It may be that the company of a significant other is supportive. In addition, the different survival among ethnic groups should also be given attention.
A growing body of data indicated that primary tumor location can be a prognostic factor in metastasis colorectal cancer [16-18], which was consistent with the nomograms in this study. Increasing research reported multitudinous differences between right and left colon cancer, involving embryonic origin, molecular genetics, pathological type as well as demographic characteristics such as gender and age [19-23]. Moreover, cetuximab and panitumumab, as monoclonal antibodies directed against EGFR, confer little benefit to patients with metastatic colorectal cancer if the primary tumor originated on the right side [16-18]. Therefore, some scholars suggested that primary tumor sidedness is a surrogate for the non-random distribution of molecular subtypes across the colorectum and, enables a better biologic understanding of the observed difference in response to EGFR inhibitors [6].
The roles of pathological grade, histological type and CEA in the nomograms were in line with our notions. However, T and N stages were not completely consistent with our knowledge. The nomograms reminded that SCLLM patients with early T stage should be given more attention because the risk score of T1 was even more than that of T2-3. Additionally, patients with negative regional lymph nodes, but positive tumor deposits (TD) in specific site were divided into a N1c stage [6], that obtained an equal or even a lower risk score comparing with N1a. Therefore, it is worth considering whether the risk degree of TD needs to be redefined in the TNM stage system for patients with synchronous metastases. Moreover, PNI was included as a high-risk factor for systemic recurrence [6], but did not affect the survival of patients with metastasis.
Currently, there are different definitions of synchronous metastasis for colorectal cancer [24-26]. Although some definitions include metastases detected up to 6 months following diagnosis [25, 26], most include detection at or before diagnosis or surgery of the primary tumor [24]. Moreover, Adam R, et al. also believed that synchronous metastasis for colorectal cancer should be defined as synchronously detected [27]. There are still some shortcomings in this study: (1) further validation is necessary due to the typical limits of a retrospective study; (2) some important information is missing in the SEER database, such as Ras and B-raf; and (3) a lack of detailed data precluded an ability to compare the pros and cons of chemotherapy regimens. However, the excellent clinical value should not be masked by these shortcomings.
Conclusion
Our research investigated a national cohort of almost 10000 patients to create and verify nomograms based on pathological, therapeutic and demographic features to predict OS and CSS for SCLLM. The nomograms may act as an excellent tool to integrate clinical characteristics to guide the therapeutic choice for SCLLM patients.
Supplementary Material
Supplementary figure S1.
Acknowledgements
The first author, Yuqiang Li, gratefully acknowledges financial support from China Scholarship Council.
Data availability statement
These data were derived from the Surveillance, Epidemiology and End Results (SEER) database (https://seer.cancer.gov/) and identified using the SEER*Stat software (Version 8.3.5) (https://seer.cancer.gov/seerstat/).
Ethics approval
Approval from the ethical board for this study was not required because of the public nature of all the data.
Informed consent
Patients' informed consent was waived because of the retrospective nature of the study design.
Authors' contributions
Yuqiang Li, Fengbo Tan and Haiping Pei conceived and designed the study. Yuqiang Li and Wenxue Liu wrote the article. Lilan Zhao downloaded and screened the data from SEER database. All authors participated in analyzing the data. All authors read and approved the final manuscript.
Funding
Contract grant sponsor: The Nature Scientific Foundation of China; Contract grant number: 81702956.
Competing Interests
The authors have declared that no competing interest exists.
References
1. Bray F, Ferlay J, Soerjomataram I, Siegel RL, Torre LA, Jemal A. Global cancer statistics 2018: GLOBOCAN estimates of incidence and mortality worldwide for 36 cancers in 185 countries. CA: a cancer journal for clinicians. 2018;68:394-424
2. Muratore A, Zorzi D, Bouzari H, Amisano M, Massucco P, Sperti E. et al. Asymptomatic colorectal cancer with un-resectable liver metastases: immediate colorectal resection or up-front systemic chemotherapy? Annals of surgical oncology. 2007;14:766-70
3. Hayashi M, Inoue Y, Komeda K, Shimizu T, Asakuma M, Hirokawa F. et al. Clinicopathological analysis of recurrence patterns and prognostic factors for survival after hepatectomy for colorectal liver metastasis. BMC surgery. 2010;10:27
4. Foster JH. Treatment of metastatic disease of the liver: a skeptic's view. Seminars in liver disease. 1984;4:170-9
5. Kemeny N. Management of liver metastases from colorectal cancer. Oncology (Williston Park, NY). 2006;20:1161-76 79; discussion 79-80, 85-6
6. Clinical Practice Guidelines in Oncology (NCCN Guidelines®). Colon Cancer. Version 2. 2020
7. Li C, Pei Q, Zhu H, Tan F, Zhou Z, Zhou Y. et al. Survival nomograms for stage III colorectal cancer. Medicine. 2018;97:e13239
8. Camp L. R. X-Tile: A New Bio-Informatics Tool for Biomarker Assessment and Outcome-Based Cut-Point Optimization. Clinical Cancer Research. 10: 7252-9.
9. Rehman AH, Jones RP, Poston G. Prognostic and predictive markers in liver limited stage IV colorectal cancer. European journal of surgical oncology: the journal of the European Society of Surgical Oncology and the British Association of Surgical Oncology. 2019;45:2251-6
10. Zakaria S, Donohue JH, Que FG, Farnell MB, Schleck CD, Ilstrup DM. et al. Hepatic resection for colorectal metastases: value for risk scoring systems? Annals of surgery. 2007;246:183-91
11. Li Y, Zhao L, Güngör C, Tan F, Zhou Z, Li C. et al. The main contributor to the upswing of survival in locally advanced colorectal cancer: an analysis of the SEER database. Therapeutic advances in gastroenterology. 2019;12:1756284819862154
12. Yoo PS, Lopez-Soler RI, Longo WE, Cha CH. Liver resection for metastatic colorectal cancer in the age of neoadjuvant chemotherapy and bevacizumab. Clinical colorectal cancer. 2006;6:202-7
13. Altendorf-Hofmann A, Scheele J. A critical review of the major indicators of prognosis after resection of hepatic metastases from colorectal carcinoma. Surgical oncology clinics of North America. 2003;12:165-92 xi
14. Faron M, Pignon JP, Malka D, Bourredjem A, Douillard JY, Adenis A. et al. Is primary tumour resection associated with survival improvement in patients with colorectal cancer and unresectable synchronous metastases? A pooled analysis of individual data from four randomised trials. European journal of cancer. 2015;51:166-76
15. Gulack BC, Nussbaum DP, Keenan JE, Ganapathi AM, Sun Z, Worni M. et al. Surgical Resection of the Primary Tumor in Stage IV Colorectal Cancer Without Metastasectomy is Associated With Improved Overall Survival Compared With Chemotherapy/Radiation Therapy Alone. Diseases of the colon and rectum. 2016;59:299-305
16. Brule SY, Jonker DJ, Karapetis CS, O'Callaghan CJ, Moore MJ, Wong R. et al. Location of colon cancer (right-sided versus left-sided) as a prognostic factor and a predictor of benefit from cetuximab in NCIC CO.17. European journal of cancer. 2015;51:1405-14
17. Moretto R, Cremolini C, Rossini D, Pietrantonio F, Battaglin F, Mennitto A. et al. Location of Primary Tumor and Benefit From Anti-Epidermal Growth Factor Receptor Monoclonal Antibodies in Patients With RAS and BRAF Wild-Type Metastatic Colorectal Cancer. The oncologist. 2016;21:988-94
18. Loupakis F, Yang D, Yau L, Feng S, Cremolini C, Zhang W. et al. Primary tumor location as a prognostic factor in metastatic colorectal cancer. Journal of the National Cancer Institute. 2015 107
19. Pei H, Huang L, Liu L, Zhu H, Zeng L, Xiao Z. Experimental study of HSP27 differential expression in left sided colon cancer and right sided colon cancer. Zhong nan da xue xue bao Yi xue ban = Journal of Central South University Medical sciences. 2011;36:277-85
20. Bufill JA. Colorectal cancer: evidence for distinct genetic categories based on proximal or distal tumor location. Annals of internal medicine. 1990;113:779-88
21. Weiss JM, Pfau PR, O'Connor ES, King J, LoConte N, Kennedy G. et al. Mortality by stage for right- versus left-sided colon cancer: analysis of surveillance, epidemiology, and end results-Medicare data. Journal of clinical oncology: official journal of the American Society of Clinical Oncology. 2011;29:4401-9
22. Pritchard CC, Grady WM. Colorectal cancer molecular biology moves into clinical practice. Gut. 2011;60:116-29
23. Markowitz SD, Bertagnolli MM. Molecular origins of cancer: Molecular basis of colorectal cancer. The New England journal of medicine. 2009;361:2449-60
24. Yin Z, Liu C, Chen Y, Bai Y, Shang C, Yin R. et al. Timing of hepatectomy in resectable synchronous colorectal liver metastases (SCRLM): Simultaneous or delayed? Hepatology (Baltimore, Md). 2013;57:2346-57
25. Mekenkamp LJ, Koopman M, Teerenstra S, van Krieken JH, Mol L, Nagtegaal ID. et al. Clinicopathological features and outcome in advanced colorectal cancer patients with synchronous vs metachronous metastases. British journal of cancer. 2010;103:159-64
26. Siriwardena AK, Mason JM, Mullamitha S, Hancock HC, Jegatheeswaran S. Management of colorectal cancer presenting with synchronous liver metastases. Nature reviews Clinical oncology. 2014;11:446-59
27. Adam R, de Gramont A, Figueras J, Kokudo N, Kunstlinger F, Loyer E. et al. Managing synchronous liver metastases from colorectal cancer: a multidisciplinary international consensus. Cancer treatment reviews. 2015;41:729-41
Author contact
![]() Corresponding authors: Haiping Pei, Department of Gastrointestinal Surgery, Xiangya Hospital, Central South University, 87 Xiangya Road, Changsha, Hunan, P.R. China; E-mail: peihaiping1966com; Fengbo Tan, Department of Gastrointestinal Surgery, Xiangya Hospital, Central South University, 87 Xiangya Road, Changsha, Hunan, P.R. China; E-mail: fengbotancom.
Corresponding authors: Haiping Pei, Department of Gastrointestinal Surgery, Xiangya Hospital, Central South University, 87 Xiangya Road, Changsha, Hunan, P.R. China; E-mail: peihaiping1966com; Fengbo Tan, Department of Gastrointestinal Surgery, Xiangya Hospital, Central South University, 87 Xiangya Road, Changsha, Hunan, P.R. China; E-mail: fengbotancom.