Impact Factor ISSN: 1837-9664

 Global reach, higher impact
J Cancer 2021; 12(2):438-450. doi:10.7150/jca.48433 This issue Cite
Research Paper
Whole-exome Sequencing of Prostate Cancer in Sardinian Identify Recurrent UDP-glucuronosyltransferase Amplifications
Tiansheng Zeng1,2, Maria Antonietta Fedeli3, Francesco Tanda3, Yuyong Wang4, Dongsheng Yang1, Bei Xue1, Lisha Jia1, Giuseppe Palmieri5, Leonardo A Sechi2 ![]() , David J. Kelvin1,3,6,7
, David J. Kelvin1,3,6,7 ![]()
1. Division of Immunology, International Institute of Infection and Immunity, Shantou University Medical College, Shantou Guangdong, China.
2. Department of Biomedical Sciences, University of Sassari, Sassari, Italy.
3. Department of Scienze Mediche Chirurgiche e Sperimentali, first affiliated Hospital of 33445Sassari University.
4. Department of Urology, affiliated Hangzhou First People's Hospital, Zhejiang University School of Medicine, China.
5. Institute of Genetic and Biomedical Research (IRGB), Head, National Research Council (CNR), 07100 Sassari, Italy.
6. Department of Microbiology and Immunology, Dalhousie University, Halifax, Nova Scotia, Canada B3H 4R2.
7. Canadian Center for Vaccinology, IWK, Halifax, Nova Scotia, Canada.
Received 2020-5-20; Accepted 2020-10-25; Published 2021-1-1
Abstract
Globally, prostate cancer is the third most common cancer in the world, and the second most common cancer in men. However, rates for incidence and mortality vary considerably with race, ethnicity, and geography. Over 97 significantly mutated genes that have been identified in prostate cancer; however, a lack of genomic prostate cancer studies focusing on different racial and ethnic groups and racial mixing pose a serious challenge to universalize these findings. The Sardinian population is an isolated Mediterranean population that has a high frequency of centenarians and a much lower incidence of prostate cancer than found in males in mainland Europe. Here, we conducted a genomic prostate cancer study on a Sardinian cohort diagnosed with local prostate cancer. Our data reveals a low rate of ERG fusion in Sardinian prostate cancer. Interestingly, we identified a novel BTBD7-SLC2A5 fusion that occurred in 13% of the patients. We also found that the UGT2B4 on 4q13.2 was amplified in 20% of the Sardinian patients but rarely amplified in patients of other population. These observations underscore the importance of the inter-population molecular heterogeneity of prostate cancer. In addition, we examined the expression of UGT2B4 in 497 prostate cancer patients derived from The Cancer Genome Atlas database. We found that high expression of UGT2B4 was associated with low-grade prostate cancer and upregulation of UGT2B4 in tumors was associated with upregulation of metabolism pathways such as 'de novo' IMP biosynthetic process, glutamine and monocarboxylic acid metabolism. These data provide insight into clinical relevance and functional mechanism of UGT2B4. Further understanding functional mechanism of UGT2B4 amplification and BTBD7-SLC2A5 fusion will aid in developing drugs to benefit the prostate cancer patients.
Keywords: UDP glucuronosyltransferase, BTBD7-SLC2A5 fusion, prostate cancer, Sardinian, whole exome sequencing
Introduction
Globally, prostate cancer is the third most common cancer in the world, and the second most common cancer in men [1]. Prostate cancer rates for incidence and mortality vary considerably with race, ethnicity, and geography [2]. However, other factors such as socioeconomic status and access to health care create differences in the diagnosis, treatment, and survival of prostate cancer patients. Intriguingly, genetic factors are a likely major cause for differences in the molecular basis, incidence, and mortality of prostate cancer [3-7].
Genome-wide association studies have identified over 100 low penetrance germline genomic loci associated with prostate cancer risk. These low penetrance loci may account for about 30% of the risk [8, 9]. Germline variants of genes with high penetrance mutations for prostate cancer susceptibility, including HOXB13, BRCA1/2, and DNA mismatch repair genes, account for about another 5% of prostate cancer risk [10, 11]. Somatic mutations in prostate cancer-driver genes play a significant role in tumorigenesis and development, and mutations in over 97 genes have been identified that act as cancer driver genes, including mutations for TMPRSS2-ERG, TP53, and PTEN [12]. Somatic and germline mutations are under investigation as both therapeutic targets and biomarkers of risk and outcome [12-14]. A lack of genomic prostate cancer studies focusing on different racial and ethnic groups and racial mixing poses a serious challenge to a comprehensive understanding of genetic risk, diagnosis, and treatment of prostate cancer patients [15]. Additionally, few studies have focused on isolated regional populations. Sardinia is an island in the western Mediterranean Sea, with the European mainland to the north and North Africa to the south. The population of Sardinia has long been a focus of genetic and genomic studies on ageing and autoimmunity as there is a high incidence of centenarians as well as Type I diabetes and multiple sclerosis [16-20]. However, the incidence of prostate cancer in Sardinia (44/100,000) appears to be lower than that in mainland Europe (approximately 100/100,000 in North Europe) [2, 21]. Furthermore, Chiang et al. demonstrated that the Sardinian population is an isolated Mediterranean population, with the evolutionary divergence from the European mainland population taking place some 143.3±1.3 generations (about 4,300 years ago) [22]. In this study, we performed whole exome sequencing on tumor and tumor-adjacent tissues from 30 local prostate cancer patients in Sardinia to investigate the effects of genetic factors on prostate cancer in the Sardinian population.
Materials and Methods
Sardinian patients and samples
This research was approved by the Ethical Committee of the Sassari AOU. Our study included 30 patients who diagnosis as prostate cancer and received surgery in 2010. Patients with localized prostate cancer that had prostate resection before ADT treatment were inclusion in this study. Patients with metastatic disease or received ADT treatment before tumor resection were exclusive. Most patients had levels of PSA <10 ng/ml and Gleason scores ≤7 (low risk, 23 out of 30 patients). Six patients had PSA levels between 10 ng/mg and 20 ng/ml and Gleason scores ≤7 (intermediate risk, 6 out of 30), and one patient had a Gleason score of 9 (high risk, 1 out of 30). The age distribution of the patients ranged from 54 to 74. In these patients, twenty were 60~69 years old, four were 53 to 59 years old, and six were 70 to 74 years old. Survival records showed that one patient died within one year after diagnosis, while another four patients deceased 5 years after diagnosis. All patients had prostate resection before ADT treatment. Clinical information is summarized in Table 1.
Clinical parameters of 30 prostate cancer patients
| Clinical parameters | Number of Patients |
|---|---|
| Gleason Score | |
| 3+3 | 6 |
| 3+4 | 13 |
| 4+3 | 9 |
| 4+3 | 1 |
| 4+3+5 | 1 |
| PSA | |
| 1~4 | 4 |
| 4~10 | 20 |
| 10~20 | 6 |
| Age | |
| 53~59 | 4 |
| 60~69 | 20 |
| 70~74 | 6 |
| Risk Stratification | |
| low risk | 23 |
| intermediate risk | 6 |
| high risk | 1 |
| Survival | |
| dead within 5 years | 1 |
| dead after 5 years | 5 |
| alive | 24 |
| ADT Treatment Naive | 30 |
Tissue was obtained from tumor resections from patients who received radical prostatectomy and were formalin-fixed paraffin-embedded and stained with hematoxylin and eosin. All the Formalin-fixed paraffin-embedded tissue (FFPET) were obtained from the Pathology Section of the Department of Experimental Medicine of the University of Sassari (Sassari, Sardinia, Italy). Paraffin blocks were marked boundaries between tumor lesions and corresponding tumor adjacent tissues and then cut into two sections based on boundaries. In principle, the tumor lesions were engaged into sequencing as tumor tissue, the corresponding tumor adjacent tissues were sequenced as controls.
The Cancer Genome Atlas (TCGA) patients
From the Cancer Genome Atlas (TCGA) database (https://cancergenome.nih.gov/), a total of 497 primary prostate cancer patients with gene expression profiles were identified and used in this study. Clinical characteristics at time of diagnosis, including PSA levels, Gleason score, and clinical stage were described. Disease-free survival (DFS) was the primary end point of this study. DFS was defined as the time from diagnosis to the first event, including biochemical recurrence, death, on the last follow-up. Between-group comparisons of DFS were performed by the Kaplan-Meier method and the log-rank test. Gene differential expression of TCGA pan-cancer was performed by TIMER DiffExp module [23].
DNA and RNA extraction
DNA was extracted from 250 ul of whole peripheral blood by QIAamp DNA Blood Mini Kit with a total amount of 10-50 ug. The QIAGEN GeneRead DNA FFPE Kit, which enables purification of high-quality genomic DNA and removes artificial C>T mutations, was used to extract DNA from the formalin-fixed paraffin-embedded tissue (FFPET). RNA extraction from FFPET was performed using a QIAGEN RNeasy FFPE Kit that was specifically designed for purifying total RNA from formalin-fixed, paraffin-embedded tissue sections. All the above procedures were performed following the manufacturer's protocols. The concentration and quality of the extracted DNA and RNA were determined by Qubit3.0 and Agilent 2100. The qualified DNA that with the fragment size more than 800 bp was engaged into the next library step. RNA was reversed transcript to cDNA for ETS fusion detection.
ERG fusion detection by polymerase chain reaction (PCR)
ERG fusion detections were performed by polymerase chain reaction PCR. cDNA was generated using SuperScript IV One-Step RT-PCR System (Applied Biosystems TM, USA). PCR was performed with the primers F: GCTCCTATCACGCCCACCCA and R: TCCTTCCCCAGCCCCAGTAAA to estimate the expression of the ERG gene. As contrast, the expression of the housekeeping gene glyceraldehyde-3-phosphate dehydrogenase were detected with primers F: TGCACCACCAACTGCTTAGC, R: GGCATGGACTGTGGTCATGAG. Samples with ERG expression were selected to determine if any samples contained any of the known 5 types of breakpoints for TMPRSS2-ERG fusions. The primers for detection of each breakpoint are listed in Supplementary Table S1.
Whole exome sequencing library preparation
100-200 ng DNA per sample was used for library construction using the KAPA Hyper-Plus Kit. Enzymatic fragmentation was performed according to the manufacturer's instructions. Fragments sized 180-220 bp before adapter ligation were selected for capture using the Roche Seq-Cap EZ Med-Exome system resulting in a total capture of 67Mb. Libraries were analyzed for size distribution by Agilent 2100 Bioanalyzer and quantified by real-time PCR. The qualified libraries were sequenced by the Illumina X-ten platform with 8 samples per lane.
Sequence data quality control
The original fluorescence image files obtained from the X-ten platform were transformed to short reads (raw data) by base calling and the short reads were saved in FASTQ format, containing sequence information and corresponding sequencing quality information. Reads were filtered as follows: 1) Discard paired reads if either one read contained adapter contamination (>10 nucleotides aligned to the adapter, allowing ≤ 10% mismatches); 2) Discard paired reads if more than 10% of bases were uncertain in either one read; 3) Discard paired reads if the proportion of low quality (Phred quality <5) bases was over 50% in either one read. All the downstream bioinformatic analyses were performed on high-quality clean data.
Read mapping and processing
Sequencing data was mapped to the reference human genome (UCSC hg19) by Burrows-Wheeler Aligner (BWA) software to get the original mapping results in BAM format [24]. Then SAMtools, Picard, and GATK tool kits were used to sort BAM files and duplicate marking, local realignment, and base quality recalibration to generate a final BAM file for somatic and germline SNVs and indels calling [25, 26].
Somatic SNP and INDEL calling and annotation
Somatic SNVs were identified by GATK muTect1. Somatic indels were identified by Pindel based on paired bam files that were generated from paired tumor and tumor-adjacent tissues [27]. The minimal depth for high confidence SNVs was set as 10, while a depth of 20 was set for indels. Based on high sensitivity of the Pindel algorithm and the possible damage of DNA due to historical FFPETs (>5 years), single nucleotide deletions were removed from the final results. Annotation of the somatic SNVs and indels was by performed using Oncotator [28]. The annotated MAF files were used for downstream analysis.
Fusion calling, filtering, ORF prediction, and visualization
Fusion event calling from raw read files of tumor-adjacent tissues and tumor lesions was performed using FusionMap [29] which was designed to detect and align fusion junction-spanning reads to the genome directly [29]. Fusions were filtered out if 1) seed reads were ≤3 or were listed in the in-family analysis or found in a paralog gene list; 2) fusions were associated with uncharacterized genes, immunoglobin genes, mitochondrial genes or repeat regions; and 3) fusions were reported in normal samples. High confidence fusions were input into FusionHub to search for reported fusions and predict the fusion effects.
Copy number variation calling, filtering, and driver copy number variation identification
Control-FREEC was used to detect CNV with paired pileup files that were generated from unsorted bam files [30]. High confidence somatic CNVs were identified with a p-value less than 0.01 for both Wilcoxon and the Kolmogorov-Smirnov tests. They were next annotated by ANNOVAR [31]. Intergenic regions were then removed. Copy number variation reoccurring analysis was performed using GISTIC2.0 [32].
Sardinian prostate cancer driver copy number variations already present in OncoKB33 (https://www.oncokb.org) annotated alterations were classified as “putative copy number variations”. Classification of Sardinian “candidate driver copy number variations” was based on curation in OncoKB onco-gene (amplification) or in OncoKB tumor suppressor gene (loss).
Functional enrichment and protein-protein interaction network analysis
GO, KEGG, and Reactome pathway enrichment analyses of a given gene set were performed by metascape [34]. Protein-protein interaction network of a given gene set was obtained from InWeb_IM [35] and visualized by Cytoscape [36].
Identification of novel driver
Candidate prostate cancer driver analysis with the whole exome data of 30 patients with tumor adjacent and tumor samples were conducted by OncodriverCluster [37] then annotated with MutationAssessor [38], SIFT [39], Polyphen2 [40], and FATHMM [41]. Mutations that showed significance in OncodriverCluster analysis (p value <0.01) and annotated as damage mutations by at least three of the four methods MutationAssessor, SIFT, Polyphen2, and FATHMM were retained. The remaining mutations were mapped to OncoKB database [33] (www.oncokb.org/cancerAlterations). Mutations that have not been recorded as putative drivers in Oncokb database were retained as novel driver candidates.
Results
Genomic landscape of Sardinian prostate cancer
Whole exome sequencing was conducted in tumor and matched tumor-adjacent FFPETs sections from 30 Sardinian prostate cancer patients. Sequencing coverage of tumor tissues was 39-176, with the median of 67. The sequencing coverage of histologically normal tissue adjacent to tumor tissue was 30-156, and the median was 58. The fraction of copy number alterations genome across 30 Sardinian local prostate cancer samples was 0.107~0.00001 with the median at 0.009. Patient 309 had the highest fraction of copy number variations and Patient 163 had the lowest (Figure 1A). The number of nonsynonymous mutations of each of the 30 Sardinian local prostate cancer patients was 7-103, with a median of 28 mutations per patient. Patient 202 had the most somatic nonsynonymous mutations and patient 301 had the lowest number of mutations (Figure 1B).
Genomic landscape of Sardinian prostate cancer. A) Fraction of genomic copy number alterations in 30 Sardinian local prostate cancers determined by whole exome sequencing of paired tumor and tumor-adjacent tissue. Amplifications are highlighted by red; deep deletions are highlighted by blue. The highest fraction of altered genome was observed in patient 309, at 0.107. Patient 163 had the lowest fraction of altered genome at 0.00001. The median was 0.009. B) Number of somatic nonsynonymous mutations in 30 Sardinian local prostate cancer samples determined by whole exome sequencing of paired tumor and tumor-adjacent tissues. Truncating mutations are highlighted in black; missense mutations are highlighted in green; the in-frame indels are highlighted in brown. Patient 202 had the highest number of somatic non-synonymous mutations, 103. Patient 301 had the lowest number of non-synonymous mutations, 7. The median is 28 non-synonymous mutations per patient. C) Oncoplot of comprehensive molecular profiling of 30 Sardinian local prostate cancer samples were obtained by whole exome sequencing of paired tumor and tumor-adjacent tissues. Each red bar represents a patient with amplification of the specified gene on the left. Each blue bar represents a patient with deep deletion of the specified gene. Each green dot represents a patient with a putative missense mutation; black dot represents a patient with putative truncating mutation; purple dot represents a patient with fusion of the specified gene. UGT2B4 was amplified in 20% of the tumors and the novel BTBD7-SLC2A5 fusion was observed in 13% of the tumors. Recurrent alterations of putative drivers in prostate cancer, such as ERG, NKX3-1 PTEN, SPOP, FOXA1, were also observed in Sardinian patients with local prostate cancer. Patient 202 had the largest number of somatic putative mutations and patient 406 had the largest number of tumor suppression genes deleted.
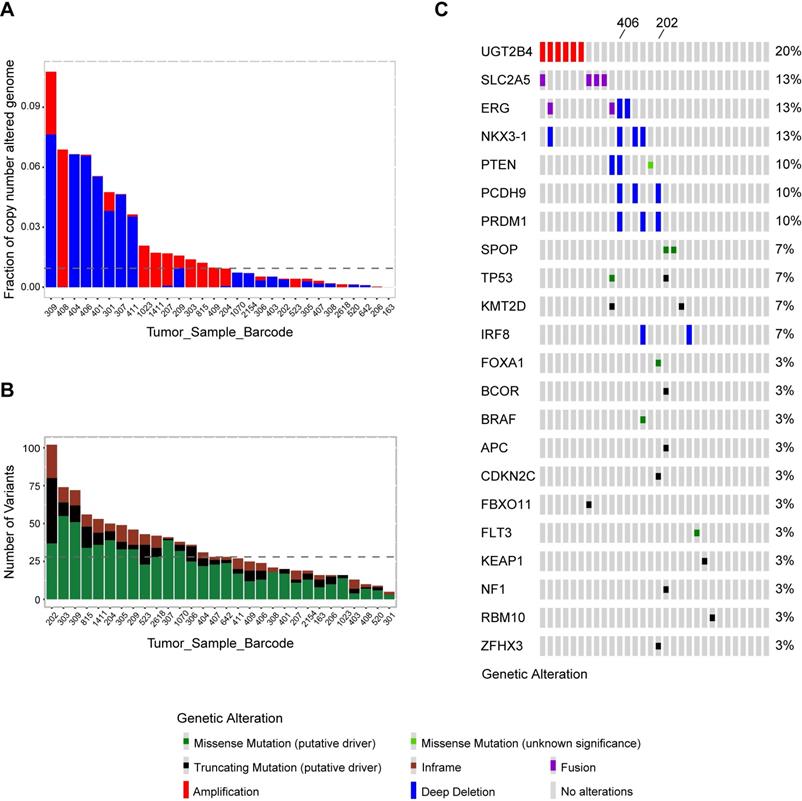
Comprehensive molecular profiling including somatic mutations, copy number variations, and fusion events were characterized by whole exome sequencing data for 30 Sardinian local prostate cancer patients. Our data showed that frequently observed oncogenic drivers in prostate cancer tumors found in previous studies [13, 42], such as mutations in SPOP, KMT2D, TP53, BRAF, FLT3, APC, BCOR, CDKN2C, FBXO11, KEAP1, FBXO11, NF1, RBM10 and ZFHX3, were also observed in Sardinian prostate cancer tumors (Figure 1C). Most of the oncogenic drivers were observed only once, with the exception of mutations in SPOP, KMT2D and TP53, which were observed twice (Figure 1C). As well, frequently observed deletions of tumor suppression genes, such as NKX3-1, PTEN, PCDH9, PRDM1 and IRF8, were also observed in Sardinian prostate cancer patients (Figure 1C). To define the frequency of TMPRSS2-ERG fusions, a PCR-based method was employed. We examined 19 tumor samples from Sardinian patients in which RNA was available (historical FFPET samples) for possible TMPRSS2-ERG fusions. Of the 19 samples, two samples were TMPRSS2-ERG fusion positive (11%). In addition to the prostate cancer genomic signatures noted above, we found that the 4q13.2 UDP glucuronosyltransferase family was amplified in 20% of Sardinian prostate cancers. We also observed that novel fusions between the fructose transporter gene SLC2A5 and BTBD7 (Broad-Complex, Tramtrack and Bric a brac domain containing 7), occurred in 13% of the Sardinian patients (Figure 1C).
Identification of 4q13.2 UDP glucuronosyltransferase family amplification in Sardinian prostate cancers
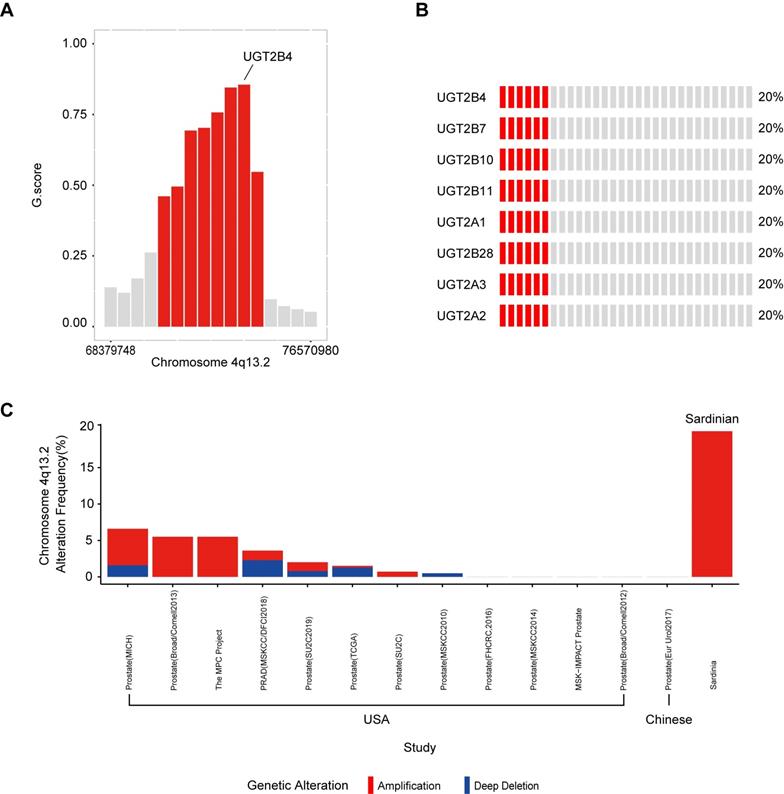
To determine significantly amplified or deleted chromosome regions in our Sardinian prostate cancer samples, the GISTIC algorithm was used to calculate the G-score, which determines the amplitude and the frequency of copy number variations (Supplementary Figure S1). The results showed that a region in chromosome 4q13.2 which contains multiple UDP glucuronosyltransferase family genes was amplified in 20% of Sardinian prostate cancers and the amplified peak was centered on UGT2B4. The other UGT family member amplifications included UGT2B7, UGT2B10, UGT2B11, UGT2A1, UGT2A2, UGT2B28, and UGT2A3 (Figure 2B and Figure 2C). The UGT family amplification we observed in Sardinian prostate cancers has only rarely been observed in 13 other prostate landscape studies [6, 12, 13, 42-46]. The UGT family was amplified in 0-5.5% of prostate cancer patients in cohorts from the USA [13, 42-46] and no amplifications were observed in a cohort of Chinese patients [6] (Figure 2C). We have made comparison between Sardinian patients and these 13 prostate cancer genomic studies of other race and ethnics. The UGT family amplification we observed significantly with higher rate in Sardinia prostate cancers comparing to prostate cancer in 10 prostate landscape studies as PRAD (MSKCC/DFCI2018), Prostate (SU2C2019), Prostate (TCGA), Prostate (SU2C), Prostate (MSKCC2010), Prostate (FHCRC,2016), Prostate (MSKCC2014), MSK-IMPACT Prostate, Prostate (Broad/Comell2012), Prostate (Eur Urol2017) (fisher test, p value <0.001). These studies were based on primary or metastatic prostate cancer. The details listed in Supplementary Table S2.
Amplification of UGT family genes in 4q13.2. A) The G-score was calculated using GISTIC algorithm. Chromosome 4q13.2 amplification (red) with FDR ≤0.01 was plotted. UGT2B4 was located in the peak of the 4q13.2 amplification region. The other red bars are UGT2B10, UGT2A3, UGT2B7, UGT2B11, UGT2B28, UGT2A1/UGT2A2. B) Oncoplot of amplifications of genes in Chromosome 4q13.2 across 30 Sardinian prostate cancer patients. Each red bar represents a patient with an amplification of the specified gene on the left. Gray bars represent patients without amplification. 20% of the Sardinian patients showed UGT family amplifications of 8 UGT genes found within the UGT2 locus.
Identification of BTBD7-SLC2A5 fusions in Sardinian prostate cancers
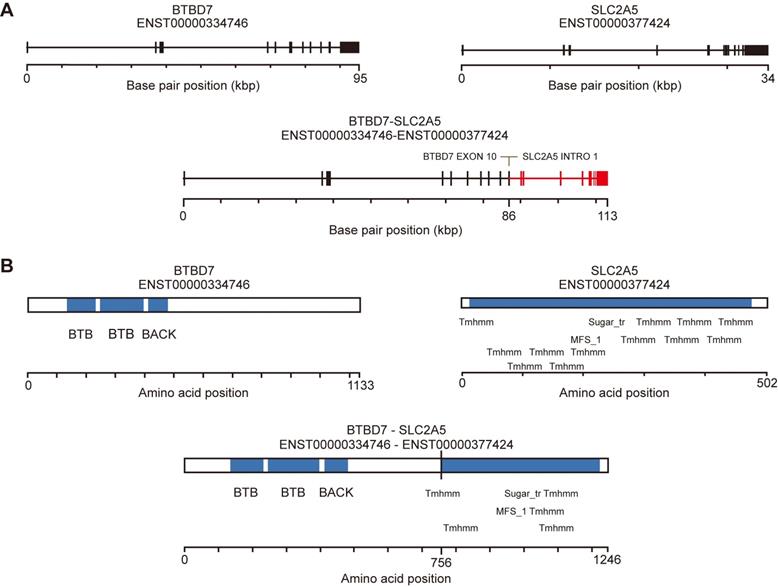
To identify fusion events from the whole exome data, we used FusionMap [29] to measure the junction-spanning reads from the raw reads of Sardinian prostate cancer tumor samples and tumor-adjacent samples. We identified 15, 12, 15, and 12 reads from tumor samples 306, 409, 206 and 815, in which at least 25 nts mapped in the genes for both BTBD7 and SLC2A5 (Table 2). No split reads were found in the tumor-adjacent tissues. The unique cutting positions of the seed reads in the four tumor samples were 5, 6, 14, and 10 respectively. It is expected that a real fusion would have more than one unique cutting position (Table 2). The breakpoints were identified within exon 10 of the BTBD7 gene and intron 1 of the SLC2A5 gene (Figure 3A). We used the fusion hub to predict the transcript and protein of the BTBD7-SLC2A5 fusion gene. The predicted protein contains the entire transmembrane domain and fructose transport domain of SLC2A5 and the BTB domain (Broad-Complex, Tramtrack and Bric a brac domain) of BTBD7 (Figure 3B).
Identification of BTBD7-SLC2A5 fusion events in Whole exome sequnceing through junction-spanning reads
| SampleName | FusionGene | Chr 1 | Position 1 | Strand 1 | Chr 2 | Position 2 | Strand 2 | SplitRead | RescuedSplitRead | UniqueCuttingPosition |
|---|---|---|---|---|---|---|---|---|---|---|
| 306 | BTBD7-SLC2A5 | 14 | 93712486 | - | 1 | 9121449 | + | 15 | 0 | 5 |
| 409 | BTBD7-SLC2A5 | 14 | 93712486 | - | 1 | 9121449 | + | 12 | 2 | 6 |
| 206 | BTBD7-SLC2A5 | 14 | 93712486 | - | 1 | 9121449 | + | 15 | 2 | 14 |
| 815 | BTBD7-SLC2A5 | 14 | 93712486 | - | 1 | 9121449 | + | 12 | 1 | 10 |
SplitRead: count of seed reads which at least 25nt mapped in both BTBD7 and SLC2A5;
RescuedSplitRead: count of rescued reads which at least 15nt mapped in either BTBD7 or SLC2A5;
UniqueCuttingPosition: it expected that a real fusion would have more than one unique cutting position.
Novel fusion BTBD7-SLC2A5 identification. A) Line schematic of exon-intron structure of the BTBD7 and SLC2A5 genes, and the BTBD7-SLC2A5 gene fusion. All of the BTBD7-SLC2A5 fusions identified in the four patients had the same breakpoints (See Table 2 for details). The breakpoints were within exon 10 of the BTBD4 and intron 1 of SLC2A5. B) Predicted transcript and protein of the BTBD7-SLC2A5 fusion determined by Fusion hub. The predicted protein contained the entire transmembrane domain and fructose transporter domain of SLC2A5 and the BTB domain of BTBD7.
Identification of 9 novel somatic mutation driver candidates in Sardinian prostate cancers
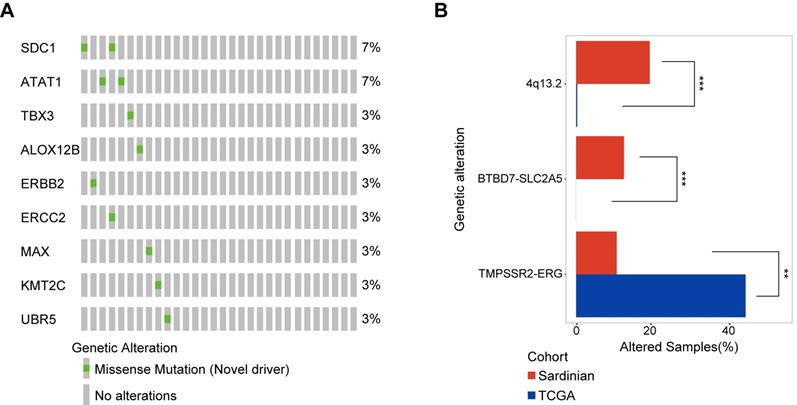
To identify novel somatic mutation candidate drivers in Sardinian prostate cancers, we firstly used OncodriverCluster [37] to predict the candidate prostate cancer mutation driver with the whole exome data of 30 patients with tumor adjacent and tumor samples. Mutations that showed significance in OncodriverCluster analysis (p value <0.01) and annotated as damage mutations by at least three of the four methods: MutationAssessor [38], SIFT [39], Polyphen2 [40], and FATHMM [41], and have not been recorded as putative drivers in Oncokb database (www.oncokb.org) were retained. Nine novel candidate drivers were identified in prostate cancer of Sardinia, including mutations in the SDC1 protein (R277S) and the ATAT1 protein (D19V) observed in two of the samples for each protein (Figure 4A). The other mutations were observed only in one sample each (Figure 4A). Six of the 9 mutations have known 3D structures. They include, the ALOX12B protein (R422W, Supplementary Figure S2A), the ATAT1 protein (D19V mutation, Supplementary Figure S2B), the ERBB2 Receptor L domain harboring (C53R mutation, Supplementary Figure S2C), the ERCC2 protein (R497C mutation, Supplementary Figure S2D), the MAX protein (D87N mutation, Supplementary Figure S2E), and the TBX3 T-box domain (V202D mutation, Supplementary Figure S2F).
Novel candidate driver mutations in Sardinian prostate cancer and differentially mutated genes. A) The frequency of nine novel somatic mutations identified using OncoDriveCluster and MutationAssessor, SIFT, Polyphen2, and FATHMM are shown for each patient. The SDC1 protein with the mutation R277S, and the ATAT1 protein with the mutation D19V mutation, were observed in two patients respectively. All of the remaining mutations were observed only in a single patient each. Six of the 9 mutations have known 3D structures. B) Differentially mutated genes between Sardinian and The Cancer Genome Atlas prostate cancer cohorts (two side fisher test, p value < 0.05).
Differentially mutated genes between Sardinian patients and The Cancer Genome Atlas prostate cancer cohort
We conducted a systematic comparison of our cohort of 30 Sardinian cancer prostate patients and 497 The Cancer Genome Atlas prostate cancers [42] to identify differentially mutated genes. Three differentially mutated genes were observed between our Sardinian cohort in this study and The Cancer Genome Atlas prostate cancer cohort (p<0.01 Fisher's exact test). ERG fusion was significantly less frequently altered in Sardinian prostate cancer (p<0.001 Fisher's exact test). Chromosome 4q13.2 amplification and BTBD7-SLC2A5 fusion were significantly more frequently altered in our Sardinian cohort (p<0.001 Fisher's exact test) (Figure 4B).
Clinical relevance and functional mechanism of UGT2B4 expression in prostate cancer
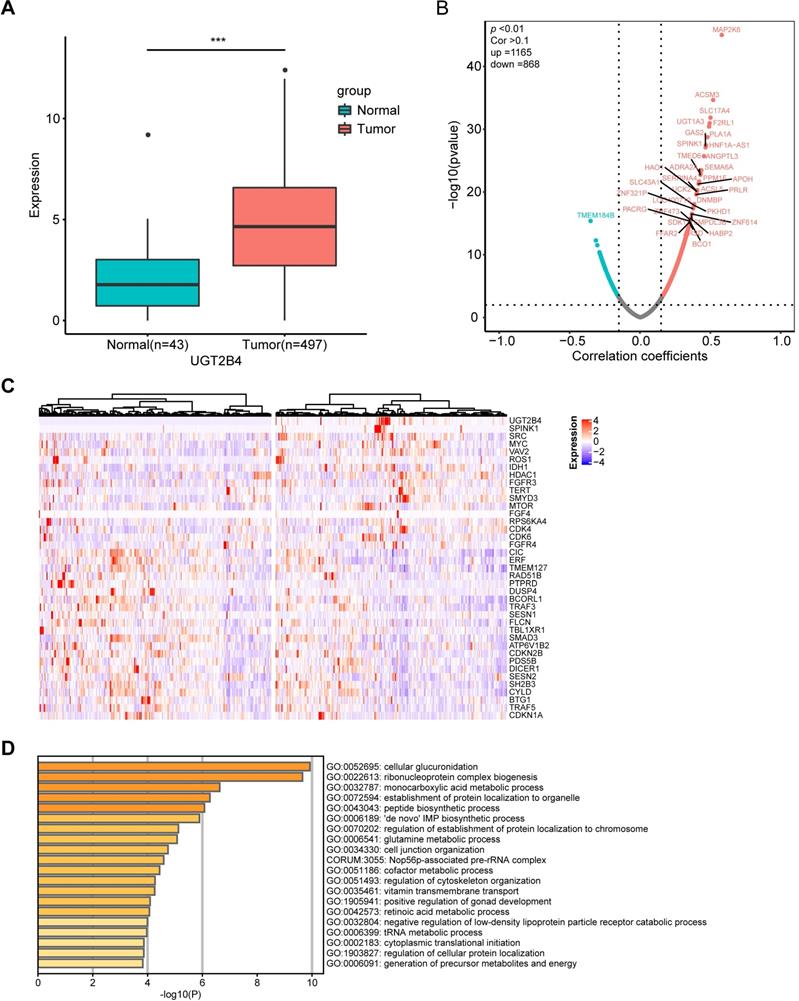
UGT2B4 was identified as the peak of amplification in the UGT family in our present study. To examine the functional mechanism of UGT2B4 expression in prostate cancer, we investigated the expression data of a pan-cancer study from TCGA. Our analysis showed that the expression level of UGT2B4 in breast cancer tumors was significantly lower than that in normal tissues, while UGT2B4 was significantly higher in tumors than in normal prostate cancer tissues (Figure 5A and Supplementary Figure S3).
Clinical and functional relevance of UGT2B4 expression in prostate cancer. A) Expression of UGT2B4 was determined in 43 normal tissue (green bar) and 497 prostate cancers (red bar) from The Cancer Genome Atlas database. UGT2B4 was found to be significantly upregulated (p<0.001) in localized prostate tumors compared with tumor-adjacent normal tissue. B) Spearman rank correlation analysis was performed on expression profiles of tumor tissues of 497 TCGA localized prostate cancer patients and UGT2B4. 1165 genes were positively co-expressed with UGT2B4 and 868 genes were negatively co-expressed with UGT2B4 i. (Spearman correlation >0.1, p<0.01). C) Thirty-seven curated oncogenes and tumor suppressor genes were correlated with UGT2B4 in the spearman rank correlation analysis. Heatmap of hierarchal clustering of patients based on expression of UGT2B4 and 37 UGT2B4 co-expressed oncogenes and tumor suppressor genes was described using a function Heatmap in ComplexHeatmap R package. Patients were split by median expression of UGT2B4 before hierarchal clustering. There was a cluster of prostate cancer patients with high expression of UGT2B4, SPINK1, and SRC. D) Functional enrichment including GO Biological Processes, KEGG, and Reactome pathways (http://www.metascape.com/) reveals that genes co-expressed with UGT2B4 in the Spearman correlation analysis were functionally enriched in ribonucleoprotein complex biogenesis, as well as glutamine, nucleotide, and monocarboxylic acid metabolic pathways.
To examine the clinical relevance of UGT2B4 in prostate cancer, we downloaded gene expression profiles and clinical profiles of 497 tumors from primary prostate cancer patients in The Cancer Genome Atlas (TCGA) database. All patients were divided into UGT2B4-high and UGT2B4-low groups by the median UGT2B4 expression level of the cohort (Supplementary Figure S4A). Kaplan-Meier analysis demonstrated that patients with high UGT2B4 expressers had longer disease-free survival than patients with low expressers (p<0.05, (Supplementary Figure S4B). In addition, UGT2B4 high expressers are significantly associated with low Gleason scores (64% of patients with Gleason 6-7 in UGT2B4-high group, 54% of patients with Gleason 6-7 in UGT2B4-low group, p<0.05 Fisher's exact test).
Further to examine the potential functional mechanism of UGT2B4 in prostate cancer, we performed the spearman correlation analysis of UGT2B4 in the expression data of the 497 prostate cancer patients from TCGA (Figure 5B). We found that the expression of UGT2B4 was positively associated with expression of multiple well-known oncogenes such as SPINK1, IDH1, MYC, and SRC and negatively associated with expression of well-known tumor suppressors such as CIC and ERF. (Figure 5C) Functional enrichment analysis reveals that UGT2B4 co-expression genes enriched in tumor metabolic pathways such as 'de novo' IMP biosynthetic process, glutamine and monocarboxylic acid metabolic (Figure 5D). Protein interaction network of UGT2B4 co-expressed genes showed that UGT2B4 positive co-expression genes that broadly interact with SRC and MYC (Supplementary Figure S5).
Discussion
Emerging evidence indicates that there are remarkable disparities in prostate cancer epidemiology as well as in the molecular landscape among different population groups of European, North American, African, and Asian origin [2, 15]. For example, ETS fusion affects ~50% of prostate cancer cases of Caucasian men, but only 10-30% of prostate cancer cases of African American and Eastern Asian [47-49] patients. As well, less common homozygous loss of PTEN but more common ERF [3] and LASMP alterations were observed in tumors from African American patients than tumors from Caucasian patients [50]. Our data informs genomic disparities in prostate cancer between the Sardinian population and other ethnic groups. Compared to TCGA prostate cancer cohort, the Sardinian prostate cancer cohort had a lower rate of ERG fusion but a higher rate of UDP-glucuronosyltransferase family amplification on chromosome 4q13.2 (Figure 1C and Figure 4B). In addition, a novel BTBD7-SLC2A5 fusion have been identified and occurred in 13% of the Sardinian patients (Figure 1C and Figure 4B). These observations underscore the importance of the inter-population molecular heterogeneity of prostate cancer.
UDP glucuronosyltransferase family genes catalyze the addition of the hydrophilic moiety, glucuronide, to acceptor molecules in a process called glucuronidation [51-53]. In humans there are two major classes of UDP glucuronosyltransferase, UGT1 and UGT2, each of which contains multiple genes on chromosome 2 and 4, respectively. Within the UGT2 genes, UGT2B15 and UGT2B17 have been broadly investigated in prostate cancer because of their ability to inactive DHT and testosterone. It have been reported that their overexpression was associated with increased risk of biochemical recurrence [54, 55]. Consistent with those findings, we have observed from the data in The Cancer Genome Atlas prostate cancer that patients with high expression of UGT2B15 have increased risk of biochemical recurrence (Supplementary Figure S6). However, the UGT2 family contains multiple genes and different UGT2 genes may play different roles in tumors. In Sardinian prostate cancers we observed an amplification in chromosome 4q13.2 which contains the UGT2 genes, UGT2B4, UGT2B7, UGT2B10, UGT2B11, UGT2A1, UGT2A2, UGT2B28, and UGT2A3 (Figure 2A&B). UGT2B4 was identified as the location of the peak of amplification (Figure 2A). Interestingly, UGT2B4 is noticeable for its ability in the clearance of estrogens [56]. It was reported that polymorphisms of UGT2B4 have been associated with increased breast cancer risk [57]. To examine the impact of UGT2B4 expression in prostate cancer, we investigated the expression data of pan-cancer study from TCGA. Our analysis showed that the expression level of UGT2B4 in tumors of breast cancer was significantly lower than normal tissues (Supplementary Figure S3) while UGT2B4 was significantly higher in tumors than normal tissues of prostate cancer (Figure 5A). Furthermore, we found that high expression of UGT2B4 was associated with low-grade prostate cancer and favorable disease-free survival (Supplementary Figure S4). As well, we found that high expression of UGT2B4 was associated with upregulated tumor metabolic pathways such as 'de novo' IMP biosynthetic process, glutamine and monocarboxylic acid metabolism (Figure 5D). These data suggest that the UGT family may have different roles in cancer development or progression depending on the type of cancer, stage of disease, and type of mutation.
In addition, we did find a novel fusion event, BTBD7-SLC2A5, in 13% of the Sardinian patients, whose breakpoints were within an exon region (Figure 3A) and potentially translate a novel functional protein that contains the entire transmembrane domain and fructose transport domain of SLC2A5 and the BTB domain (Broad-Complex, Tramtrack and Bric a brac domain) of BTBD7 (Figure 3B). BTB/POZ domain-containing protein 7 (BTBD7) BTBD7 regulates the dynamics of cell adhesion and motility during epithelial branching morphogenesis [58], and has been reported to be associated with various cancers [59-61]. SLC2A5 is a fructose transporter and has been reported to be associated with various cancers as well [62-64]. Lung cancers with mutations in SLC2A5 promote lung adenocarcinoma cell growth and metastasis by enhancing fructose utilization [63]. BTBD7-SLC2A5 may be involved in unregulated cell adhesion, motility and epithelial morphogenesis due to loss of exons 10 and 11 of BTBD7, or be involved in shifting of energy metabolism to enhance tumor growth due to containing entire transmembrane domain and fructose transport domain of SLC2A5. However, further investigated in the future is needed to determine the importance of this fusion.
Overall, genetic alterations in Sardinian prostate cancer tumors that were identified in our study inform the importance of the inter-population molecular heterogeneity of prostate cancer. Furthermore, understanding their functional mechanism will aid in developing drugs to benefit the prostate cancer patients.
Conclusion
Our data reveals a low rate of ERG fusion in Sardinian prostate cancer. Interestingly, we identified a novel BTBD7-SLC2A5 fusion that occurred in 13% of the patients and we also found that the UGT2B4 on 4q13.2 was amplified in 20% of the patients. These observations underscore the importance of the inter-population molecular heterogeneity of prostate cancer. In addition, our analysis provides insight into clinical relevance and functional mechanism of UGT2B4 expression in prostate cancer. Further understanding their functional mechanism of action will aid in developing drugs to benefit the prostate cancer patients.
Supplementary Material
Supplementary figures and tables.
Acknowledgements
We are grateful to Dr Nikki Kelvin for editing this manuscript and technician Guihong Pan for library construction. As well, we thank the administrative staff, Jiachun Liu and Wenlin Zeng, for providing help during the project. We would like to acknowledge Drs Marco Bo and Dr. Sepiedh Hosseini for helpful discussions. Whole exon data of this project has been deposited in the National Center for Biotechnology Information (NCBI), under study accession number: PRJNA546032.
Data and material accession numbers
All data are available in NCBI, under study accession number: PRJNA546032.
Author contributions
- David J Kelvin and Leonardo Antonio Sechi had full access to all the data in the study and take responsibility for the integrity of the data and the accuracy of the data analysis;
- Study concept and design: David J Kelvin, Leonardo Antonio Sechi, Francesco Tanda, and Tiansheng Zeng;
- Acquisition of data: Tiansheng Zeng, Maria Antonietta Fedeli, and Francesco Tanda;
- Analysis and interpretation of data: Tiansheng Zeng, Dongsheng Yang, Yuyong Wang (clinical data), David Kelvin, and Leonardo Antonio;
- Drafting of the manuscript: Tiansheng Zeng, David Kelvin, and Leonardo Antonio Sechi;
- Statistical analysis: Tiansheng, Zeng;
- Administrative, technical, or material support: Tiansheng Zeng, Maria Antonietta Fedeli, Giuseppe Palmieri, Xue Bei, and Lisha Jia, and;
- Supervision: David J Kelvin and Leonardo Antonio Sechi.
Financial disclosures
Funding support was provided by Li Ka-Shing Foundation (DJK) and International Institute of Infection and Immunity, Shantou University Medical College (DJK) and Dalhousie Medical Research Foundation (DJK); DJK is the recipient of the Tier I Canada Research Chair in Translational Vaccinology and Inflammation.
Support was also received by the University of Sassari and the Regione Autonoma di Sardegna to LAS.
Funding/Support and role of the sponsor
The funders had no role in study design, data collection and analysis, decision to publish, or preparation of the manuscript.
Competing Interests
The authors have declared that no competing interest exists.
References
1. Bray F, Ferlay J, Soerjomataram I. et al. Global cancer statistics 2018: GLOBOCAN estimates of incidence and mortality worldwide for 36 cancers in 185 countries. CA Cancer J Clin. 2018;68(6):394-424
2. Taitt HE. Global Trends and Prostate Cancer: A Review of Incidence, Detection, and Mortality as Influenced by Race, Ethnicity, and Geographic Location. Am J Mens Health. 2018;12(6):1807-1823
3. Khani F, Mosquera JM, Park K. et al. Evidence for molecular differences in prostate cancer between African American and Caucasian men. Clin Cancer Res. 2014;20(8):4925-4934
4. Huang FW, Mosquera JM, Garofalo A. et al. Exome Sequencing of African-American Prostate Cancer Reveals Loss-of-Function ERF Mutations. Cancer Discov. 2017;7(9):973-983
5. Lindquist KJ, Paris PL, Hoffmann TJ. et al. Mutational Landscape of Aggressive Prostate Tumors in African American Men. Cancer Res. 2016;76(7):1860-1868
6. Ren S, Wei GH, Liu D. et al. Whole-genome and Transcriptome Sequencing of Prostate Cancer Identify New Genetic Alterations Driving Disease Progression. Eur Urol. 2018;73(3):322-339
7. Cheng I, Witte JS, McClure LA. et al. Socioeconomic status and prostate cancer incidence and mortality rates among the diverse population of California. Cancer Causes & Control. 2009;20(8):1431-1440
8. Al Olama AA, Dadaev T, Hazelett DJ. et al. Multiple novel prostate cancer susceptibility signals identified by fine-mapping of known risk loci among Europeans. Human Molecular Genetics. 2015;24(19):5589-5602
9. Schumacher FR, Al Olama AA, Berndt SI. et al. Association analyses of more than 140,000 men identify 63 new prostate cancer susceptibility loci. Nat Genet. 2018;50(7):928-936
10. Carter BS, Beaty TH, Steinberg GD. et al. MENDELIAN INHERITANCE OF FAMILIAL PROSTATE-CANCER. Proceedings of the National Academy of Sciences of the United States of America. 1992;89(9):3367-3371
11. Pritchard CC, Mateo J, Walsh MF. et al. Inherited DNA-Repair Gene Mutations in Men with Metastatic Prostate Cancer. New England Journal of Medicine. 2016;375(5):443-453
12. Armenia J, Wankowicz SAM, Liu D. et al. The long tail of oncogenic drivers in prostate cancer. Nat Genet. 2018;50(5):645-651
13. Abeshouse A, Ahn J, Akbani R. et al. The Molecular Taxonomy of Primary Prostate Cancer. Cell. 2015;163(4):1011-1025
14. Beltran H, Antonarakis ES, Morris MJ. et al. Emerging Molecular Biomarkers in Advanced Prostate Cancer: Translation to the Clinic. American Society of Clinical Oncology educational book American Society of Clinical Oncology Annual Meeting. 2016;35:131-141
15. Tan SH, Petrovics G, Srivastava S. Prostate Cancer Genomics: Recent Advances and the Prevailing Underrepresentation from Racial and Ethnic Minorities. Int J Mol Sci. 2018;19(4):1255
16. Deiana L, Ferrucci L, Pes GM. et al. AKEntAnnos. The Sardinia Study of Extreme Longevity. Aging (Milano). 1999;11(3):142-149
17. Caselli G, Pozzi L, Vaupel JW. et al. Family clustering in Sardinian longevity: a genealogical approach. Exp Gerontol. 2006;41(8):727-736
18. Wu L, Zeng T, Zinellu A. et al. A Cross-Sectional Study of Compositional and Functional Profiles of Gut Microbiota in Sardinian Centenarians. mSystems. 2019;4(4):e00325-19
19. Rosati G. The prevalence of multiple sclerosis in the world: an update. Neurological Sciences. 2001;22(2):117-139
20. Incani M, Serafini C, Satta C. et al. High prevalence of diabetes-specific autoimmunity in first-degree relatives of Sardinian patients with type 1 diabetes. Diabetes Metab Res Rev. 2017;33(3):e2864
21. Budroni M, Sechi O, Cossu A. et al. Estimates of cancer burden in Sardinia. Tumori. 2013;99(3):408-415
22. Chiang CWK, Marcus JH, Sidore C. et al. Genomic history of the Sardinian population. Nat Genet. 2018;50(10):1426-1434
23. Li T, Fan J, Wang B. et al. TIMER: A Web Server for Comprehensive Analysis of Tumor-Infiltrating Immune Cells. Cancer Res. 2017;77(21):e108-e110
24. Li H, Durbin R. Fast and accurate short read alignment with Burrows-Wheeler transform. Bioinformatics. 2009;25(14):1754-1760
25. Li H, Handsaker B, Wysoker A. et al. The Sequence Alignment/Map format and SAMtools. Bioinformatics. 2009;25(16):2078-2079
26. McKenna A, Hanna M, Banks E. et al. The Genome Analysis Toolkit: a MapReduce framework for analyzing next-generation DNA sequencing data. Genome Res. 2010;20(9):1297-1303
27. Ye K, Schulz MH, Long Q. et al. Pindel: a pattern growth approach to detect break points of large deletions and medium sized insertions from paired-end short reads. Bioinformatics. 2009;25(21):2865-2871
28. Ramos AH, Lichtenstein L, Gupta M. et al. Oncotator: cancer variant annotation tool. Hum Mutat. 2015;36(4):E2423-2429
29. Ge H, Liu K, Juan T. et al. FusionMap: detecting fusion genes from next-generation sequencing data at base-pair resolution. Bioinformatics. 2011;27(14):1922-1928
30. Boeva V, Popova T, Bleakley K. et al. Control-FREEC: a tool for assessing copy number and allelic content using next-generation sequencing data. Bioinformatics. 2012;28(3):423-425
31. Wang K, Li M, Hakonarson H. ANNOVAR: functional annotation of genetic variants from high-throughput sequencing data. Nucleic Acids Res. 2010;38(16):e164
32. Mermel CH, Schumacher SE, Hill B. et al. GISTIC2.0 facilitates sensitive and confident localization of the targets of focal somatic copy-number alteration in human cancers. Genome Biol. 2011;12(4):R41
33. Chakravarty D, Gao J, Phillips SM. et al. OncoKB: A Precision Oncology Knowledge Base. JCO Precis Oncol. 2017. 2017 [Epub ahead of print]
34. Zhou Y, Zhou B, Pache L. et al. Metascape provides a biologist-oriented resource for the analysis of systems-level datasets. Nat Commun. 2019;10:1523
35. Li T, Wernersson R, Hansen RB. et al. A scored human protein-protein interaction network to catalyze genomic interpretation. Nat Methods. 2017;14(1):61-64
36. Shannon P, Markiel A, Ozier O. et al. Cytoscape: A software environment for integrated models of biomolecular interaction networks. Genome Research. 2003;13(11):2498-2504
37. Tamborero D, Gonzalez-Perez A, Lopez-Bigas N. OncodriveCLUST: exploiting the positional clustering of somatic mutations to identify cancer genes. Bioinformatics. 2013;29(18):2238-2244
38. Reva B, Antipin Y, Sander C. Predicting the functional impact of protein mutations: application to cancer genomics. Nucleic Acids Res. 2011;39(17):E118-U85
39. Ng PC, Henikoff S. SIFT: Predicting amino acid changes that affect protein function. Nucleic Acids Res. 2003;31:3812-3814
40. Adzhubei I, Jordan DM, Sunyaev SR. Predicting functional effect of human missense mutations using PolyPhen-2. Curr Protoc Hum Genet. 2013 Chapter 7: Unit7 20
41. Rogers MF, Shihab HA, Mort M. et al. FATHMM-XF: accurate prediction of pathogenic point mutations via extended features. Bioinformatics. 2018;34(3):511-513
42. Armenia J, Wankowicz SAM, Liu D. et al. The long tail of oncogenic drivers in prostate cancer. Nature Genetics. 2018;50(5):645-651
43. Taylor BS, Schultz N, Hieronymus H. et al. Integrative Genomic Profiling of Human Prostate Cancer. Cancer Cell. 2010;18(1):11-22
44. Grasso CS, Wu YM, Robinson DR. et al. The mutational landscape of lethal castration-resistant prostate cancer. Nature. 2012;487(7406):239-243
45. Hieronymus H, Schultz N, Gopalan A. et al. Copy number alteration burden predicts prostate cancer relapse. Proc Natl Acad Sci U S A. 2014;111(30):11139-11144
46. Fraser M, Sabelnykova VY, Yamaguchi TN. et al. Genomic hallmarks of localized, non-indolent prostate cancer. Nature. 2017;541(7637):359-364
47. Tomlins SA, Rhodes DR, Perner S. et al. Recurrent fusion of TMPRSS2 and ETS transcription factor genes in prostate cancer. Science. 2005;310(5748):644-648
48. Magi-Galluzzi C, Tsusuki T, Elson P. et al. TMPRSS2-ERG Gene Fusion Prevalence and Class Are Significantly Different in Prostate Cancer of Caucasian, African-American and Japanese Patients. Prostate. 2011;71(5):489-497
49. Zhou CK, Young D. et al. TMPRSS2:ERG Gene Fusions in Prostate Cancer of West African Men and a Meta-Analysis of Racial Differences. Am J Epidemiol. 2017;186(12):1352-1361
50. Petrovics G, Li H, Stuempel T. et al. A novel genomic alteration of LSAMP associates with aggressive prostate cancer in African American men. Ebiomedicine. 2015;2(12):1957-1964
51. Rowland A, Miners JO, Mackenzie PI. The UDP-glucuronosyltransferases: their role in drug metabolism and detoxification. Int J Biochem Cell Biol. 2013;45(6):1121-1132
52. Dutton GJ. Developmental aspects of drug conjugation, with special reference to glucuronidation. Annu Rev Pharmacol Toxicol. 1978;18:17-35
53. Grant DJ, Chen Z, Howard LE. et al. UDP-glucuronosyltransferases and biochemical recurrence in prostate cancer progression. BMC Cancer. 2017;17:463
54. Li H, Xie N, Chen R. et al. UGT2B17 Expedites Progression of Castration-Resistant Prostate Cancers by Promoting Ligand-Independent AR Signaling. Cancer Research. 2016;76(22):6701-6711
55. Paquet S, Fazli L, Grosse L. et al. Differential Expression of the Androgen-Conjugating UGT2B15 and UGT2B17 Enzymes in Prostate Tumor Cells during Cancer Progression. Journal of Clinical Endocrinology & Metabolism. 2012;97(3):E428-E432
56. Barre L, Fournel-Gigleux S, Finel M. et al. Substrate specificity of the human UDP-glucuronosyltransferase UGT2B4 and UGT2B7 - Identification of a critical aromatic amino acid residue at position 33. Febs Journal. 2007;274(5):1256-1264
57. Sun C, Huo D, Southard C. et al. A signature of balancing selection in the region upstream to the human UGT2B4 gene and implications for breast cancer risk. Human Genetics. 2011;130(6):767-775
58. Onodera T, Sakai T, Hsu JC. et al. Btbd7 regulates epithelial cell dynamics and branching morphogenesis. Science. 2010;329(5991):562-565
59. Fang LZ, Zhang JQ, Liu L. et al. Silencing of Btbd7 Inhibited Epithelial-Mesenchymal Transition and Chemoresistance in CD133(+) Lung Carcinoma A549 Cells. Oncol Res. 2017;25(5):819-829
60. Grisard E, Coan M, Cesaratto L. et al. Sleeping beauty genetic screen identifies miR-23b::BTBD7 gene interaction as crucial for colorectal cancer metastasis. EBioMedicine. 2019;46:79-93
61. Tao YM, Huang JL, Zeng S. et al. BTB/POZ domain-containing protein 7: epithelial-mesenchymal transition promoter and prognostic biomarker of hepatocellular carcinoma. Hepatology. 2013;57(6):2326-2337
62. Jin X, Liang Y, Liu D. et al. An essential role for GLUT5-mediated fructose utilization in exacerbating the malignancy of clear cell renal cell carcinoma. Cell Biol Toxicol. 2019;35(5):471-483
63. Weng Y, Fan X, Bai Y. et al. SLC2A5 promotes lung adenocarcinoma cell growth and metastasis by enhancing fructose utilization. Cell Death Discov. 2018;4:38
64. Zhao P, Huang J, Zhang D. et al. SLC2A5 overexpression in childhood philadelphia chromosome-positive acute lymphoblastic leukaemia. Br J Haematol. 2018;183(2):242-250
Author contact
![]() Corresponding authors: J. Kelvin, E-mail: david.kelvinca; and Leonardo A. Sechi, E-mail: sechilait. Co-corresponding authors equally contributed to this work.
Corresponding authors: J. Kelvin, E-mail: david.kelvinca; and Leonardo A. Sechi, E-mail: sechilait. Co-corresponding authors equally contributed to this work.