Impact Factor ISSN: 1837-9664

 Global reach, higher impact
J Cancer 2021; 12(4):996-1010. doi:10.7150/jca.51264 This issue Cite
Research Paper
Multiple microarray analyses identify key genes associated with the development of Non-Small Cell Lung Cancer from Chronic Obstructive Pulmonary Disease
Lemeng Zhang, Jianhua Chen, Hua Yang, Changqie Pan, Haitao Li, Yongzhong Luo, Tianli Cheng ![]()
Thoracic Medicine Department 1, Hunan Cancer Hospital, Changsha, Hunan Province, P.R. China, 410013.
Received 2020-7-29; Accepted 2020-11-30; Published 2021-1-1
Abstract
Introduction: Chronic obstructive pulmonary disease (COPD) is an independent risk factor of non-small cell lung cancer (NSCLC). This study aimed to analyze the key genes and potential molecular mechanisms that are involved in the development from COPD to NSCLC.
Methods: Expression profiles of COPD and NSCLC in GSE106899, GSE12472, and GSE12428 were downloaded from the Gene Expression Omnibus (GEO) database, followed by identification of the differentially expressed genes (DEGs) between COPD and NSCLC. Based on the identified DEGs, functional pathway enrichment and lung carcinogenesis-related networks analyses were performed and further visualized with Cytoscape software. Then, principal component analysis (PCA), cluster analysis, and support vector machines (SVM) verified the ability of the top modular genes to distinguish COPD from NSCLC. Additionally, the corrections between these key genes and clinical staging of NSCLC were studied using the UALCAN and HPA websites. Finally, a prognostic risk model was constructed based on multivariate Cox regression analysis. Kaplan-Meier survival curves of the top modular genes on the training and verification sets were generated.
Results: A total of 2350, 1914, and 1850 DEGs were obtained from GSE106899, GSE12472, and GSE12428 datasets, respectively. Following analysis of protein-protein interaction networks, the identified modular gene signatures containing H2AFX, MCM2, MCM3, MCM7, POLD1, and RPA1 were identified as markers for discrimination between COPD and NSCLC. The modular gene signatures were mainly enriched in the processes of DNA replication, cell cycle, mismatch repair, and others. Besides, the expression levels of these genes were significantly higher in NSCLC than in COPD, which was further verified by the immunohistochemistry. In addition, the high expression levels of H2AFX, MCM2, MCM7, and POLD1 correlate with poor prognosis of lung adenocarcinoma (LUAD). The Cox regression prognostic risk model showed the similar results and the predictive ability of this model is independent of other clinical variables.
Conclusions: This study revealed several key modules that closely relate to NSCLC with underlying disease COPD, which provide a deeper understanding of the potential mechanisms underlying the malignant development from COPD to NSCLC. This study provides valuable prognostic factors in high-risk lung cancer patients with COPD.
Keywords: chronic obstructive pulmonary disease, non-small cell lung cancer, differentially expressed genes, module, prognosis
Introduction
The morbidity and mortality of lung cancer remain on the top of malignant diseases worldwide. It has been reported that 2.1 million new lung cancer patients were associated with 1.8 million deaths in 2018, which corresponds almost to 18.4% of cancer related deaths [1]. Non-small cell lung cancer (NSCLC) accounts for about 80% of lung cancers, with the majority of the cases first diagnosed at advanced stages and with 5-year survival rate less than 20% [2].
Chronic obstructive pulmonary disease (COPD) is characterized by emphysema and air-flow limitation of lung [3, 4]. As an independent risk factor for developing lung cancer [5], COPD is a common comorbidity in lung cancer patients, characterized with variable prevalence in different studies from 28% to 40% [6]. Both COPD and lung cancer share common pathogenesis factors, such as tobacco smoking, gene methylation, environmental factors, and chronic inflammation [7]. The long-term airway inflammation of COPD patients possibly leads to the changes of the bronchial epithelium, which initiates carcinogenesis [8]. Sandri et al. identified the gene expression patterns that distinguish COPD cohort in patients with or without lung cancer, suggesting that extracellular matrix (ECM) and PI3K-Akt signaling pathways are potentially involved in the malignant transformation, as these pathways were over-represented in the tumor and adjacent tissue but not in normal tissues [9]. However, diverse studies have yielded diverse results and the global perspective of genomic changes from COPD to lung cancer is still unclear. Thus, this study aimed to identify the specific genetic signatures on the transcriptome level in the COPD-cohort that promote lung cancer.
Based on the high-throughput sequencing and microarray technologies, the expression changes of the genes in different samples under certain biological conditions can be simultaneously observed. Microarray profiling has shown great potential in obtaining and understanding of the molecular mechanisms by analysis of thousands of genes [10, 11]. There are many studies describing the usage of integrated bioinformatics approach of multiple datasets for the identification of reliable and reproducible genetic changes involved in tumorigenesis [12, 13].
Three data sets with a large sample size, including GSE106899 [14], GSE12472 [15], and GSE12428 [16], were analyzed in this study. Due to the complex evolutionary mechanism from COPD to lung cancer, a multi-omic approach was performed to identify gene expression patterns in COPD stroma and NSCLC. Besides, based on the module gene signatures, a prognostic risk model was constructed by using the multivariate Cox regression analysis. This study may provide deeper understanding of the potential mechanisms involved the development of NSCLC from COPD, providing meaningful factors for surveillance of NSCLC in high-risk COPD patients.
Materials and Methods
Retrieval of microarray datasets and the workflow of this study
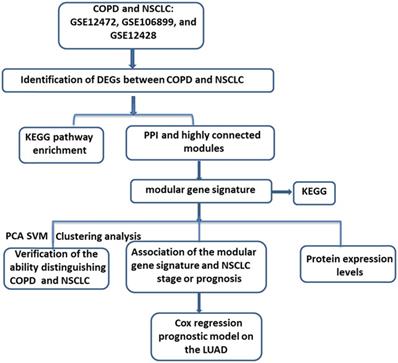
“COPD” and “Lung cancer” were sued as the key words for searching and retrieving the transcriptome profiles of COPD and lung cancer datasets from the NCBI GEO database (http://www.ncbi.nlm.nih.gov/geo/) [17]. Microarray data that met the following criteria were included in the next study: 1) studies contained both COPD and Lung cancer tissues; 2) Homo sapiens origin. After further manual retrieval, three data sets were finally incorporated in our study, GSE12472, GSE106899 and GSE12428. All of the datasets contained both COPD and NSCLC samples. As shown in Figure 1, upon downloading of the expression profiles of these three datasets, the differentially expressed genes (DEGs) between COPD and NSCLC were identified. Then, based on the DEGs in the intersection by Veen analysis, the Kyoto Encyclopedia of Genes and Genomes (KEGG) enrichment analysis and protein-protein interaction (PPI) network were performed. After identification of the modules with higher gene overlap, the shared modular gene signatures were considered to play a significant role in the development from COPD to NSCLC. Subsequently, the ability of the modular gene signatures to distinguish between COPD and NSCLC samples was validated by principal component analysis (PCA), cluster analysis, and support vector machines (SVM) analysis. Finally, based on the multivariate Cox regression analysis, a prognostic risk model for NSCLC was established.
The workflow of the study. COPD, Chronic obstructive pulmonary disease; NSCLC, non-small cell lung cancer; KEGG, Kyoto Encyclopedia of Genes and Genomes; PPI, protein-protein interaction; PCA, principal component analysis; SVM, Support vector machines; LUAD, lung adenocarcinoma.
Data preprocessing
GSE106899 contained 22 COPD samples and 22 NSCLC samples, which were sequenced by the Illumina HiSeq 2000. GSE12472 contained 10 normal samples, 18 COPD samples, and 18 NSCLC samples. Microarray data of GSE12428 included 18 COPD samples and 18 NSCLC samples. All of the microarray data of the GSE12472 and GSE12428 were detected by the Agilent-012391 Whole Human Genome Oligo Microarray G4112A (Feature Number version) platform. All the data were downloaded in August 2019.
For GSE106899, the original count matrix of the genes was first obtained, and then the raw count was normalized using the topological map-matching (TMM) algorithm in the edgeR package (Version: 3.4, http://www.bioconductor.org/packages/release/bioc/html/edgeR.html) [18, 19]. Subsequently, the normalized data was converted to logCPM values for further analysis. For the GSE12472 and GSE12428, the annotation files of the platform were firstly downloaded and followed by matching the probe number and the Gene symbol one by one. The probes that do not match to the Gene symbol were removed. When different probes map to the same gene, the mean values of the different probes were considered as the final expression rate of the gene. Then, the expression matrices of GSE12472 and GSE12428 were obtained.
Identification of the DEGs between COPD and NSCLC
For GSE106899, based on the logCPM values, the DEGs between COPD and COPD with NSCLC were identified by the edgeR package. For GSE12472 and GSE12428, the classical Bayesian method provided by the limma package was used to analyze the DEGs [20] (Version 3.10.3, http://www.bioconductor.org/packages/2.9/bioc/html/limma.html). The Benjamini & Hochberg method was used to perform multiple test calibration on the p.value and logFC values of the above genes to obtain the corrected p value (adj.P.Value). The adj.P.Val<0.05 and |logFC|>0.585 were selected as the threshold for the following analysis.
Veen analysis of the DEGs
The DEGs in the intersections of GSE106899 vs. GSE12428, GSE106899 vs. GSE12472, and GSE12428 vs. GSE12472 were identified for the further analysis. The intersections of any two data sets were used as the training set and the remaining data was used as the verification set.
Pathway enrichment analysis
The KEGG pathway enrichment analysis was performed on the three intersection DEGs using the R-package clusterProfiler (version:3.8.1, http://bioconductor.org/packages/release/bioc/html/clusterProfiler.html) [21, 22]. A path with p.value < 0.05 was considered to be a result with significant enrichment.
Construction of the Protein- Protein Interaction (PPI) Network
Based on the STRING database (Version: 10.0, http://www.string-db.org/), the interactions between gene-encoded proteins can be predicted [23]. For the DEGs in the intersection of GSE106899 vs. GSE12472 and GSE106899 vs. GSE12428, the PPI score was set as 0.4 (medium confidence). Due to the large number of DEGs in the intersection of GSE12472 vs. GSE12428, the PPI score was set to 0.9 (highest confidence) in order to find a more closely interacting protein. Then, the Cytoscape software (version:3.4.0, http://chianti.ucsd.edu/cytoscape-3.4.0/) was used for visualization of the structure of PPI networks [24].
Identification of the modular gene signatures of the PPI networks
In the PPI network, cluster analysis was applied to identify the functional modules. The MCODE plug-in of Cytoscape software with the default parameters (Degree Cutoff = 2, Node Score Cutoff = 0.2, K-core = 2, and Max.Depth = 100) was used for obtaining three key modules with high gene duplication in three PPI networks, respectively [25]. The genes in the intersection of the three modules were considered to be closely related to the pathological process. Then, KEGG pathway enrichment analysis was carried out on the key genes of the module, using the R-package clusterProfiler. The pathway with p value < 0.05 was regarded as a pathway with significant enrichment.
Verification of the identified modular gene signatures for discriminating COPD from NCLSC
For the further evaluation and verification of the key genes in terms of clear distinguishing between COPD and lung cancer samples, principal component analysis (PCA), cluster analysis, and support vector machines (SVM) analysis were performed. For PCA, the prcomp function (https://stat.ethz.ch/R-manual/R-devel/library/stats/html/prcomp.html) was used to reduce the dimension of the data, and the PCA map was constructed by the ggbiplot package (Version: 0.4.5, https://mirrors.tuna.tsinghua.edu.cn/CRAN/bin/windows/contrib/3.4/ggfortify_0.4.5.zip). After PCA analysis, the first two principal components were selected, and the distribution of the sample on the two-dimensional plane was mapped, according to the score of the principal component [26]. The classification of the sample can be visually seen by the PCA graph. Besides, we also performed cluster analysis. For that, the distance between two samples was firstly calculated based on the expression data of key genes in the module. Then, the clust function of R language was used to analyze the samples, based on the distance between samples. Finally, the clustering results were displayed in a tree diagram. In addition, based on the first two principal components obtained by PCA analysis, the SVM classifier was constructed and the performance of the classifier was evaluated by the receiver operating characteristic (ROC) curve. Totally, PCA, cluster analysis, and SVM analyses were performed for each of the three datasets.
Expression levels of the modular gene signatures in the GSE12472 data set
The dataset GSE12472, which contained 10 normal, 18 COPD, and 18 NSCLC samples, was used for the evaluation of expression levels of identified key genes in the normal, COPD, and NSCLC datasets. Firstly, difference analysis was performed for COPD vs. Normal and NSCLC vs. Normal based on the expression matrix of GSE12472. Then, the multiple test calibration of p.value was performed by the BH method to obtain the corrected p-value (adj.P.Value). Based on adj.P.Value <0.05 and |logFC|>0.585, the expression levels of samples were shown in the heat map.
Survival analysis of modular gene signatures in the NSCLC
GEPIA (http://gepia.cancer-pku.cn/) is an online tool for visual analysis based on TCGA data [26]. The identified modular gene signatures were used as the input, and lung squamous cell carcinoma (LUSC) and lung adenocarcinoma (LUAD) were selected to analyze the correlation between key genes and prognosis in lung cancer. The samples were divided into high and low expression groups based on the median value of Transcripts Per Million (TPM) expression of modular gene signatures for Kaplan-Meier survival analysis. At the same time, the logRank test was performed to obtain significant P values. The genes with the P value<0.05 were considered to be associated with prognosis.
Protein expression levels of key genes in lung and lung cancer tissues
Based on the Human Protein Atlas (HPA) database (https://www.proteinatlas.org/), expression of certain proteins in different tissues and organs can be studied at the RNA and protein levels [27]. In this study, the protein levels of the key genes in the lung and lung cancer tissues were investigated based on the HPA database.
Construction of the prognostic risk model based on the Cox regression analysis
Sample clinical phenotypic information, RNA-seq data, and sample survival information for TCGA LUAD were downloaded from UCSC Xene database (https://xenabrowser.net/datapages/) [28]. LUAD samples with both survival and RNA-seq information were selected for the further study. After converting the ensemble IDs into gene symbols, the expression values of modular gene signatures were selected for the further study.
Multivariate Cox regression analysis was performed on the modular gene signatures, and the prognosis risk model was constructed according to the following formula:

where β in the formula is a prognostic correlation coefficient of each gene of multivariate Cox regression, and “expr” is the expression value of the gene. Thus, each sample was characterized by a particular risk score. Then, optimal cut-point was determined based on the survminer of the R package (version 0.4.3). According to the risk score level in regard to the optimal cut-point, the samples were divided into high (High risk) and low risk groups (Low risk). Combined with the data on total survival time of the corresponding patients, the log-rank test was used to perform K-M survival analysis and the survival curve was generated. In addition, the expression levels of the modular gene signatures of samples were shown in the heat map. About 3/4 samples were randomly selected as the training set, and the remaining 1/4 samples were used as the verification set to construct the above model.
Univariate and multivariate Cox regression analysis of clinical features
In order to determine whether the predictive ability of the above prognostic model can be independent of other clinical factors, the risk group, age, gender, age of tobacco smoking, and clinical stage were used as variables, and Univariate and multivariate Cox regression analyses were carried out respectively.
Correlations between modular gene signatures and clinical factors of NSCLC, and the expression levels of modular gene signatures in other cancers
In order to explore whether key genes were associated with clinical pathological staging, their expression levels in different clinical stages of LUSC and LUAD were analyzed by UALCAN. UALCAN (http://ualcan.path.uab.edu/index.html) is a website for effective online analysis of cancer, based on The Cancer Genome Atlas (TCGA) database [29]. We suggested that the above-mentioned identified key genes can be potentially related to lung cancer lesions. Besides, many reports have shown that tobacco smoking was responsible for the majority of lung cancer cases [30, 31]. Therefore, the expression levels of key genes in smokers and non-smokers of LUAD and LUSC were also considered. In this part, the expression levels of key genes were shown in boxplots. In addition, based on TCGA and GEPIA, the expression levels of modular gene signatures in cancer and adjacent tissues of 31 cancers were explored.
Results
Identification of DEGs between COPD and NSCLC
Based on the methods above, total of 2350, 1914, and 1850 DEGs (adj.P.Val<0.05 and |logFC|>0.585) were identified between COPD and NSCLC in GSE106899, GSE12472, and GSE12428, respectively. Compared with tissues from COPD, there were 844 up-and 1506 down-regulated genes in NSCLC samples in GSE106899. For other two datasets, there were 747 up- vs. 1167 down- (GSE12472) and 785 up- vs. 1065 down- (GSE12428) regulated genes.
Functional enrichment based on the DEGs
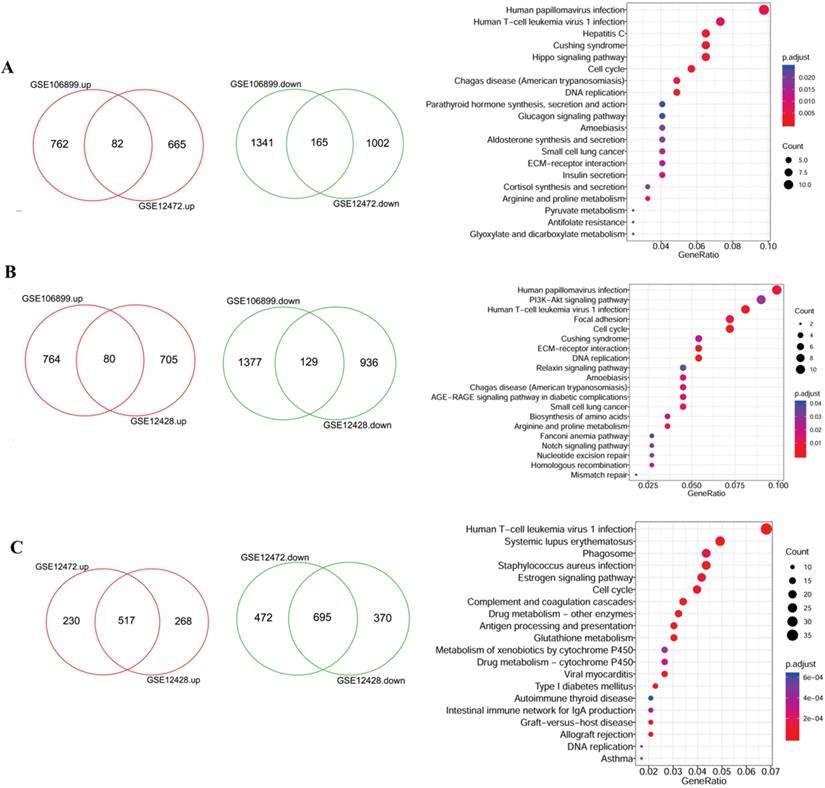
Due to the large number of the DEGs, two datasets were randomly selected for intersection analysis and the identified DEGs were further subjected to functional analysis. As shown in the Figure 2A, there were 82 up- and 165 down- regulated DEGs were shared by GSE106899 and GSE12472, which were mainly enriched in 33 KEGG pathways. Besides, the DEGs in the intersection of GSE106899 and GSE12428 were mainly enriched in 20 KEGG pathways (Figure 2B). For GSE12472 and GSE12428, the shared DEGs (517 up- and 695 down-regulated genes, Figure 2C) were mainly distributed in 63 KEGG pathways, and the top 20 items are shown in the Figure 2C. Among the pathways, the top and shared pathways are Human papillomavirus infection, Human T-cell leukemia virus 1 infection, Cell cycle, DNA replication, and others. The top 20 KEGG pathways are shown in detail in Supplementary Table 1.
The Veen diagrams of DEGs and their enriched KEGG items. The two Veen diagrams on the left show the DEGs between COPD and COPD with lung cancer. The diagrams on the right represent the top 20 enriched KEGG pathways of DEGs. A: the DEGs of intersection of GSE106899 and GSE12472; B: the DEGs of intersection of GSE106899 and GSE12428; C: the DEGs of intersection of GSE12472 and GSE12472. Compared with COPD, the up-regulated genes in COPD lung cancer are represented in red, and the down-regulated genes are shown in green (Veen diagram). For the KEGG pathway diagram (right), GeneRation indicates the ratio of the number of genes enriched within a particular pathway to the number of input genes. Besides, the size of bubble indicates the number of enriched genes, and red gradient reflects the significance of the pathway enrichment.
PPI network and modular gene signatures involved in the NSCLC
Based on the studies of GSE106899 and GSE12472, interaction pairs involving 196 proteins nodes were found, based on the STRING database (Figure 3A). Meanwhile, for the DEGs in the interaction maps of GSE106899 and GSE12428, total of 169 proteins were identified and 444 interaction pairs were predicted (Figure 3B). In addition, 2699 interaction pairs and 616 proteins were obtained from the interaction tests of GSE12472 and GSE12428 (Figure 3C).
PPI networks and KEGG pathways of modular gene signatures. Red indicates up-regulated proteins and green indicates down-regulated proteins. Diamond indicates key module protein and gray line indicates interaction between proteins. A: Based on the interaction of GSE106899 and GSE12472; B: Based on the DEGs in the interaction of GSE106899 and GSE12428; C: Based on the DEGs of interaction of GSE12472 and GSE12428. D: Enriched KEGG pathways of modular gene signatures.
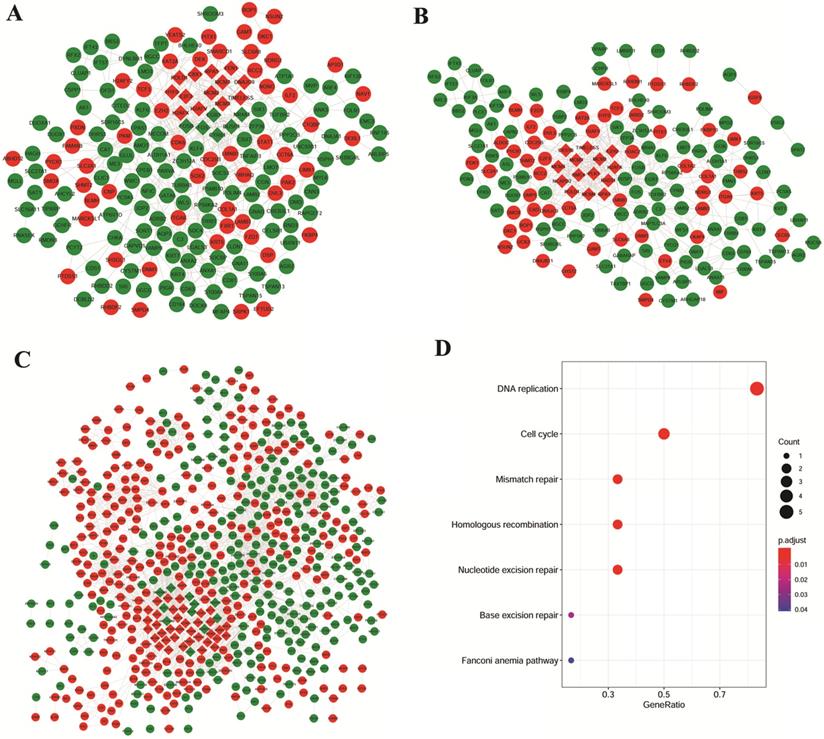
Due to the large number of the protein nodes and intricate network of functions of the PPI networks, we further explored the key modules involved in the COPD with NSCLC. Based on the MCODE plugin of the Cytoscape software with the default value, several modules were obtained (the diamond nodes in Figure 3). By comparing the nodes of these modules, there were 6 shared proteins, namely H2A histone family, member X (H2AFX), mini-chromosome maintenance (MCM) proteins MCM2, MCM3, MCM7, DNA polymerase δ catalytic subunit gene (POLD1), and Replication protein A1 (RPA1). As shown in the Figure 3D, these genes were mainly enriched in the DNA replication, cell cycle, mismatch repair, homologous recombination, and nucleotide excision repair.
Verification of the identified modular gene signatures for discriminating COPD from NCLSC
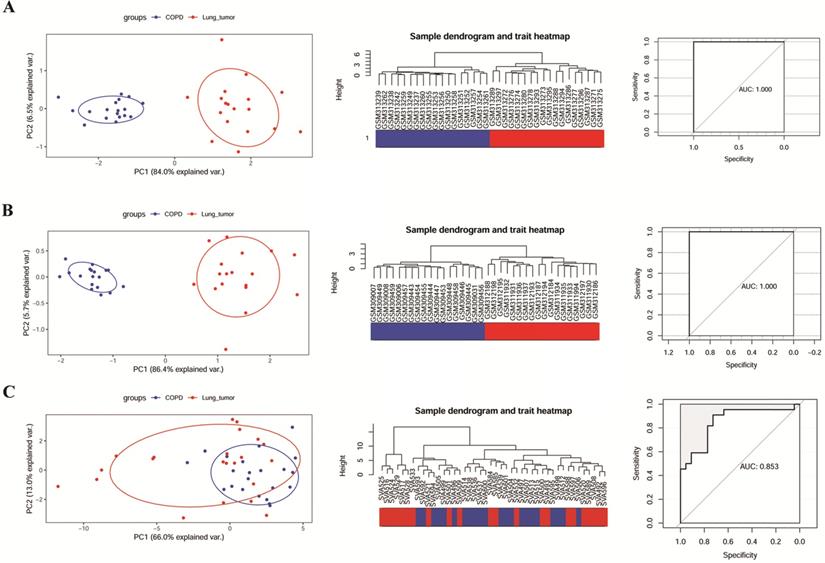
The ability of 6 key genes to distinguish COPD from NCLSC samples was tested in GSE106899, GSE12472, and GSE12428. As shown in the Figure 4A and B, COPD and COPD with LUSC samples in GSE12472 and GSE12428 could be clearly distinguished via these six key genes, applying the area under the curve (AUC) of 1.000 in the ROC curves. However, these six genes did not completely distinguish between COPD and COPD with LUAD samples in GSE106899 (Figure 4C), with the AUC of 0.853 in the ROC curve.
The ability of modular gene signatures to distinguish COPD from NSCLC samples. A: GSE12472; B: GSE12428; C: GSE106899. The left diagrams are PCA ordination diagrams. The middle diagrams are clustering trees. The right diagrams represent ROC curves.
The expression levels of modular gene signatures in GSE12472
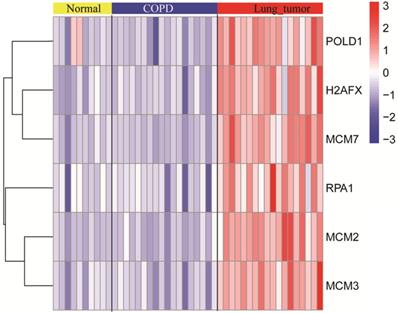
The expression levels of six key genes of the normal, COPD, and NSCLC samples were measured. As shown in the Figure 5, there was no significant difference in expression levels of key genes between normal and COPD samples. However, there was a significant difference between COPD and COPD with NSCLC. This result was consistent with the observations, which are shown in Figure 4.
The expression levels of modular gene signatures in the normal, COPD, and NSCLC samples of GSE12472.
The modular gene signatures are closely related to prognosis of NSCLC
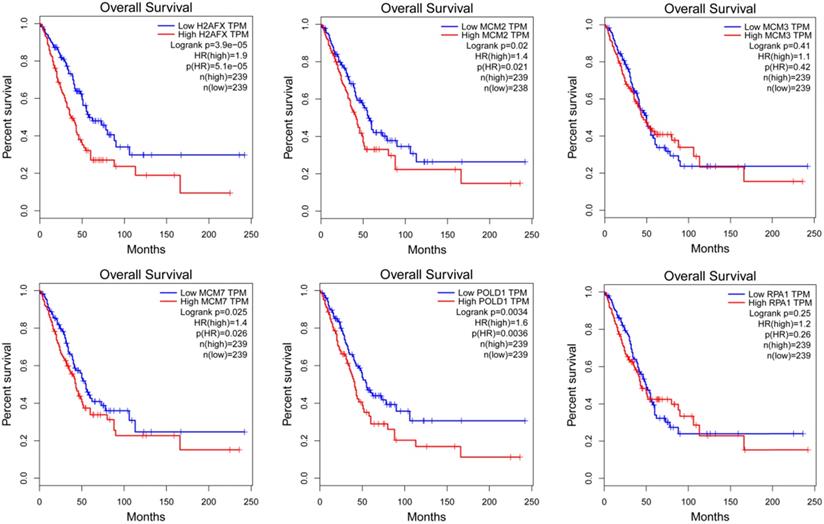
The expression of modular gene signatures was significantly related to the prognosis of LUAD (P<0.05, Figure 6). In general, we observed that the gradually higher expressions of H2AFX, MCM2, MCM7 and POLD1 were associated with the gradually worse prognosis of LUAD. However, the expressions of six key genes were not associated with the prognosis of LUSC (Supplementary Figure 1).
The Kaplan-Meier survival curves of modular gene signatures in LUAD sample.
Protein expression and distribution of H2AFX, MCM2, MCM3, MCM7, RPA1, and POLD1 in lung cancer
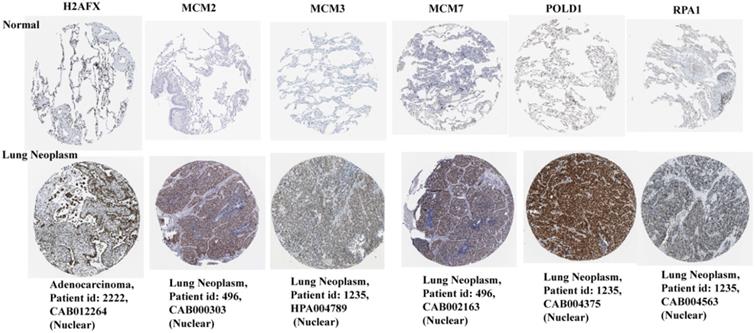
Based on the HPA database, the immunohistochemical levels of each key gene in normal lung tissue and lung cancer tissue are shown in Figure 7. It can be clearly seen that the protein levels of the six key genes were significantly elevated in lung cancer tissues compared to normal tissues.
Protein immunohistochemical levels of key genes in normal lung and lung cancer tissues.
Construction of the prognostic risk model based on the Cox regression analysis
Based on the above results, the expression levels of H2AFX, MCM2, MCM7, and POLD1 correlate significantly with the prognosis of LUAD rather than LUSC. Thus, a prognosis model containing four genes: H2AFX, MCM2, MCM7 and POLD1, was constructed for LUAD samples. Total of 514 LUAD samples were randomly divided into training and verification sets, including 365 and 129 samples, respectively. Multivariate cox analysis was performed on the four genes in the training and validation sets, and the regression coefficients were obtained (Supplementary Table 2).
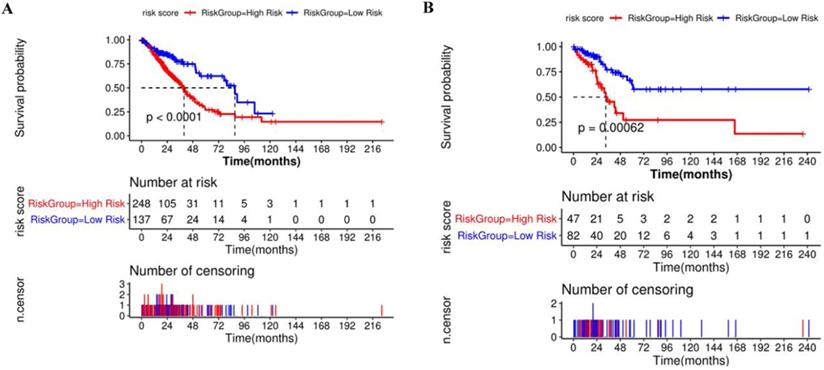
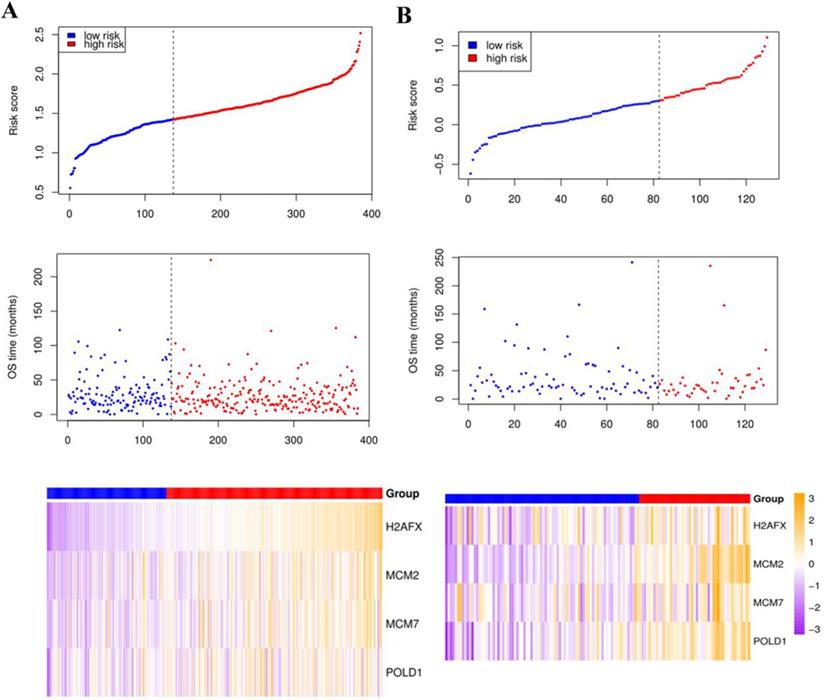
Compared with the mean and median of gene expression, optimal cutoff parameter better enables the classification between high and low risk groups [32]. The optimal cutoff of the training set is 1.42, and the optimal cutoff of the verification set is 0.31 (Supplementary Figure 2). According to the optimal cutoff grouping, the K-M survival curves of the training and verification sets were obtained. Figure 8 shows that the high-risk group has a poor prognosis, both in the training and verification sets. Besides, the risk score sorting scatter plot, scatter plot of survival time distribution, and gene expression heat maps were constructed to observe the relationship between the expression levels of the four genes and the risk score. As shown in the Figure 9, the higher the gene expression, the higher the risk score and the worse is the prognosis, which is consistent with our previous results.
Kaplan-Meier survival curve of high and low risk groups based on Cox regression risk prognosis model.
The risk score sorting scatter plot (top), scatter plot of survival time distribution (middle), and gene expression heat maps (bottom) of training (left) and verification (right) sets.
Univariate and multivariate Cox regression analysis of clinical variables and risk group
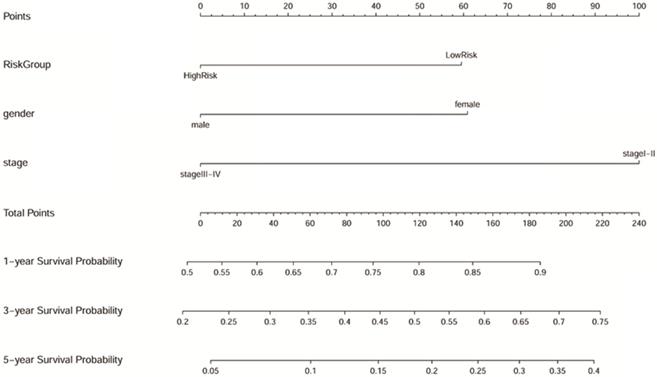
Samples with no missing values for clinical phenotype were selected, and 193 LUAD samples were included in Cox analysis. As shown in the Table 1, gender, TNM stage, and risk group are closely related to the prognosis of LUAD both in the univariate and multivariate Cox regression analysis (p<0.05). The results suggested that the predictive power of the prognostic model can be independent of any available clinical variables (including age, gender, smoking period, and clinical stage). Besides, the Forest map (Supplementary Figure 3) and alignment Diagram (Figure 10) were also created. The nomogram made the cox regression results more straightforward. Based on the Figure 10, the points corresponding to different factors were combined for the obtaining of the corresponding survival rate.
Univariate and multivariate cox regression analysis of clinical phenotypes on LUAD samples
| Variables | Univariate analysis | Multivariate analysis | ||||
|---|---|---|---|---|---|---|
| HR | 95 % CI | P value | HR | 95 % CI | P value | |
| Gender | ||||||
| Male/Female | 2.068 | 1.264-3.382 | 0.003807702 | 1.852 | 1.124-3.054 | 0.01565781 |
| Age | ||||||
| >60/≤60 | 1.273 | 0.752-2.158 | 0.368987051 | 1.293 | 0.754-2.216 | 0.35075578 |
| TNM stage | ||||||
| Stage III-IV/Stage I-II | 3.019 | 1.760-5.179 | 0.00006 | 2.414 | 1.374-4.241 | 0.00216557 |
| Smoke years | ||||||
| >15/≤15 | 1.194 | 0.569-2.503 | 0.639280745 | 0.990 | 0.464-2.112 | 0.98036512 |
| Risk group | ||||||
| High/Low | 2.412 | 1.320-4.407 | 0.003807702 | 2.217 | 1.198-4.102 | 0.01124920 |
Nomogram predicting 1, 3, and 5-year overall survival for LUAD patients. The point's scale of variables was added up. The total points projected on the bottom scales indicate the probability of 1, 3, and 5-year survival.
The modular gene signatures are closely related to clinical stages
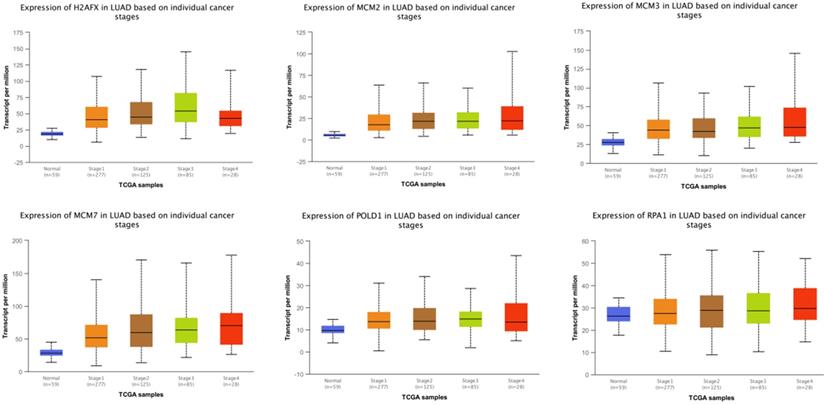
The expressions of modular gene signatures showed an upward trend with clinical stage progression in LUAD (Figure 11), and each stage was significantly different from the normal state (Supplementary Table 3). Meanwhile, levels of modular gene signatures were upregulated in LUSC grade group, compared with the normal group (Supplementary Figure 4). In addition, H2AFX, MCM2, MCM7, and POLD1 were highly up-regulated in 31 cancer tissues, based on the analysis of TCGA data (Supplementary Figure 5). Interestingly, the expression levels of modular gene signatures were significantly different between the smoking and non-smoking groups in LUAD patients rather than in LUSC patients (Supplementary Figure 6 and Supplementary Table 3).
The expression levels of 6 genes at different clinical stages of LUAD.
Discussion
This study aimed to identify the specific genetic signatures on the transcriptome level in the COPD cohort that promote NSCLC. Compared with similar published studies on COPD, this study systematically integrated three independent data sets which contained COPD and NSCLC samples, and had a large sample size. The results we obtained were robust and strong. Based on the shared DEGs between COPD and NSCLC samples, several highly connected modules were identified. Among of the overlapping genes, a panel of module gene signatures of MCM2, MCM3, MCM7, H2AFX, POLD1, and RPA1, which could robustly distinguish COPD from NSCLC, were considered to be highly associated with the development and prognosis of NSCLC. In addition, the predictive power of the Cox regression prognostic model containing MCM2, MCM7, H2AFX, and POLD1, can be independent of other clinical variables in LUAD.
According to KEGG pathways enrichment analysis, it is possible to systematically dissect a large number of genes that refine key related biological pathways. In our study, DEGs were found to be enriched in many infection-related pathways, such as in Human papillomavirus infection, Human T-cell leukemia virus 1 infection, and others. Human papillomaviruses refer to DNA tumor viruses that infect keratinocytes in the epithelia, which have been reported to be a high risk factor for lung cancer development [33]. The oncogenicity of human papillomaviruses was mainly focused on P53, which may be inactivated by virus infection [34]. Human T-cell leukemia virus 1 infection can induce T cell leukemia, megalocytic leukemia, etc. [35]. Shan et al. stated that the key genes involved in human T-cell leukemia virus 1 infection pathway may play an important role in the hepatocellular carcinoma development [36]. However, there were few reports about the correlation of the human T-cell leukemia virus 1 infection and lung cancer.
In our study, H2AFX, MCM2, MCM3, MCM7, POLD1, and RPA1 were associated with the development of NSCLC from COPD. The pathways, enriched by the module gene signatures, were reported to be involved in the processes of DNA replication, cell cycle and mismatch repair, which have significant role in lung carcinogenesis [37, 38]. For example, the mismatch repair pathway is involved in the correcting the DNA base mismatches during DNA replication and recombination [39]. Base excision repair pathway plays important role in the DNA repair process [40]. Mismatch repair pathway and base excision repair pathway together with cell cycle and DNA replication pathways are determinants of the cell fate [41, 42]. The Fanconi Anemia pathway is a complex mechanism containing homologous recombination, nucleotide excision repair, and mutagenic translesion synthesis [43]. Saviozzi et al. reported on the upregulation of genes related to homologous recombination and DNA replication pathways in the samples of NSCLC patients, which is consistent with the results of our study [44].
A panel of module gene signatures, H2AFX, MCM2, MCM7, and POLD1, were highly related to NSCLC; and the high expression levels of MCM2, MCM7, H2AFX, and POLD1 were also correlated with poor prognosis, suggesting their potential role in tumorigenesis. MCMs are protein family with fundamental functions in the replication of eukaryotic cells and are essential for initiating the DNA replication [45]. MCMs were suggested to serve as good markers of the degree of proliferation activity [46]. Many studies have shown that MCMs are predictors of patient survival and biomarkers of various cancers, such as lung cancer [47, 48], bladder cancer [49, 50], prostate cancer [51], salivary gland tumors [52]. Ramnath et al. showed that immunostaining of tumor cells for MCM2 is an independent prognostic factor for survival of NSCLC patients [53]. Liu et al. suggested that expression of MCM7 in tumor tissues may be a potential marker of poor prognosis in patients with NSCLC, whereas overexpression of MCM7 is more common in poorly differentiated tumor tissues. [54]. In our study, the expression levels of MCM2, MCM3, and MCM7 were higher in NSCLC than in COPD samples. Besides, the levels of MCM2 and MCM7 were significantly associated with the prognosis of LUAD. The results of our study are consistent with the previous reports.
Exome-sequencing results based on the TCGA analysis indicated the specific association of POLD1 mutations with hyper-mutated cancers [55]. Wang et al. found that POLE/POLD1 mutations could be promising potential predictive biomarkers for positive immune-checkpoint inhibitor outcomes [56]. In addition, many carcinogenic factors promote the expansion of the cancer cells through the upregulation of POLD1 [57]. We found that the expression of POLD1 is significantly upregulated in the NSCLC and that high POLD1 expression indicates a poor prognosis in the LUAD. As a member of the histones family, H2AFX has been reported to be involved in the DNA repair pathway [58, 59]. Several studies showed the dysregulation of H2AFX in the lung cancer [60-62]. However, there were few reports on the potential mechanisms underlying the effect of H2AFX in lung cancer. Further studies are required to figure out the potential role of H2AFX in NSCLC.
Our study showed that high levels of H2AFX, MCM2, MCM7, and POLD1 suggest poor prognosis of LUAD rather than LUSC. This difference may be due to the high heterogeneity between LUAD and LUSC [63]. LUSC is characterized with higher background of the mutation rates than LUAD, suggesting probable difficulty in prognosis prediction of LUSC using a small number of genes [64]. On the contrary, based on the expression levels of H2AFX, MCM2, MCM7, and POLD1, the Cox regression prognostic model was successfully constructed for the LUAD samples and the predictive power was independent of other clinical variables. The expression levels of gene profiles were used to predict the overall survival times of the patients. Survival prediction is usually considered as a regression problem to model patients' survival time and, thus, Cox regression models are generally used for construction of the risk prognosis model [65, 66]. Our model showed a higher predictive ability both in training and testing sets in LUAD samples.
Besides, H2AFX, MCM2, MCM7, and POLD1 were highly up-regulated in 31 cancer tissues. A previous shown that MCM2 was up-regulated in cervical carcinogenesis [67]. Ramsauer et al. uncovered that MCM7 expression was upregulated in upper proliferating keratinocyte layers of papillomas [68]. Moreover, POLD1 was reported associated with colorectal cancer [69, 70]. Interestingly, the expression levels of modular gene signatures were significantly different between the smoking and non-smoking groups in LUAD patients rather than in LUSC patients. The results were further shown that the modular gene signatures were risk genes.
However, there are still some limitations in this study. Further studies with much larger sample sizes will be needed. In addition, the data used in study are downloaded from publicly available databases, lacking of any original datum from our own study. Further validation, either in vivo or in vitro experiment will be needed. The molecular signaling pathway and function should be explored by further experiments or clinical study. Relevant experiments will be performed to verify the multiple candidate targets identified from our bioinformatics analyses.
In conclusion, the expression levels of H2AFX, MCM2, MCM7, and POLD1 were significantly different between COPD and NSCLC samples. The modular gene signatures were mainly enriched in the pathways of DNA replication, cell cycle, and mismatch repair. The high expression levels of H2AFX, MCM2, MCM7, and POLD1 were correlated with poor prognosis of LUAD.
Abbreviations
COPD, Chronic obstructive pulmonary disease; NSCLC, non-small cell lung cancer; GEO, Gene Expression Omnibus; DEG, differentially expressed genes; PCA, principal component analysis; SVM, Support vector machines; PPI, protein-protein interaction; KEGG, Kyoto Encyclopedia of Genes and Genomes; TCGA, The Cancer Genome Atlas; LUAD, lung adenocarcinoma; LUSC, lung squamous cell carcinoma; ECM, extracellular matrix; H2AFX, H2A histone family, member X; MCM, mini-chromosome maintenance proteins; POLD1, DNA polymerase δ catalytic subunit gene.
Supplementary Material
Supplementary figures and tables.
Acknowledgements
This study was supported by grants from the National Natural Science Foundation of Hunan Province (2019JJ50353, 2020JJ4418), Natural Science Foundation of Hunan Province National Health Commission (B2019091, 20201286), Natural Science Foundation of Changsha Science and technology Bureau (KP1901084), Wu Jieping Medical Foundation (320.6750.18368) and Cancer Foundation of China (NCC2018B58), Key Research and Development Project of Hunan Province (2017WK2061).
Author Contributions Statement
Lemeng Zhang and Jianhua Chen contribute to clinical data collection. Hua Yang, Haitao Li and Changqie Pan contribute to data statistics analyze. Lemeng Zhang and Yongzhong Luo contribute to manuscript preparation. Lemeng Zhang and Tianli Cheng contribute to the study design, manuscript writing and data analyze. All authors read and approved the final manuscript.
Contribution to the Field Statement
This study identified candidate key genes, H2AFX, MCM2, MCM3, MCM7, POLD1, and RPA1, which were associated with the development from COPD to NSCLC. The modular gene signatures were mainly enriched in the DNA replication, cell cycle and mismatch repair. The high expressions of H2AFX, MCM2, MCM7, and POLD1 were correlated with poor prognosis of LUAD.
Data Availability Statement
The raw data, supporting the conclusions of this manuscript, will be made available by contacting the corresponding author.
Competing Interests
The authors have declared that no competing interest exists.
References
1. Bray F, Ferlay J, Soerjomataram I. et al. Global cancer statistics 2018: GLOBOCAN estimates of incidence and mortality worldwide for 36 cancers in 185 countries. CA: a cancer journal for clinicians. 2018;68:394-424
2. Zarogoulidis K, Zarogoulidis P, Darwiche K. et al. Treatment of non-small cell lung cancer (NSCLC). Journal of Thoracic Disease. 2013;5:S389-S396
3. Chang W-A, Tsai M-J, Jian S-F. et al. Systematic analysis of transcriptomic profiles of COPD airway epithelium using next-generation sequencing and bioinformatics. International journal of chronic obstructive pulmonary disease. 2018;13:2387
4. O'Donnell DE, Laveneziana P. Dyspnea and activity limitation in COPD: mechanical factors. COPD: Journal of Chronic Obstructive Pulmonary Disease. 2007;4:225-236
5. Sandri BJ, Kaplan A, Hodgson SW. et al. Multi-Omic Molecular Profiling of Lung Cancer in Chronic Obstructive Pulmonary Disease. European Respiratory Journal. 2018;52:1702665
6. Mouronte-Roibas C, Leiro-Fernandez V, Fernandez-Villar A. et al. COPD, emphysema and the onset of lung cancer. A systematic review. Cancer Lett. 2016;382:240-244
7. Mouronte-Roibás C, Ruano-Raviña A, Fernández-Villar A. Lung cancer and chronic obstructive pulmonary disease: understanding the complexity of carcinogenesis. Translational lung cancer research. 2018
8. Mouronte-Roibas C, Ruano-Ravina A, Fernandez-Villar A, Lung cancer, chronic obstructive pulmonary disease. understanding the complexity of carcinogenesis. Transl Lung Cancer Res. 2018;7(Suppl 3):214-217 doi: 10.21037/tlcr.2018.08.11
9. Sandri BJ, Kaplan A, Hodgson SW. et al. Multi-omic molecular profiling of lung cancer in COPD. Eur Respir J. 2018;52:02665-2017
10. Melo FDSE, Wang X, Jansen M. et al. Poor-prognosis colon cancer is defined by a molecularly distinct subtype and develops from serrated precursor lesions. Nature Medicine. 2013;19:614-8
11. Ding Y, Yang DZ, Zhai YN. et al. Microarray expression profiling of long non-coding RNAs in epithelial ovarian cancer. Oncology Letters. 2017;14:2523-2530
12. Shan S, Chen W, Jia J. Transcriptome analysis revealed a highly connected gene module associated with cirrhosis to hepatocellular carcinoma development. Frontiers in genetics. 2019;10:305
13. Tian X, Zhu X, Yan T. et al. Recurrence-associated gene signature optimizes recurrence-free survival prediction of colorectal cancer. Molecular oncology. 2017;11:1544-1560
14. Sandri BJ, Adam K, W HS. et al. Multi-Omic Molecular Profiling of Lung Cancer in Chronic Obstructive Pulmonary Disease. European Respiratory Journal. 2018;52(1):1702665 -
15. Boelens MC, Gustafson AM, Postma DS. et al. A chronic obstructive pulmonary disease related signature in squamous cell lung cancer. Lung Cancer. 2010;72(2):177-183
16. Boelens MC, Berg AVD, Fehrmann RSN. et al. Current smoking-specific gene expression signature in normal bronchial epithelium is enhanced in squamous cell lung cancer. Journal of Pathology. 2009;218:182-191
17. Barrett T, Suzek TO, Troup DB. et al. NCBI GEO: mining millions of expression profiles—database and tools. Nucleic Acids Research. 2005;33(D):562-566
18. Robinson MD, McCarthy DJ, Smyth GK. edgeR: a Bioconductor package for differential expression analysis of digital gene expression data. Bioinformatics. 2010;26:139-40
19. McCarthy DJ, Chen Y, Smyth GK. Differential expression analysis of multifactor RNA-Seq experiments with respect to biological variation. Nucleic Acids Res. 2012;40:4288-97
20. Smyth GK. limma: Linear Models for Microarray Data, in Bioinformatics and Computational Biology Solutions Using R and Bioconductor. Editors. Springer New York: New York, NY. 2005 p:397-420
21. Yu G, Wang L-G, Han Y. et al. clusterProfiler: an R package for comparing biological themes among gene clusters. Omics: a journal of integrative biology. 2012;16:284-287
22. Kanehisa M, Goto S. KEGG: kyoto encyclopedia of genes and genomes. Nucleic acids research. 2000;28:27-30
23. Szklarczyk D, Franceschini A, Wyder S. et al. STRING v10: protein-protein interaction networks, integrated over the tree of life. Nucleic acids research. 2014;43(D):447-452
24. Shannon P, Markiel A, Ozier O. et al. Cytoscape: a software environment for integrated models of biomolecular interaction networks. Genome research. 2003;13:2498-2504
25. Bandettini WP, Kellman P, Mancini C. et al. MultiContrast Delayed Enhancement (MCODE) improves detection of subendocardial myocardial infarction by late gadolinium enhancement cardiovascular magnetic resonance: a clinical validation study. Journal of Cardiovascular Magnetic Resonance. 2012;14:83
26. Hsing T, Eubank R. Theoretical foundations of functional data analysis, with an introduction to linear operators. 2 John Wiley & Sons. 2015
27. Uhlén M, Björling E, Agaton C. et al. A human protein atlas for normal and cancer tissues based on antibody proteomics. Molecular & cellular proteomics. 2005;4:1920-1932
28. Cath T, Barber GP, Jonathan C. et al. The UCSC Genome Browser database: 2017 update. Nucleic acids research. 2016;45(D1):626-634
29. Chandrashekar DS, Bashel B, Balasubramanya SAH. et al. UALCAN: a portal for facilitating tumor subgroup gene expression and survival analyses. Neoplasia. 2017;19:649-658
30. Islami F, Torre LA, Jemal A. Global trends of lung cancer mortality and smoking prevalence. Translational lung cancer research. 2015;4:327
31. Lee PN, Forey BA, Coombs KJ. Systematic review with meta-analysis of the epidemiological evidence in the 1900s relating smoking to lung cancer. BMC cancer. 2012;12:385
32. L´opez-Rat´on M, Rodr´ıguez-Alvarez MX. et al. OptimalCutpoints: Computing optimal cutpoints in diagnostic tests. Jouranl of Statistical Software. 2014;29:485-501
33. Klein F, Amin Kotb WFM, Petersen I. Incidence of human papilloma virus in lung cancer. Lung Cancer. 2009;65(1):13-18
34. Yu Y, Yang A, Hu S. et al. Significance of human papillomavirus 16/18 infection in association with p53 mutation in lung carcinomas. Clinical Respiratory Journal. 2011 7(1)
35. Matsuoka M, Jeang K-T. Human T-cell leukemia virus type 1 (HTLV-1) and leukemic transformation: viral infectivity, Tax, HBZ and therapy. Oncogene. 2011;30:1379-1389
36. Shan S, Chen W, Jia JD. Transcriptome Analysis Revealed a Highly Connected Gene Module Associated With Cirrhosis to Hepatocellular Carcinoma Development. Front Genet. 2019 10
37. Landi S, Gemignani F, Canzian F. et al. DNA Repair and Cell Cycle Control Genes and the Risk of Young-Onset Lung Cancer. Cancer research. 2006;66:11062-11069
38. Postel-Vinay S, Vanhecke E, Olaussen KA. et al. The potential of exploiting DNA-repair defects for optimizing lung cancer treatment. Nature Reviews Clinical Oncology. 2012;9:144-155
39. Martin SA, Lord CJ, Ashworth A. Therapeutic Targeting of the DNA Mismatch Repair Pathway. Clinical Cancer Research An Official Journal of the American Association for Cancer Research. 2010;16:5107-5113
40. Wallace SS. Base excision repair: a critical player in many games. DNA Repair. 2014;19:14-26
41. Bisteau X, Caldez MJ, Kaldis P. The Complex Relationship between Liver Cancer and the Cell Cycle: A Story of Multiple Regulations. Cancers. 2014;6:79-111
42. Li Z, Pearlman AH, Hsieh P. DNA mismatch repair and the DNA damage response. DNA Repair. 2015;38:94-101 S1568786415300069
43. Moldovan GL, D'Andrea AD. How the fanconi anemia pathway guards the genome. Annu Rev Genet. 2009;43:223-49
44. Saviozzi S, Ceppi P, Novello S. et al. Non-Small Cell Lung Cancer Exhibits Transcript Overexpression of Genes Associated with Homologous Recombination and DNA Replication Pathways. Cancer research. 2009;69(8):3390-3396
45. Labib K. Uninterrupted MCM2-7 Function Required for DNA Replication Fork Progression. Science. 2000;288:1643-1647
46. Nowińska K, Dzięgiel P. The role of MCM proteins in cell proliferation and tumorigenesis. Postepy Hig Med Dosw. 2010;64:627-635
47. Ramnath N, Hernandez FJ, Tan DF. et al. MCM2 Is an Independent Predictor of Survival in Patients with Non-Small-Cell Lung Cancer. Journal of Clinical Oncology Official Journal of the American Society of Clinical Oncology. 2001;19:4259-4266
48. Werynska B, Pula B, Muszczynska-Bernhard B. et al. Correlation between Expression of Metallothionein and Expression of Ki-67 and MCM-2 Proliferation Markers in Non-Small Cell Lung Cancer. Anticancer Research. 2011;31:2833-2839
49. Fristrup N, Birkenkamp-Demtr?der K, Reinert T. et al. Multicenter Validation of Cyclin D1, MCM7, TRIM29, and UBE2C as Prognostic Protein Markers in Non-Muscle-Invasive Bladder Cancer. American Journal of Pathology. 2012;182:339-349
50. Korkolopoulou P, Givalos N, Saetta A. et al. Minichromosome maintenance proteins 2 and 5 expression in muscle-invasive urothelial cancer: a multivariate survival study including proliferation markers and cell cycle regulators. Hum Pathol. 2005;36:899-907
51. Ren B, Yu G, Tseng GC. et al. MCM7 amplification and overexpression are associated with prostate cancer progression. Oncogene. 2006;25:1090-8
52. Ashkavandi ZJ, Najvani AD, Tadbir AA. et al. MCM3 as a novel diagnostic marker in benign and malignant salivary gland tumors. Asian Pac J Cancer Prev. 2013;14:3479-82
53. Ramnath N, Hernandez FJ, Tan DF. et al. MCM2 is an independent predictor of survival in patients with non-small-cell lung cancer. J Clin Oncol. 2001;19:4259-66
54. Liu YZ, Jiang YY, Hao JJ. et al. Prognostic significance of MCM7 expression in the bronchial brushings of patients with non-small cell lung cancer (NSCLC). Lung Cancer. 2012;77:176-82
55. Muzny DM, Bainbridge MN. et al. Comprehensive molecular characterization of human colon and rectal cancer. Nature. 2012;487:330-7
56. Wang F, Zhao Q, Wang YN. et al. Evaluation of POLE and POLD1 Mutations as Biomarkers for Immunotherapy Outcomes Across Multiple Cancer Types. JAMA Oncol. 2019 15
57. Xu Y, Qin Q, Chen R. et al. SIRT1 promotes proliferation, migration, and invasion of breast cancer cell line MCF-7 by upregulating DNA polymerase delta1 (POLD1). Biochem Biophys Res Commun. 2018;502:351-357
58. Huang CY, Huang C-H, Chang PM-H. et al. In silico identification of potential targets and drugs for non-small cell lung cancer. Iet Systems Biology. 2014;8:56-66
59. Santarpia L, Iwamoto T, Di Leo A. et al. DNA Repair Gene Patterns as Prognostic and Predictive Factors in Molecular Breast Cancer Subtypes. Oncologist. 2013;18:1063-1073
60. Caramori G, Adcock IM, Casolari P. et al. Unbalanced oxidant-induced DNA damage and repair in COPD: a link towards lung cancer. Thorax. 2011;66:521-7
61. Castro M, Grau L, Puerta P. et al. Multiplexed methylation profiles of tumor suppressor genes and clinical outcome in lung cancer. J Transl Med. 2010;8:1479-5876
62. Corveloni AC, Semprebon SC, Baranoski A. et al. Carnosic acid exhibits antiproliferative and proapoptotic effects in tumoral NCI-H460 and nontumoral IMR-90 lung cells. J Toxicol Environ Health A. 2020;83:412-421
63. McCullough A. Comprehensive genomic characterization of squamous cell lung cancers. Yearbook of Pathology and Laboratory Medicine. 2013
64. Hua X, Xu H, Yang Y. et al. DrGaP: A Powerful Tool for Identifying Driver Genes and Pathways in Cancer Sequencing Studies. American Journal of Human Genetics. 2013;93:439-451
65. Zeng J-H, Liang L, He R-Q. et al. Comprehensive investigation of a novel differentially expressed lncRNA expression profile signature to assess the survival of patients with colorectal adenocarcinoma. Oncotarget. 2017;8(10):16811-16828
66. Zhang CB, Zhu P, Yang P. et al. Identification of high risk anaplastic gliomas by a diagnostic and prognostic signature derived from mRNA expression profiling. Oncotarget. 2015;6:36643-51
67. Kaur G, Balasubramaniam SD, Lee YJ. et al. Minichromosome Maintenance Complex (MCM) Genes Profiling and MCM2 Protein Expression in Cervical Cancer Development. Asian Pac J Cancer Prev. 2019;20:3043-3049
68. Ramsauer AS, Wachoski-Dark GL, Fraefel C. et al. Paving the way for more precise diagnosis of EcPV2-associated equine penile lesions. BMC Vet Res. 2019;15:356
69. Jansen AML, Ghosh P, Dakal TC. et al. Novel candidates in early-onset familial colorectal cancer. Fam Cancer. 2020;19:1-10
70. ME IJ, Sanz-Pamplona R, Hermitte F. et al. Colorectal cancer: A paradigmatic model for cancer immunology and immunotherapy. Mol Aspects Med. 2019;69:123-129
Author contact
![]() Corresponding author: Tianli Cheng, Thoracic Medicine Department 1, Hunan Cancer Hospital, Changsha, Hunan Province, P.R. China, 410013, E-mail: chengtianliorg.cn; Tel: +86-731-89762220; FAX: +86-731-89762220. Address: Tongzipo Rd 283#, Yuelu District, Changsha, Hunan Province, P.R. China, 410013.
Corresponding author: Tianli Cheng, Thoracic Medicine Department 1, Hunan Cancer Hospital, Changsha, Hunan Province, P.R. China, 410013, E-mail: chengtianliorg.cn; Tel: +86-731-89762220; FAX: +86-731-89762220. Address: Tongzipo Rd 283#, Yuelu District, Changsha, Hunan Province, P.R. China, 410013.