Impact Factor ISSN: 1837-9664

 Global reach, higher impact
J Cancer 2021; 12(6):1779-1791. doi:10.7150/jca.51551 This issue Cite
Research Paper
Identification of Potential BRAF Inhibitor Joint Therapy Targets in PTC based on WGCAN and DCGA
YaLi Han1, XiaQing Yu3, YuZhen Yin3, Zhongwei Lv3, ChengYou Jia1, Yina Liao1, Hongyan Sun2, Tie Liu2, Lele Cong2, ZhaoLiang Fei4, Da Fu5, Xianling Cong2 ![]() , Shen Qu1
, Shen Qu1 ![]()
1. Shanghai Center for Thyroid Disease, Shanghai Tenth People's Hospital, Shanghai, China;
2. Department of biobank, China-Japan Union Hospital of Jilin University, Changchun, Jilin Province, People's Republic of China;
3. Department of Nuclear Medicine, Shanghai Tenth People's Hospital, School of Medicine, Tongji University, Shanghai, China;
4. Department of Endocrinology and Metabolism, Shanghai Tenth People's Hospital, School of Medicine, Tongji University, Shanghai, China;
5. Central Laboratory for Medical Research, Shanghai Tenth People's Hospital, Tongji University School of Medicine, Shanghai, China.
Received 2020-8-5; Accepted 2020-12-28; Published 2021-1-21
Abstract

As the most common mutation in papillary thyroid cancer (PTC), B-type Raf kinase V600E mutation (BRAFV600E) has become an important target for the clinical treatment of PTC. However, the clinical application still faces the problem of resistance to BRAF inhibitors (BRAFi). Therefore, exploring BRAFV600E-associated prognostic factors to providing potential joint targets is important for combined targeted therapy with BRAFi. In this study, we combined transcript data and clinical information from 199 BRAF wild-type (BRAFWT) patients and 283 BRAFV600E mutant patients collected from The Cancer Genome Atlas (TCGA), and screened 455 BRAFV600E- associated genes through differential analysis and weighted gene co-expression network analysis. Based on these BRAFV600E-associated genes, we performed functional enrichment analysis and co-expression differential analysis and constructed a core co-expression network. Next, genes in the differential co-expression network were used to predict drugs for therapy in the crowd extracted expression of differential signatures (CREEDS) database, and the key genes were selected based on the hub co-expression network through survival analyses and receiver operating characteristic (ROC) curve analyses. Finally, we obtained eight BRAFV600E-associated biomarkers with both prognostic and diagnostic values as potential BRAFi joint targets, including FN1, MET, SLC34A2, NGEF, TBC1D2, PLCD3, PROS1, and NECTIN4. Among these genes, FN1, MET, PROS1, and TBC1D2 were validated through GEO database. Two novel biomarkers, PROS1 and TBC1D2, were further validated by qRT-PCR experiment. Besides, we obtained four potential targeted drugs that could be used in combination with BRAFi to treat PTC, including MET inhibitor, ERBB3 inhibitor, anti-NaPi2b antibody-drug conjugate, and carboplatin through literature review. The study provided potential drug targets for combination therapy with BRAFi for PTC to overcome the drug resistance for BRAFi.
Keywords: papillary thyroid cancer, BRAF, biomarkers, targeted drugs
Introduction
As the most common subtype of thyroid cancer, papillary thyroid cancer (PTC) accounts for more than 85% of thyroid cancers[1, 2]. Though PTC is an indolent disease with a good prognosis, its incidence is increasing with years[3]. B-type Raf kinase V600E mutation (BRAFV600E) is the most common point mutation closely related to the recurrence of thyroid cancer and PTC-specific death[4-6]. Numerous studies on the carcinogenic molecular mechanisms of BRAFV600E have shown that BRAFV600E is related to the malignant progress of thyroid cancer[7]. Several BRAF inhibitors (BRAFi) for thyroid cancer have been approved by food and drug administration in America, such as vemurafenib, dabrafenib, etc[8]. However, a major challenge in clinical practice is the drug resistance to BRAFi[9, 10]. Therefore, exploring BRAFV600E-associated prognostic factors to providing potential joint targets is important for combined targeted therapy with BRAFi.
Previous studies have identified BRAFV600E-associated genes with diagnostic value for PTC based on weighted gene co-expression network analysis (WGCNA), which clusters genes into modules through calculating the expression correlations and topological overlaps between genes[11, 12]. However, the prognostic factors-associated with BRAFV600E based on large-scale clinical data need to be further investigated. Another study has explored the function of PTC-associated genes with both WGCNA and differential gene correlation analysis(DGCA), which measures the gene co-expression variations based on differential correlation calculations[13, 14]. Their study also predicted meaningful drugs for therapy through the CREEDS database, a database including single gene perturbations, single drug perturbations, and disease signatures from Gene Expression Omnibus (GEO) data[15]. However, the study didn't reveal any potential prognostic factors or drug targets for PTC, especially those related to BRAF mutations. To sum up, the current studies haven't explored potential prognostic biomarkers and drugs targeting genes associated with BRAFV600E.
In this study, we constructed a BRAFV600E-associated co-expression network and predicted meaningful drugs in CREEDS through combing WGCNA with DCGA for the first time, providing further insight into the regulatory mechanism of BRAFV600E mutation for PTC. Based on the co-expression network, we revealed eight BRAFV600E-associated key genes with both prognostic and diagnostic values for BRAFV600E PTC. Of note, our study revealed 2 novel BRAFV600E-related biomarkers have potential associations with the recurrence of PTC through a combination of database analysis and qRT-PCR experiment. This provided possible treatment strategies and potential drug targets for combination therapy with BRAFi for PTC to overcome the drug resistance for BRAFi.
Material and Methods
Data retrieval
Varsan2 somatic mutation data of 487 PTC patients was download by R package “TCGAbiolinks”[16]. The counts data of RNA high throughput sequencing (HTSeq-counts) of 502 PTC patients, including 58 normal tissues and 502 tumor tissues, was downloaded by R package “GDCRNAtools” from TCGA[17]. The low-expression gene was defined as the gene with the value of count-per-million (CPM) < 2 in more than half of the samples. After filtering out low expression genes, 13483 protein-coding genes (messenger RNA, mRNA) were extracted by transformed with GENCODE (https://www.gencodegenes.org/). Clinical information of the 502 patients was downloaded from UCSC Xena by R package “UCSCXenaTools”[18]. By intersecting 502 PTC patients with expression data and 487 PTC patients with mutation data, 482 cases meeting the following criteria were included in our analysis: Patients with clear BRAF mutation information; Patients with gene expression data of RNA-sequencing. Raw data of 108 PTC samples with specific BRAF mutation status were collected from three microarray datasets (accession numbers: GSE27155, GSE54958, and GSE58545) in the GEO database (https://www.ncbi.nlm.nih.gov/geo/). The expression data were processed as the previous description[11].
Ethical statement
Since the data involved in humans were all publicly available in the GEO dataset and TCGA dataset, the ethics committee approvals were stated in the primary studies and there was no additional ethical statement to be declared. The approval of data utilization of GEO dataset can be retrieved from https://www.ncbi.nlm.nih.gov/geo/info/disclaimer.html, and the approval of data utilization of the TCGA dataset can be retrieved from https://www.cancer.gov/about-nci/organization/ccg/research/structural-genomics/tcga. The human specimens used for protocol employed were approved by the Ethical Committee of China-Japan Union Hospital of Jilin University. The experimental procedures have been carried out by following the ethical standards as of the Declaration of Helsinki. Informed consent was obtained from all individual participants included in the study.
Differentially expressed genes (DEGs) filtering
According to the mutation information of the BRAF gene showed in table 1, tumor samples of PTC patients were divided into BRAFV600E group (283 cases) and BRAFWT group (199 cases, including one case with BRAF nonsense mutation, 3 cases with other BRAF mutation type). DEGs between the two groups (WT-V600E DEGs) were screened by the “DESeq2” R package[19]. The p-value < 0.05, and the absolute value of log2(fold change) (BRAFV600E group vs. BRAFWT group) >1 were considered as the threshold of meeting significant difference. DEGs between normal tissues and tumor tissues were screened with the same method and was defined as N-T DEGs. DEGs specific to BRAFV600E PTCs were obtained by taking an intersection between WT-V600E DEGs and N-T DEGs. The matrix of mRNA counts was normalized by the “DESeq2” package based on variance stabilizing transformations.
Clinical information of 482 PTC cases in WGCNA
| BRAFV600E (n=283) | BRAFWT(n=199) | Overall (n=482) | p-value | |
|---|---|---|---|---|
| Age | ||||
| Median [Min, Max] | 47.0 [15.0, 89.0] | 46.0 [15.0, 88.0] | 46.0 [15.0, 89.0] | 0.518 |
| Vital status, n (%) | 1 | |||
| Alive | 274 (96.8%) | 194 (97.5%) | 468 (97.1%) | |
| Dead | 8 (2.8%) | 5 (2.5%) | 13 (2.7%) | |
| Missing | 1 (0.4%) | 0 (0%) | 1 (0.2%) | |
| Extrathyroid extension status, n (%) | <0.001 | |||
| None | 162 (57.2%) | 157 (78.9%) | 319 (66.2%) | |
| Minimal (T3) | 100 (35.3%) | 31 (15.6%) | 131 (27.2%) | |
| Moderate/Advanced (T4a) | 16 (5.7%) | 1 (0.5%) | 17 (3.5%) | |
| Very Advanced (T4b) | 0 (0%) | 1 (0.5%) | 1 (0.2%) | |
| Missing | 5 (1.8%) | 9 (4.5%) | 14 (2.9%) | |
| Gender, n (%) | 0.845 | |||
| Female | 207 (73.1%) | 148 (74.4%) | 355 (73.7%) | |
| Male | 76 (26.9%) | 51 (25.6%) | 127 (26.3%) | |
| Histological type, n (%) | <0.001 | |||
| Other, specify | 4 (1.4%) | 5 (2.5%) | 9 (1.9%) | |
| Classical/usual | 233 (82.3%) | 106 (53.3%) | 339 (70.3%) | |
| Follicular (>= 99% follicular patterned) | 13 (4.6%) | 86 (43.2%) | 99 (20.5%) | |
| Tall Cell (>= 50% tall cell features) | 33 (11.7%) | 2 (1.0%) | 35 (7.3%) | |
| Pathologic M, n (%) | 0.026 | |||
| M0 | 175 (61.8%) | 98 (49.2%) | 273 (56.6%) | |
| M1 | 5 (1.8%) | 4 (2.0%) | 9 (1.9%) | |
| MX | 103 (36.4%) | 96 (48.2%) | 199 (41.3%) | |
| Missing | 0 (0%) | 1 (0.5%) | 1 (0.2%) | |
| Pathologic N, n (%) | <0.001 | |||
| N0 | 106 (37.5%) | 113 (56.8%) | 219 (45.4%) | |
| N1 | 35 (12.4%) | 21 (10.6%) | 56 (11.6%) | |
| N1a | 70 (24.7%) | 15 (7.5%) | 85 (17.6%) | |
| N1b | 51 (18.0%) | 22 (11.1%) | 73 (15.1%) | |
| NX | 21 (7.4%) | 28 (14.1%) | 49 (10.2%) | |
| Pathologic T, n (%) | 0.001 | |||
| T1 | 22 (7.8%) | 19 (9.5%) | 41 (8.5%) | |
| T1a | 9 (3.2%) | 9 (4.5%) | 18 (3.7%) | |
| T1b | 44 (15.5%) | 34 (17.1%) | 78 (16.2%) | |
| T2 | 78 (27.6%) | 80 (40.2%) | 158 (32.8%) | |
| T3 | 112 (39.6%) | 52 (26.1%) | 164 (34.0%) | |
| T4 | 5 (1.8%) | 4 (2.0%) | 9 (1.9%) | |
| T4a | 13 (4.6%) | 0 (0%) | 13 (2.7%) | |
| TX | 0 (0%) | 1 (0.5%) | 1 (0.2%) | |
| Pathologic stage, n (%) | <0.001 | |||
| Stage I | 150 (53.0%) | 118 (59.3%) | 268 (55.6%) | |
| Stage II | 18 (6.4%) | 33 (16.6%) | 51 (10.6%) | |
| Stage III | 75 (26.5%) | 33 (16.6%) | 108 (22.4%) | |
| Stage IV | 0 (0%) | 2 (1.0%) | 2 (0.4%) | |
| Stage IVA | 35 (12.4%) | 10 (5.0%) | 45 (9.3%) | |
| Stage IVC | 4 (1.4%) | 2 (1.0%) | 6 (1.2%) | |
| Missing | 1 (0.4%) | 1 (0.5%) | 2 (0.4%) | |
WGCNA
To explore genes related to the clinical traits we are interested in, including TMN stage, gender, age, mutation status of BRAF, WGCNA was conducted on the expression profiling of 3371 genes, which was the top 25% highest variance across 482 samples with full clinic information. An unsigned network was constructed with the soft threshold power = 6 (R2 = 0.899, slope = -1.348), which was calculated using nearly scale-free topology. Modules with > 30 genes were generated. The minimum cut height was set to 0.25 based on the dynamic tree cut algorithm. The correlation coefficients between the interested clinical traits and these modules were calculated with R package “WGCNA”. The p-value of less than 0.01 was defined as statistically significant. Module eigengene was defined as the first principal component of the expression matrix of the corresponding module. For each module, the correlation coefficient between the module eigengene and the gene expression profile was defined as module membership (MM). Gene Significance (GS) was characterized by the correlation coefficient between the individual gene and the clinical factors. DEGs specific to BRAFV600E PTCs in the module most positively correlated with BRAFV600E mutation were screened as BRAFV600E-associated genes. Among these genes, hub genes, of which the absolute values of both MM and GS ranked in the top 50, were selected for constructing the co-expression network.
Function, pathways, and disease enrichment analysis
Function, pathway, disease enrichment analyses were performed on BRAFV600E-associated genes with R package “GDCRNAtools”, including Gene Ontology (GO) enrichment analysis, Kyoto Encyclopedia of Genes and Genomes (KEGG) pathway enrichment analysis, and Disease Ontology (DO) enrichment analysis based on GO (http://geneontology.org/), KEGG (https://www.genome.jp/kegg/) and DO (https://disease-ontology.org/) database respectively. GO supports many species with GO annotation query online via AnnotationHub, and KEGG Pathway and Module with the latest online data supports more than 4000 species listed in http://www.genome.jp/kegg/catalog/orglist.html. The false discovery rate (FDR) < 0.05 was considered statistically significant. The minimum size of the gene sets is set as 5.
Differential correlation analysis
Differential correlation analysis between BRAFV600E PTC and BRAFWT PTC was conducted based on BRAFV600E-associated genes with R package “DGCA”. The absolute value of the correlation coefficients greater than 0.3 and p-value<0.05 were defined as significant gene-pairs. When the regulation of the two genes was opposite in the BRAFV600E and the BRAFWT group, the gene pair was considered to have a differential correlation between the two groups. Finally, the BRAFV600E-associated co-expression network based on the correlations between the hub genes was constructed and visualized by Cytoscape 3.7.2.
Targeted drug prediction
Targeted drugs of the BRAFV600E-associated genes with differential correlation were predicted with the opposite signatures from original crowdsourcing signatures in the CREEDS database(http://amp.pharm.mssm.edu/creeds/). The ranking of the predicted drugs was based on the Signed Jaccard Index, which represents signatures of reverse effects.
Survival analysis
Relapse survival analyses of the hub genes were conducted with the “survival” and the “survminer” R package based on Kaplan-Meier mothed. The minimal proportion of observations per group was set to 0.25. Log-rank p-value < 0.05 was considered as significant statistically.
Expression differences of prognosis-associated genes between BRAFV600E and BRAFWT PTCs were validated in 108 patients collected from GEO using the nonparametric Wilcoxon rank-sum test. p-value < 0.05 was considered statistically significant.
Receiver operating characteristic curve (ROC) analysis
Using SPSS 22.0 and R package “pROC”, ROC analyses of the prognostic indicators were conducted on patients from TCGA and GEO respectively. Genes with area under curve (AUC) > 0.90 and p-value < 0.05 were considered to have significant diagnostic value.
RNA Extraction and qPCR
Tissue samples from 92 PTC patients were used to extract total RNA as the previous description[20]. Among the 92 PTC cases, 83 cases had paired normal and tumor tissue samples and 82 cases had clear BRAF mutation information, including 56 BRAFV600E PTC patients and 26 BRAFWT patients. The BRAF mutation status of these PTC patients was detected through Sanger sequencing in Sangon Biotech company with both forward and reverse primers in table 2. Total RNAs were reversely transcribed into cDNAs with PrimeScript™ RT reagent Kit (TAKARA, RR037A). Quantitative real-time PCR (qRT-PCR) analysis was performed on each cDNA template with 2×SYBR Green qPCR Master mix (Bimake, B21203) through Bio-Rad CFX96 Real-Time system. GAPDH was set as an internal control for gene quantification. The differences between groups for in vitro studies were analyzed by nonparametric t-test in GraphPad, with statistical significance (p < 0.05).
The list of the primers for sequencing and qPCR
| Genes | Primer name | Primer sequence (from 5' to 3') |
|---|---|---|
| BRAF | BRAF-F | TCATAATGCTTGCTCTGATAGGA |
| BRAF-R | GGCCAAAAATTTAATCAGTGGA | |
| PLCD3 | PLCD3-F | GGGCTGCGGATGAACTCAG |
| PLCD3-R | CACTGCCCATTGACTAGGAAG | |
| TBC1D2 | TBC1D2-F | ACAACATCCGTGGCAACAAG |
| TBC1D2-R | CTTTCTGAGCGAAACTGATGGT | |
| GAPDH | h-GAPDH-F | TCTCTGCTCCTCCTGTTCGA |
| h-GAPDH-R | GCGCCCAATACGACCAAATC |
Results
DEGs screening
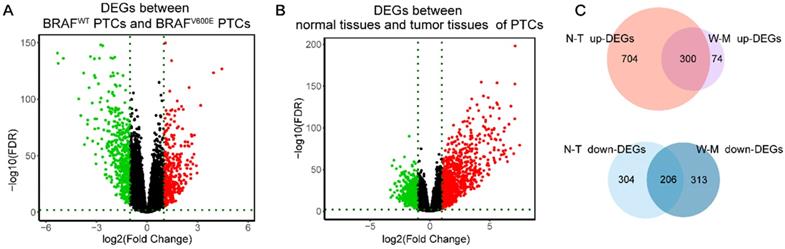
Firstly, we analyzed the difference in gene expression between BRAFWT and BRAFV600E groups. A total of 893 DEGs were obtained, among which the expression of 374 genes was up-regulated, and the expression of 519 genes was down-regulated (figure 1A). Next, we got 1514 DEGs in the comparison between normal and tumor tissues, including 1004 highly-expressed genes and 510 under-expressed genes (figure 1B). Finally, by intersecting the up-regulated genes and down-regulated genes of the two differential analyses, we obtained 506 DEGs specific to BRAFV600E PTC, of which 300 were up-regulated and 206 were down-regulated (figure 1C). The remained 1008 DEGs between normal tissues and tumor tissues were defined as non-BRAFV600E-specific DEGs.
Identification of DEGs. (A) Volcano maps of aberrantly expressed mRNAs between two groups: BRAFV600E PTCs and BRAFWT PTCs. Red dots represent up-regulated genes and green dots represent down-regulated genes. (B) Volcano maps of aberrantly expressed mRNAs between two groups: normal PTCs and tumor PTCs. Red dots represent up-regulated genes and green dots represent down-regulated genes. (C) Venn diagram showed the intersection of DEGs between BRAFV600E PTCs and BRAFWT PTCs and DEGs between normal PTCs and tumor PTCs. DEGs: differential expression genes; FDR: False Discovery Rate; N-T up-DEGs: up-regulated DEGs between normal and tumor PTC tissues; N-T down-DEGs: down-regulated DEGs between normal and tumor PTC tissues; W-M up-DEGs: up-regulated DEGs between BRAFV600E and BRAFWT PTC tissues; W-M down-DEGs: down-regulated DEGs between BRAFV600E and BRAFWT PTC tissues.
Turquoise modules are the key BRAFV600E related modules
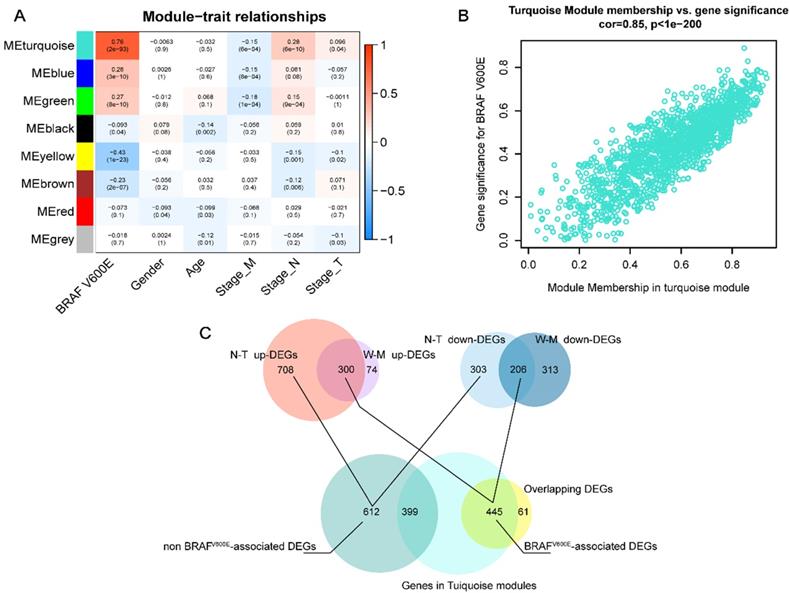
Next, we applied WGCNA to explore the co-expression network and find if there was any gene cluster highly related to the clinical traits that we are interested in. As shown in figure 2A, using WGCNA, we find that most modules were significantly correlated with BRAFV600E portrait, a total of 5 gene modules (p<0.01). Among them, the turquoise module had the strongest positive correlation with BRAFV600E. The correlation between the MM and GS of genes in the turquoise module were shown in figure 2B. Among the 1500 genes in the turquoise module, 445 genes overlapped with the DEGs specific to BRAFV600E were screened (figure 2C). These genes were defined as BRAFV600E-associated genes in PTC. In the non-BRAFV600E-specific DEGs, we filtered out 399 genes that overlapped with genes in the turquoise module, and the remaining 612 DEGs were defined as non-BRAFV600E-associated DEGs for PTCs.
Screening of BRAFV600E- associated genes. (A) Result of weighted gene co-expression network analysis; Heatmap represents the modules‐trait relationship between module eigengene and clinical traits; The values in the heatmap represent correlation coefficients; parentheses, p values. ME: Module eigengene. (B) Scatter plots illustrating the correlation between gene significance (GS) and module membership (MM) of genes in module turquoise. The larger the value of MM, the more representative it is in the module. (C) Venn diagram showed the intersection of overlapping DEGs of N-T DEGs and M-W DEGs and genes in turquoise modules.
Function, pathway, and diseases enrichment analyses
Aiming to better study the genetic differences in functions, the GO enrichment analysis, KEGG pathway enrichment analysis, and DO enrichment analysis of 445 BRAFV600E-associated DEGs and 612 non-BRAFV600E-associated DEGs were performed respectively. We obtained the enrichment results on GO and DO, and there was no significant KEGG pathway enriched. The top five most significant enrichment GO terms in each category were shown in figure 3.
Functional enrichment analysis of BRAFV600E- associated genes in comparing that of non BRAFV600E- associated genes. The values in the bubble represent the gene count. mut: BRAFV600E -associated genes; wt: non BRAFV600E -associated genes; BP: biological process; CC: cellular component; MF: molecular function.
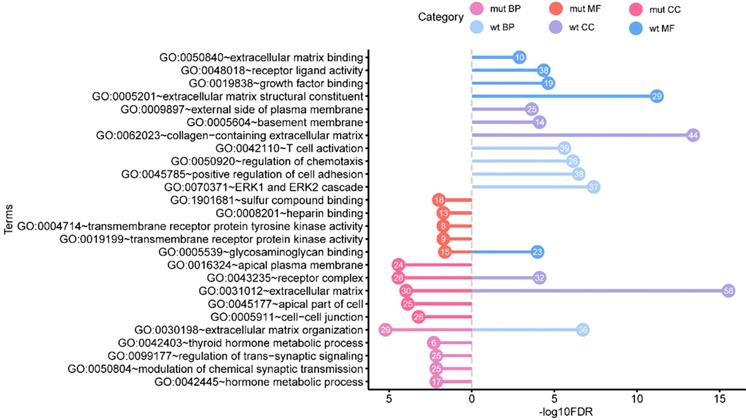
The results of GO include terms of biological process (BP), cellular component (CC), and molecular function (MF). The most significant enrichment terms of BP, CC, MF for the BRAFV600E-associated DEGs were “extracellular matrix organization” (GO: 0030198, FDR = 5.97e-6), “receptor complex” (GO: 0043235, FDR = 3.66e-5) and “sulfur compound binding” (GO: 1901681, FDR = 0.01) respectively. The most significant enrichment terms for the non-BRAFV600E-associated DEGs were “ERK1 and ERK2 cascade” (GO: 0070371, FDR = 4.09e-8), “extracellular matrix” (GO: 0031012, FDR = 2.88e-16), and “extracellular matrix structural constituent” (GO: 1901681, FDR = 8.78e-15) respectively. In these GO terms, “extracellular matrix organization”, “receptor complex” and “extracellular matrix” were their common enrichment GO terms.
The top ten significant enrichment diseases for BRAFV600E-associated and non-associated DEGs diseases were shown in table 3. The most significant DO terms for them was “papillary thyroid carcinoma” (DOID: 3969, FDR=3e-4) and “retinal vascular disease” (DOID: 2462, FDR=3.87e-6) respectively.
Top 10 results of Disease Ontology enrichment analysis for BRAFV600E -associated genes and non BRAFV600E-associated genes
| Terms | Counts | pValue | FDR | Gene Type |
|---|---|---|---|---|
| DOID:3969~papillary thyroid carcinoma | 16 | 5.17E-07 | 0.0003 | BRAFV600E -associated |
| DOID:170~endocrine gland cancer | 39 | 1.14E-06 | 0.0004 | BRAFV600E -associated |
| DOID:3963~thyroid carcinoma | 21 | 4.13E-06 | 0.0009 | BRAFV600E -associated |
| DOID:1781~thyroid cancer | 21 | 1.07E-05 | 0.0017 | BRAFV600E -associated |
| DOID:3113~papillary carcinoma | 8 | 1.49E-04 | 0.0194 | BRAFV600E -associated |
| DOID:10124~corneal disease | 9 | 2.55E-04 | 0.0278 | BRAFV600E -associated |
| DOID:50~thyroid gland disease | 15 | 3.29E-04 | 0.0307 | BRAFV600E -associated |
| DOID:28~endocrine system disease | 27 | 4.22E-04 | 0.0341 | BRAFV600E -associated |
| DOID:4074~pancreas adenocarcinoma | 15 | 4.96E-04 | 0.0341 | BRAFV600E -associated |
| DOID:1793~pancreatic cancer | 23 | 5.88E-04 | 0.0341 | BRAFV600E -associated |
| DOID:2462~retinal vascular disease | 12 | 3.87E-06 | 0.0014 | non BRAFV600E- associated |
| DOID:8947~diabetic retinopathy | 12 | 3.87E-06 | 0.0014 | non BRAFV600E -associated |
| DOID:263~kidney cancer | 38 | 1.06E-05 | 0.0021 | non BRAFV600E -associated |
| DOID:13207~proliferative diabetic retinopathy | 9 | 1.14E-05 | 0.0021 | non BRAFV600E -associated |
| DOID:4451~renal carcinoma | 34 | 1.70E-05 | 0.0023 | non BRAFV600E -associated |
| DOID:3996~urinary system cancer | 41 | 1.90E-05 | 0.0023 | non BRAFV600E -associated |
| DOID:1036~chronic leukemia | 23 | 2.36E-05 | 0.0024 | non BRAFV600E -associated |
| DOID:4450~renal cell carcinoma | 31 | 3.16E-05 | 0.0024 | non BRAFV600E -associated |
| DOID:1107~esophageal carcinoma | 16 | 3.48E-05 | 0.0024 | non BRAFV600E -associated |
| DOID:18~urinary system disease | 39 | 3.52E-05 | 0.0024 | non BRAFV600E -associated |
Targeted drug prediction for BRAFV600E-associated genes
To predict drugs for BRAFV600E-associated genes based on differential co-expression network, R package “DGCA” was applied to explore gene co-expression variations on the 445 BRAFV600E-associated genes. We obtained 22050 significant gene co-expression pairs at the absolute value of the correlation coefficients greater than 0.3 (p-value<0.05). Among these gene pairs, 750 gene pairs with opposite regulation in BRAFV600E and BRAFWT groups were defined as significantly differential co-expression pairs, involving 205 unique genes. Further, the 170 up-regulated genes and 35 down-regulated genes from the 205 genes were used to query the CREEDS database with their opposite signature from 875 manual single drug perturbations. The ranking of the predicted drugs was based on the Signed Jaccard Index, which represents signatures of reverse effects. The top 10 predicted drugs were shown in table 4. As is shown, the top predicted drug was Formoterol, an inhaled beta2-agonist used in the management of chronic obstructive pulmonary disease and asthma[21, 22]. Of note, the vemurafenib (also known as Plx4032), which is one of the most common BRAFV600E inhibitors[23, 24], appeared three times in the scope of the predicted drugs. The above results indicated that genes in the differential co-expression networks were quite associated with BRAFV600E, and might be the downstream target for BRAFV600E inhibitor.
Top 10 predicted drugs for BRAFV600E-associated genes
| ID | Name | GEO ID | Signed Jaccard Index |
|---|---|---|---|
| drug:2631 | Formoterol | GSE30242 | -0.01279 |
| drug:3204 | Tibolone | GSE12446 | -0.0124 |
| drug:2569 | Plx4032 | GSE24862 | -0.01231 |
| drug:3200 | Hypochlorous acid | GSE11630 | -0.0109 |
| drug:3176 | Carboplatin | GSE49577 | -0.01016 |
| drug:2565 | Plx4032 | GSE24862 | -0.00985 |
| drug:3202 | Hypochlorous acid | GSE11630 | -0.0096 |
| drug:3354 | Sodium arsenite | GSE11056 | -0.00945 |
| drug:2509 | Vemurafenib | GSE63790 | -0.00944 |
Construction of co-expression network
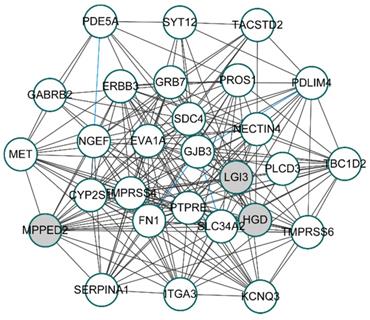
To unveil the genes that play potential key roles, 28 hub genes, whose absolute values of both MM and GS ranked in the top 50, were selected from turquoise modules for constructing the co-expression network. By calculating the correlation coefficients between 28 hub genes with R package “DGCA”, we got 174 significant gene pairs with correlation coefficients greater than 0.3 in both the BRAFV600E group and the BRAFWT group (p-value < 0.05). Based on the correlations among genes, the co-expression network of the 28 hub genes was shown in figure 4. Among the 174 gene pairs, three gene pairs had opposite correlations between the BRAFV600E and the BRAFWT groups.
Co-expression network of top 28 hub genes from BRAFV600E-associated genes. White circles represent the up-regulated genes; Gray circles represent the down-regulated genes; Blue lines represent significant differential co-expression between BRAFV600E and BRAFWT group.
Identified key genes in the networks
To predict the prognostic roles of genes in the co-expression network, relapse-free survival analyses were performed on genes in the above network. We also evaluated the relapse survival time of concomitant gene expression value and BRAF mutation status. Relapse-free survival (RFS) analyses of 464 PTC patients with full clinical information based on sequencing data revealed that higher expression levels of MET, PROS1, SLC34A2, TBC1D2, FN1, PLCD3, and NGEF were related to the shorter survival time of PTC patients (p-value < 0.05). Besides, cases with high expression of the NECTIN4 also showed lower relapse-free probability though the result did not reach statistical significance (p-value = 0.092, figure 5A). These results indicate that these genes might function as oncogenes genes in the development of PTC.
Screening for BRAFV600E-associated prognostic biomarkers. (A) Kaplan-Meier survival curves of eight prognostic biomarkers screened from hub genes. (B) Kaplan-Meier survival curves of prognostic biomarkers with the addictive effect of BRAFV600E mutation. High.mut: high expression of genes with BRAFV600E mutation; High.wt: high expression of genes without BRAFV600E mutation; Low.mut: low expression of genes with BRAFV600E mutation; Low.wt: low expression of genes without BRAFV600E mutation.
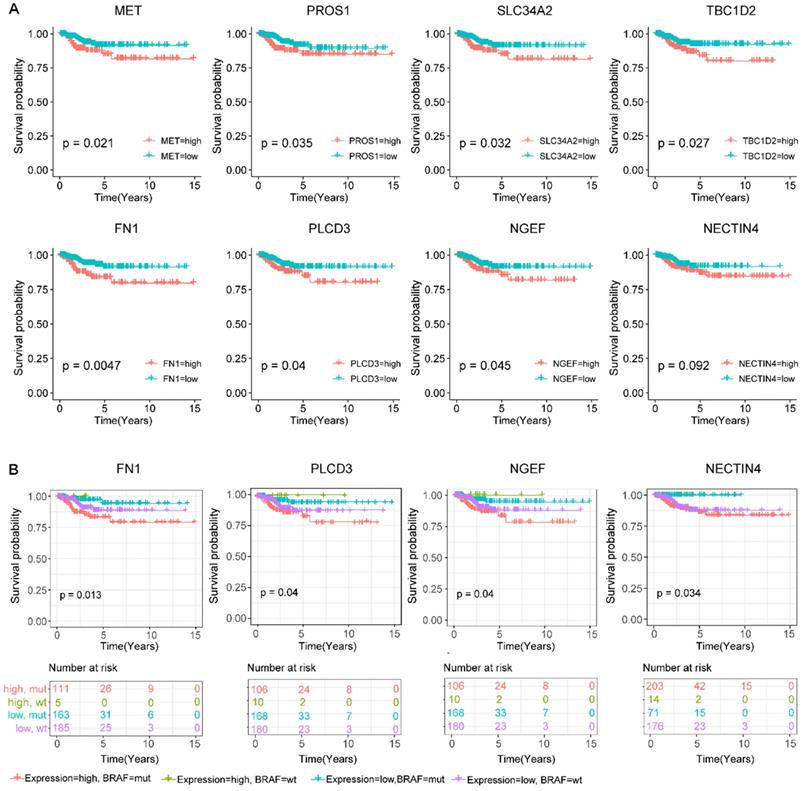
To study the additive effect of BRAF mutations on the prognosis of these genes, we divided all the subjects into four groups based on the presence or absence of BRAFV600E mutations as well as the expression level of the above eight relapse-related genes, including the BRAFV600E high expression group, the BRAFV600E low expression group, the BRAFWT high expression group, and the BRAFWT low expression group. For four genes FN1, PLCD3, NGEF, and NECTIN4, the BRAFV600E high expression group was prone to relapse than the other groups (figure 5B). Of note, the expression level of the NECTIN4 alone though effected on the relapse on PTC without significance, patients with coexistence of the overexpressed NECTIN4 and the BRAFV600E mutation had shorter relapse-free survival time.
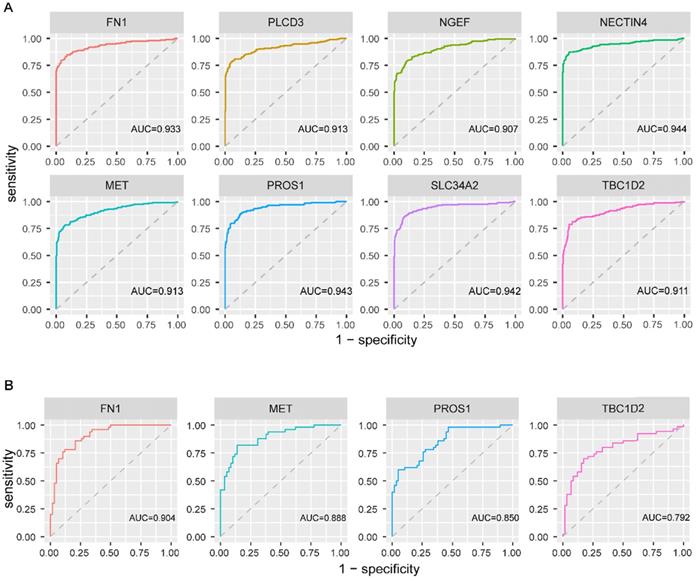
To explore the diagnostic values of the above eight genes, ROC curve analysis was conducted on 482 PTC patients from TCGA. The results revealed that all the eight genes had a good performance in distinguishing PTC patients with BRAFV600E PTC patients from BRAFWT PTC patients, with the AUC exceeded 0.9 (figure 6A). Further, this finding was validated based on 108 PTC cases from three GEO datasets. FN1, MET, PROS1, and TBC1D2 were detected in GEO datasets. Same as in TCGA, the expression value of these 4 genes was higher in the BRAFV600E group than that in the BRAFWT group. The AUC of the ROC analyses for these four genes exceeded 0.7 (figure 6B), indicating their certain diagnostic value for BRAFV600E PTCs in GEO.
Receiver operating characteristic curve analysis and validation of screened biomarkers. (A) Receiver operating characteristic curve analysis of 8 screened biomarkers in TCGA. (B) Receiver operating characteristic curve analysis of 4 biomarkers existed in GEO. AUC: area under the curve
Verification of the differential expression levels of biomarkers at different groups
To validate the differential expression levels of the biomarkers we screened, their expression patterns were further analyzed in the GEO database. Though there were only 4 of them, including FN1, MET, PROS1, and TBC1D2, were detected in the GEO database, their expression patterns at different BRAFV600E status in GEO were in accordance with that in TCGA database (Figure 7A).
Validation of the different expression levels of the biomarkers at different groups. (A) Box plot of FN1, MET, PROS1 and TBC1D2 expression at different BRAF mutation status in papillary thyroid carcinoma existed in the GEO database. Y-axis represents the log2 transformation of RNAseq-HT seq FPKM‐UQ+1. FPKM‐UQ: upper quartile FPKM, a modified FPKM calculation (FPKM: fragments perper Kilobase of transcript perper Million mapped reads); HTseq: high‐throughput sequencing; RNAseq: RNA sequencing. (B) qPCR validation of two novel biomarkers expression levels between matched normal and tumor tissues from patients with papillary thyroid carcinoma. (C) qPCR validation of two novel biomarkers expression levels at different BRAF mutation status in papillary thyroid carcinoma. * * *:p < .001; NS: No Significance.
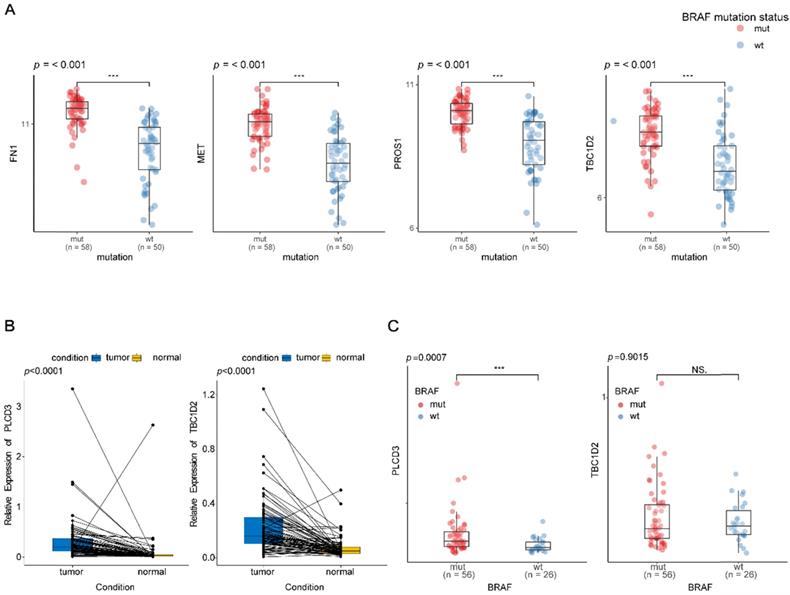
As the expression patterns of TBC1D2 and PLCD3 in PTC have not been reported in existing studies, qRT-PCR was used to validate the expressions of two novel recurrence-associated biomarkers in our hub co-expression network from WGCNA (TBC1D2 and PLCD3). The results in figure 7B showed that there were significant differences for two genes between normal tissues and tumor tissues from PTC patients (p<0.0001). PLCD3 was significantly overexpressed in the BRAFV600E PTC patients compared with BRAFWT patients (p=0.0007). However, no statistical significance was found for the differential expression of TBC1D2 between BRAFWT and BRAFV600E patients (p=0.9015). Whereas both the two genes appeared a high expression tendency in the BRAFV600E patients (Figure 7C).
Discussion
In this study, we screened BRAFV600E-associated genes in PTC based on differentially expressed gene analyses and WGCNA. Comprehensive analyses were performed through functional enrichment, targeted drug prediction, and hub genes screening. Finally, we identified eight BRAFV600E-associated key genes related to the relapse of PTC from the co-expression network based on hub genes. ROC analysis conformed eight genes could serve as biomarker candidates to distinguish BRAFV600E PTC from BRAFWT PTC. Based on the findings for prognosis and diagnosis and the prediction of targeted drugs, we obtained several potential targeted drugs that could be used in combination with BRAFi in the treatment of BRAFV600E PTC to overcome their resistance to BRAFi.
Functional enrichment analysis showed that although BRAFV600E-associated genes and non-BRAFV600E-associated genes were enriched in several common functions, their differences are more significant. It was noteworthy that "ERK1 and ERK2 cascade" was the most significantly enriched GO terms of non-BRAFV600E-associated genes but not the BRAFV600E-associated genes, corresponding with the fact that BRAFV600E mutation caused abnormal regulation of MAPK and its downstream EKR signaling pathway[25]. For MF, the enrichment result indicated BRAFV600E-associated genes were not only enriched in binding to sulfide and heparin but also played a certain role in the activity of receptor kinases and tyrosine kinases, which has been confirmed in a variety of BRAF mutant tumors, including thyroid cancer, colorectal cancer, melanoma, etc[26-30]. For CC, compared with the result of functional enrichment of non-BRAFV600E-associated genes, BRAFV600E-associated genes were mainly enriched in the “apical part of cell”, “apical plasma of cell,” and “cell-cell junction”, indicating that BRAF mutations might play roles in the connection and interaction of tumor cells. Enrichment in BP function indicated that BRAF mutations may cause changes in the synthesis and metabolism of hormones and compounds which were related to the thyroid gland. The results of DO enrichment analyses suggested that BRAFV600E-associated genes were enriched in “papillary thyroid carcinoma”, while non- BRAFV600E-associated genes were enriched in “retinal vascular disease” respectively. This result indicated that BRAFV600E-associated genes we screened with WGCNA based on DEGs were more related to PTC.
Among the top ten drugs predicted by genes based on differential co-expressed network, vemurafenib is a classical BRAFi applied in a variety of cancers with BRAFV600E mutation, including PTC [27, 31, 32]. This finding further illustrated there was a certain correlation between the BRAFV600E mutation and the genes we identified. Carboplatin, an antineoplastic agent, was used to treat various forms of cancer, especially advanced ovarian carcinoma[33]. It has been reported that a BRAFV600E PTC patient with tall cell variant and squamous transformation responded well to treatment with concurrent chemotherapy with carboplatin and paclitaxel along with radiation[34]. Carboplatin/paclitaxel could also be used in the chemotherapy of anaplastic thyroid cancer (ATC)[35]. The combination of vemurafenib, carboplatin, and paclitaxel demonstrated certain tolerance and activity in patients with advanced melanoma and BRAFV600E mutations[36]. Therefore, carboplatin/ paclitaxel combining with BRAFi may also be a feasible treatment strategy for advanced PTC and ATC, especially those with BRAFV600E mutation. Other drugs predicted by genes in the differential co-expression network seemed to be unrelated to thyroid cancer.
For the eight key genes screened in this study, although only four of them reappeared in the GEO database, their expression patterns and diagnostic value were consistent with our analysis in TCGA, indicating the reliability of our result. MET and FN1 were the two genes that have been confirmed as oncogenes associated with BRAF mutations in PTC. In PTC and melanoma, the upregulation of MET and ERBB3 expression level induced by BRAFi conferred BRAFi resistance to BRAFV600E mutant carcinomas, and inhibitors of MET and ERBB family could reserve the resistance to BRAFi effectively[37-41]. ERBB3 was also a hub gene in our hub co-expression network. The efficacy of MET inhibitor combining ERBB family inhibitor has been validated in cutaneous malignant melanoma[42]. Combining with our analysis, these existed researches suggesting the combination of MET and ERBB inhibitors was a potential therapeutic strategy for PTC with resistance to BRAFi. In accordance with our findings, FN1 was a well-known prognostic biomarker associated with BRAFV600E mutation and the recurrence of thyroid cancer[43, 44]. Multiple studies have shown that high expression of FN1 was related to aggressiveness and BRAFV600E mutation in PTC [45, 46].
For the rest six genes, SLC34A2, PROS1, NACTIN4, and NGEF were the genes that had been confirmed to be up-regulated in PTC, but there was no direct evidence for their association with BRAFV600E mutation. SLC34A2 was an oncogene highly expressed in a variety of tumors, including lung, ovarian, colorectal, and thyroid cancer, and was associated with tumor metastasis and recurrence of colorectal and thyroid cancer[47-50]. In vivo, experiments showed that SLC34A2 inhibition combining with MK2206 (an allosteric AKT1/2 inhibitor), exhibited significant antitumorigenic potential[48]. Anti-NaPi2b antibody-drug conjugate (ADC), a targeted ADC for SLC34A2, was also proven to be effective and safe in non-small cell lung cancer and ovarian cancer[51]. Although the effectiveness of this drug for PTC has not been explored yet, we associated it with BRAF mutations for the first time, providing a theoretical basis for the combination therapy of SLC34A2 inhibition and BRAFi. The underlying functions of PROS1 and NGEF in PTC need further exploration. As one of the ligands for the TAM (Tyro3, Axl, and Mertk) receptor tyrosine kinases, PROS1 was proven to be a strong stimulator of p-Erk through ProS1-Tyro3-Erk signaling pathway in some human cancer cell lines[52], which indicated PROS1 may also participate in the ERK pathway downstream of BRAFV600E. NATIN4 was reported to be associated with lymph node metastasis and function as a promoter in the colony formation, proliferation, migration, and invasion of PTC cell lines[53]. TBC1D2 and PLCD3 were two novel potential biomarkers without previous reports for PTCs. Nevertheless, our qRT-PCR experiments confirmed their high expression in PTC tumor tissues compared to normal tissues. The experimental results did not indicate a statistical difference in the expression of TBC1D2 between the BRAFV600E PTC patients and BRAFWT PTC patients possible due to the fact that our sample size was insufficient to reflect statistical significance. Whereas the tendency of the TBC1D2 and PLCD3 expression levels in BRAFV600E PTC patients and BRAFWT PTC patients were consistent with our bioinformatics analysis results, that is, the expression value of both the two genes were higher in BRAFV600E PTC patients. However, the function and the relationship with BRAFV600E of these genes need further experimental investigation.
In conclusion, through a comprehensive analysis of BRAFV600E-associated genes and their hub co-expression networks, we had further understood the functional differences between the BRAFV600E- associated genes and the non-BRAFV600E-associated genes. Eight BRAFV600E -associated biomarkers with both prognostic and diagnostic values were identified, and six of them were the novel findings related to BRAFV600E mutation in PTC. Based on the literature review of these biomarker candidates and the prediction of targeted drugs for genes from a differentially co-expressed network, we obtained four potential drugs that could be used in combination with BRAFi for PTC therapy, including MET inhibitor, ERBB3 inhibitor, anti-NaPi2b ADC, and carboplatin. Our findings had a certain theoretical value for accurate personalized treatment of PTC to obtain a better harm-benefit balance and provided new ideas for overcoming the resistance to BRAFi.
However, there are still some limitations to our study. Since the expression data from GEO were expression profiling by array, some genes in TCGA could not be found in GEO expression profiling, only four of our key genes have been verified. Limited by our sample scale, the difference in the expression of the two novel genes between the BRAFV600E and BRAFWT groups has not been fully experimentally confirmed. Besides, for biomarkers with unclear function and molecular mechanisms, our bioinformatics analysis only played a predictive role, and their function and potential as a drug target need to be validated by further experimental and clinical research.
Abbreviations
PTC: papillary thyroid cancer; BRAF: B-type Raf kinase; BRAFV600E: B-type Raf kinase V600E mutation; BRAFi: BRAF inhibitors; BRAFWT: BRAF wild-type; TCGA: The Cancer Genome Atlas; CREEDS: crowd extracted expression of differential signatures; ROC: receiver operating characteristic; WGCNA: weighted gene co-expression network analysis; GEO: Gene Expression Omnibus; CPM: counts per million; DEG: differentially expressed gene; N-T DEGs: DEGs between normal tissues and tumor tissues; WT-V600E DEGs: DEGs between BRAF wide type and BRAFV600E tumor tissues; MM: module membership; GS: Gene Significance; GO: Gene Ontology; KEGG: Kyoto Encyclopedia of Genes and Genomes; DO: Disease Ontology; FDR: false discovery rate; BP: biological process; CC: cellular component; MF: molecular function; RFS: relapse-free survival; ATC: anaplastic thyroid cancer.
Acknowledgements
We are grateful for China-Japan Union Hospital of Jilin University for providing clinical tissue samples of PTC cases.
Funding
This research was funded by the National Natural Science Foundation of China, grant number 81671716 and 81671736, and supported by Shanghai Shenkang Three Years Action Project, grant number 16CR2032B, Shanghai Science and Technology Commission Support Plan, grant number 18441903500; Shanghai Outstanding Academic Leader program with number: 18XD1403000 and The Scientific Research Foundation of Jilin Province (nos. 20200601010JC and 20190701061GH).
Ethics Committee Approval and Patient Consent
All procedures performed in studies involving human participants were approved by the Ethical Committee of China-Japan Union Hospital of Jilin University. The experimental procedures have been carried out in accordance with the ethical standards of Declaration of Helsinki. The approval of data utilization of GEO dataset can be retrieved from https://www.ncbi.nlm.nih.gov/geo/info/disclaimer.html, and the approval of data utilization of the TCGA dataset can be retrieved from https://www.cancer.gov/about-nci/organization/ccg/research/structural-genomics/tcga.
Data availability statement
Data are available upon reasonable request.
Authors' contributions
CY.J, YL.H, and XQ.Y contributed in the conception and design of the study; Z.L, HY.S, XL.C, T.L and LL.C contributed in the collection of case information and tissue samples; YL.H, XQ.Y and YZ.Y performed the experiments validation. YL.H and YN.L organized the database; YL.H, D.F, ZL.L performed the statistical analysis; YL.H and XQ.Y wrote the first draft of the manuscript; All authors approved the submitted version.
Competing Interests
The authors have declared that no competing interest exists.
References
1. Shen X, Zhu G, Liu R, Viola D, Elisei R, Puxeddu E. et al. Patient Age-Associated Mortality Risk Is Differentiated by BRAF V600E Status in Papillary Thyroid Cancer. J Clin Oncol. 2018;36:438-445
2. Wang F, Zhao S, Shen X, Zhu G, Liu R, Viola D. et al. BRAF V600E Confers Male Sex Disease-Specific Mortality Risk in Patients With Papillary Thyroid Cancer. J Clin Oncol. 2018;36:2787-2795
3. Mao Y, Xing M. Recent incidences and differential trends of thyroid cancer in the USA. Endocr Relat Cancer. 2016;23:313-322
4. Liu R, Bishop J, Zhu G, Zhang T, Ladenson PW, Xing M. Mortality Risk Stratification by Combining BRAF V600E and TERT Promoter Mutations in Papillary Thyroid Cancer: Genetic Duet of BRAF and TERT Promoter Mutations in Thyroid Cancer Mortality. JAMA Oncol. 2017;3:202-208
5. Huang Y, Qu S, Zhu G, Wang F, Liu R, Shen X. et al. BRAF V600E Mutation-Assisted Risk Stratification of Solitary Intrathyroidal Papillary Thyroid Cancer for Precision Treatment. J Natl Cancer Inst. 2018;110:362-370
6. Xing M, Alzahrani AS, Carson KA, Viola D, Elisei R, Bendlova B. et al. Association between BRAF V600E mutation and mortality in patients with papillary thyroid cancer. JAMA. 2013;309:1493-1501
7. Gąsior-Perczak D, Kowalik A, Walczyk A, Siołek M, Gruszczyński K, Pałyga I. et al. Coexisting Germline CHEK2 and Somatic BRAF(V600E) Mutations in Papillary Thyroid Cancer and Their Association with Clinicopathological Features and Disease Course. Cancers (Basel). 2019;11:1744
8. Crispo F, Notarangelo T, Pietrafesa M, Lettini G, Storto G, Sgambato A. et al. BRAF Inhibitors in Thyroid Cancer: Clinical Impact, Mechanisms of Resistance and Future Perspectives. Cancers (Basel). 2019;11:1388
9. Notarangelo T, Sisinni L, Trino S, Calice G, Simeon V, Landriscina M. IL6/STAT3 axis mediates resistance to BRAF inhibitors in thyroid carcinoma cells. Cancer Lett. 2018;433:147-155
10. Prete A, Lo AS, Sadow PM, Bhasin SS, Antonello ZA, Vodopivec DM. et al. Pericytes Elicit Resistance to Vemurafenib and Sorafenib Therapy in Thyroid Carcinoma via the TSP-1/TGFβ1 Axis. Clin Cancer Res. 2018;24:6078-6097
11. Yu X, Zhong P, Han Y, Huang Q, Wang J, Jia C. et al. Key candidate genes associated with BRAF(V600E) in papillary thyroid carcinoma on microarray analysis. J Cell Physiol. 2019;234:23369-23378
12. Langfelder P, Horvath S. WGCNA: an R package for weighted correlation network analysis. BMC Bioinformatics. 2008;9:559-559
13. Xu X, Long H, Xi B, Ji B, Li Z, Dang Y. et al. Molecular Network-Based Drug Prediction in Thyroid Cancer. Int J Mol Sci. 2019;20:263
14. McKenzie AT, Katsyv I, Song W-M, Wang M, Zhang B. DGCA: A comprehensive R package for Differential Gene Correlation Analysis. BMC Syst Biol. 2016;10:106-106
15. Wang Z, Monteiro CD, Jagodnik KM, Fernandez NF, Gundersen GW, Rouillard AD. et al. Extraction and analysis of signatures from the Gene Expression Omnibus by the crowd. Nature Communications. 2016;7:12846
16. Mounir M, Lucchetta M, Silva TC, Olsen C, Bontempi G, Chen X. et al. New functionalities in the TCGAbiolinks package for the study and integration of cancer data from GDC and GTEx. PLoS Comput Biol. 2019;15:e1006701-e1006701
17. Li R, Qu H, Wang S, Wei J, Zhang L, Ma R. et al. GDCRNATools: an R/Bioconductor package for integrative analysis of lncRNA, miRNA and mRNA data in GDC. Bioinformatics. 2018;34:2515-2517
18. Wang S LX. The UCSCXenaTools R package: a toolkit for accessing genomics data from UCSC Xena platform, from cancer multi-omics to single-cell RNA-seq. Journal of Open Source Software. 2019;40:1627
19. Love MI, Huber W, Anders S. Moderated estimation of fold change and dispersion for RNA-seq data with DESeq2. Genome Biol. 2014;15:550-550
20. Li N, Zhan X. Identification of clinical trait-related lncRNA and mRNA biomarkers with weighted gene co-expression network analysis as useful tool for personalized medicine in ovarian cancer. EPMA J. 2019;10:273-290
21. Bartow RA, Brogden RN. Formoterol. An update of its pharmacological properties and therapeutic efficacy in the management of asthma. Drugs. 1998;55:303-322
22. Tronde A, Gillen M, Borgström L, Lötvall J, Ankerst J. Pharmacokinetics of budesonide and formoterol administered via 1 pressurized metered-dose inhaler in patients with asthma and COPD. J Clin Pharmacol. 2008;48:1300-1308
23. Kim G, McKee AE, Ning Y-M, Hazarika M, Theoret M, Johnson JR. et al. FDA approval summary: vemurafenib for treatment of unresectable or metastatic melanoma with the BRAFV600E mutation. Clin Cancer Res. 2014;20:4994-5000
24. Hyman DM, Puzanov I, Subbiah V, Faris JE, Chau I, Blay J-Y. et al. Vemurafenib in Multiple Nonmelanoma Cancers with BRAF V600 Mutations. N Engl J Med. 2015;373:726-736
25. Zaballos MA, Acuña-Ruiz A, Morante M, Crespo P, Santisteban P. Regulators of the RAS-ERK pathway as therapeutic targets in thyroid cancer. Endocr Relat Cancer. 2019;26:R319-R344
26. Durante C, Tallini G, Puxeddu E, Sponziello M, Moretti S, Ligorio C. et al. BRAF(V600E) mutation and expression of proangiogenic molecular markers in papillary thyroid carcinomas. Eur J Endocrinol. 2011;165:455-463
27. Herr R, Halbach S, Heizmann M, Busch H, Boerries M, Brummer T. BRAF inhibition upregulates a variety of receptor tyrosine kinases and their downstream effector Gab2 in colorectal cancer cell lines. Oncogene. 2018;37:1576-1593
28. Xuan Z, Huang J, Gao L, Wang Y, Wang J, Sun Y. Receptor Tyrosine Kinase EphB3: a Prognostic Indicator in Colorectal Carcinoma. Pathol Oncol Res. 2018 10.1007/s12253-12018-10562-x
29. Capparelli C, Rosenbaum S, Berger AC, Aplin AE. Fibroblast-derived neuregulin 1 promotes compensatory ErbB3 receptor signaling in mutant BRAF melanoma. J Biol Chem. 2015;290:24267-24277
30. Hinoue T, Weisenberger DJ, Pan F, Campan M, Kim M, Young J. et al. Analysis of the association between CIMP and BRAF in colorectal cancer by DNA methylation profiling. PLoS One. 2009;4:e8357-e8357
31. Dadu R, Shah K, Busaidy NL, Waguespack SG, Habra MA, Ying AK. et al. Efficacy and tolerability of vemurafenib in patients with BRAF(V600E) -positive papillary thyroid cancer: M.D. Anderson Cancer Center off label experience. J Clin Endocrinol Metab. 2015;100:E77-E81
32. Luke JJ, Hodi FS. Vemurafenib and BRAF inhibition: a new class of treatment for metastatic melanoma. Clin Cancer Res. 2012 18
33. Kuittinen T, Rovio P, Luukkaala T, Laurila M, Grénman S, Kallioniemi A. et al. Paclitaxel, Carboplatin and 1,25-D3 Inhibit Proliferation of Ovarian Cancer Cells. Anticancer Res. 2020;40:3129-3138
34. Basnet A, Pandita A, Fullmer J, Sivapiragasam A. Squamous Cell Carcinoma of the Thyroid as a Result of Anaplastic Transformation from BRAF-Positive Papillary Thyroid Cancer. Case Rep Oncol Med. 2017;2017:4276435-4276435
35. Haddad RI, Lydiatt WM, Ball DW, Busaidy NL, Byrd D, Callender G. et al. Anaplastic Thyroid Carcinoma, Version 2.2015. J Natl Compr Canc Netw. 2015;13:1140-1150
36. Bhatty M, Kato S, Piha-Paul SA, Naing A, Subbiah V, Huang HJ. et al. Phase 1 study of the combination of vemurafenib, carboplatin, and paclitaxel in patients with BRAF-mutated melanoma and other advanced malignancies. Cancer. 2019;125:463-472
37. Knauf JA, Luckett KA, Chen K-Y, Voza F, Socci ND, Ghossein R. et al. Hgf/Met activation mediates resistance to BRAF inhibition in murine anaplastic thyroid cancers. J Clin Invest. 2018;128:4086-4097
38. Montero-Conde C, Ruiz-Llorente S, Dominguez JM, Knauf JA, Viale A, Sherman EJ. et al. Relief of feedback inhibition of HER3 transcription by RAF and MEK inhibitors attenuates their antitumor effects in BRAF-mutant thyroid carcinomas. Cancer Discov. 2013;3:520-533
39. Caenepeel S, Cooke K, Wadsworth S, Huang G, Robert L, Moreno BH. et al. MAPK pathway inhibition induces MET and GAB1 levels, priming BRAF mutant melanoma for rescue by hepatocyte growth factor. Oncotarget. 2017;8:17795-17809
40. Han S, Ren Y, He W, Liu H, Zhi Z, Zhu X. et al. ERK-mediated phosphorylation regulates SOX10 sumoylation and targets expression in mutant BRAF melanoma. Nature communications. 2018;9:28-28
41. Kugel CH 3rd, Hartsough EJ, Davies MA, Setiady YY, Aplin AE. Function-blocking ERBB3 antibody inhibits the adaptive response to RAF inhibitor. Cancer Res. 2014;74:4122-4132
42. Das I, Wilhelm M, Höiom V, Franco Marquez R, Costa Svedman F, Hansson J. et al. Combining ERBB family and MET inhibitors is an effective therapeutic strategy in cutaneous malignant melanoma independent of BRAF/NRAS mutation status. Cell Death Dis. 2019;10:663-663
43. Zhan S, Li J, Wang T, Ge W. Quantitative Proteomics Analysis of Sporadic Medullary Thyroid Cancer Reveals FN1 as a Potential Novel Candidate Prognostic Biomarker. Oncologist. 2018;23:1415-1425
44. Griffith OL, Melck A, Jones SJM, Wiseman SM. Meta-analysis and meta-review of thyroid cancer gene expression profiling studies identifies important diagnostic biomarkers. J Clin Oncol. 2006;24:5043-5051
45. Sponziello M, Rosignolo F, Celano M, Maggisano V, Pecce V, De Rose RF. et al. Fibronectin-1 expression is increased in aggressive thyroid cancer and favors the migration and invasion of cancer cells. Mol Cell Endocrinol. 2016;431:123-132
46. Rodrigues R, Roque L, Espadinha C, Pinto A, Domingues R, Dinis J. et al. Comparative genomic hybridization, BRAF, RAS, RET, and oligo-array analysis in aneuploid papillary thyroid carcinomas. Oncol Rep. 2007;18:917-926
47. Liu L, Yang Y, Zhou X, Yan X, Wu Z. Solute carrier family 34 member 2 overexpression contributes to tumor growth and poor patient survival in colorectal cancer. Biomed Pharmacother. 2018;99:645-654
48. He J, Zhou M, Li X, Gu S, Cao Y, Xing T. et al. SLC34A2 simultaneously promotes papillary thyroid carcinoma growth and invasion through distinct mechanisms. Oncogene. 2020 10.1038/s41388-41020-41181-z
49. Wang Y, Yang W, Pu Q, Yang Y, Ye S, Ma Q. et al. The effects and mechanisms of SLC34A2 in tumorigenesis and progression of human non-small cell lung cancer. J Biomed Sci. 2015;22:52-52
50. Levan K, Mehryar M, Mateoiu C, Albertsson P, Bäck T, Sundfeldt K. Immunohistochemical evaluation of epithelial ovarian carcinomas identifies three different expression patterns of the MX35 antigen, NaPi2b. BMC Cancer. 2017;17:303-303
51. Lin K, Rubinfeld B, Zhang C, Firestein R, Harstad E, Roth L. et al. Preclinical Development of an Anti-NaPi2b (SLC34A2) Antibody-Drug Conjugate as a Therapeutic for Non-Small Cell Lung and Ovarian Cancers. Clin Cancer Res. 2015;21:5139-5150
52. Al Kafri N, Hafizi S. Tumour-Secreted Protein S (ProS1) Activates a Tyro3-Erk Signalling Axis and Protects Cancer Cells from Apoptosis. Cancers (Basel). 2019;11:1843
53. Hao R-T, Zheng C, Wu C-Y, Xia E-J, Zhou X-F, Quan R-D. et al. NECTIN4 promotes papillary thyroid cancer cell proliferation, migration, and invasion and triggers EMT by activating AKT. Cancer Manag Res. 2019;11:2565-2578
Author contact
![]() Corresponding authors: Xianling Cong, congxledu.cn; Shen Qu, qushencncom.
Corresponding authors: Xianling Cong, congxledu.cn; Shen Qu, qushencncom.