Impact Factor ISSN: 1837-9664

 Global reach, higher impact
J Cancer 2021; 12(10):2877-2885. doi:10.7150/jca.46621 This issue Cite
Research Paper
Application of machine learning in prediction of Chemotherapy resistant of Ovarian Cancer based on Gut Microbiota
Ting-Ting Gong1, Xin-Hui He2, Song Gao2, Qi-Jun Wu1 ![]()
1. Department of Obstetrics and Gynecology, Shengjing Hospital of China Medical University, Shenyang, China.
2. Department of Clinical Epidemiology, Shengjing Hospital of China Medical University, Shenyang, China.
Received 2020-4-3; Accepted 2021-3-3; Published 2021-3-15
Abstract

Background: Ovarian cancer (OC) has the highest mortality among gynecological malignancies, and resistance to chemotherapy drugs is common. We aim to develop a machine learning approach based on gut microbiota to predict the chemotherapy resistance of OC.
Methods: The study included patients diagnosed with OC by pathology and treated with platinum and paclitaxel in Shengjing Hospital of China Medical University between 2017 and 2018. Fecal samples were collected from patients, and 16S rRNA sequencing was used to analyze the differences in gut microbiota between OC patients with and without chemotherapy resistance. Nine machine learning classifiers were used to derive the chemotherapy resistance of OC from gut microbiota.
Results: A total of 77 chemoresistant OC patients and 97 chemosensitive OC patients were enrolled. The gut microbiota diversity was higher in OC patients with chemotherapy resistance. There were statistically significant differences between the two groups in Shannon indexes (P <0.05) and Simpson indexes (P <0.05). Machine learning techniques can predict the chemoresistance of OC, and the random forest showed the best performance among all models. The area under the ROC curve for RF model was 0.909.
Conclusions: The diversity of gut microbiota was higher in OC patients with chemotherapy resistance. Further studies are warranted to validate our findings based on machine learning techniques.
Keywords: gut microbiota, ovarian cancer, chemoresistant, machine learning, random forest
Introduction
Ovarian cancer (OC) is the leading cause of mortality among gynecologic malignancies worldwide, although the burden estimates (e.g. incidence, prevalence, and mortality) of this disease show a decrease in recent decades [1,2]. Because of the lack of specific symptoms, most OC patients are diagnosed at late stages [3]. Platinum and paclitaxel are currently the first-line chemotherapy regimens for OC. However, despite advances in treatment modalities, the prognosis of patients with OC remains poor. Approximately 20% to 30% of OC patients show recurrence or disease progression within 6 months after chemotherapy, and the median overall survival is approximately 12-18 months, requiring repeated systemic treatment [1]. Additionally, intrinsic resistance occurs in approximately 15-25% of patients with OC, and almost all patients with recurrent disease ultimately develop platinum resistance, which can result in death [5,6]. Chemotherapy resistance is related to multiple mechanisms such as alterations in the transport and cellular turnover of the drug and nonspecific cytoplasmic defense systems and DNA repair molecular systems [7]. Many studies have looked into resistance mechanisms in the past and have provided insight into platinum resistance.
The intestinal microbiome plays a crucial role in modulating the risk of several chronic diseases, including obesity [8,9], cardiovascular disease [10], metabolic abnormalities [11], and cancer [12]. The delicate balance of the intestinal microbiome composition is essential for maintaining intestinal immunity and whole-body homeostasis [13]. Gut microbiota imbalance is closely related to the occurrence of cancers [14,15]. Imbalance of the intestinal microbiota can be transferred to adjoining organs or even to distant organs through the blood [13]. For example, the gut microbiota can affect the liver, activating the immune system and causing necrosis and apoptosis of liver cells, which can lead to the formation of severe fibrosis and even liver cancer [16]. A recent report showed that Fusobacterium nucleatum promotes chemoresistance in colorectal cancer by inducing autophagy and selective loss of miR-18a* and miR-4802 in cancer cells [17].
In OC, Chase et al. published a review and demonstrated that the microbiota is linked to OC initiation and progression through effects on intestinal inflammation and tumor-related signaling pathways [18]. A recent study showed that the microbial composition and its alterations are associated with OC, as the diversity and richness indexes were significantly decreased in OC tissues [19]. The ratio of the two phyla for Proteobacteria/Firmicutes is increased in OC, and a set of genes named human antibacterial-response genes that include inflammation-associated or immune-associated genes are involved in OC initiation and progression [19]. However, the relationship between the gut microbiota and chemotherapy resistance in OC patients has not been investigated to date.
Unlike traditional prediction models (e.g., logistic regression), modern machine learning can automatically learn the underlying patterns of data without any implicit assumptions. It has become an alternative method for developing prediction models [20]. In this study, we firstly use 16S rRNA sequencing technology to characterize the overall structure of gut microbiota in chemoresistant and chemosensitive OC patients. Furthermore, machine learning is used to find the key microbiota that can predict the chemotherapy response of OC.
Materials and methods
Patient enrollment and sample collection
This study was a case-control study conducted at Shengjing Hospital of China Medical University (Shenyang, China) between 2017 and 2018. The inclusion criteria were patients aged 18-75 years who were diagnosed with OC by pathology and who had complete medical records. All enrolled patients received optimally and maximally cytoreduced surgery. And all patients took carboplatin and taxol as the primary chemotherapy regimens, no other chemotherapy drugs such as bevacizumab were used. According to the 2016 clinical practice guidelines in OC published by the National Comprehensive Cancer Network, chemotherapy resistant was defined as an initial response to chemotherapy followed by relapse within 6 months of the completion of chemotherapy [21]. Chemotherapy sensitive was defined as a clear response to chemotherapy treatment and relapsed after more than 6 months of the completion of chemotherapy treatment. Subjects who had taken antibiotics or probiotics in the past 1 month were excluded. Subjects who receiving neoadjuvant chemotherapy were also excluded. The above information was obtained from medical records. Chemoresistant OC patients were selected as the case group, and chemosensitive patients matched by age, International Federation of Gynecology and Obstetrics (FIGO) stage, and pathological classification were selected as the control group. This study was approved by the Ethics Committee of Shengjing Hospital of China Medical University (2015PS38K). The clinical information of this study was extracted from the electronic medical record system of Shengjing Hospital of China Medical University, fully protect the privacy of patients. Stool samples were collected after routine diagnosis and treatment in clinic, which did no harm to patients.
Sample collection, DNA extraction, and 16S rRNA gene amplification sequencing
Fecal samples were collected at the hospital before each chemotherapy. Fresh fecal samples were collected from enrolled patients after natural defection in the clean toilet, using the scoop in the collection tube take 3-5 g fecal and place in the collection tube. Then used sterilized 2.5 mL tubes containing pure ethanol and frozen at -80 °C until DNA extraction [22]. Total DNA from fecal samples was extracted using the Cetyltrimethylammonium bromide method [23]. DNA concentration and purity were monitored on 1% agarose gels. According to the concentration, DNA was diluted to 1 ng/μL using sterile water. Amplification and sequencing of the V4 hypervariable region of the 16S rRNA gene was performed using the validated, region-specific bacterial primers 515F (5′-GTGCCAGCMGCCGCGGTAA-3′) and 806R (5′-GGACTACHVGGGTWTCTAAT-3′) [24]. 16S rRNA genes were amplified used the specific primer with the barcode. All PCR reactions were carried out in 30 μL reactions with 15 μL of Phusion® High-Fidelity PCR Master Mix (New England Biolabs), 0.2 μM of forward and reverse primers, and 10 ng template DNA. Thermal cycling consisted of initial denaturation at 98 °C for 1 min, followed by 30 cycles of denaturation at 98 °C for 10 s, annealing at 50 °C for 30 s, and elongation at 72 °C for 30 s, with a final step at 72 °C for 5 min. Amplified products from fecal samples were verified by gel electrophoresis using 5 mL of the PCR reaction mixture in a 2% agarose gel. The PCR products were purified using the GeneJET Gel Extraction Kit (Thermo Scientific). Sequencing libraries were generated using NEB Next® Ultra™ DNA Library Prep Kit for Illumina (NEB, USA) following the manufacturer's recommendations, and index codes were added. The library quality was assessed on the Qubit@ 2.0 Fluorometer (Thermo Scientific) and Agilent Bioanalyzer 2100 system. The library was sequenced on an Illumina HiSeq platform and 250 bp paired-end reads were generated.
Analysis of 16S rRNA gene sequences
Sequences were analyzed using the Quantitative Insights Into Microbial Ecology (QIIME) software package [25], and in-house Perl scripts were used to analyze alpha-(within samples) and beta-(among samples) diversity. First, reads were filtered by QIIME quality filters. Then, pick_de_novo_otus.py was used to pick operational taxonomic units (OTUs) by generating an OTU table. Sequences with ≥ 97% similarity were assigned to the same OTUs. Representative sequences for each OTU were selected, and the RDP classifier was used to annotate taxonomic information for each representative sequence [26]. The OTUs that reached a 97-nucleotide similarity level were used for alpha diversity (Shannon, Simpson index) and richness analysis (ACE and Chao1, respectively). Rarefaction curves and Rank-Abundance curve were generated based on these three metrics.
Construction of gut bacterial database and data preprocessing
The main purpose of this study was to develop a machine learning approach based on gut microbiota. The relative abundance of gut microbiota was used to construct the database. Those unclear gut microbiota were eliminated. Since the relative abundance value of all data is too small, -log10 is used for processing, and the missing value is treated as -log10 (1e-10).
Supervised machine learning classifiers
In this study, nine types of supervised machine learning classifiers, including Naive Bayes (NB), Generalized Linear Model (GLM), Logistic Regression (LR), Fast Large Margin (FLM), Deep Learn (DL), Decision Tree (DT), Random Forest (RF), Gradient Boosted Trees (GBT), and Support Vector Machine (SVM) were assessed [27]. All machine learning classifiers were implemented using RapidMiner (9.5.001) with the default parameters.
Random Forest model classifier
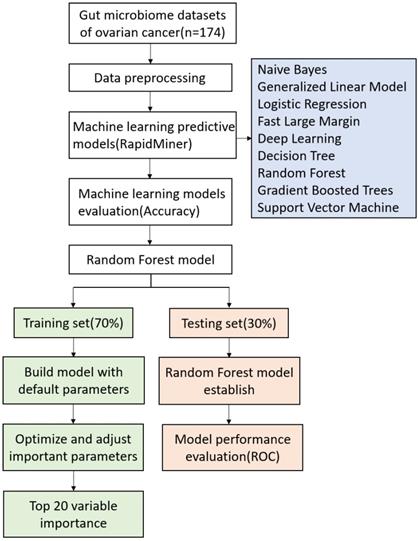
The random forest (RF) was implemented using the randomforest package in R (http://cran.r-project.org//). RF classification is an ensemble learning method widely used for classification of large data [28]. Random forest classification algorithm is based on the constructing multiple decision trees according to the bagging method: each tree is constructed independently from a bootstrap sample of the entire dataset [29]. To avoid overfitting, each decision point, is split using the best abundance threshold in the randomly selected prediction subset, which based on the Gini criterion [29]. At RF model, parameters such as mtry, nodes, trees, and node size have a significant impact on the performance of the model. The optimum parameters were carried out using the tuneRF fuction present in the RF package of R [30]. Using the method of random sampling, 70% of the samples were used as training set to build the model, and the remaining 30% were used as test set to evaluate the model performance. Classifiers were trained using repeated 5-fold cross-validation of training dataset, and predictive performance was evaluated in the test dataset [31]. Workflow for prediction of chemotherapy resistance in OC using machine learning methods and detailed RF model are presented in Fig. 1.
The working process of machine learning and random forest model.
Results
Study population
A total of 174 OC patients were enrolled, of which 77 were resistance to chemotherapy and 97 were not. The characteristics of the participants are shown in Table 1. The baseline characteristics of the two groups showed no differences in age, FIGO stage, and pathological typing (P > 0.05).
Characteristics of ovarian cancer patients with or without chemotherapy resistance
| Total | Chemoresistant | Chemosensitive | P value | |
|---|---|---|---|---|
| No. of case | 174 | 77 | 97 | |
| Age (Mean ± SD) | 55.87±9.65 | 56.77±9.45 | 55.16±9.79 | 0.278 |
| FIGO stage (%) | 0.072 | |||
| I | 36 (20.7) | 12 (15.6) | 24 (24.7) | |
| II | 8 (4.6) | 1 (1.3) | 7 (7.2) | |
| III | 111 (63.8) | 53 (68.8) | 58 (59.8) | |
| IV | 19 (10.9) | 11 (14.3) | 8 (8.2) | |
| Pathological type (%) | 0.941 | |||
| Serous | 109 (62.6) | 48 (62.3) | 61 (62.9) | |
| Non-serous | 65 (37.4) | 29 (37.7) | 36 (37.1) | |
FIGO, International Federation of Gynecology and Obstetrics; SD, standard deviation.
Gut microbiota structure in OC patients
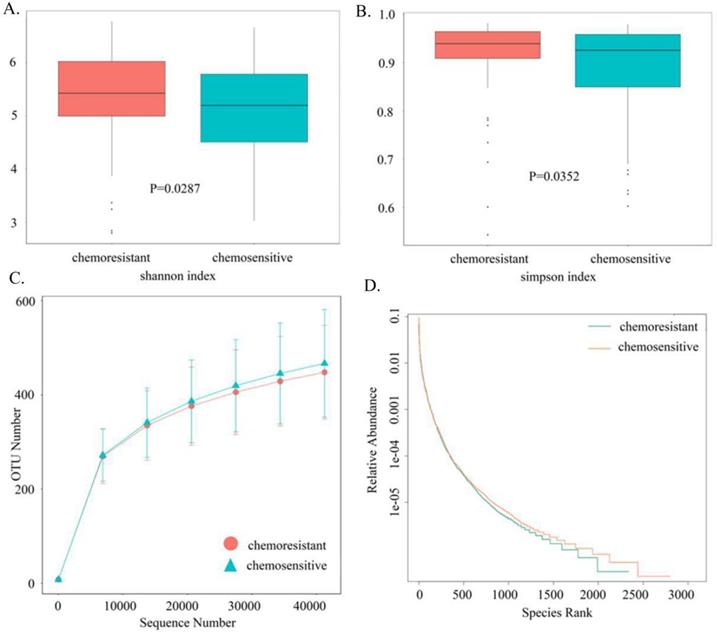
Based on sequencing platform, single-end sequencing method was used to construct small fragment library for single-end sequencing. Through Reads shearing and filtering, 73,170 Reads were measured on average per sample, and 69,440 effective data were obtained on average after quality control, with the quality control effective rate reaching 94.96%. To characterize the gut microbiota structure in OC patients with or without chemotherapy resistance, the estimators of OTU number, coverage percentage, community richness index (Chao1 and ACE), and diversity index (Shannon and Simpsons) were compared between the two groups (Table 2). With 97% Identity, sequence clustering is transformed into Operational Taxonomic Units, and a total of 3,049 OTUs are obtained. And 2049 of 3,049 OTUs were shared between the two groups, accounting for 67.2% of the total richness. There were 273 OC patients with chemotherapy resistance specific-species and 727 patients without chemotherapy resistance specific-species. Good's coverage approached 99.8%, indicating that the sequencing depth of intestinal microbiomes was reasonable. Adonis testing showed that the evenness of the groups was significantly different (R2 = 0.01002, P < 0.05). There were statistically significant differences between the two groups in Shannon indexes (P < 0.05, Fig. 2A) and Simpson indexes (P < 0.05, Fig. 2B), demonstrating that the microbiota diversity was significantly higher in the chemoresistant group than in the chemosensitive group. The richness of the chemoresistant group was slightly lower than that of the no chemotherapy resistance group, whereas the richness of the two groups did not differ significantly in the ACE indexes (P = 0.0809) and Chao1 indexes (P = 0.0709). Consistently, rarefaction curve analysis showed that the richness of chemoresistant OC patients tended to be lower than that of the control group (Fig. 2C). The rank abundance curve showed that the right tail of chemosensitive OC patients was longer, demonstrating a higher abundance and more uniform distribution than that of chemotherapy resistant patients (Fig. 2D). At the phylum level, we found that Firmicutes, Proteobacteria and Bacteroidetes are the main ones that occupy the dominant position. The dominant class are Gammaproteobacteria, Bacteroidia and Clostridia. The dominant species at the order level are Enterobacteriales, Bacteroidales and Clostridiales. The dominant species in the family level are Enterobacteriaceae, Bacteroidaceae and Lachnospiraceae. The dominant species in genus level were unidentified_Enterobacteriaceae, Bacteroides and Faecalibacterium.
Comparison of phylotype coverage, richness, and diversity estimation of two groups according to 16S rRNA sequencing analysis
| Group | No. of OUTs* | Good's (%) | Richness | Diversity | ||
|---|---|---|---|---|---|---|
| ACE | Chao1 | Shannon | Simpson | |||
| Chemoresistant | 2322 | 99.76 | 521 | 501 | 5.42 | 0.939 |
| Chemosensitive | 2776 | 99.75 | 547 | 522 | 5.19 | 0.925 |
*The operational taxonomic units (OTUs) were defined at the 97% similarity level.
Comparison of the gut microbiota structures between chemoresistant and chemosensitive ovarian cancer patients. (A) Shannon index (B) Simpson index (C) Rarefaction curves (D) Rank-Abundance Curve.
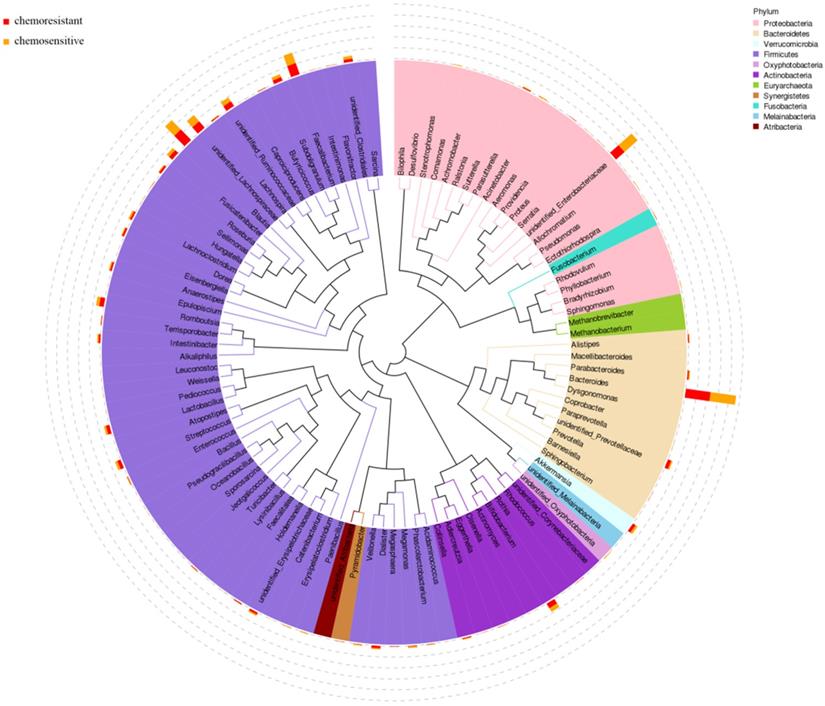
According to the results of 16S rRNA, the phylogenetic tree was constructed to represent the evolutionary relationship among various species. As shown in Fig. 3, Firmicutes, Proteobacteria, and Bacteroidetes phylum had higher abundance in both chemosensitive and chemoresistant OC patients. Among them, Firmicutes was the highest abundant phylum, which contains nearly half of all constructed evolutionary trees, fully demonstrating the richness and diversity of intestinal microbial community species. Roseburia also appears in the phylogenetic tree and belongs to Firmicutes phylum.
Phylogenetic tree of top 100 abundant species at genus level of ovarian cancer patients undergoing chemotherapy.
Selection and implementation of machine learning methods
To select the best performing model for classification, we used RapidMiner to compare the performances of different machine learning approaches. The comparison results are as follows (Table 3). All models were implemented with the default parameters. The random forest model has the highest stability, and its prediction accuracy is 0.60, which is better than any single regression.
Performance comparison of different machine learning methods using RapidMiner
| Model | Accuracy | Standard Deviation | Gains |
|---|---|---|---|
| Naive Bayes | 0.56 | 0.1 | 0.0 |
| Generalized Linear Model | 0.58 | 0.1 | 4.0 |
| Logistic Regression | 0.56 | 0.1 | 0.0 |
| Fast Large Margin | 0.50 | 0.1 | -6.0 |
| Deep Learning | 0.56 | 0.1 | 0.0 |
| Decision Tree | 0.50 | 0.1 | -4.0 |
| Random Forest | 0.60 | 0.1 | 4.0 |
| Gradient Boosted Trees | 0.54 | 0.1 | -4.0 |
| Support Vector Machine | 0.58 | 0.1 | 2.0 |
Prediction of gut microbiota for the chemoresistant of OC
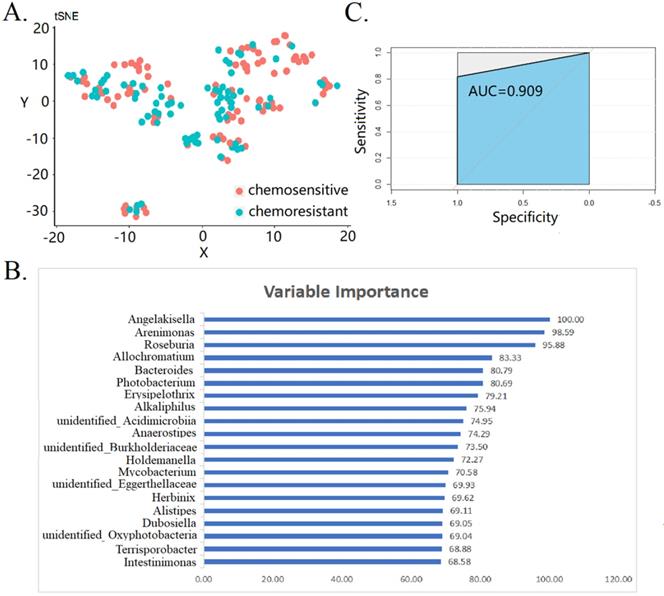
Next, we attempted to predict the chemoresistant of OC by using gut microbiota and RF model. All the bacteria were treated with tSNE dimensionality reduction, and the uniformity reflected the sample quality control (Fig. 4A). The top 20 variable importance for RF-based prediction of chemoresistant of OC are shown in Fig. 4B. The mean decrease in gini index was used as a measure of variable importance. We found that Angleakisella, Arenimonas, and Roseburia have the top three importance in random forest model. The AUC values of the ROC curve was 0.909 (Fig. 4C). This proves that gut microbiota is related to chemotherapy resistance of and makes it possible to predict the effect of chemotherapy by gut microbiota. Findings were robust in the sensitivity analysis of patients with FIGO stage III-IV (data not shown).
Prediction of gut microbiota for the chemoresistant of ovarian cancer patients. (A) tSNE dimensionality reduction analysis (B) top 20 variable importance in random forest model (C) receiver operating characteristic curve of random forest model.
Discussion
To the best of our knowledge, this is the first study to investigate the differences in the gut microbiota between OC patients with and without chemotherapy resistance via 16S rRNA sequencing analysis. Due to the difficulty in identifying the key characteristic microbiota of the original relative abundance, machine learning methods can be used to find more characteristic relationships. Machine learning methods such as random forest model were used to construct the prediction of chemotherapy response of OC based on gut microbiota.
Analysis of the overall gut microbiota distribution showed that the gut microbiota diversity was higher in chemoresistant OC patients. Proteobacteria was the most abundant phylum in chemoresistant OC patients, and Firmicutes was found in chemosensitive OC patients. Among the nine machine learning methods, RF model had the highest prediction accuracy. Through RF model the relationship between gut microbiota and chemotherapy response of OC can be further established. Gut microbiota such as Angelakisella, Arenimonas and Roseburia was identified as a potential microbial biomarker for discriminating OC patients with chemoresistant OC patients from those chemosensitive.
There are few studies analyzing the relationship between the gut microbiota and cancer chemotherapy resistance. Choi et al. showed that the intestinal microbiota was related to chemotherapy resistance in colorectal cancer [32]. These authors reported that enteropathogenic Escherichia coli induces macrophage inhibitory cytokine 1 to mediate the rapid growth and spread of intestinal cancers and causes colorectal cancer chemotherapy resistance. Zhang [33] and Yu [17] reported that high Fusobacterium nucleatum abundance is linked to colorectal cancer chemosensitivity. Fusobacterium nucleatum decreases the chemosensitivity of colorectal cancer to chemotherapy drugs, suggesting that the concentration of this bacterium may be an indicator of prognosis and an early warning of the risk of chemotherapy resistance. A recent study suggested that an unhealthy gut microbiota contributes to the aggressiveness and invasiveness of hormone receptor-positive breast cancer [34]. Additionally, mouse experiments showed that the Salmonella enterica serotype Typhimurium inhibits the expression of P-glycoprotein, thereby increasing the chemosensitivity of cancer cells [35].
The present study had a similar research design by exploring the relationship between intestinal microbiota and chemotherapy resistance in OC [35]. The involvement of the gut microbiota in the development and progression of OC has been reported previously. Zhou et al. [19] compared the microbiota between ovarian tissues and normal distal fallopian tube tissues, and showed that Proteobacteria and Firmicutes are bacteria associated with OC. This is consistent with the present study, as variations in Proteobacteria and Firmicutes were associated with OC with chemotherapy resistance.
The exact biological mechanisms linking gut microbiota to OC chemotherapeutic response are unknown. However, several potential mechanisms have been proposed. Cancer gene and epigenetic alterations associated with OC chemotherapeutic response have been widely reported [19]. Recent studies in mice showed that the intestinal microbiota modulates immune responses, affecting chemotherapy and immunotherapy [38]. Studies in humans showed that the adaptive immune system can modulate OC chemical sensitivity [39]. Roseburia is a typical butyrate producing bacterium that plays a role in the treatment and prevention of atherosclerosis [40] and obesity-related diseases [41]. Roseburia is increased in cervical cancer patients compared with healthy controls, indicating that it may serve as a novel potential biomarker for cervical cancer [42]. A recent study showed that butyric acid, a short-chain fatty acid produced by dietary fiber fermented by the gut microbiota, can induce the expansion of Treg cells and the production of inflammatory cytokines, reduce tumor resistance, and inhibit the occurrence of colorectal cancer [43]. The Roseburia genus and Fusobacterium nucleatum genus belong to the Clostridiales order. Fusobacterium nucleatum targets TLR4 and MYD88 innate immune signaling and specific microRNAs to activate the autophagy pathway and alter the chemotherapeutic response in colorectal cancer [17]. Research on the resistance mechanism of Roseburia is limited. Additional basic research is warranted to explore the mechanism underlying the effect of Roseburia on OC chemotherapy resistance in the future. At present, there is no study on Angelakisella, and there are few studies on Arenimonas. Angelakisella are gram-negative bacilli with a very elongated shape [44]. Arenimonas are gram-negative bacilli and usually found in natural soil and water environments [44].
The present study is the first to explore the relationship between the gut microbiota and OC patients with chemotherapy resistance. Furthermore, the sample size of our study was large. Machine learning methods such as random forest are powerful tools to predict the chemotherapy response of OC patients. All enrolled patients received optimally and maximally cytoreduced surgery and take the same chemotherapy regimens. The consistency in the enrolled patients is another strength of the study. The two groups were comparable in age, FIGO stage, and pathological typing, reducing the impact of confounding factors. The present study had some limitations. First, exercise and dietary information were not collected and analyzed. Exercise and diet can modify the gut microbiota, which in turn has a profound influence on health [47,48]. However, the exercise and diet regimens of OC patients during chemotherapy are similar [49] and approximately 81% of OC patients do not meet the recommended physical activity guidelines. Second, although we excluded subjects who had taken antibiotics or probiotics in the month prior to the study, subjects who took other medicines for OC were not excluded for ethical reasons. Third, because of the case-control study design, we failed to determine the causal relationship between variation in the gut microbiota and chemotherapy resistance in OC. Whether changes in bacterial abundance are a causative factor for chemotherapy resistance or a response to the OC microenvironment needs to be further explored. Longitudinal studies should also be conducted to identify microbial biomarkers contributing to chemotherapy resistance in OC. Fourth, although the performance of internally validation of the RF model was good, this situation is not reality limited by the wave of intestinal changes as well as has high false positive. Additionally, we failed to carry out the external validation in the present study. Therefore, our findings should be interpreted with cautious. Future studies are warranted to validate our findings.
In summary, the present study showed that there are differences in the gut microbiota between OC patients with and without chemotherapy resistance. The diversity of the intestinal microbiota was higher in the chemoresistant group. RF model can predict the chemoresistance of OC based on gut microbiota. Further studies with better design and more detailed analysis are warranted in the future. Findings from these studies may provide the possibility of predicting the effect of chemotherapy treatment through intestinal flora in clinic, and guides doctors to choose different treatment schemes, so as to reduce the burden on patients.
Acknowledgements
Funding and Disclosure
This study was supported by grants from the National Key R&D Program of China (No. 2017YFC0907404 to Yu-Hong Zhao), the Natural Science Foundation of China (No. 82073647 and No. 81602918 to Q-JW), the China Postdoctoral Science Foundation Funded Project (No. 2018M641752 to Q-JW), the LiaoNing Revitalization Talents Program (No. XLYC1907102 to Q-JW), Shenyang high level innovative talents support program (No. RC190484 to Q-JW), and 345 Talent Project to Q-JW (M0268).
Contribution to the Field Statement
Ovarian cancer (OC) has the highest mortality among gynecological malignancies, and resistance to chemotherapy drugs is common. Considering the human gut microbiota is related to the occurrence and development of various cancers. We aim to develop a machine learning approach based on gut microbiota to predict the chemotherapy resistance of OC. This is the first study to investigate the differences in the gut microbiota between OC patients with and without chemotherapy resistance via 16S rRNA sequencing analysis. On account of the original relative abundance makes it difficult to identify key characteristic gut microbiota, machine learning methods were used to construct the prediction of chemotherapy response of OC based on gut microbiota.
Author contributions
- T-TG and XH-H contributed equally to this work.
- T-TG and Q-JW designed the research; T-TG, X-HH, and SG conducted the research; X-HH and Q-JW analyzed data; T-TG, X-HH, and Q-JW wrote the draft manuscript. All the authors read, reviewed, and approved the final manuscript. Q-JW had primary responsibility for all the final content.
Competing Interests
The authors have declared that no competing interest exists.
References
1. Lheureux S, Braunstein M, Oza A-M. Epithelial ovarian cancer: Evolution of management in the era of precision medicine. CA Cancer J Clin. 2019;69:280-304
2. Fitzmaurice C, Akinyemiju TF, Al Lami-FH. et al. Global, Regional, and National Cancer Incidence, Mortality, Years of Life Lost, Years Lived With Disability, and Disability-Adjusted Life-Years for 29 Cancer Groups, 1990 to 2016: A Systematic Analysis for the Global Burden of Disease Study. JAMA Oncol. 2018;4:1553-68
3. Torre LA, Trabert B, DeSantis CE. et al. Ovarian cancer statistics, 2018. CA Cancer J Clin. 2018;68:284-96
4. Jayson GC, Kohn EC, Kitchener HC. et al. Ovarian cancer. Lancet. 2014;384:1376-88
5. Cooke SL, Brenton JD. Evolution of platinum resistance in high-grade serous ovarian cancer. Lancet Oncol. 2011;12:1169-74
6. Markman M, Blessing J, Rubin SC. et al. Phase II trial of weekly paclitaxel (80 mg/m2) in platinum and paclitaxel-resistant ovarian and primary peritoneal cancers: a Gynecologic Oncology Group study. Gynecol Oncol. 2006;101:436-40
7. Ringborg U, Platz A. Chemotherapy resistance mechanisms. Acta Oncol. 1996 35 Suppl 576-80
8. Mathur R, Barlow GM. Obesity and the microbiome. Expert Rev Gastroenterol Hepatol. 2015;9:1087-99
9. Avolio E, Gualtieri P, Romano L. et al. Obesity and Body Composition in Man and Woman: Associated Diseases and the New Role of Gut Microbiota. Curr Med Chem. 2020;27:216-29
10. Ahmadmehrabi S, Tang WHW. Gut microbiome and its role in cardiovascular diseases. Curr Opin Cardiol. 2017;32:761-6
11. Lew KN, Starkweather A, Cong X. et al. A Mechanistic Model of Gut-Brain Axis Perturbation and High-Fat Diet Pathways to Gut Microbiome Homeostatic Disruption, Systemic Inflammation, and Type 2 Diabetes. Biol Res Nurs. 2019;21:384-99
12. Chung L, Orberg ET, Geis AL. et al. Bacteroides fragilis Toxin Coordinates a Pro-carcinogenic Inflammatory Cascade via Targeting of Colonic Epithelial Cells. Cell Host Microbe. 2018;23:421
13. Singh RK, Chang HW, Yan D. et al. Influence of diet on the gut microbiome and implications for human health. J Transl Med. 2017;15:73
14. Koeth RA, Wang Z, Levison BS. et al. Intestinal microbiota metabolism of L-carnitine, a nutrient in red meat, promotes atherosclerosis. Nat Med. 2013;19:576-85
15. Rea D, Coppola G, Palma G. et al. Microbiota effects on cancer: from risks to therapies. Oncotarget. 2018;9:17915-27
16. Yu LX, Schwabe RF. The gut microbiome and liver cancer: mechanisms and clinical translation. Nat Rev Gastroenterol Hepatol. 2017;14:527-39
17. Yu T, Guo F, Yu Y. et al. Fusobacterium nucleatum Promotes Chemoresistance to Colorectal Cancer by Modulating Autophagy. Cell. 2017;170:548-63
18. Chase D, Goulder A, Zenhausern F. et al. The vaginal and gastrointestinal microbiomes in gynecologic cancers: a review of applications in etiology, symptoms and treatment. Gynecol Oncol. 2015;138:190-200
19. Zhou B, Sun C, Huang J. et al. The biodiversity Composition of Microbiome in Ovarian Carcinoma Patients. Sci Rep. 2019;9:1691
20. Carbonell-J-Mitchell-T Michalski R. Machine Learning: An Artificial Intelligence Approach[M]. Berlin: Springer Science & Business Media. 2013
21. Morgan RJ, Armstrong DK, Alvarez RD. et al. Ovarian Cancer, Version 1.2016, NCCN Clinical Practice Guidelines in Oncology. J Natl Compr Canc Netw. 2016;14:1134-63
22. Li N, Yang J, Zhang J. et al. Correlation of Gut Microbiome Between ASD Children and Mothers and Potential Biomarkers for Risk Assessment. Genomics Proteomics Bioinformatics. 2019;17:26-38
23. Yu G, Hatta A, Periyannan S. et al. Isolation of Wheat Genomic DNA for Gene Mapping and Cloning. Methods Mol Biol. 2017;1659:207-13
24. Walters W, Hyde ER, Berg-Lyons D. et al. Improved Bacterial 16S rRNA Gene (V4 and V4-5) and Fungal Internal Transcribed Spacer Marker Gene Primers for Microbial Community Surveys. mSystems. 2015;1:e00009-15
25. Caporaso JG, Kuczynski J, Stombaugh J. et al. QIIME allows analysis of high-throughput community sequencing data. Nat Methods. 2010;7:335-6
26. Wang Q, Garrity GM, Tiedje JM. et al. Naive Bayesian classifier for rapid assignment of rRNA sequences into the new bacterial taxonomy. Appl Environ Microbiol. 2007;73:5261-7
27. Sharma AK, Jaiswal SK, Chaudhary N. et al. A novel approach for the prediction of species-specific biotransformation of xenobiotic/drug molecules by the human gut microbiota. Sci Rep. 2017;7:9751
28. Cutler DR, Edwards TC, Beard KH. et al. Random forests for classification in ecology. Ecology. 2007;88:2783-92
29. Roguet A, Eren AM, Newton RJ. et al. Fecal source identification using random forest. Microbiome. 2018;6:185
30. Sharma AK, Jaiswal SK, Chaudhary N. et al. A novel approach for the prediction of species-specific biotransformation of xenobiotic/drug molecules by the human gut microbiota. Sci Rep. 2017;7:9751
31. Hou C, Zhong X, He P. et al. Predicting Breast Cancer in Chinese Women Using Machine Learning Techniques: Algorithm Development. JMIR Med Inform. 2020;8:e17364
32. Choi HJ, Kim J, Do KH. et al. Enteropathogenic Escherichia coli-induced macrophage inhibitory cytokine 1 mediates cancer cell survival: an in vitro implication of infection-linked tumor dissemination. Oncogene. 2013;32:4960-9
33. Zhang S, Yang Y, Weng W. et al. Fusobacterium nucleatum promotes chemoresistance to 5-fluorouracil by upregulation of BIRC3 expression in colorectal cancer. J Exp Clin Cancer Res. 2019;38:14
34. Buchta RC, Bostic RR, Ferey JCM. et al. Preexisting Commensal Dysbiosis is a Host-Intrinsic Regulator of Tissue Inflammation and Tumor Cell Dissemination in Hormone Receptor-Positive Breast Cancer. Cancer Res. 2019;79:3662-75
35. Mercado-Lubo R, Zhang Y, Zhao L. et al. A Salmonella nanoparticle mimic overcomes multidrug resistance in tumours. Nat Commun. 2016;7:12225
36. Dami G, Broggini M. Platinum Resistance in Ovarian Cancer: Role of DNA Repair. Cancers (Basel). 2019;11:119
37. Norouzi-Barough L, Sarookhani MR, Sharifi M. et al. Molecular mechanisms of drug resistance in ovarian cancer. J Cell Physiol. 2018;233:4546-62
38. Iida N, Dzutsev A, Stewart CA. et al. Commensal bacteria control cancer response to therapy by modulating the tumor microenvironment. Science. 2013;342:967-70
39. Wang W, Kryczek I, Dostal L. et al. Effector T Cells Abrogate Stroma-Mediated Chemoresistance in Ovarian Cancer. Cell. 2016;165:1092-05
40. Kasahara K, Krautkramer KA, Org E. et al. Interactions between Roseburia intestinalis and diet modulate atherogenesis in a murine model. Nat Microbiol. 2018;3:1461-71
41. Lee SE, Choi Y, Jun JE. et al. Additional Effect of Dietary Fiber in Patients with Type 2 Diabetes Mellitus Using Metformin and Sulfonylurea: An Open-Label, Pilot Trial. Diabetes Metab J. 2019;43:422-31
42. Wang Z, Wang Q, Zhao J. et al. Altered diversity and composition of the gut microbiome in patients with cervical cancer. AMB Express. 2019;9:40
43. Liang Q, Chiu J, Chen Y. et al. Fecal Bacteria Act as Novel Biomarkers for Noninvasive Diagnosis of Colorectal Cancer. Clin Cancer Res. 2017;23:2061-70
44. Mailhe M, Ricaboni D, Vitton V. et al. 'Angelakisella massiliensis' gen. nov, sp. nov, a new bacterial species isolated from human ileum. New Microbes New Infect. 2017:1651-53
45. Deng L, Guo W, Ngo HH. et al. Application of a specific membrane fouling control enhancer in membrane bioreactor for real municipal wastewater treatment: Sludge characteristics and microbial community. Bioresour Technol. 2020;312:123612
46. Zhang L, Zhao F, Li X. et al. Contribution of influent rivers affected by different types of pollution to the changes of benthic microbial community structure in a large lake. Ecotoxicol Environ Saf. 2020;198:110657
47. Cronin O, Barton W, Skuse P. et al. A Prospective Metagenomic and Metabolomic Analysis of the Impact of Exercise and/or Whey Protein Supplementation on the Gut Microbiome of Sedentary Adults. mSystems. 2018;3:e00044-18
48. Conlon MA, Bird AR. The impact of diet and lifestyle on gut microbiota and human health. Nutrients. 2014;7:17-44
49. Mizrahi D, Naumann F, Broderick C. et al. Quantifying physical activity and the associated barriers for women with ovarian cancer. Int J Gynecol Cancer. 2015;25:577-83
Author contact
![]() Corresponding author: Qi-Jun Wu, M.D., Ph.D. Department of Clinical Epidemiology, Shengjing Hospital of China Medical University, Address: No. 36 Sao Hao Street, Shenyang, Liaoning, 110004, China. Phone: +86-24-96615-13653, E-mail: wuqjorg.
Corresponding author: Qi-Jun Wu, M.D., Ph.D. Department of Clinical Epidemiology, Shengjing Hospital of China Medical University, Address: No. 36 Sao Hao Street, Shenyang, Liaoning, 110004, China. Phone: +86-24-96615-13653, E-mail: wuqjorg.