Impact Factor ISSN: 1837-9664

 Global reach, higher impact
J Cancer 2021; 12(12):3407-3417. doi:10.7150/jca.50552 This issue Cite
Research Paper
Prognostic Value of Peripheral Blood Lymphocyte/monocyte Ratio in Lymphoma
Feiqiong Gao1, Jianlai Hu2, Jiawei Zhang1, Yang Xu1,3 ![]()
1. Department of Hematology, the Second Affiliated Hospital of Zhejiang University School of Medicine, Hangzhou 310009, China.
2. Department of Prosthodontics, the Second Affiliated Hospital of Zhejiang University School of Medicine, Hangzhou 310009, China.
3. Zhejiang Provincial Key Laboratory for Cancer Molecular Cell Biology, Life Sciences Institute, Zhejiang University, Hangzhou 310058, China.
Received 2020-7-11; Accepted 2021-3-28; Published 2021-4-19
Abstract

Objective: Lymphocyte monocyte ratio (LMR) has been considered as a prognostic factor in patients with lymphoma, which focused on diffuse large B-cell lymphoma (DLBCL) and Hodgkin lymphoma (HL). Recently, many relevant clinical studies have been published with inconsistent results. To gain a more comprehensive view of the prognostic value of LMR, we conducted a meta-analysis on the significance of peripheral LMR in all subtypes of lymphoma.
Methods: PubMed, PMC, Web of Science, Embase, and Cochrane Library were searched for relevant articles to conduct a meta-analysis. Hazard ratio (HR) and its 95% confidence interval (CI) of OS and PFS were extracted and pooled on stata12.1.
Results: In the meta-analysis, forty studies were eligible and a total of 10446 patients were included. Low LMR was associated with an inferior OS (HR=2.45, 95%CI 1.95-3.08) and PFS (HR=2.36, 95%CI 1.94-2.88). In the analysis of lymphoma subtypes, similar results were seen in HL, NHL, and its subtypes including DLBCL, NK/T cell lymphoma, and follicular lymphoma. In addition, low LMR was related with higher LDH (OR=2.26, 95%CI 1.66-3.09), advanced tumor staging (OR=0.41, 95%CI 0.36-0.46), IPI score (OR=0.40, 95%CI 0.33-0.48), but not with bone marrow involvement (OR=1.24, 95%CI 0.85-1.81) or pathological subtype (OR=0.69, 95%CI 0.41-1.16).
Conclusion: Low LMR in peripheral blood indicates poor prognosis in patients with lymphoma. As a simple clinical indicator, peripheral blood LMR combined with existing prognostic factors can improve the accuracy of lymphoma prognosis assessment.
Keywords: lymphoma, lymphocyte/monocyte ratio, prognosis, overall survival, progression-free survival
Introduction
Lymphomas are a heterogeneous group of lymphoid malignancy that is classified into Hodgkin Lymphoma (HL) and non-Hodgkin lymphoma (NHL). HL includes classic HL and nodular lymphocyte-predominant HL, and the classic HL can be further divided into four subtypes. Compared with HL, NHL comprises a more complex spectrum of subtypes, 85-90% of which arise from B cells, such as diffuse large B-cell lymphoma (DLBCL), follicular lymphoma (FL), mantle cell lymphoma (MCL) and Burkitt's lymphoma (BL); the remainder derive from T or NK lymphocytes such as NK/T cell lymphoma (NK/TL) and peripheral T cell lymphoma (PTCL) [1].
Advances in target therapy, adoptive cell therapy, and stem cell transplantation have improved the clinical outcomes of patients with lymphoma, however, relapsed or refractory diseases remain significant unmet needs in lymphoma treatment. According to the US data in 2019, about 19970 died of the disease among newly diagnosed 74200 NHL patients [2]. Accurate prognostic stratifications are essential for individualized or precision therapy in order to reduce the mortality and improve the quality of life in lymphoma patients. At present, there are many tools to assess the risk of lymphoma, including international prognostic index (IPI), gene expression profiling (GEP), and positron emission tomography-computed tomography (PET-CT). Nevertheless, PET-CT is relatively expensive, GEP analysis is labor-intensive and time-consuming, and IPI does not take into account the patients' immune status and tumor microenvironment (TME). Thus, simple and appropriate immune biomarkers have been explored to better predict the prognosis of lymphoma.
Previous studies have shown that increased tumor-associated macrophages (TAMs) before treatment was associated with poor overall survival in patients with lymphoma [3, 4]. Since TAMs are derived from the monocytes in peripheral blood, the number of TAMs is well correlated with that of monocytes. TAM can secrete various cytokines to promote tumor growth as well as angiogenesis in the tumor microenvironment [5]. On the other hand, lymphocytes play an important role in immune surveillance. It was reported that absolute lymphocyte count (ALC) was a surrogate marker of immune status, and low ALC was associated with poor prognosis [6, 7]. Therefore, peripheral blood lymphocytes to monocytes ratio (LMR) can readily reflect the crosstalk between the patients' immunity and the tumor microenvironment.
The clinical outcomes of many lymphoma subtypes, including FL [8, 9], DLBCL [10, 11], and NK/TL [12], could be predicted by peripheral blood LMR. Due to the heterogeneity of the sample size and the diversity of treatments reported in previous studies, the consistency of the prognostic impact of LMR remains unknown. To clarify the prognostic role of LMR in lymphoma, we conducted a comprehensive meta-analysis to assess the prognostic value of LMR in lymphoma with its subtypes and to reveal the correlation between LMR and clinicopathological characteristics including LDH, pathologies, staging, and IPI score.
Materials and methods
Literature search
PubMed, PMC, Web of Science, Embase, and Cochrane Library were searched for relevant studies, with the deadline of February 2020, and the language was restricted to English and Chinese. Search terms included “lymphocyte-to-monocyte ratio” or “lymphocyte monocyte ratio” or “LMR” and “lymphoma”. Two researchers screened the search results according to the inclusion and exclusion criteria. When disagreements occurred, a third reviewer was consulted.
Inclusion and exclusion criteria
Inclusion criteria were as follows: 1) prospective or retrospective clinical studies; 2) patients diagnosed with lymphoma; 3) reported on the comparison of prognostic value between high LMR and low LMR group; 4) OS (overall survival) or PFS (progression-free survival) should be included; 5) results should be provided in the form of hazard ratio (HR) and 95% confidence interval (CI). Studies were excluded based on the following criteria: 1) animal or cell line experiments; 2) duplicate studies, conference abstracts or those without available full texts; 3) studies that are not related to the research topic or those without relevant results or needed data.
Data collection and literature quality assessment
The following data were extracted from adopted articles and recorded in a form: first author, publication, country, disease subtypes, sample size, HR and 95%CI of OS and PFS, the use of rituximab or not, LMR cutoff value, and so on. Quality evaluation was conducted independently by two authors based on the Newcastle-Ottawa scale (NOS), according to its three components (selection, comparability, and outcome). Scores ranged from 0 to 9 points, and those with a total score higher than 5 were regarded as high-quality studies.
Statistical analysis
All analyses were performed using STATA version 12.1 software (StataCorp, College Station, TX, USA). HR and 95% CI were pooled to compare the prognostic significance of LMR in lymphoma on OS and PFS, and results were displayed by forest plots. Subgroup analyses were performed using the same analysis method. Correlation between LMR and clinicopathological parameters of lymphoma were evaluated by OR with its 95%CI. Heterogeneity was checked by the chi-squared test and I2 statistic (I2≤ 50%, P>0.1 acceptable level of heterogeneity; I2>50%, P≤ 0.1, obvious). Publication bias was assessed by Egger's and Begg's tests. We conducted a sensitivity analysis to estimate whether any single study affected combined HRs. Statistical significance was set at a two-tailed P<0.05.
Results
Search results and study characteristics
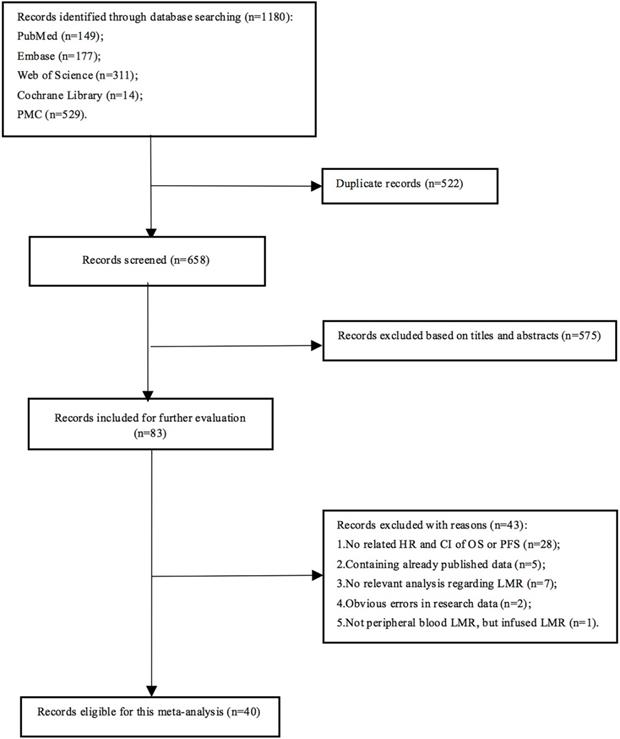
A total of 1180 articles were obtained, and 658 were left after 522 duplicates were excluded. After the initial screen, 575 articles were excluded, leaving 83 articles for detailed reading. Finally, 40 articles were eligible for this meta-analysis (Fig. 1), involving 10,446 lymphoma patients. Each study divided patients into high LMR and low LMR groups based on different LMR cut-off values, which were acquired from ROC curves or previous studies or median LMR. Five studies did not present the number of patients in the two groups. In the remaining 35 articles, 3817 patients were assigned to the low LMR group, while 5,082 were included in the high LMR group. All the adopted articles were retrospective studies with NOS scores of 4 or higher. The characteristics of the included studies were shown in Table 1.
Literature search flow diagram.
Characteristics of included studies
| First author | Year | Location | Disease subtype | Sample size | R | Cut-off value | High-LMR (n) | Low-LMR (n) | OS HR (95%CI) | PFS HR (95%CI) | NOS |
|---|---|---|---|---|---|---|---|---|---|---|---|
| Tadmor [22] | 2015 | Europe | HL | 1450 | - | 2.1 | 957 | 493 | 1.27 (0.85-1.88) | 1.5 (1.12-2) | 8 |
| Binder [23] | 2017 | America | NHL+HL | 390 | NA | NA | NA | NA | 1.860 (1.26-2.75) | NA | 4 |
| Simon [20] | 2016 | Europe | HL | 121 | - | 2.11 | NA | NA | 11.510 (3.14-42.86) | 17.74 (6.61-47.57) | 7 |
| Markovic [24] | 2014 | Europe | DLBCL | 222 | + | 2.8 | 112 | 110 | 1.515 (1.003-2.288) | NA | 6 |
| Xu [25] | 2016 | China | DLBCL | 38 | +/- | 3.9 | 22 | 16 | 1.761 (0.437-7.092) | NA | 7 |
| Jelicic [26] | 2015 | Europe | DLBCL | 182 | + | 2.8 | 109 | 73 | 1.366 (0.711-2.625) | NA | 4 |
| Sun [27] | 2018 | China | DLBCL | 564 | + | 2.7 | 216 | 348 | 1.966 (1.1-3.513) | 1.688 (1.062-2.684) | 4 |
| Wei [28] | 2014 | China | DLBCL | 168 | +/- | 2.6 | 87 | 81 | 2.434 (1.128-5.254) | NA | 7 |
| Rambaldi [29] | 2013 | Europe | DLBCL | 1,057 | +/- | 2.6 | 555 | 502 | 1.880 (1.32-2.7) | NA | 8 |
| Wang [30] | 2017 | China | NKTL | 379 | - | 2 | 275 | 104 | 2.230 (1.237-4.018) | 1.763 (1.119-2.777) | 6 |
| Ho [31] | 2015 | China | DLBCL | 148 | + | 2.11 | 88 | 60 | 1.528 (0.751-3.111) | 1.402 (0.758-2.59) | 5 |
| Bento [32] | 2019 | Europe | DLBCL | 780 | + | 2.25 | NA | NA | 1.540 (1.17-2.03) | 1.87 (1.49-2.34) | 5 |
| Watanabe [33] | 2014 | Japan | DLBCL | 359 | + | 4 | 132 | 227 | 2.507 (1.255-5.007) | 2.063 (1.249-3.408) | 8 |
| Porrata [34] | 2013 | America | HL | 190 | - | 1.1 | 167 | 23 | 7.140 (2.5-25) | 5.26 (1.22-20) | 5 |
| Wang [35] | 2015 | China | BL | 62 | +/- | 2.6 | 38 | 24 | 3.852 (1.063-13.958) | 5.252 (1.485-18.58) | 7 |
| Zhou [36] | 2017 | China | DLBCL | 173 | + | 3.2 | 73 | 100 | 4.878 (1.709-13.889) | 5.236 (1.818-15.152) | 6 |
| Katoh [37] | 2017 | Japan | DLBCL | 74 | + | 2.6 | 28 | 46 | 6.380 (2.46-18.75) | 7.51 (3.14-17.93) | 6 |
| Wang [38] | 2016 | China | DLBCL | 53 | + | 2.2 | 32 | 21 | 1.790 (0.41-7.69) | 1.45 (0.4-5.26) | 6 |
| Porrata [39] | 2012 | America | HL | 103 | NA | 2.1 | 75 | 28 | 3.030 (1.41-6.67) | 3.33 (1.67-7.14) | 7 |
| Li [10] | 2014 | China | DLBCL | 244 | +/- | 3.8 | 96 | 148 | 3.954 (2.172-7.196) | 4.071 (2.243-7.389) | 7 |
| Zhang [12] | 2019 | China | NKTL | 148 | - | 2.7 | 111 | 37 | 1.950 (0.75-4.09) | 1.41 (0.34-4.8) | 6 |
| Li [40] | 2017 | China | NKTL | 264 | - | 2.85 | 166 | 98 | 2.475 (1.5-4.085) | NA | 6 |
| Vassilakopoulos [41] | 2016 | Europe | HL | 537 | - | 1.1 | 477 | 60 | 2.930 (1.47-5.81) | NA | 5 |
| Romano [42] | 2018 | Europe | HL | 180 | - | 2 | 98 | 82 | NA | 1.6 (0.7-3.7) | 7 |
| Zhong [43] | 2019 | China | DLBCL | 228 | + | 2.7 | NA | NA | 4.610 (4.25-4.97) | NA | 8 |
| Cencini [44] | 2019 | Europe | PTCL | 31 | - | 2.1 | 13 | 18 | 1.670 (0.6-4.76) | NA | 4 |
| Jia [45] | 2018 | China | ALCL | 29 | - | 2.5 | 13 | 16 | 3.090 (0.221-43.299) | 1.004 (0.235-4.291) | 4 |
| Jia [46] | 2019 | China | HL | 133 | - | 2.5 | 70 | 63 | 10.360 (2.35-45.66) | 2.35 (1.36-4.07) | 4 |
| Yang [47] | 2019 | China | DLBCL | 28 | - | 3.31 | NA | NA | 9.434 (1.712-52.632) | 7.353 (1.859-28.571) | 4 |
| Geng [48] | 2019 | China | DLBCL | 113 | NA | 2.27 | 60 | 53 | 1.641 (0.796-3.380) | NA | 4 |
| Lee [9] | 2017 | China | FL | 88 | +/- | 3.2 | 49 | 39 | NA | 3.23 (1.41-7.69) | 7 |
| Niu1 [49] | 2018 | China | AITL | 64 | - | 3.07 | 24 | 40 | 2.63 (1.22-5.56) | 2.08 (1.09-3.85) | 6 |
| Jakovic [50] | 2016 | Europe | HL | 101 | - | 2 | 41 | 60 | 2.185 (1.043-4.577) | NA | 5 |
| Kumagai [8] | 2014 | Japan | FL | 99 | + | 4.7 | 23 | 76 | NA | 2.714 (1.06-6.948) | 8 |
| Koh [51] | 2012 | Korea | HL | 312 | NA | 2.9 | 158 | 154 | 2.194 (1.04-4.62) | NA | 8 |
| Hong [52] | 2017 | Korea | DLBCL | 313 | + | 3 | 155 | 158 | NA | 1.006 (0.61-1.657) | 6 |
| Koh [53] | 2014 | Korea | DLBCL | 603 | + | 3.04 | 342 | 261 | 1.663 (1.18-2.34) | 1.991 (1.47-2.68) | 7 |
| Sun [54] | 2019 | China | DLBCL | 43 | +/- | 2.6 | 25 | 18 | NA | 3.083 (1.554-6.117) | 6 |
| Niu2 [55] | 2018 | China | NHL | 164 | +/- | 3.14 | 78 | 86 | 2.342 (1.08-5.076) | 2.299 (1.13-4.673) | 6 |
| Shimono [56] | 2019 | Japan | DLBCL | 211 | + | 1.6 | 117 | 94 | 2.021 (1.245-3.28) | NA | 4 |
HL: Hodgkin lymphoma; NHL: non-Hodgkin lymphoma; DLBCL: diffuse large B-cell lymphoma; NKTL: NK/T cell lymphoma; FL: follicular lymphoma; BL: Burkitt lymphoma; AITL: angioimmunoblastic T cell lymphoma; PTCL: peripheral T cell lymphoma; ALCL: anaplastic large cell lymphoma; R: rituximab; +: treated with rituximab; -: treated without rituximab +/-: only part of the patients treated with rituximab; NA: not available; NOS: Newcastle-Ottawa scale; OS: overall survival PFS: progression-free survival.
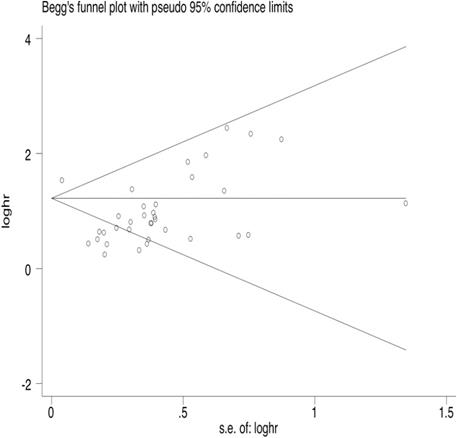
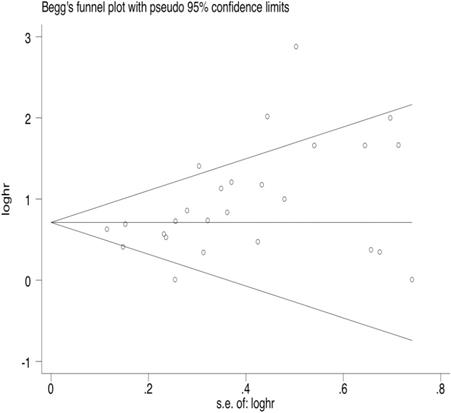
Publication Bias
35 articles were available for the analysis for publication bias with regard to the HR of OS. Both Begg's test and Egger's test demonstrated that there was publication bias regarding the HR of OS (Egger's Test: P=0.002, Begg's Test: P<0.000, Fig. 2). 26 studies reported on PFS. The results also indicated publication bias in PFS, but the bias was not as significant as that of OS (Egger's Test: P=0.010, Begg's Test: P=0.015, Fig. 3).
Begg's funnel plot of OS.
Begg's funnel plot of PFS.
Overall Survival
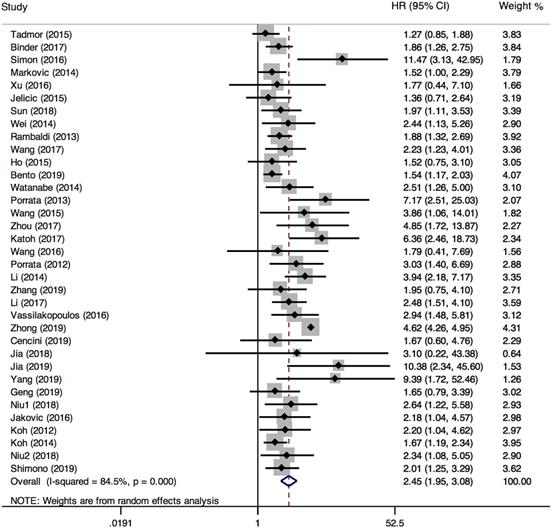
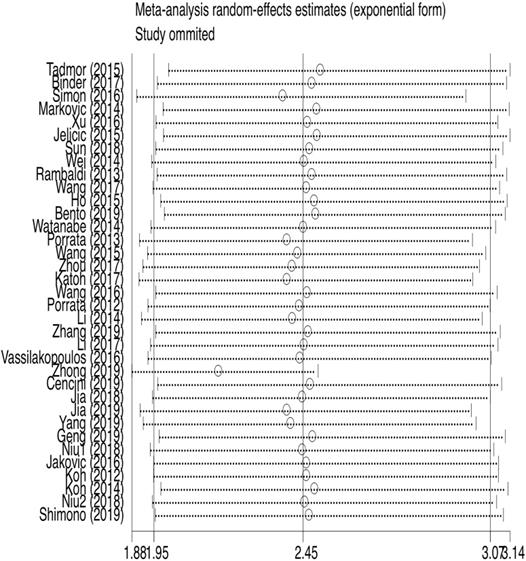
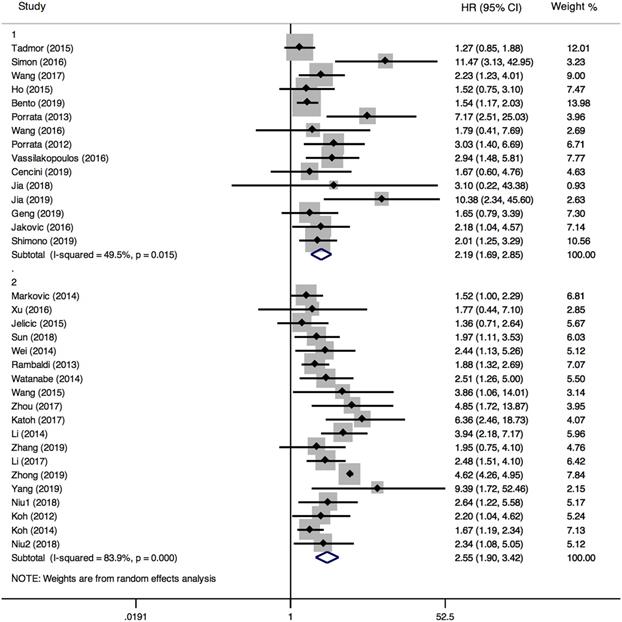
35 studies provided relevant HRs of OS. The random-effects model was employed. The outcome demonstrated that low LMR was associated with an inferior overall survival rate, and the result was statistically significant (HR=2.45, 95%CI 1.95-3.08; I²=84.5%, P<0.000, Fig. 4). The sensitivity analysis (Fig. 5) revealed that the study Zhong (2019) had an impact on the heterogeneity of OS, and the pooled HR was 2.17 (95%CI 1.88-2.50) after excluding this article. Heterogeneity decreased from 84.5% to 36.3%, while the negative correlation between LMR and OS still existed. Subgroup analysis according to sample size, country, publication year, median age, LMR cutoff, and rituximab showed that low LMR was associated with inferior OS in each subgroup (Table 2). Subgroup analysis based on LMR cutoff value showed that the difference in prognostic significance between the two groups increased, as the LMR cutoff value increased (Fig. 6).
Forest plot comparing OS between low-LMR and high-LMR groups.
Sensitivity analysis of OS.
Subgroup analysis for the outcome of OS and PFS
| Overall survival | Progression-free survival | |||||||
|---|---|---|---|---|---|---|---|---|
| Number of studies | HR (95%CI) | Heterogeneity | Number of studies | HR (95%CI) | Heterogeneity | |||
| I² (%) | P | I² (%) | P | |||||
| Sample size | ||||||||
| ≤150 | 15 | 2.73 (1.99-3.73) | 28.4 | 0.145 | 14 | 3.05 (2.11-4.41) | 59.2 | 0.003 |
| >150 | 20 | 2.28 (1.70-3.04) | 90.3 | 0.000 | 12 | 1.92 (1.58-2.32) | 48.1 | 0.031 |
| Location | ||||||||
| Europe and America | 12 | 1.93 (1.54-2.43) | 51.7 | 0.019 | 6 | 2.79 (1.69-4.60) | 81.3 | 0.000 |
| Asia | 23 | 2.65 (2.04-3.43) | 75.7 | 0.000 | 20 | 2.28 (1.84-2.82) | 48.5 | 0.008 |
| Published year | ||||||||
| ≤2015 | 13 | 2.00 (1.61-2.49) | 44.3 | 0.043 | 9 | 2.28 (1.72-3.01) | 52.1 | 0.033 |
| >2015 | 22 | 2.67 (2.00-3.58) | 82.7 | 0.000 | 17 | 2.42 (1.83-3.22) | 66.3 | 0.000 |
| Median age | ||||||||
| ≤50 | 15 | 2.60 (1.99-3.40) | 41.9 | 0.045 | 11 | 2.53 (1.71-3.73) | 67.4 | 0.001 |
| >50 | 20 | 2.26 (1.66-3.08) | 89.2 | 0.000 | 15 | 2.29 (1.81-2.90) | 58.3 | 0.002 |
| Rituximab | ||||||||
| With | 12 | 2.23 (1.47-3.39) | 92.1 | 0.000 | 10 | 1.98 (1.53-2.56) | 57.8 | 0.011 |
| Without | 13 | 2.74 (1.95-3.86) | 53.9 | 0.011 | 10 | 2.47 (1.62-3.77) | 69.9 | 0.000 |
| LMR cut-off value | ||||||||
| ≤ 2.5 | 15 | 2.19 (1.69-2.85) | 49.5 | 0.015 | 11 | 2.15 (1.59-2.92) | 65.8 | 0.001 |
| >2.5 | 19 | 2.55 (1.90-3.42) | 83.9 | 0.000 | 15 | 2.55 (1.95-3.34) | 57.0 | 0.003 |
Subgroup analysis of OS according to LMR cut-off values (1: LMR≤2.5, 2: LMR>2.5).
Progression-free survival
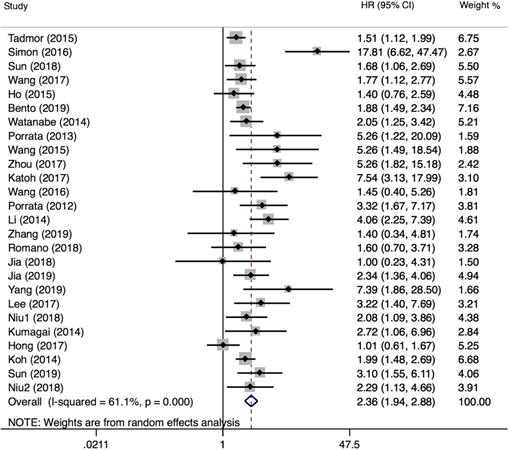
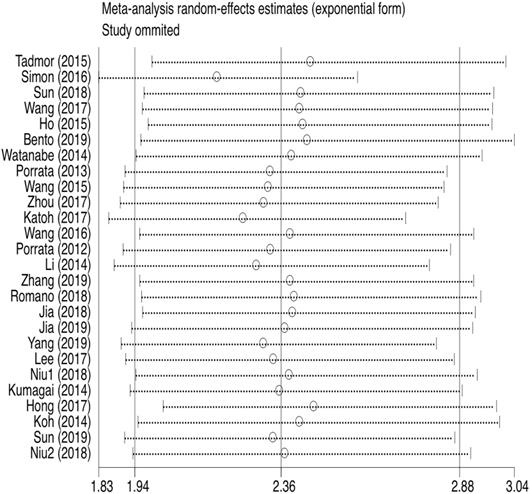
PFS was reported in 26 articles. The result showed that PFS in the low LMR group was significantly poor (HR=2.36, 95%CI 1.94-2.88; I²=61.1%, P<0.000, Fig. 7). Sensitivity analysis (Fig. 8) demonstrated that the article Simon (2016) influenced the heterogeneity of PFS. After excluding this article, pooled HR became 2.18 (95% CI = 1.83-2.58). Heterogeneity decreased from 61.1% to 47.2%, but the negative correlation between LMR and PFS did not been destroyed. In addition, subgroup analysis showed that compared with the high-LMR group, PFS in the low-LMR group was poorer in each subgroup (Table 2).
Forest plot comparing PFS between low-LMR and high-LMR groups.
Sensitivity analysis of PFS.
Prognostic value of LMR in subtypes of lymphoma
35 studies assessed the prognostic value of LMR on overall survival, 8 reporting on HL, 26 reporting on NHL, and 18 reporting on DLBCL. Pooled results showed that lower LMR was significantly associated with poor OS in HL (HR=3.17, 95%CI 1.89-5.30), NHL (HR=2.32, 95%CI 1.78-3.02), and DLBCL (HR=2.31, 95%CI 1.66-3.22). Detailed information was shown in Table 3. HL patients had the most obvious difference in OS between the two groups. As for PFS, 26 articles comprised this outcome, 6 analyzing HL, 20 analyzing NHL, of which 12 articles analyzed DLBCL. The results indicated that PFS was poor in the low LMR group in these subtypes.
Prognostic significance of low LMR in subtypes of lymphoma
| Overall survival | Progression-free survival | |||||||
|---|---|---|---|---|---|---|---|---|
| Number of studies | HR (95%CI) | Heterogeneity | Number of studies | HR (95%CI) | Heterogeneity | |||
| I² (%) | P | I² (%) | P | |||||
| HL | 8 | 3.17 (1.89-5.30) | 69.7 | 0.002 | 6 | 3.12 (1.65-5.90) | 81.4 | 0.000 |
| NHL | 26 | 2.32 (1.78-3.02) | 85.6 | 0.000 | 20 | 2.04 (1.80-2.30) | 49.2 | 0.007 |
| DLBCL | 18 | 2.31 (1.66-3.22) | 89.6 | 0.000 | 12 | 2.27 (1.73-2.98) | 65.7 | 0.001 |
| NHL except DLBCL | 7 | 2.36 (1.76-3.16) | 0.0 | 0.967 | 7 | 2.10 (1.57-2.82) | 0.0 | 0.518 |
| NKTL | 3 | 2.30 (1.62-3.25) | 0.0 | 0.885 | 2 | 1.73 (1.12-2.65) | 0.0 | 0.748 |
| FL | NA | NA | NA | NA | 2 | 2.98 (1.59-5.61) | 0.0 | 0.793 |
HL: Hodgkin lymphoma; NHL: non- Hodgkin lymphoma; DLBCL: diffuse large B-cell lymphoma; NKTL: NK/T cell lymphoma; FL: follicular lymphoma; NA: not available.
Association between LMR and clinicopathological characteristics of lymphoma
Relevant articles were enrolled to analyze the association between LMR and six clinicopathological features of lymphoma (Table 4). The results indicated that bone marrow involvement and pathological types were not associated with LMR. 15 studies were chosen to assess the association between LMR and B symptoms, and the combined OR showed that the low LMR group was prone to B symptoms (OR=2.13, 95%CI 1.61-2.82). The relationship between LMR and IPI score was analyzed in 13 studies. The result showed that patients with IPI scores higher than 3 were more likely to appear in the low LMR group (OR=0.40, 95%CI 0.33-0.48). 17 studies evaluated the association between low LMR and LDH, suggesting a negative correlation between LMR and LDH (OR=2.26, 95%CI 1.66-3.09). 20 studies assessed the relationship between low LMR and tumor stage, and the pooled result demonstrated that the tumor stage was relatively high in the low LMR group (OR=0.41, 95%CI 0.36-0.46).
Association between LMR and clinicopathological characteristics of lymphoma
| Clinicopathological characteristics | Study number | Patient number | OR (95%CI) | P | Heterogeneity | |
|---|---|---|---|---|---|---|
| I² (%) | P | |||||
| Bone marrow involvement (+ vs. -) | 6 | 1016 | 1.24 (0.85-1.81) | 0.268 | 0.0 | 0.724 |
| B symptom (+ vs. -) | 15 | 3004 | 2.13 (1.61-2.82) | 0.000 | 53.2 | 0.008 |
| Pathological type (GCB vs. NON-GCB) | 3 | 249 | 0.69 (0.41-1.16) | 0.164 | 0.0 | 0.607 |
| IPI score (≤2 vs. >2) | 13 | 2532 | 0.40 (0.33-0.48) | 0.000 | 0.0 | 0.503 |
| LDH (Elevated vs. Normal) | 17 | 4033 | 2.26 (1.66-3.09) | 0.000 | 73.4 | 0.000 |
| Tumor Staging (I-II vs. III-IV) | 20 | 4296 | 0.41 (0.36-0.46) | 0.000 | 42.1 | 0.025 |
GCB: germinal center B-cell-like; IPI: international prognostic index; LDH: lactic dehydrogenase.
Discussion
Peripheral blood lymphocyte count is considered as an indicator of the host immunity. The lymphocytes play an important role in immune surveillance and defense system against tumor. The CD8+ T cells are able to recognize and eliminate tumor cells mainly through perforin and granzyme B pathways. The CD4+ Th cells modulate tumor microenvironment by secreting cytokines such as IFN-γ, TGF-β, IL-4, IL-5, and IL-6. The regulatory T cells suppress immune activation and autoimmunity. Carreras et al. found that the reduction of Treg cells is associated with tumor recurrence, transformation, and highly invasive histology [13], which remains controversial in other studies [14]. In general, lymphocytosis is associated with a favorable prognosis in patients with cancer.
The monocytes are released from the bone marrow into the blood, and then migrate into peripheral tissues where monocytes differentiate into macrophages. Activated macrophages are categorized to two types, i.e., M1 and M2 macrophages. M1 macrophages have anti-tumor functions, whereas TAMs, which resemble M2 macrophages, express high levels of anti-inflammatory cytokines, angiogenic factors and metalloproteinases to promote cancer progression [15]. Steidl et al. analyzed the TME in 130 classic HLs and showed that, increased number of TAMs was significantly associated with poor OS, and its prediction power was better than conventional IPI score [3]. Li et al. found that AMC positively correlated with TAM in DLBCL patients treated with rituximab, and poor survival outcomes were observed in of patients with high AMC and TAM [16].
Our meta-analysis included a total of 10446 patients from 40 studies, and explored the prognostic significance of LMR on lymphoma and its subtypes. The reduced LMR are known to adversely affect OS and PFS in patients with lymphoma. The prognostic significance did not diminish in further subgroup analysis according to LMR cut-off value, sample size, country, publication year, median age, and rituximab, suggesting that peripheral blood LMR is a reliable prognostic marker. Moreover, the analysis of LMR and clinicopathological characteristics revealed that low LMR was associated with higher LDH, IPI score, and tumor stage. LDH is indicative of lymphoma burden, and a high IPI score and advanced tumor stage correlate with poor prognosis. No significant association was found between LMR and bone marrow involvement and histological subtypes of lymphoma. A recent meta-analysis included 8 studies with a total of 3319 patients with HL, and suggested that low LMR was associated with poor OS and PFS [17]. Xia et al. analyzed 12 studies with 5,021 DLBCL patients, and similarly, they found that low LMR has poor prognostic implication for DLBCL [18]. In this study, we updated the clinical data and analyzed the prognostic value of LMR in several lymphoma subtypes.
Cutoff values of LMR were variable among the included 40 studies, and most LMRs ranged from 2.0 to 3.0. Subgroup analysis based on cutoff values demonstrated that the differences in OS and PFS between the low- and high-LMR groups were more significant when the cutoff value was higher than 2.5. LMR cut-off values were usually 1.1~2.9 in HL, and 1.6~4.0 in DLBCL. The LMR cutoffs were calculated using the ROC curve in most studies, while median LMR or previously-reported value was selected in other studies. To better define the prognostic role of LMR, a standardized calculation of LMR cutoff is required for different lymphoma subtypes.
Although high TAM infiltration in TME is often associated with poor prognosis in lymphoma, the use of rituximab may diminish the adverse effect. For example, Canioni et al. found low macrophages was significantly associated better event-free survival in FL patients treated with CHVP-I (cyclophosphamide, doxorubicin, etoposide, prednisolone, and interferon) regimen but not in those receiving rituximab plus CHVP-I [19]. We asked whether rituximab would affect the prognostic significance of LMR in lymphoma. Interestingly, a meta-analysis [18] showed that LMR could well predict OS and PFS in patients with DLBCL treated with rituximab; LMR did not affect PFS in DLBCL treated without rituximab. Since a small number of patients were included in non-RCHOP treatment group, these results need to be further verified. In our study, the patients treated with and without rituximab were assigned in 14 studies, respectively. Subgroup analysis suggested that the low LMR group had poor OS and PFS regardless of the use of rituximab, although the difference was more significant in non-rituximab groups. Thus, our analysis demonstrated that the prognostic significance of LMR for B cell lymphoma is still valid in the rituximab era.
The combinations of LMR with other prognostic assessment tools have been studied in patients with lymphoma. Simon et al. [20] suggested that in HL, the prognosis of the high LMR/PET-CT negative group was significantly better than the low LMR/PET-CT positive group, and the factors combination was more accurate than single factor in prognostic assessment. Ji et al. reported that LMR/LDH ratio had a better predictive power than LMR alone in DLBCL [21]. Therefore, LMR can be used in conjunction with other prognostic tools such as PET-CT and IPI scores for better risk stratification, which could translate to individualized or precision treatment of lymphoma.
Our study has some limitations. First, the meta-analysis is based on retrospective studies rather than prospective randomized controlled trials, which might lead to publication bias. Second, not all of the included HRs have been adjusted, because covariates did not always exist. In addition, different LMR cut-off values were used in the included studies, which may lead to increased heterogeneity.
In conclusion, low LMR is associated with poor survival outcomes in lymphoma patients. As a simple and reliable prognostic marker, LMR, alone or in combination with other parameters, will be helpful for prognosis assessment. Since our results are mainly based on retrospective clinical studies, the role of LMR warrants further investigation in prospective randomized trials.
Acknowledgements
Funding
This work was supported by the [National Natural Science Foundation of China] under Grant [No. 81572920]; and [Natural Science Foundation of Zhejiang Province of China] under Grant [No. LY21H080005].
Competing Interests
The authors have declared that no competing interest exists.
References
1. Shankland KR, Armitage JO, Hancock BW. Non-Hodgkin lymphoma. The Lancet. 2012;380:848-57
2. Siegel RL, Miller KD, Jemal A. Cancer statistics, 2019. CA: A Cancer Journal for Clinicians. 2019;69:7-34
3. Steidl C, Lee T, Shah SP. et al. Tumor-associated macrophages and survival in classic Hodgkin's lymphoma. N Engl J Med. 2010;362:875-85
4. Cai QC, Liao H, Lin SX. et al. High expression of tumor-infiltrating macrophages correlates with poor prognosis in patients with diffuse large B-cell lymphoma. Med Oncol. 2012;29:2317-22
5. Petty AJ, Yang Y. Tumor-Associated Macrophages in Hematologic Malignancies: New Insights and Targeted Therapies. Cells. 2019;8:1526
6. Kim DH, Baek JH, Chae YS. et al. Absolute lymphocyte counts predicts response to chemotherapy and survival in diffuse large B-cell lymphoma. Leukemia. 2007;21:2227-30
7. Oki Y, Yamamoto K, Kato H. et al. Low absolute lymphocyte count is a poor prognostic marker in patients with diffuse large B-cell lymphoma and suggests patients' survival benefit from rituximab. Eur J Haematol. 2008;81:448-53
8. Kumagai S, Tashima M, Fujikawa J. et al. Ratio of peripheral blood absolute lymphocyte count to absolute monocyte count at diagnosis is associated with progression-free survival in follicular lymphoma. Int J Hematol. 2014;99:737-42
9. Lee SF, Luque-Fernandez MA. Prognostic value of lymphocyte-to-monocyte ratio and neutrophil-to-lymphocyte ratio in follicular lymphoma: a retrospective cohort study. BMJ Open. 2017;7:e017904
10. Li YL, Pan YY, Jiao Y. et al. Peripheral blood lymphocyte/monocyte ratio predicts outcome for patients with diffuse large B cell lymphoma after standard first-line regimens. Ann Hematol. 2014;93:617-26
11. Porrata LF, Ristow KM, Habermann TM. et al. Peripheral blood absolute lymphocyte/monocyte ratio during rituximab, cyclophosphamide, doxorubicin, vincristine and prednisone treatment cycles predicts clinical outcomes in diffuse large B-cell lymphoma. Leuk Lymphoma. 2014;55:2728-38
12. Zhang S, Li M, Yuan F. et al. The predictive value of dynamic monitoring of peripheral blood lymphocyte to monocyte ratio in patients with extranodal NK/T cell lymphoma. Cancer Cell Int. 2019;19:272
13. Carreras J, Lopez-Guillermo A, Fox BC. et al. High numbers of tumor-infiltrating FOXP3-positive regulatory T cells are associated with improved overall survival in follicular lymphoma. Blood. 2006;108:2957-64
14. Sweetenham JW, Goldman B, LeBlanc ML. et al. Prognostic value of regulatory T cells, lymphoma-associated macrophages, and MUM-1 expression in follicular lymphoma treated before and after the introduction of monoclonal antibody therapy: a Southwest Oncology Group Study. Ann Oncol. 2010;21:1196-202
15. Dirkx AEM, oude Egbrink MGA, Wagstaff J. et al. Monocyte/macrophage infiltration in tumors: modulators of angiogenesis. Journal of Leukocyte Biology. 2006;80:1183-96
16. Li YL, Shi ZH, Wang X. et al. Tumor-associated macrophages predict prognosis in diffuse large B-cell lymphoma and correlation with peripheral absolute monocyte count. BMC Cancer. 2019;19:1049
17. Lee SF, Ng TY, Spika D. Prognostic value of lymphocyte-monocyte ratio at diagnosis in Hodgkin lymphoma: a meta-analysis. BMC Cancer. 2019;19:338
18. Xia WK, Lin QF, Shen D. et al. Prognostic significance of lymphocyte-to-monocyte ratio in diffuse large B-cell lymphoma: a systematic review and meta-analysis. FEBS Open Bio. 2016;6:558-65
19. Canioni D, Salles G, Mounier N. et al. High Numbers of Tumor-Associated Macrophages Have an Adverse Prognostic Value That Can Be Circumvented by Rituximab in Patients With Follicular Lymphoma Enrolled Onto the GELA-GOELAMS FL-2000 Trial. Journal of Clinical Oncology. 2008;26:440-6
20. Simon Z, Barna S, Miltenyi Z. et al. Combined prognostic value of absolute lymphocyte/monocyte ratio in peripheral blood and interim PET/CT results in Hodgkin lymphoma. Int J Hematol. 2016;103:63-9
21. Ji H, Niu X, Yin L. et al. Ratio of Immune Response to Tumor Burden Predicts Survival Via Regulating Functions of Lymphocytes and Monocytes in Diffuse Large B-Cell Lymphoma. Cell Physiol Biochem. 2018;45:951-61
22. Tadmor T, Bari A, Marcheselli L. et al. Absolute Monocyte Count and Lymphocyte-Monocyte Ratio Predict Outcome in Nodular Sclerosis Hodgkin Lymphoma: Evaluation Based on Data From 1450 Patients. Mayo Clin Proc. 2015;90:756-64
23. Binder M, O'Byrne MM, Maurer MJ. et al. Associations between elevated pre-treatment serum cytokines and peripheral blood cellular markers of immunosuppression in patients with lymphoma. Am J Hematol. 2017;92:752-8
24. Markovic O, Popovic L, Marisavljevic D. et al. Comparison of prognostic impact of absolute lymphocyte count, absolute monocyte count, absolute lymphocyte count/absolute monocyte count prognostic score and ratio in patients with diffuse large B cell lymphoma. Eur J Intern Med. 2014;25:296-302
25. Xu YX, Zhang YG, Xu CL. et al. [Effect of Lymphocyte/Monocyte Ratio on Clinical Features and Prognosis of Patients with Primary Gastrointestinal Diffuse Large B Cell Lymphoma]. Zhongguo Shi Yan Xue Ye Xue Za Zhi. 2016;24:1404-9
26. Jelicic J, Todorovic Balint M, Sretenovic DA. et al. Enhanced International Prognostic Index (NCCN-IPI), Charlson Comorbidity Index and absolute lymphocyte count as predictors for survival of elderly patients with diffuse large B cell lymphoma treated by immunochemotherapy. Neoplasma. 2015;62:988-95
27. Sun F, Zhu J, Lu S. et al. An inflammation-based cumulative prognostic score system in patients with diffuse large B cell lymphoma in rituximab era. BMC Cancer. 2018;18:5
28. Wei X, Huang F, Wei Y. et al. Low lymphocyte-to-monocyte ratio predicts unfavorable prognosis in non-germinal center type diffuse large B-cell lymphoma. Leuk Res. 2014;38:694-8
29. Rambaldi A, Boschini C, Gritti G. et al. The lymphocyte to monocyte ratio improves the IPI-risk definition of diffuse large B-cell lymphoma when rituximab is added to chemotherapy. Am J Hematol. 2013;88:1062-7
30. Wang QX, Li SH, Ji BY. et al. Lymphocyte/Monocyte Ratio is a Novel Predictor for Early Stage Extranodal Natural Killer/T-cell Lymphoma, Nasal Type. J Cancer. 2017;8:1030-7
31. Ho CL, Lu CS, Chen JH. et al. Neutrophil/Lymphocyte Ratio, Lymphocyte/Monocyte Ratio, and Absolute Lymphocyte Count/Absolute Monocyte Count Prognostic Score in Diffuse Large B-Cell Lymphoma: Useful Prognostic Tools in the Rituximab Era. Medicine (Baltimore). 2015;94:e993
32. Bento L, Diaz-Lopez A, Barranco G. et al. New prognosis score including absolute lymphocyte/monocyte ratio, red blood cell distribution width and beta-2 microglobulin in patients with diffuse large B-cell lymphoma treated with R-CHOP: Spanish Lymphoma Group Experience (GELTAMO). Br J Haematol. 2020;188:888-897
33. Watanabe R, Tomita N, Itabashi M. et al. Peripheral blood absolute lymphocyte/monocyte ratio as a useful prognostic factor in diffuse large B-cell lymphoma in the rituximab era. Eur J Haematol. 2014;92:204-10
34. Porrata LF, Ristow KM, Habermann TM. et al. Peripheral blood absolute lymphocyte/monocyte ratio recovery during ABVD treatment cycles predicts clinical outcomes in classical Hodgkin lymphoma. Blood Cancer J. 2013;3:e110
35. Wang L, Wang H, Xia ZJ. et al. Peripheral blood lymphocyte to monocyte ratio identifies high-risk adult patients with sporadic Burkitt lymphoma. Ann Hematol. 2015;94:1645-54
36. Zhou S, Xu L, Ma Y. et al. Peripheral blood lymphocyte to monocyte ratio recovery from low levels at diagnosis after completion of first line therapy predicts good clinical outcomes in patients with diffuse large B-cell lymphoma. Oncotarget. 2017;8:19556-65
37. Katoh D, Ochi Y, Yabushita T. et al. Peripheral Blood Lymphocyte-to-Monocyte Ratio at Relapse Predicts Outcome for Patients With Relapsed or Refractory Diffuse Large B-cell Lymphoma in the Rituximab Era. Clin Lymphoma Myeloma Leuk. 2017;17:e91-e7
38. Wang J, Wang X-Y, Zhou M. et al. Peripheral blood lymphocyte-to-monocyte ratio is a useful prognostic factor in patients with newly diagnosed diffuse large B-cell lymphoma receiving chemoimmunotherapy. International Journal of Clinical and Experimental Pathology. 2016;9:2033-8
39. Porrata LF, Ristow K, Habermann TM. et al. Peripheral blood lymphocyte/monocyte ratio at diagnosis and survival in nodular lymphocyte-predominant Hodgkin lymphoma. Br J Haematol. 2012;157:321-30
40. Li N, Zhang L, Song HL. et al. Prognostic impact of absolute lymphocyte count/absolute monocyte count ratio and prognostic score in patients with nasal-type, extranodal natural killer/T-cell lymphoma. Tumour Biol. 2017;39:1010428317705503
41. Vassilakopoulos TP, Dimopoulou MN, Angelopoulou MK. et al. Prognostic Implication of the Absolute Lymphocyte to Absolute Monocyte Count Ratio in Patients With Classical Hodgkin Lymphoma Treated With Doxorubicin, Bleomycin, Vinblastine, and Dacarbazine or Equivalent Regimens. Oncologist. 2016;21:343-53
42. Romano A, Parrinello NL, Vetro C. et al. Prognostic meaning of neutrophil to lymphocyte ratio (NLR) and lymphocyte to monocyte ration (LMR) in newly diagnosed Hodgkin lymphoma patients treated upfront with a PET-2 based strategy. Annals of hematology. 2018;97:1009-18
43. Zhong H, Chen J, Cheng S. et al. Prognostic nomogram incorporating inflammatory cytokines for overall survival in patients with aggressive non-Hodgkin's lymphoma. EBioMedicine. 2019;41:167-74
44. Cencini E, Fabbri A, Sicuranza A. et al. Prognostic significance of lymphocyte/monocyte count and neutrophil/lymphocyte count in peripheral T cell lymphoma. Leukemia Research. 2019;77:5-7
45. Jia T, Zhang R, Zhu HY. et al. Prognostic significance of peripheral blood absolute monocyte count and lymphocyte to monocyte ratio in anaplastic large cell lymphoma. Cancer Biomark. 2018;22:807-13
46. Jia T, Zhu HY, Wang L. et al. [The prognostic significance of peripheral lymphocyte/monocyte ratio and PET-2 evaluation in adult Hodgkin's lymphoma]. Zhonghua Xue Ye Xue Za Zhi. 2019;40:372-7
47. Yang J, Guo X, Hao J. et al. The Prognostic Value of Blood-Based Biomarkers in Patients With Testicular Diffuse Large B-Cell Lymphoma. Front Oncol. 2019;9:1392
48. Geng YD, Chen YR, Jin J. et al. Prognostic Value of D-Dimer in Patients with Diffuse Large B-cell Lymphoma: A Retrospective Study. Curr Med Sci. 2019;39:222-7
49. Niu JY, Zhu HY, Wang L. et al. Prognostic value of lymphocyte-to-monocyte ratio in angioimmunoblastic T cell lymphoma. Zhonghua Xue Ye Xue Za Zhi. 2018;39:265-70
50. Jakovic LR, Mihaljevic BS, Andjelic BM. et al. Prognostic value of lymphocyte/monocyte ratio in advanced Hodgkin lymphoma: correlation with International Prognostic Score and tumor associated macrophages. Leuk Lymphoma. 2016;57:1839-47
51. Koh YW, Kang HJ, Park C. et al. The ratio of the absolute lymphocyte count to the absolute monocyte count is associated with prognosis in Hodgkin's lymphoma: correlation with tumor-associated macrophages. Oncologist. 2012;17:871-80
52. Hong JY, Ryu KJ, Lee JY. et al. Serum level of CXCL10 is associated with inflammatory prognostic biomarkers in patients with diffuse large B-cell lymphoma. Hematol Oncol. 2017;35:480-6
53. Koh YW, Park CS, Yoon DH. et al. Should the cut-off values of the lymphocyte to monocyte ratio for prediction of prognosis in diffuse large B-cell lymphoma be changed in elderly patients? Eur J Haematol. 2014;93:340-8
54. Sun KM, Sang W, Xu LY. et al. [Significance of Peripheral Blood Lymphatic to Monocyte Ratio in the Progress of PGI-DLBCL]. Zhongguo Shi Yan Xue Ye Xue Za Zhi. 2019;27:1118-22
55. Niu X, Ji H, Wang Y. et al. Systemic immune response associated with radiation therapy in B-cell non-Hodgkin's lymphoma of Waldeyer's ring. Oncology Reports. 2018;40:3674-84
56. Shimono J, Takahashi S, Takemura R. et al. Useful prognostic tools based on complete blood cell counts in diffuse large B-cell lymphoma. Int J Lab Hematol. 2019;41:754-61
Author contact
![]() Corresponding author: Dr. Yang Xu, Department of Hematology, The Second Affiliated Hospital, Zhejiang University School of Medicine, Hangzhou 310009, China. Phone: 86-571-89713679, E-mail: yxuedu.cn.
Corresponding author: Dr. Yang Xu, Department of Hematology, The Second Affiliated Hospital, Zhejiang University School of Medicine, Hangzhou 310009, China. Phone: 86-571-89713679, E-mail: yxuedu.cn.