Impact Factor ISSN: 1837-9664

 Global reach, higher impact
J Cancer 2021; 12(13):3796-3808. doi:10.7150/jca.53827 This issue Cite
Research Paper
Prognostic Prediction Model for Glioblastoma: A Metabolic Gene Signature and Independent External Validation
Chuxiang Lei, B.S.1*, Wenlin Chen, B.S.2*, Yuekun Wang, B.S.2, Binghao Zhao, M.D.2, Penghao Liu, B.S.2, Ziren Kong, B.S.2, Delin Liu, B.S.2, Congxin Dai, M.D.2, Yaning Wang, M.D.2, Yu Wang, M.D.2 ![]() , Wenbin Ma, M.D.2
, Wenbin Ma, M.D.2 ![]()
1. Department of Vascular Surgery, Peking Union Medical College Hospital, Peking Union Medical College and Chinese Academy of Medical Sciences, No. 1 Shuaifuyuan, Dongcheng District, Beijing, China.
2. Department of Neurosurgery, Peking Union Medical College Hospital, Peking Union Medical College and Chinese Academy of Medical Sciences, No. 1 Shuaifuyuan, Dongcheng District, Beijing, China.
*These authors contributed equally to this work.
Received 2020-9-29; Accepted 2021-4-21; Published 2021-5-5
Abstract

Background: Glioblastoma (GBM) is the most common primary malignant intracranial tumor and closely related to metabolic alteration. However, few accepted prognostic models are currently available, especially models based on metabolic genes.
Methods: The transcriptome data were obtained for all of the patients diagnosed with GBM from the Gene Expression Omnibus (GEO) (training cohort, n=369) and The Cancer Genome Atlas (TCGA) (validation cohort, n=152) with the following variables: age at diagnosis, sex, follow-up and overall survival (OS). Metabolic genes according to Kyoto Encyclopedia of Genes and Genomes (KEGG) pathways were contracted, and a Lasso regression model was constructed. Survival was assessed by univariate or multivariate Cox proportional hazards regression and Kaplan-Meier analysis, and an independent external validation was also conducted to examine the model.
Results: There were 341 metabolic genes showed significant differences between normal brain and GBM tissues in both the training and validation cohorts, among which 56 genes were dramatically correlated to the OS of patients. Lasso regression revealed that the metabolic prognostic model was composed of 18 genes, including COX10, COMT, and GPX2 with protective effects, as well as OCRL and RRM2 with unfavorable effects. Patients classified as high-risk by the risk score from this model had markedly shorter OS than low-risk patients (P<0.0001), and this significant result was also observed in independent external validation (P<0.001).
Conclusions: The prognosis of GBM was dramatically related to metabolic pathways, and our metabolic prognostic model had high accuracy and application value in predicting the OS of GBM patients.
Keywords: glioblastoma, metabolic gene, prognostic model, GEO, TCGA
Introduction
Glioblastoma (GBM, WHO grade IV) is a heterogeneous group of primary malignant central nervous system (CNS) tumors with an incidence of 5.25 per 100,000 people per year [1]. Among all of the CNS tumors, GBM is the most invasive and demonstrates the highest malignancy. Although the clinical treatment of GBM includes surgery, radiotherapy, chemotherapy, targeted therapy and tumor-treating fields [2, 3], the prognosis remains unfavorable. According to the statistical results of the Chinese Glioma Collaboration Group in 2016, the median overall survival (OS) of GBM patients is only 14.4 months [4], while the five-year survival rate is less than 5% [5]. Therefore, establishing of a prognostic prediction model is vital for making effective clinical decisions and has become one of the current research hotspots.
Metabolic pathways are closely related to life processes; the alterations in metabolic pathways have also become driving factors for tumor occurrence and progression, and they can serve as novel hallmarks [6]. Warburg first observed that the glycolysis process was preferred to the tricarboxylic acid pathway in tumor cells, even under conditions with sufficient oxygen [7]. Further studies proved that glutamate and fatty acids' metabolic processes differed significantly in hepatocellular carcinoma cells [8] while blocking glutamate-induced divergent metabolic programs to overcome tumor immune evasion [9]. In GBM, previous studies revealed metabolic reprogramming, including the transformation in glycolysis and oxidative phosphorylation [10]. Therefore, targeting abnormal metabolic pathways has become a possible therapy for GBM.
Considering the poor prognosis of GBM patients and the absence of generally accepted predictive models, it is of great significance to establish a survival prediction model. Metabolic pathway alterations may serve as prognostic factors, and studies have suggested that hypoxic glucose metabolism is a potential factor [11]. Due to the dramatic changes in the metabolic pathways in GBM, the expression levels of metabolic genes are expected to predict prognosis from a new perspective.
In the present study, the differentially expressed genes between normal brain tissues and GBM tissues were detected through database retrieval, and all of the metabolic genes were extracted to construct a predictive prognostic model. Moreover, an independent external validation was performed to evaluate the efficiency. This study provides new insights into GBM patients' prognosis and may provide novel tumor markers or therapeutic targets, further promoting the progress of GBM diagnosis and treatment.
Methods and Materials
The data that support the findings of this study are available from the corresponding author upon reasonable request. The study protocol was approved by the Institutional Review Board of Peking Union Medical College Hospital (S-424).
Study design and data collection
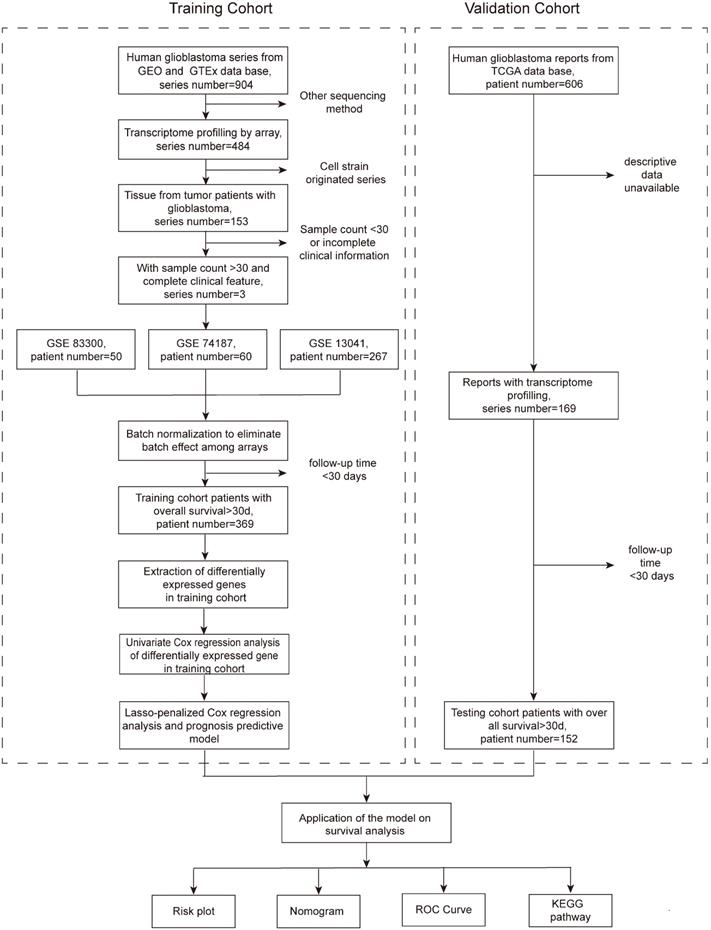
This retrospective cohort study included all of the transcriptome and clinical data of patients from the Gene Expression Omnibus (GEO) and The Cancer Genome Atlas (TCGA) databases. The training cohort was comprised of patients from the GEO database, and a total of 904 series were found. To be included, the series must originate from the GBM tissue of humans and have complete transcriptome profiling by array and clinical information, including the survival state and time. Series that were obtained from other sequencing methods or cell strains or contained fewer than 30 patients or those that were from patients in any therapeutic clinical trials were excluded. Eventually, three series (GSE83300 [12], GSE74187 [13], and GSE13041 [14]) with transcriptome and clinical data were included (Figure 1). The only endpoint of our study was the OS, and to ensure the reliability of the follow-up outcomes, we also excluded patients whose follow-up times were less than 30 days. After the above screening, a total of 369 patients met the criteria and formed the training cohort. The validation cohort consisted of patients from the TCGA database. There were 606 clinical records in total, of which 169 patients had transcriptome data. Similarly, patients followed for less than 30 days were excluded, and 152 patients constituted the validation cohort. The GBM tissues were obtained from patients that underwent surgery in Peking Union Medical College Hospital (PUMCH), and the comparison was performed between the tumor and the normal brain tissue around the tumor. The study protocol was approved by the Institutional Review Board of PUMCH.
Flow chart presenting the entire design of the study.
Differential gene acquisition
All of the sequencing data in the GEO database were derived from GBM tissue; therefore, it is essential to obtain the transcriptome data of normal human brain tissue for comparison. We consulted the Genotype-Tissue Expression (GTEx) database, which is a tissue biobank of more than 7,000 autopsy samples from healthy human donors during their lifetime. A total of 1,152 transcriptome sequencing data points of brain tissue were used as normal controls. Before comparing the differences in gene expression between normal brain and GBM tissues, we conducted batch normalization by surrogate variable analysis (SVA) to eliminate errors caused by batch effects between different chips, which was achieved through an R package called “sva” [15]. Normalization and log2 transformation of the transcripts were then employed for the expression profiles. There were 7,967 annotated protein-coding genes used for differential expression analyses by the “Limma” version 3.42.0 R package [16]. A false discovery rate (FDR)<0.05, which was calculated by the P value obtained from the Wilcoxon test, and a log2 fold-change (log2FC)>2 were considered statistically significant.
Identification of intersecting metabolic mRNAs in the training cohort
We identified metabolic genes from the genes based on the Kyoto Encyclopedia of Genes and Genomes (KEGG) pathways. The metabolic genes were selected if they showed consistent expression patterns in the GEO cohort and transcriptome data from GTEx. Another differential expression analysis of intersecting metabolic genes was performed through the “Limma” version 3.42.0 R package [16]. Genes with FDR<0.05 and log2FC>0.5 or <-0.5 were considered statistically significant. The metabolic genes with significantly different expression levels were used in subsequent analyses and models.
Construction of the predictive prognostic model of metabolic genes
Univariate Cox regression of metabolic genes with significantly different expression levels was performed to identify candidate genes. Then, we conducted Lasso‐penalized Cox regression analysis of those candidate genes to identify the prognosis-related metabolic genes and construct the prognostic gene signature as previously mentioned [17]. The prognostic gene signature is shown as:

through which the risk score of each patient can be calculated. The patients were divided into high- and low-risk groups according to the median of the summarized risk scores. The “survival” and “survminer” R packages were used to compare the differences in OS between the two groups of patients and draw the Kaplan-Meier survival curves.
External validation of the metabolic gene prognostic model
The mRNA expression data in the TCGA database were previously normalized with the GEO database. Using the same cut-off value from the above steps, 152 patients in the TCGA cohort were also separated into two groups, and similar survival analysis was also performed on this cohort to validate the model's accuracy.
Construction and validation of a predictive nomogram and gene set enrichment analysis (GSEA)
A nomogram was built by including all independent prognostic factors, including sex, age, and risk score, in our study [18]. With the bootstrap method with 1,000 resamples, we used calibration curves and the concordance index (C-index) to describe the calibration and distinction of the nomogram, respectively. The metabolic gene signature, sex, and age were compared with receiver operating characteristic (ROC) curves, and a multivariate Cox regression model including the sex, age, and risk score was built to reflect the combination of risk factors. To further investigate the potential underlying KEGG pathways of the gene signature, GSEA was utilized to find enriched terms in the training and validation cohorts [19].
Validation of key genes by the quantitative real-time polymerase chain reaction
See supplemental method.
Immunohistochemical staining
See supplemental method.
Statistical analysis
The independent t-test, the Wilcoxon test or the Mann-Whitney U test was performed as appropriate to evaluate differences in scale or ordinal variables. Survival was assessed using Cox proportional hazards regression and Kaplan-Meier analysis. Two-sided P values less than 0.05 were considered statistically significant. All statistical analyses were conducted with SPSS software (version 24.0, IBM SPSS statistics) and R software v3.6.1 (R Foundation for Statistical Computing, Vienna, Austria).
Results
Differential gene expression between normal brain and GBM tissues
We first compared the transcriptome profiling of human GBM and normal brain tissues. A total of 769 genes with significant differences in expression between the two groups were included (see Supplemental Table S1). To construct the predictive prognostic model of metabolic genes in the training cohort, we conducted KEGG pathway analysis, and 341 metabolism-related genes were extracted (see Supplemental Table S2). These 341 metabolism-related genes consisted of the candidate gene set of the prognostic model and underwent further analysis.
Screening for prognosis-related metabolic genes
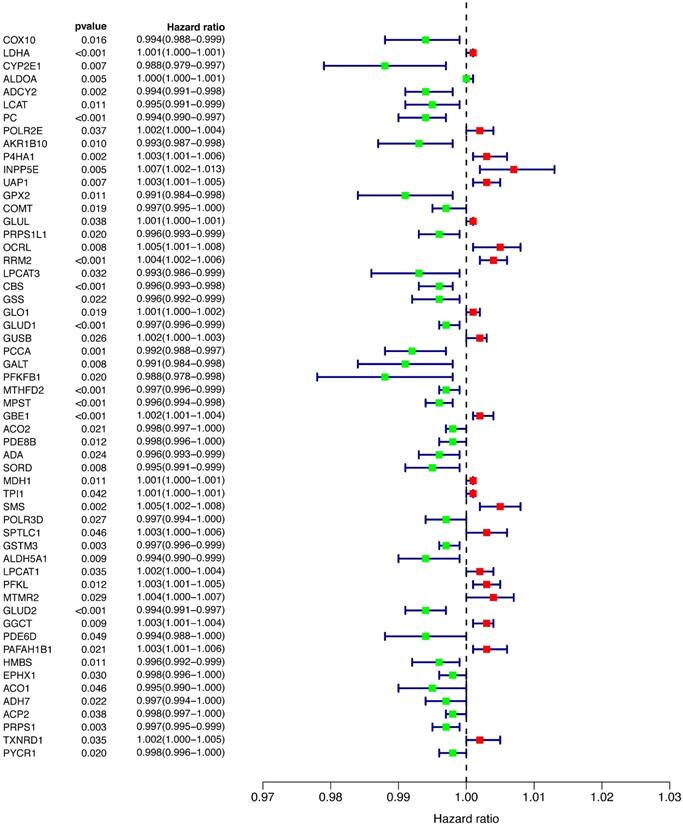
To explore the relationship between prognosis and metabolic genes, we conducted univariate Cox regression and revealed the hazard ratios (HRs) of 56 genes that were significantly related to OS in the training cohort (Figure 2). Favorable genes such as COX10, COMT, and GPX2 had negative HRs, suggesting that their high expression indicated a better prognosis. In contrast, the higher expression of unfavorable genes, such as OCRL and RRM2, was prone to worse outcomes. However, the HR of each gene's expression level was extremely close to 1, indicating that the predictive power of a single gene for prognosis was limited, and a more efficient predictive model was needed.
Univariate Cox regression of all of the differentially expressed genes.
Lasso regression model and Kaplan-Meier analysis of the training and validation cohorts
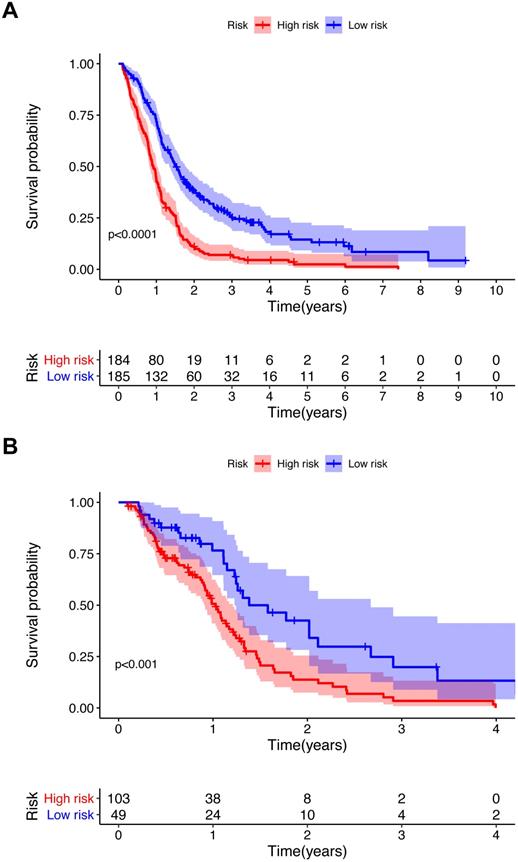
To further investigate the influence of metabolic genes on prognosis, we conducted Lasso regression. Among the 56 genes significantly associated with the OS in univariate Cox regression, 18 genes were eventually retained in the model (Table 1). There were 11 genes with negative coefficients, including COX10, COMT, and GPX2, indicating a protective effect on prognosis. Seven genes with positive coefficients, including OCRL and RRM2, suggested a worse prognosis. According to the coefficients and expression levels of the 18 genes, the risk score of each patient was calculated. The training cohort was divided into two groups according to the median risk score, and survival analysis presented significant differences between the two groups (p<0.0001) (Figure 3A). Furthermore, we used the same median risk score of the training cohort as a threshold to stratify the validation cohort. The same conclusion was reached: patients with lower risk scores had significantly better OS than those with higher risk scores (p<0.001) (Figure 3B).
Genes with log2FC, FDR and their coefficients in the prognostic model after LASSO regression
| Gene symbol | Training cohort | Coefficients† | Validation cohort | ||
|---|---|---|---|---|---|
| Log2FC‡ | FDR¶ | Log2FC‡ | FDR¶ | ||
| COX10 | -0.28 | <0.001* | -0.006377627 | 0.18 | 0.030* |
| COMT | -0.26 | <0.001* | -0.002879681 | -0.43 | <0.001* |
| GPX2 | -0.29 | <0.001* | -0.002808587 | 0.17 | 0.017* |
| AKR1B10 | -0.67 | <0.001* | -0.002396644 | -0.72 | 0.3 |
| GLUD1 | -0.48 | <0.001* | -0.001860585 | -0.51 | <0.001* |
| LPCAT3 | -0.44 | <0.001* | -0.001453787 | 0.26 | 0.016* |
| GSTM3 | -0.51 | 0.046* | -0.001408588 | -0.55 | <0.001* |
| GLUD2 | -0.76 | 0.002* | -0.001196549 | -0.13 | 0.3 |
| MTHFD2 | -0.65 | 0.011* | -0.001020503 | -0.65 | <0.001* |
| EPHX1 | -0.34 | 0.1 | -0.000394242 | -0.29 | 0.1 |
| PDE8B | 0.97 | <0.001* | -0.000262491 | 0.03 | 0.4 |
| GLUL | 0.15 | 0.1 | 0.000358099 | 0.08 | 0.4 |
| MDH1 | 0.48 | 0.002* | 0.000502893 | -0.19 | <0.001* |
| GBE1 | 0.60 | <0.001* | 0.001414345 | 0.66 | <0.001* |
| PFKL | 0.50 | <0.001* | 0.002176092 | 0.44 | <0.001* |
| PAFAH1B1 | 0.28 | 0.003* | 0.002265462 | 0.47 | <0.001* |
| RRM2 | 0.75 | <0.001* | 0.003109864 | 0.85 | <0.001* |
| OCRL | 0.60 | 0.002* | 0.004181019 | 0.36 | <0.001* |
‡ log2FC=log2(mean expression of high-risk group/mean expression of low-risk group)
¶ FDR was calculated by the P value from the Wilcoxon test.
† Coefficients were calculated by Lasso regression.
* marked significant differences.
log2FC: log2 fold change; FDR: false discovery rate.
Kaplan-Meier survival curve for the training cohort (A) and validation cohort (B). P value from the log-rank test.
Increasing risk scores suggested a worse prognosis in both the training and validation cohorts
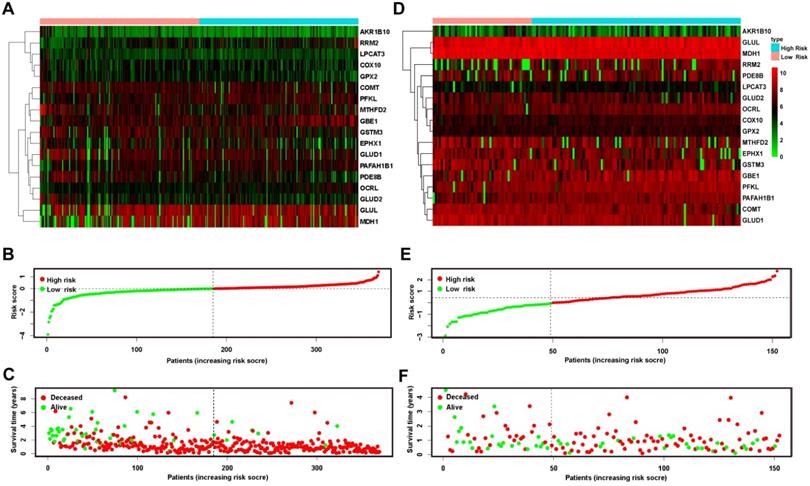
To further examine the relationship between the expression levels of the 18 genes and prognosis, we drew heatmaps (Figure 4A & D) that suggested that the gene expression profiles of patients in the low- and high-risk groups showed no significant difference at the single-gene level. All of the patients in both the training and validation cohorts were ranked in ascending order of risk scores (Figure 4B & E). Compared to the training cohort, more patients in the validation cohort fell into the low-risk group. Furthermore, we plotted each patient according to their risk scores and survival time (Figure 4C & F). On the x-coordinate, patients were uniformly ranked in ascending order of risk scores as mentioned above, and the y-axis reflected each patient's survival time. The distributions of the survival state (deceased or alive) and survival time were presented as negatively related to the risk score.
Risk plot of the training and validation cohorts. A heatmap of 18 metabolic genes showed the different expression patterns between high-risk and low-risk patients in the training (A) and validation (D) cohorts. (B and E) plotted the risk score of each patient and presented the cut-off value that defined high- and low-risk patients in the 2 cohorts, respectively. The OS of patients in the training (C) and validation (F) cohorts was plotted according to the value of the risk score. OS: overall survival.
Multivariate Cox regression model and ROC analysis of the training and validation cohorts
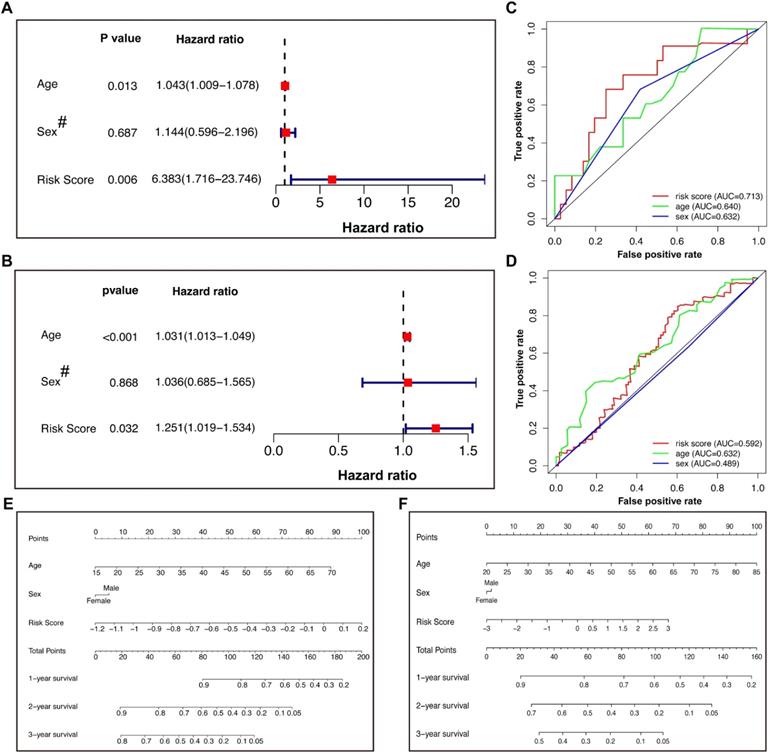
We incorporated sex and age into the model to further explore other clinical factors related to prognosis (Figure 5). In the training cohort, both univariate (Table 2) and multivariate Cox regression (Figure 5A) indicated that the age and risk score were significantly related to the OS, with HRs of 1.043 and 6.383, respectively, in the multivariate model. However, the patient sex was not an independent risk factor. The same model applied to the validation cohort reached similar conclusions (Figure 5B), suggesting that the risk score calculated by our Lasso model was an independent risk factor for GBM patients (HR: 1.251 with 95% CI: 1.019-1.534). ROC analysis of the training cohort indicated that the risk score had better predictive power than age (Figure 5C), while this effect was not observed in the validation cohort (Figure 5D). The different conclusions might be due to the difference in baseline data, such as age, between the two groups. It was possible that the predictive power of age improved gradually as age increased. To further optimize the model, nomograms of the two groups were plotted to illustrate the relationships between the sex, age, and risk score and prognosis (Figure 5E & F).
Cox regression, ROC analysis, and nomograms for patients in the training and validation cohorts. (A) Multivariate Cox regression of the training cohort. (B) Multivariate Cox regression of the validation cohort. The hazard ratios of age and risk score were 1.031 (95% CI 1.013-1.049) and 1.251 (95% CI 1.019-1.534), respectively, with P values less than 0.05. (C and D) ROC analysis of age, sex, and risk score of patients in the training (C) and validation (D) cohorts. (E and F) Nomograms predicted the 1-, 2-, and 3-year survival of patients in the training (E) and validation (F) cohorts. # Female=0; Male=1. ROC: receiver operating characteristic.
Univariate Cox regression of training and validation cohorts
| Training cohort | Validation cohort | |||||
|---|---|---|---|---|---|---|
| HR | 95% CI | P value | HR | 95% CI | P value | |
| Age | 1.049 | (1.017, 1.081) | 0.002* | 1.035 | (1.017, 1.053) | <0.001* |
| Gender† | 1.415 | (0.746, 2.683) | 0.3 | 0.824 | (0.555, 1.224) | 0.3 |
| Risk score | 7.782 | (2.268, 26.704) | 0.001* | 1.336 | (1.102, 1.620) | 0.003* |
† Female=0, Male=1; HR: hazard ratio; CI: confidence interval. *Marked significant differences.
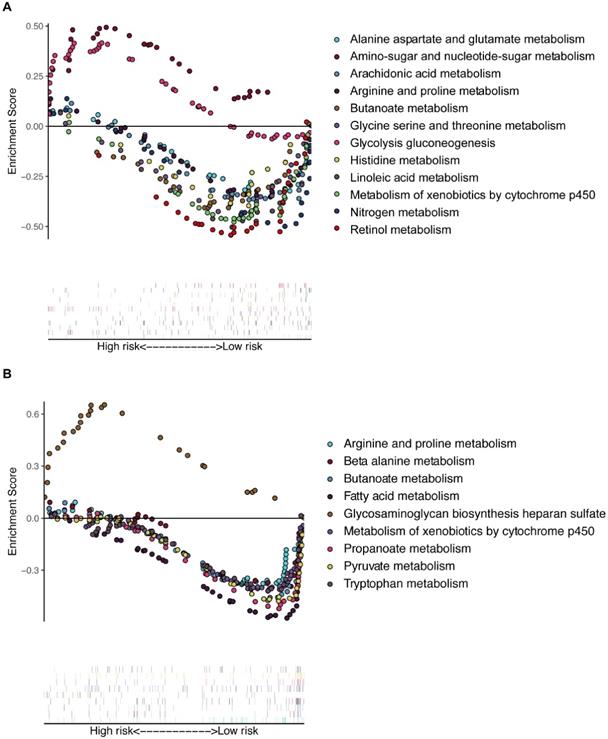
Multiple GSEA of the training and validation cohorts
Multiple GSEA was performed, and 155 and 178 enriched KEGG pathways were found in the training and validation cohorts, respectively. There were many overlapping enrichment pathways between the two groups, including the majority of metabolism-related gene sets, as expected (Figure 6). The metabolism of arginine, proline, butanoate, and xenobiotic compounds by the cytochrome p450 pathway was markedly enriched in low-risk patients of both the training and validation cohorts. Some important energy metabolism pathways, such as glycolysis gluconeogenesis and amino-sugar and glutamate metabolism, were significantly enriched in the high-risk patients of the training cohort (Figure 6A), and fatty acid and pyruvate metabolism pathways were dramatically enriched in the low-risk patients of the validation cohort (Figure 6B). To further compare the key genes among different tumors, we conducted external validation using the Tumor IMmune Estimation Resource (TIMER) database (see Supplemental Figure S1). The expression profiles of these key genes were different in other tumors, suggesting heterogeneity between different tumors.
Multiple GSEA of the enriched KEGG pathways in the training (A) and validation (B) cohorts. GSEA: gene set enrichment analysis.
Validation of the crucial genes and related proteins in human tissues
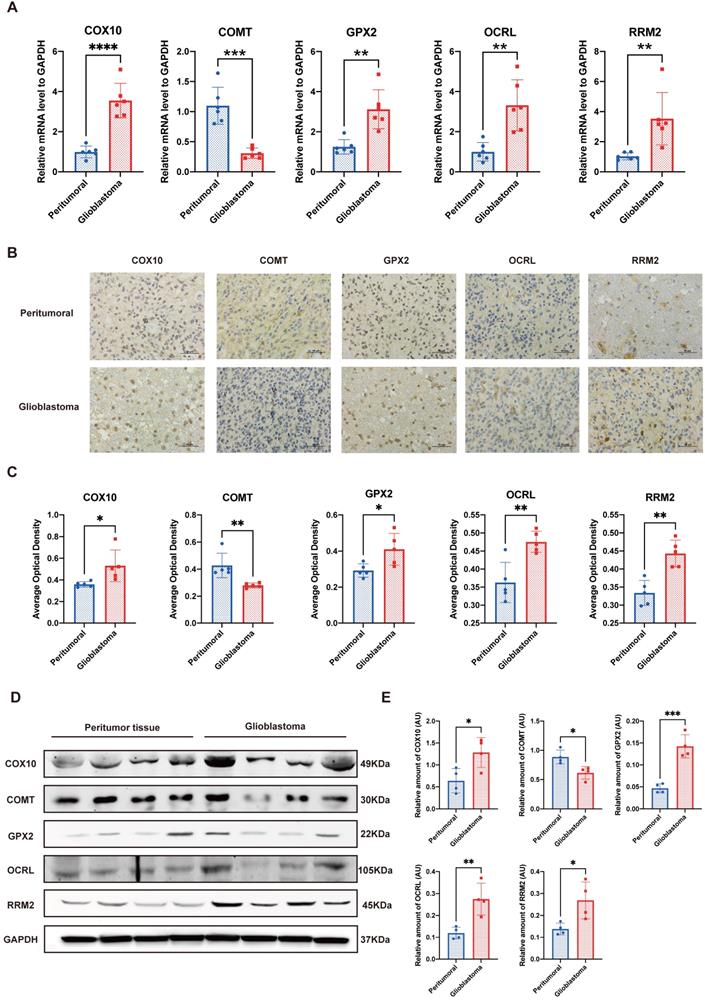
To further validate the reliability of the bioinformatics analysis of the dataset, we performed qPCR, IHC and western blot to determine the crucial genes in the prognostic model. At the transcriptional level, two of the top three favorable genes positively related to the OS, that is, COX10 and GPX2, along with OCRL and RRM2, which were the most unfavorable genes, exhibited significantly higher expression levels in GBM compared to their peritumor counterparts. Meanwhile, only one gene with a positive relationship to the OS, COMT, was down-regulated in GBM (Figure 7A). IHC and western blot analysis further explained the trend at the translation level (Figure 7B-E). These laboratory findings were entirely consistent with the public dataset's bioinformatics analysis (see Supplemental Table S1).
Validation of the crucial genes in the prognostic model. A. Quantitative real-time polymerase chain reaction (qRT-PCR) of the 5 crucial genes. B&C. Representative figures and statistical analysis of immunohistochemical staining. D&E. Representative figures and statistical analysis of western blot. *P<0.05, **P<0.01, ***P<0.001 vs. respective normal tissues.
Discussion
Our work built a metabolic prognostic model for GBM patients based on the GEO database, which included 18 metabolic genes affecting the prognosis of GBM patients. Independent external validation with the TCGA database proved that our model could effectively stratify and predict the OS through the expression levels of metabolic genes. In addition, our data suggest that the higher expression levels of COX10, COMT, and GPX2 were related to a better OS, whereas the higher expression levels of OCRL and RRM2 were prone to a worse outcome. These findings indicate that the OS of GBM patients was significantly correlated with the expression levels of several metabolic genes, and the prognostic risk scores derived from our model are of considerable value in predicting patient survival.
The mortality rate of GBM remains high, and studies have proven that alterations in metabolic pathways and genes are significant in tumor development and patient prognosis [5, 7, 20, 21]. In recent years, predictive models based on metabolic gene and mRNA characteristics have also become the research focus [22]. However, it is hard to accurately conclude GBM prognosis prediction merely from a single gene analysis. To improve the capability of the predictive model, we analyzed all differentially expressed metabolic genes and established a multiple gene expression model. In addition, due to the complexity of metabolic networks, a large number of metabolic genes are possibly involved in multiple pathways. For example, GBE1 in our model is involved in galactose metabolism and glycogen metabolism, whereas EPHX1 plays a role in drug metabolism and naphthalene metabolism. Therefore, the multiple gene expression model is able to simulate the process of tumor metabolism more effectively and achieve better predictive potential.
Several studies have focused on prognostic models for glioma patients. Gittleman et al. constructed a nomogram using Cox proportional hazards regression of lower-grade glioma patients based on the TCGA database, in which the tumor grade, age at diagnosis, and IDH mutation were listed as independent risk factors [23]. Our metabolic prognostic model came to a similar conclusion that the age at diagnosis and risk score were significantly related to OS. Several model-establishing research studies have been performed to reveal the relationship between the whole transcriptome or metabolic alterations and the prognosis of GBM patients [24-26]. Compared to prior methods, our model focused on all of the metabolic genes enriched by KEGG pathways and applied Lasso‐penalized Cox regression analysis, which is believed to be more accurate than stepwise selection [17]. Nevertheless, the molecular subtype was not included as a risk factor in our model due to data limitations, which may have a certain impact.
The top 3 favorable genes positively related to OS were COX10, COMT and GPX2. COX10 encodes cytochrome c oxidase, which is the terminal component of the mitochondrial respiratory chain and is involved in multiple tumors [27, 28]. Elevated COX10 levels are negatively correlated with the prognosis of glioma and meningioma patients and may result in abnormal phosphorylation processes [29, 30]. We observed a slightly increased expression of COX10 (log2FC=1.07, see Supplemental Table S2), while our prognostic model suggested that it is favorable in GBM, which is opposite to the existing findings and deserves further investigation. COMT encodes catechol-O-methyltransferase, and studies indicated that COMT upregulates tumor suppressor genes by the PI3K/Akt pathway, thus inhibiting the growth and invasion of cancer cells [31, 32]. COMT mutations are significantly correlated with cognitive impairment in pan-brain tumor patients and glioma patients in particular [33, 34]. Therefore, COMT may have a potential protective effect, and mutations may influence prognosis by affecting cognitive ability. Glutathione peroxidase 2 is encoded by GPX2 and catalyzes the reduction in organic hydroperoxides and hydrogen peroxide, thereby protects cells against oxidative damage [35]. However, the role of GPX2 in GBM has not been reported. Our model suggested that GPX2 was positively related to the patient OS, indicating that protection against oxidative damage might exist in CNS tumors.
The unfavorable genes that indicate poor OS include OCRL and RRM2. OCRL encodes inositol polyphosphate 5-phosphatase, which regulates PI3K/Akt signaling, endocytosis, vesicle trafficking, cell migration, proliferation and apoptosis [36, 37]. Currently, few studies have focused on the role and mechanism of OCRL in GBM, and more research on the relationship between them is needed. RRM2 belongs to ribonucleotide reductase, which catalyzes deoxyribonucleotides from ribonucleotides. The high level of RRM2 expression has received extensive attention in several cancers [38]. It has been proven that the overexpression of RRM2 can promote the proliferation, migration and invasion of GBM cells and inhibit apoptosis in cell experiments [39]. The same results were observed in animal experiments, which may explain its influence on the OS. The roles of these genes, especially OCRL and GPX2, in GBM remain far from distinct.
To further investigate the metabolic alterations in GBM patients, GSEA was conducted and revealed that differentially expressed metabolic genes were significantly enriched in specific signaling pathways. Hence, the molecules involved in these metabolic pathways may serve as diagnostic biomarkers and treatment targets. Our model is promising for reflecting the dysregulation of the metabolic microenvironment after further research and supporting metabolic therapy. According to published studies, most of these genes have been proven to be related to tumor occurrence and development. The genes are mainly involved in glucose metabolism, amino acid metabolism and DNA damage repair.
In order to initially verify the model, we used tumor and adjacent normal brain samples of GBM patients for IHC qPCR and western blotting. The laboratory verifications all confirmed that some metabolic genes involved in the model showed differences in transcription and translation levels between GBM and normal tissues. This result verified the validity of the differential gene analysis and indirectly indicated the reliability of bioinformatics methods to analyze the results of public databases and the validity of the prognostic signature based on them.
There are several limitations to this study. First, our model was merely based on public databases and showed a lack of patient cohort clinical information or original laboratory results. The patient follow-up cohort has been prospectively collected, which entirely records patients' clinical baseline information for further validation. Second, we reported only the relationship between these metabolic genes and the prognosis of GBM patients, while no cellular or animal experiment proving the conclusion and exploring the mechanism has been performed. For preliminary validation, laboratory verifications have been conducted, which can primarily confirm the conclusions of our analysis. Additionally, some genes included in our model are located in the same segment of one chromosome, and it is difficult to rule out the effect of chromosomal physical factors. Meanwhile, we included differentially expressed genes, resulting in that some genes with promising influences on the prognosis of GBM were not included due to their nonsignificant expression differences. Additionally, our included data did not rule out the bias among the databases or differentiate the molecular characteristic, and subgroup analysis is needed. Our model would be strengthened by expanding the sample size, adjusting it and proving its effectiveness in a multicenter independent cohort. Moreover, further basic studies to reveal the mechanisms of relevant genes in the development and occurrence of GBM are vital.
Conclusions
In summary, our study developed a novel metabolic prognostic model for GBM based on the GEO dataset, which was validated by data from TCGA. Our model is capable of analyzing the risk level according to the expression levels of specific metabolic genes and predicting the patients' survival. In addition, the results reflected alterations in the metabolic microenvironment and indicated potential biomarkers for diagnosis and treatment.
Abbreviations
CNS: central nervous system; GBM: glioblastoma; GEO: gene expression omnibus; GSEA: gene set enrichment analysis; GTEx: genotype-tissue expression; HCC: hepatocellular carcinoma; IDH: isocitrate dehydrogenase; KEGG: Kyoto Encyclopedia of Genes and Genomes; NCCN: National Comprehensive Cancer Network; OS: overall survival; SVA: surrogate variable analysis; WHO: World Health Organization.
Supplementary Material
Supplementary figures and tables.
Acknowledgements
This manuscript has been released as a pre-print at https://www.researchgate.net/publication/340199313_Prognostic_prediction_model_for_glioblastoma_a_metabolic_gene_signature_and_independent_external_validation.
Ethics approval and consent to participate
Since this was a retrospective medical record review study of public databases, written informed consent was waived. The patients' surgical specimens used in laboratory validation were approved by the Institutional Review Board of Peking Union Medical College Hospital (S-424).
Funding
This work was partially funded by the Beijing Municipal Natural Science Foundation from the Beijing Municipal Science & Technology Commission [grant number: 7202150 & 19JCZDJC64200(Z)], the Chinese Academy of Medical Sciences Innovation Fund for Medical Sciences from the Chinese Academy of Medical Sciences [grant number: 2016-I2M-2-001], and the Tsinghua University-Peking Union Medical College Hospital Initiative Scientific Research Program from the Peking Union Medical College Hospital [grant number: 2019ZLH101].
Availability of data and materials
The datasets used and/or analyzed during the current study are available from the corresponding author on reasonable request.
Authorship
Study design: Chuxiang Lei, Wenlin Chen, Wenbin Ma, and Yu Wang; Statistical Analysis: Chuxiang Lei and Wenlin Chen; Manuscript writing: Wenlin Chen, Chuxiang Lei, Penghao Liu, Yuekun Wang, Yaning Wang, and Congxin Dai; Manuscript modification: Binghao Zhao, Ziren Kong, Delin Liu, Wenbin Ma, and Yu Wang. All authors reviewed the manuscript.
Competing Interests
The authors have declared that no competing interest exists.
References
1. Ostrom QT, Gittleman H, Truitt G, Boscia A, Kruchko C, Barnholtz-Sloan JS. CBTRUS Statistical Report: Primary Brain and Other Central Nervous System Tumors Diagnosed in the United States in 2011-2015. Neuro Oncol. 2018;20:iv1-iv86
2. Stupp R, Mason WP, van den Bent MJ, Weller M, Fisher B, Taphoorn MJ. et al. Radiotherapy plus concomitant and adjuvant temozolomide for glioblastoma. N Engl J Med. 2005;352:987-96
3. Mildenberger I, Bunse L, Ochs K, Platten M. The promises of immunotherapy in gliomas. Current opinion in neurology. 2017;30:650-8
4. Behin A, Hoang-Xuan K, Carpentier AF, Delattre JY. Primary brain tumours in adults. Lancet (London, England). 2003;361:323-31
5. McNeill KA. Epidemiology of Brain Tumors. Neurologic clinics. 2016;34:981-98
6. Hanahan D, Weinberg RA. Hallmarks of cancer: the next generation. Cell. 2011;144:646-74
7. Petersen MC, Vatner DF, Shulman GI. Regulation of hepatic glucose metabolism in health and disease. Nat Rev Endocrinol. 2017;13:572-87
8. Cadoret A, Ovejero C, Terris B, Souil E, Levy L, Lamers WH. et al. New targets of beta-catenin signaling in the liver are involved in the glutamine metabolism. Oncogene. 2002;21:8293-301
9. Leone RD, Zhao L, Englert JM, Sun IM, Oh MH, Sun IH. et al. Glutamine blockade induces divergent metabolic programs to overcome tumor immune evasion. Science (New York, NY). 2019;366:1013-21
10. Agnihotri S, Zadeh G. Metabolic reprogramming in glioblastoma: the influence of cancer metabolism on epigenetics and unanswered questions. Neuro Oncol. 2016;18:160-72
11. Toyonaga T, Yamaguchi S, Hirata K, Kobayashi K, Manabe O, Watanabe S. et al. Hypoxic glucose metabolism in glioblastoma as a potential prognostic factor. European journal of nuclear medicine and molecular imaging. 2017;44:611-9
12. Feng L, Qian H, Yu X, Liu K, Xiao T, Zhang C. et al. Heterogeneity of tumor-infiltrating lymphocytes ascribed to local immune status rather than neoantigens by multi-omics analysis of glioblastoma multiforme. Scientific reports. 2017;7:6968
13. Yu X, Feng L, Liu D, Zhang L, Wu B, Jiang W. et al. Quantitative proteomics reveals the novel co-expression signatures in early brain development for prognosis of glioblastoma multiforme. Oncotarget. 2016;7:14161-71
14. Lee Y, Scheck AC, Cloughesy TF, Lai A, Dong J, Farooqi HK. et al. Gene expression analysis of glioblastomas identifies the major molecular basis for the prognostic benefit of younger age. BMC Med Genomics. 2008;1:52
15. Leek JT, Storey JD. Capturing heterogeneity in gene expression studies by surrogate variable analysis. PLoS Genet. 2007;3:1724-35
16. Diboun I, Wernisch L, Orengo CA, Koltzenburg M. Microarray analysis after RNA amplification can detect pronounced differences in gene expression using limma. BMC Genomics. 2006;7:252
17. Tibshirani R. The lasso method for variable selection in the Cox model. Stat Med. 1997;16:385-95
18. Iasonos A, Schrag D, Raj GV, Panageas KS. How to build and interpret a nomogram for cancer prognosis. J Clin Oncol. 2008;26:1364-70
19. Subramanian A, Tamayo P, Mootha VK, Mukherjee S, Ebert BL, Gillette MA. et al. Gene set enrichment analysis: a knowledge-based approach for interpreting genome-wide expression profiles. Proc Natl Acad Sci U S A. 2005;102:15545-50
20. Yan H, Parsons DW, Jin G, McLendon R, Rasheed BA, Yuan W. et al. IDH1 and IDH2 mutations in gliomas. N Engl J Med. 2009;360:765-73
21. Prabhu AH, Kant S, Kesarwani P, Ahmed K, Forsyth P, Nakano I. et al. Integrative cross-platform analyses identify enhanced heterotrophy as a metabolic hallmark in glioblastoma. Neuro Oncol. 2019;21:337-47
22. Liu GM, Xie WX, Zhang CY, Xu JW. Identification of a four-gene metabolic signature predicting overall survival for hepatocellular carcinoma. J Cell Physiol. 2020;235:1624-36
23. Gittleman H, Sloan AE, Barnholtz-Sloan JS. An independently validated survival nomogram for lower-grade glioma. Neuro Oncol. 2020;22:665-74
24. Xu P, Yang J, Liu J, Yang X, Liao J, Yuan F. et al. Identification of glioblastoma gene prognosis modules based on weighted gene co-expression network analysis. BMC Med Genomics. 2018;11:96
25. He Z, Wang C, Xue H, Zhao R, Li G. Identification of a Metabolism-Related Risk Signature Associated With Clinical Prognosis in Glioblastoma Using Integrated Bioinformatic Analysis. Frontiers in oncology. 2020;10:1631
26. Zhou Z, Huang R, Chai R, Zhou X, Hu Z, Wang W. et al. Identification of an energy metabolism-related signature associated with clinical prognosis in diffuse glioma. Aging (Albany NY). 2018;10:3185-209
27. Chen Z, Li Y, Zhang H, Huang P, Luthra R. Hypoxia-regulated microRNA-210 modulates mitochondrial function and decreases ISCU and COX10 expression. Oncogene. 2010;29:4362-8
28. Antonicka H, Leary SC, Guercin GH, Agar JN, Horvath R, Kennaway NG. et al. Mutations in COX10 result in a defect in mitochondrial heme A biosynthesis and account for multiple, early-onset clinical phenotypes associated with isolated COX deficiency. Hum Mol Genet. 2003;12:2693-702
29. Schmidt M, Mock A, Jungk C, Sahm F, Ull AT, Warta R. et al. Transcriptomic analysis of aggressive meningiomas identifies PTTG1 and LEPR as prognostic biomarkers independent of WHO grade. Oncotarget. 2016;7:14551-68
30. Luan F, Chen W, Chen M, Yan J, Chen H, Yu H. et al. An autophagy-related long non-coding RNA signature for glioma. FEBS Open Bio. 2019;9:653-67
31. Lautala P, Ulmanen I, Taskinen J. Molecular mechanisms controlling the rate and specificity of catechol O-methylation by human soluble catechol O-methyltransferase. Mol Pharmacol. 2001;59:393-402
32. Wu W, Wu Q, Hong X, Xiong G, Xiao Y, Zhou J. et al. Catechol-O-methyltransferase inhibits colorectal cancer cell proliferation and invasion. Arch Med Res. 2015;46:17-23
33. Altshuler DB, Wang L, Zhao L, Miklja Z, Linzey J, Brezzell A. et al. BDNF, COMT, and DRD2 polymorphisms and ability to return to work in adult patients with low- and high-grade glioma. Neurooncol Pract. 2019;6:375-85
34. Correa DD, Satagopan J, Cheung K, Arora AK, Kryza-Lacombe M, Xu Y. et al. COMT, BDNF, and DTNBP1 polymorphisms and cognitive functions in patients with brain tumors. Neuro Oncol. 2016;18:1425-33
35. Talmud PJ, Drenos F, Shah S, Shah T, Palmen J, Verzilli C. et al. Gene-centric association signals for lipids and apolipoproteins identified via the HumanCVD BeadChip. Am J Hum Genet. 2009;85:628-42
36. Hyvola N, Diao A, McKenzie E, Skippen A, Cockcroft S, Lowe M. Membrane targeting and activation of the Lowe syndrome protein OCRL1 by rab GTPases. Embo j. 2006;25:3750-61
37. Hakim S, Bertucci MC, Conduit SE, Vuong DL, Mitchell CA. Inositol polyphosphate phosphatases in human disease. Curr Top Microbiol Immunol. 2012;362:247-314
38. Furuta E, Okuda H, Kobayashi A, Watabe K. Metabolic genes in cancer: their roles in tumor progression and clinical implications. Biochim Biophys Acta. 2010;1805:141-52
39. Li C, Zheng J, Chen S, Huang B, Li G, Feng Z. et al. RRM2 promotes the progression of human glioblastoma. J Cell Physiol. 2018;233:6759-67
Author contact
![]() Corresponding authors: Yu Wang, Department of Neurosurgery, Peking Union Medical College Hospital, Peking Union Medical College and Chinese Academy of Medical Sciences, No. 1 Shuaifuyuan, Dongcheng District, Beijing, China. Tel.: +8615311860318, Fax number: 86-010-69152530, E-mail: ywangcn; Wenbin Ma, Department of Neurosurgery, Peking Union Medical College Hospital, Peking Union Medical College and Chinese Academy of Medical Sciences, No. 1 Shuaifuyuan, Dongcheng District, Beijing, China. Tel.: +8613701364566, Fax number: 86-010-69152530, E-mail: mawb2001com.
Corresponding authors: Yu Wang, Department of Neurosurgery, Peking Union Medical College Hospital, Peking Union Medical College and Chinese Academy of Medical Sciences, No. 1 Shuaifuyuan, Dongcheng District, Beijing, China. Tel.: +8615311860318, Fax number: 86-010-69152530, E-mail: ywangcn; Wenbin Ma, Department of Neurosurgery, Peking Union Medical College Hospital, Peking Union Medical College and Chinese Academy of Medical Sciences, No. 1 Shuaifuyuan, Dongcheng District, Beijing, China. Tel.: +8613701364566, Fax number: 86-010-69152530, E-mail: mawb2001com.