Impact Factor ISSN: 1837-9664

 Global reach, higher impact
J Cancer 2021; 12(14):4295-4306. doi:10.7150/jca.54565 This issue Cite
Research Paper
Systematic Analysis of 4-gene Prognostic Signature in Patients with Diffuse Gliomas Based on Gene Expression Profiles
Chunhai Huang1,2#, Zujian Xiong3,4,5#, Qi Yang3,5, Xuejun Li3,5 ![]()
1. Department of Neurosurgery, First Affiliated Hospital of Jishou University, Jishou, Hunan, 416000, China.
2. Centre for Clinical and Translational Medicine Research, Jishou University, Jishou, Hunan, 416000, China.
3. Department of Neurosurgery, Xiangya Hospital, Central South University, Changsha, Hunan, 410008, China.
4. Xiangya School of Medicine, Central South University, Changsha, Hunan, 410008, China.
5. Hunan International Scientific and Technological Cooperation Base of Brain Tumor Research, Xiangya Hospital, Central South University, Changsha, Hunan, 410008, P. R. China.
#Co-first authors with equal contributions to this work.
Received 2020-10-16; Accepted 2021-4-24; Published 2021-5-19
Abstract

Background: Diffuse gliomas are a group of diseases that contain different degrees of malignancy and complex heterogeneity. Previous studies proposed biomarkers for certain grades of gliomas, but few of them have conducted a systematic analysis of different grades to search for molecular markers.
Methods: WGCNA was used to find significant genes associated with malignant progression of diffuse glioma in TCGA glioma sequencing expression data and the GEO expression profile-merge meta dataset. Lasso regression was used for potential model building and the best model was selected by CPE, IDI, and C_index. Risk score model was used to evaluate the gene signature prognostic power. Multi-omics data, including CNV, methylation, clinical traits, and mutation, were used for model evaluation.
Results: We found out 67 genes significantly associated with malignant progression of diffuse glioma by WGCNA. Next, we established a new 4 gene molecular marker (KDELR2, EMP3, TIMP1, and TAGLN2). Multivariate cox analysis identified the risk score of the 4 genes as an independent predictor of prognosis in patients with diffuse gliomas, and its predictive power was independent of the histopathological grades of glioma. Further, we had confirmed in five independent test datasets and the risk score remained good predictive power. The combination of the prognosis model with specific molecular characteristics possessed a better predictive power. Furthermore, we divided the low-risk group into three subtypes: LowRisk_IDH1wt, LowRisk_IDH1mut/ATRXmut, and LowRisk_IDH1mut/ATRXwt by combining IDH1 mutation with ATRX mutation, which possessed obvious survival difference. In further analysis, we found that the 4 gene prognosis model possessed multi-omics features.
Conclusion: We established a malignant-related 4-gene molecular marker by glioma expression profile data from multiple microarrays and sequencing data. The four markers had good predictive power on the overall survival of glioma patients and were associated with gliomas' clinical and genetic backgrounds, including clinical features, gene mutation, methylation, CNV, signal pathways.
Keywords: diffuse glioma, prognosis model, expression data, bioinformatics, systematic analysis
Introduction
Gliomas are the most common and lethal type of primary CNS tumors in adults. Among them, diffuse gliomas (DGs) constitute the majority of gliomas, including lower-grade gliomas (LGG, grade II-III), and glioblastomas (GBM, grade IV) according to WHO classification [1]. Due to intra- and inter-tumoral heterogeneity, gliomas' molecular characteristics, and clinical phenotypes could be different, even if identified as the same histological grade. For example, grade II glioma with IDH mutation and 1p19q codeletion possesses a better prognosis, whose median survival is 96 months, than the one with IDH wild type whose median survival is merely 20.4 months-long [2]. Although regarded as benign-natured tumors, more than 70% of diffuse LGGs would transform into anaplastic gliomas or even secondary glioblastomas in 10 years [3]. The classification system based on histology is not sufficient for glioma precise diagnosis, thus WHO introduced molecular characteristics into glioma classification system in 2016 for improving diagnostic accuracy. Meanwhile, progress in the development of genome sequencing technologies and bioinformatics tools shed a light for us on understanding the pathology of gliomas. By analyzing these sequencing data, researchers have found plenty of specific molecular markers like IDH mutation, MGMT promoter methylation, and TERT mutation, etc. These molecular markers of glioma gave us a novel understanding of the mechanism and diagnosis of glioma, and introduced new treatments for glioma patients [4, 5]. However, the molecular mechanisms of different survival outcomes and tumor heterogeneity are still unclear and remain further exploration. For improving the diagnosis accuracy and precision of prognosis prediction, it is necessary for us to search for more effective molecular markers and targets.
Previous studies have confirmed that tumor classification based on expression profiles is an objective and reliable method to help diagnosis and treatment, and lots of practices were performed on glioma by now [6]. But most of them were inclined to a specific glioma subtype, there are few studies build an adequate prediction model for all DGs. In our study, we united multiple complete large-scale gene expression profiles, high-throughput sequencing datasets and multidimensional data, including gene mutations, copy number variations and methylation datasets, of DGs to figure out the most responsible molecular markers for glioma prognosis.
Materials and methods
Data collection
We obtained TCGA glioma RNA-seq raw count data, copy number variation (CNV) data, DNA methylation data, mutation data, and corresponding clinical information from GDC by using R package TCGAbiolinks. RNA-seq raw count data were preprocessed and normalized with R package DESeq2 and R package preprocessCore. CGGA RNA-seq data and microarray data (level 3) is obtained from http://cgga.org.cn. Besides, we obtained 9 datasets from the GEO database (https://www.ncbi.nlm.nih.gov/geo) (Tab.S1). All files obtained from the GEO datasets were in the CEL format and were preprocessed by R package affy and gcrma. Due to limited patient size or incomplete pathological information, we merged 6 microarray sets (GSE43378, GSE19728, GSE4290, GSE61374, GSE43289, GSE7696) in the Hg-u133 Plus 2.0 platform into one large dataset (named meta_GSE1) and corrected batch effect by using R package sva. The batch effect in the CGGA RNA-seq data was also removed. Another 3 GEO datasets (GSE16011, GSE68848, GSE74187) were downloaded for model validation after batch effect removal. All non-DGs samples from all datasets were excluded from this study. We merged the gene symbol with multi probes and the average value was used. The study was approved by the Jishou university ethics review committee.
Identification of tumor progression-associated genes with weighted correlation network analysis (WGCNA)
In order to screen progression-associate genes, we used the expression profile data from TCGA and meta_GSE1 and constructed a co-expression network using R package WGCNA [7]. Common genes in the most grade-relevant module identified from these two datasets respectively were selected as the candidate for tumor progression-associated genes. Briefly, we first filtered out genes with missing value or low variable genes (var < 0.05). Outliers in samples were detected and removed. Next, we calculated sij and the adjacency matrix aij as follows: sij = |cor(xi, xj)|, aij = Sijβ. Where Xi and Xj were vectors of expression value for gene i and j, sij represented the Pearson's correlation coefficient of gene i and gene j, aij encoded the network connection strength between gene i and gene j [8]. The power of β = 9 (scale free R2 = 0.95) was selected as the soft-thresholding parameter to ensure a scale-free network. Then, average linkage hierarchical clustering was conducted based on a topological overlap matrix (TOM)-based dissimilarity measure. We considered 30 as the minimum number of genes in each module. The gene modules were identified using the DynamicTreeCut algorithm and merged with a cut-height of 0.2. The module eigengenes (MEs) were generated as the first principal component after the principal component analysis was performed with the expression data for co-expressed modules. Module membership assignment (kME) was determined as Pearson's correlation coefficient between gene expression values and MEs. The candidate tumor progression-associated genes were screened from modules highly correlated with glioma grade (Absolute value of gene significance (GS) ≥0.2 and module membership (MM) absolute value ≥0.8).
Prognostic model construction
First, we screened genes that are associated with prognosis by univariable Cox analysis using coxph function of R package survival from candidate tumor progression-associated genes. To identify common prognosis-associated genes regardless of glioma grades, we selected intersected genes from all survival-associated genes in patients with grade II, III, and IV DGs separately (p < 0.05). To construct a robust model, we excluded samples with a survival time of less than one month as these patients may die due to reasons other than tumors. 630 samples were obtained for further analysis. To reduce overfitting, we used the Least Absolute Shrinkage and Selection Operator (LASSO) regression analysis to filter these genes by R package glmnet [9, 10]. The best lambda value is selected by the cv.glmnet function. The predictive ability of the model was determined by C_index, Concordance Probability Estimate (CPE), and integrated discrimination improvement (IDI) method (using coxph function, R package clinfun, and R package survIDINRI, respectively). A risk score model was constructed based on the expression levels of prognosis-associated genes and the contribution coefficient (β) of the univariate Cox proportional hazards regression model.
N, Expi, and Coei represented the number of signature genes, gene expression level, and coefficient value, respectively. The risk score was then divided into high and low-risk groups with the optimal cut-off value which calculated by surv_cutpoint function. Multivariate Cox analysis was conducted from the analyse_multivariate function in R package survivalanalysis. Prognostic receiver operating characteristic (ROC) curves of risk scores were then created from 1 to 10 years.
Integrated analysis combined clinical and multi-omics data of risk scoring model
Further, we used TCGA glioma expression profiles data, gene mutations data, CNV, methylation data, and immune activity to investigate the underlying mechanisms in each risk subgroup. Immune gene signatures were obtained from the R package imsig (https://github.com/ajitjohnson/imsig). ImSig is a set of gene signatures that can be used to estimate the relative abundance of immune cells in tissue transcriptomics data, especially in cancer datasets. The KEGG gene signatures were obtained from the Molecular Signatures Database v6.2 version (http://software.broadinstitute.org/gsea/downloads.jsp). GSEA analysis was performed by R package clusterProfiler [11]. Tumor ESTIMATE score, immune score, stromal score, and tumor purity were analyzed with R package estimate. Gene mutations data, DNA methylation data, and CNV data were preprocessed and analyzed using R package TCGAbiolinks. 101 glioma-related driver genes that we selected were derived from the mutational cancer driver database (https://www.intogen.org/search) [12]. Gene mutation analysis was performed by R package maftools. The R package ComplexHeatmap was used for heatmap drawing. The GOplot package was used for Gene Ontology (GO) annotation. The R package ggstatsplot was used for correlation analysis and plotting.
Statistical analysis
All statistical analyses were performed with R (version 3.5.2, http://www.r-project.org). The optimal cut-off value for patients' risk stratification was performed by surv_cutpoint function in R package survminer. Survival differences between the low-risk and high-risk groups were assessed by the Kaplan-Meier estimate and compared using the log-rank test. All statistical tests were two-sided and P values < 0.05 were considered statistically significant.
Results
Identification of glioma progression related genes
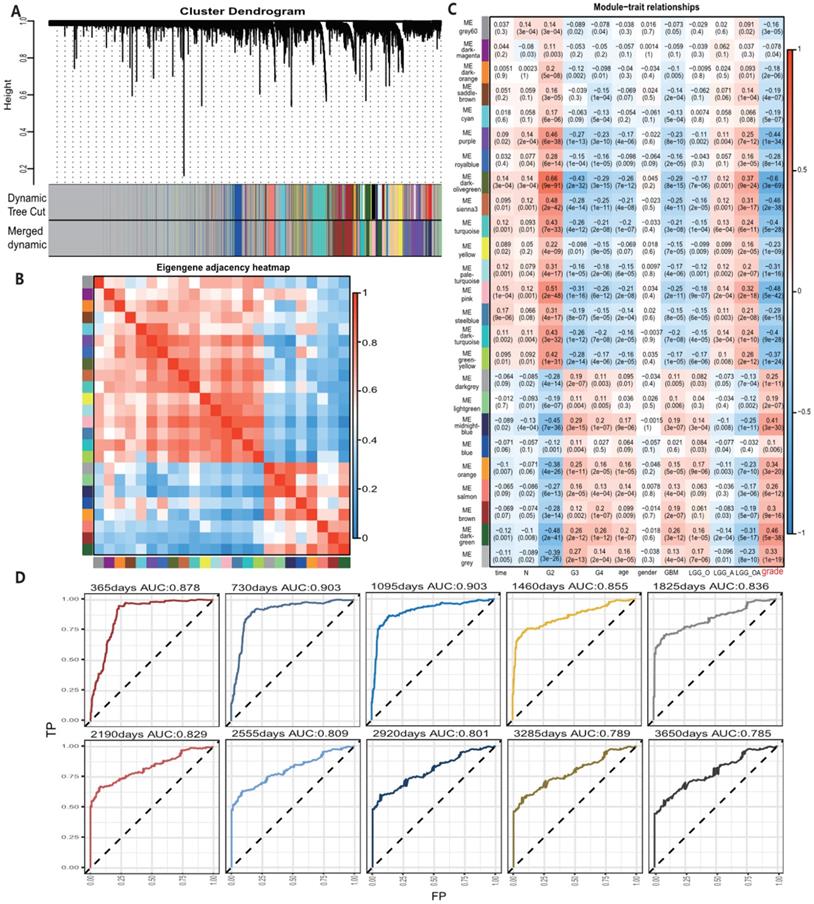
A total of 24 modules were identified by WGCNA in TCGA gene expression profile data (Fig. 1A-C), of which the darkolivegreen module showed the most significant negative correlation with tumor grade (r = -0.6, p = 3e-69). The pink and sienna3 modules were also inversely correlated with the darkolivegreen module and tumor grade. (r = -0.48, P = 5e-42; r = -0.46, P = 2e-38), while the darkgreen module showed the most positive correlation with tumor grade (r = 0.46, P = 5e-38). The midnightblue and orange modules had positive correlation with the darkgreen module and tumor grade (r = 0.41, P = 3e-30; r = 0.34, P = 3e-20). We finally chose these 6 modules, which contained 705 genes in the TCGA cohort, for further study. Also, 12 modules in the meta_GSE1 dataset were identified by WGCNA (Figure S1A-C). Of these modules, the brown module showed the most significant negative correlation with tumor grade (r = -0.6, P = 6e-50), and the magenta module was highly correlated with the brown module and negatively correlated with tumor grade (r = -0.41, P = 2e-22) as the brown module. The red module had the most significantly positive correlation with tumor grade (r = 0.58, P = 1e-46). The blue and tan modules were highly correlated with the red module and had positive correlation with tumor grade (r = 0.5, P = 5e-34; r = 0.42, P = 6e-23). We then identified five modules associated with tumor grade, which contained 254 genes, in the meta_GSE1 cohort. Finally, we selected 67 intersected genes in these two cohorts as candidate glioma progression-associated genes for further analysis (Table S2).
A, Module identification by WGCNA in the TCGA dataset and 24 gene modules were identified with statistical significance. B, Module correlation with correlation coefficient from 0 to 1, sienna3 and pink modules were positively correlated with darkolivegreen module. midnightblue and orange modules were positively correlated with darkgreen module. C, Module-trait correlation and the coefficient listed in the cells, positive correlation shows by color red and negative correlation in blue and p-value list in the brackets. Darkolivegreen module was the most significantly negatively correlated with tumor grades while darkgreen module was the most positively correlated with tumor grades. Sienna3, pink, orange, midnightblue modules had a strong correlation with tumor grades. D, Survival prediction ROC curve of prognosis model from 1 to 10 years and it showed 4 gene model possessed a high predictive power with AUC from 0.785-0.903.
Construction of the prognostic gene signature
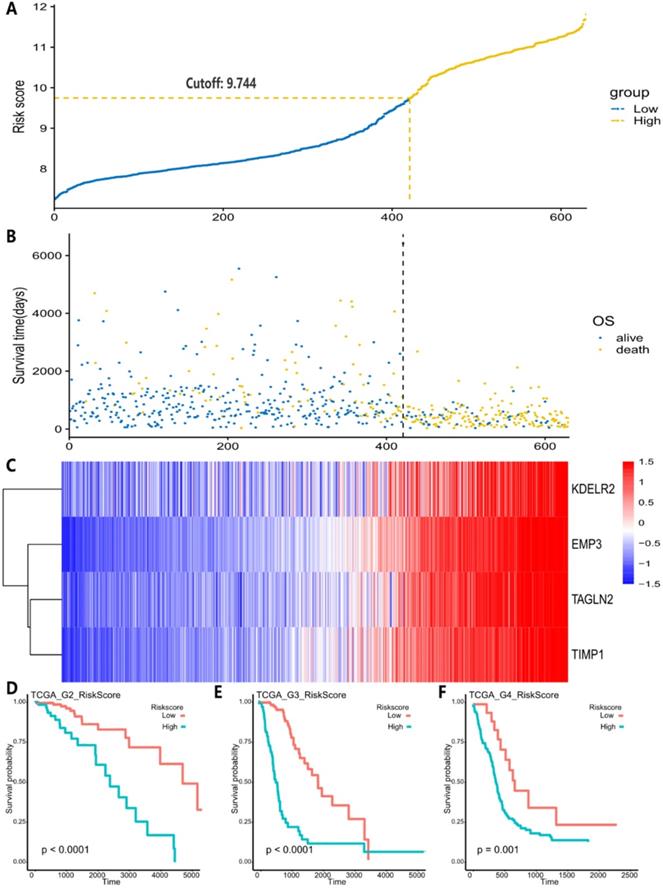
All 67 genes were statistically significant in the TCGA cohort (P<0.05) after the univariate Cox regression. We also performed the univariate Cox analysis of 67 genes in each pathological grade and 37 genes, which possessed statistical significance among all grades, were identified, suggesting that the prognostic role of these genes was independent of tumor pathological grades (Table S3). Next, we performed the LASSO regression analysis to build a robust model with these selected 37 genes. We first used 37 genes as an input for LASSO regression analysis. After 105 times iterations, two stable models were obtained: one was a 5-gene model with the best predictive performance when minimum lambda was obtained (mod_37_5). The other was a 4-gene model that contained the least number of variables with ideal predictive efficiency and was called mod_37_4. A similar procedure was performed for 67 genes mentioned above and two models (mod_67_6 and mod_67_5) were obtained, including 6 and 5 genes in each model, respectively. We did not observe an obvious predictive power difference of four models through the three methods: C_index, CPE, and IDI (Table S4). Therefore, we chose the simplest model with good predictive power, mod_37_4 for further study. The risk score was derived from these 4 genes. ROC curves of survival prediction power from 1 to 10 years showed that the risk score had a high predictive power across different time points (AUC=0.785~0.903) (Fig. 1D). Multivariate Cox analysis showed that the risk score was an independent prognostic factor (HR=1.633, P = 9.695E-06) (Table 1). Then, we divided patients of all grades into high or low subgroups according to the risk score, for that the independent prognostic role of this score in all grades (Fig. 2).
Multivariate Cox multivariate analysis
| Factor | HR | Lower_CI | Upper_CI | p value |
|---|---|---|---|---|
| age | 1.0214 | 1.0062 | 1.0369 | 0.005816 |
| gender | 0.9167 | 0.6707 | 1.2530 | 0.585471 |
| hist_GBM | 0.4834 | 0.2059 | 1.1351 | 0.095105 |
| hist_LGG_O | 0.6788 | 0.3695 | 1.2469 | 0.211736 |
| grade | 2.6161 | 1.5405 | 4.4426 | 0.000372 |
| hist_LGG_A | 1.0190 | 0.5849 | 1.7753 | 0.946989 |
| hist_LGG_OA | 1.0000 | NA | NA | NA |
| KPS | 0.9834 | 0.9712 | 0.9957 | 0.008511 |
| RiskScore | 1.6327 | 1.3139 | 2.0287 | 9.69E-06 |
A, Risk score distribution and the optimal cut-off of TCGA dataset for distinguishing high- and low-risk groups. B, Survival distribution of TCGA datasets and its correlation with risk score. C, 4 genes' expression in TCGA dataset and its correlation with risk score. The heatmap sorted by risk score increasingly. D-F, different tumor grades' K-M curve and they showed that high-risk group and low-risk group had significant survival differences in TCGA data.
Validation of the prognostic gene signature
To further verify the model prediction power, we divided samples into the low- and high-risk groups according to the optimal cut point in five independent datasets which were not used for model building (CGGA_microarray, CGGA_RNA-Seq, GSE16011, GSE68848, GSE74187). And we observed a significant difference in survival amid all these datasets (Fig. S2-S6). The dataset GSE74187 contained only GBM samples and was considered as an independent validation set for GBM. The results showed that the risk score remained its distinction ability in survival differences (Fig. S6). The multivariate Cox model revealed that the risk score was an independent prognostic factor in all validation sets (Table S5). Besides, we found that all four genes were highly expressed in patients with a high-risk score.
Pathway analysis based on prognosis model
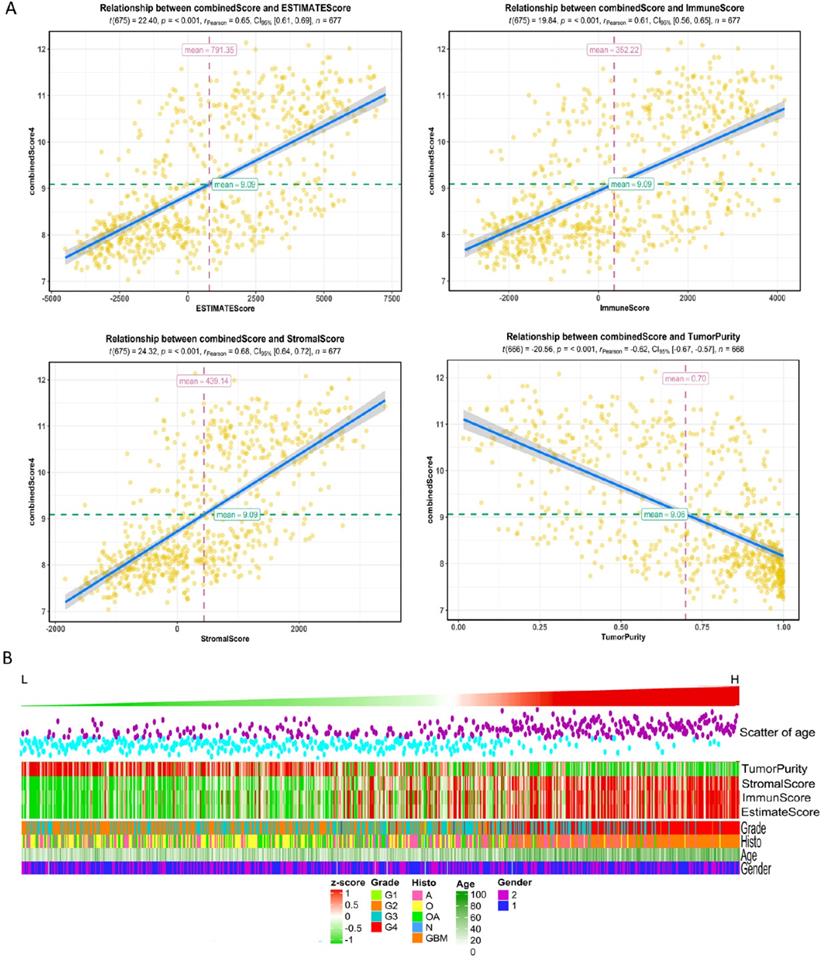
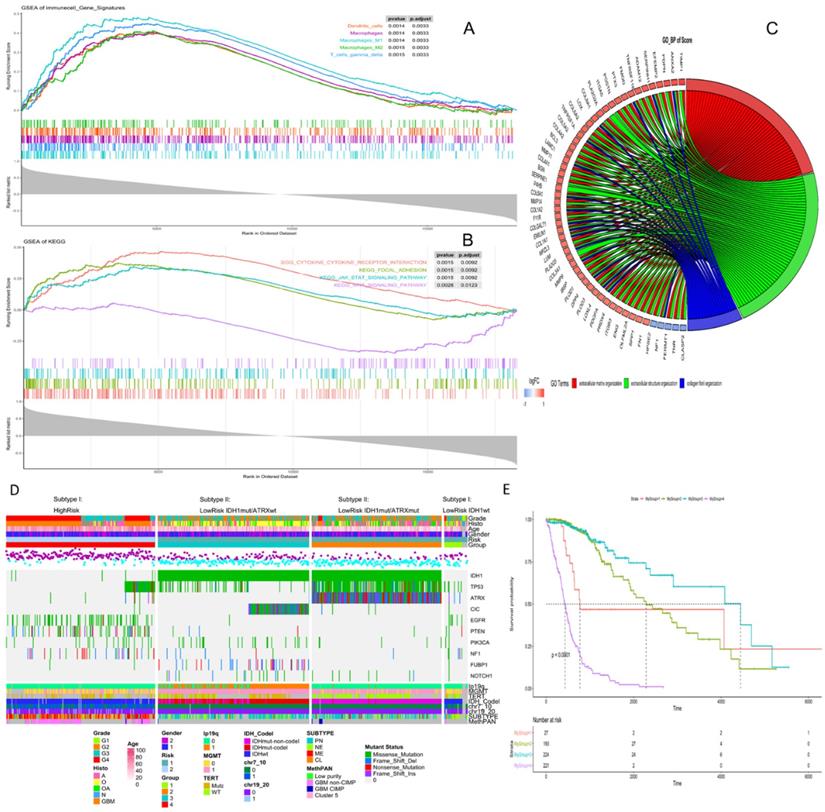
High risk scores were closely related to ESTIMATE score, immune score, and stromal score, but negatively correlated with tumor purity (Fig. 3). We drew the GOplot for GO-annotation of genes that were significantly associated with risk scores (r ≥ 0.7). Finally, 83 GO BP-related terms enriched in the high-risk group were obtained (qvalue < 0.05), among which these genes mainly involved in cellular processes such as extracellular structure organization, collagen fibril organization (Fig. 4C). To further discover the underlying functional mechanisms that lead to different prognosis in patients between high- and low-risk groups, we used GSEA for gene expression analysis based on ImsignSignature and KEGG database. The results indicated that nine immune signals, such as Macrophages, Macrophages M1, Macrophages M2, Dendritic cells, T cells gamma delta, were activated in the high-risk group (Fig. 4A). KEGG analysis enriched 52 pathways significantly correlated with the risk scores, including KEGG_CYTOKINE_CYTOKINE_RECEPTOR_INTERACTION, KEGG_FOCAL_ADHESION, and KEGG_JAK_STAT_SIGNALING_PATHWAY, etc. which were highly enriched in the high-risk patients (Fig. 4B).
A, The correlation between risk score and ESTIMATE score, immune score, stromal score, and tumor purity in training datasets. B, High-risk group mainly consisted of GBM while low-risk group mainly comprised of LGG, including oligodendrogliomas (O), oligoastrocytomas (OA) and astrocytomas (A) histologically. Tumor purity, stromal score and immune score were normalized as z-score from -1 to 1.
A, Identification of immune signals' difference between low-risk and high-risk groups by GSEA. Macrophages, Macrophages M1, Macrophages M2, Dendritic cells, T cells gamma delta, were activated in the high-risk group. B, Identification of risk score-related KEGG pathways by GSEA, and KEGG_CYTOKINE_CYTOKINE_RECEPTOR_INTERACTION, KEGG_FOCAL_ADHESION, KEGG_JAK_STAT_SIGNALING_PATHWAY were highly enriched in the high-risk patients. C, Identification of risk score-related GO pathways, extracellular matrix related pathways were gained. Genes in extracellular matrix organization pathway are in red, genes in extracellular structure organization are in green, genes in collagen fibril organization are in blue. D, Clinical, histological and genetic features between high- and low-risk groups. According to IDH mutation and ATRX mutation, the low-risk group could be divided into three subgroups, and each group had specific genetic characteristics, including glioma specific mutations, CNVs and Varhaak subtypes for GBM. E, K-M curve of four subgroups, group1- LowRisk_IDH1wt, group2- LowRisk_IDH1mut/ATRXmut, group3- LowRisk_IDH1mut/ATRXwt, group4-High risk.
Clinic features and genomic background based on prognosis model
After comparing the high-risk group with the low-risk group, we found no difference in gender between the two groups. The average age of patients in the low-risk group is 41.06±12.61y (n=455), which was lower than that in the high-risk group (58.63±12.97y, n=222) with statistical significance (t=-16.636, p-value<2.2e-16). As for the pathological grades, the high-risk group mainly consisted of high-grade gliomas, glioblastomas (GBM), while the low-risk group contained mostly LGG (p=1.17e-80) composed of oligodendrogliomas (O), oligoastrocytomas (OA), and astrocytomas (A) histologically (Fig. 3B). The risk score was associated with distinct genomic alterations. According to the glioma classification reported by Verhaak et al. [13], we discovered proneural subtype (PN) and neural subtype (NE) gliomas are predominantly involved in the low-risk group, and classical subtype (CL) and mesenchymal subtype (ME) gliomas accumulated predominantly in the high-risk group contrarily. Besides, G-CIMP- and G-CIMP+ gliomas enriched in the high-risk and the low-risk group separately. Loss of heterozygosity (LOH) at 1p/19q, IDH mutation, MGMT promoter methylation largely enriched in the low-risk group. On the other hand, the gain of chr 7/loss of chr 10 occurred in the high-risk group mainly (Table 2). We acquired consistent results after conducting the same analysis in the independent validation datasets (Table S6).
Distribution overview of risk groups
| Characteristics | N | L_risk | H_risk | X-squared | p-value |
|---|---|---|---|---|---|
| Gender | 1.055 | 0.304 | |||
| Male | 386 | 252 | 134 | ||
| Female | 284 | 197 | 87 | ||
| Grade | 368.1 | 1.17E-80 | |||
| Grade II | 248 | 238 | 10 | ||
| Grade III | 263 | 201 | 62 | ||
| Grade IV | 161 | 11 | 150 | ||
| Histology | 367.084 | 2.98E-79 | |||
| A | 192 | 141 | 51 | ||
| GBM | 161 | 11 | 150 | ||
| O | 190 | 179 | 11 | ||
| OA | 128 | 118 | 10 | ||
| IDH_STATUS | 527.552 | 9.64E-117 | |||
| WT | 238 | 27 | 211 | ||
| MUT | 425 | 420 | 5 | ||
| IDH_1P19Q_SUBTYPE | 106.61 | 5.42E-25 | |||
| noncodel | 498 | 281 | 217 | ||
| codel | 168 | 168 | 0 | ||
| MGMT_PROMOTER_STATUS | 169.203 | 1.10E-38 | |||
| nonMethy | 164 | 49 | 115 | ||
| Methy | 474 | 399 | 75 | ||
| CHR7_GAIN_CHR10_LOSS | 354.11 | 5.40E-79 | |||
| WT | 507 | 438 | 69 | ||
| MUT | 156 | 8 | 148 | ||
| TERT_PROMOTER_STATUS | 49.614 | 1.87E-12 | |||
| WT | 163 | 155 | 8 | ||
| MUT | 157 | 98 | 59 | ||
| ATRX_STATUS | 101.316 | 7.84E-24 | |||
| WT | 463 | 259 | 204 | ||
| MUT | 195 | 188 | 7 | ||
| DNAMethyl_PANCAN | 1.11E-07* | ||||
| GBM non-CIMP | 109 | 2 | 107 | ||
| GBM CIMP | 9 | 7 | 2 | ||
| Cluster 5 | 3 | 0 | 3 | ||
| Low purity | 6 | 0 | 6 | ||
| TRANSCRIPTOME_SUBTYPE | 354.038 | 1.99E-76 | |||
| PN | 241 | 224 | 17 | ||
| NE | 114 | 99 | 15 | ||
| CL | 88 | 4 | 84 | ||
| ME | 102 | 14 | 88 |
*Fisher's Exact Test.
The risk level separated by the risk score reflected the multi-omics alteration: IDH1 mutation, the most common mutation in glioma, was involved mainly in the low-risk group. In our exploration, we found out that by combining IDH1 mutation with ATRX mutation, gliomas in the low-risk group could be further divided into three subtypes: LowRisk_IDH1wt, LowRisk_IDH1mut/ATRXmut and LowRisk_IDH1mut/ATRXwt with obvious survival difference (Fig. 4E). LowRisk_IDH1wt group contained A, O, OA, and GBM without 1p/19q codeletion. LowRisk_IDH1mut/ATRXmut group contained more A with a high mutation frequency of TP53 and few 1p/19q codeletions. LowRisk_IDH1mut/ATRXwt group, consisted of O largely, enriched almost all gliomas with 1p/19q codeletion, CIC mutation, and FUBP1 mutation. However, IDH1wt and mutation of EGFR, PTEN, NF1 and RB1 were mostly enriched in the high-risk group (Fig. 4D, S7C). According to the overview of the mutation landscape, we could find that TP53 mutation existed in all subtypes. The mutation of EGFR and IDH would not coexist in the same sample and the same relationship appeared in ATRX mutation and TERT mutation. Besides, we discovered that TERT mutation mostly exists in LowRisk_IDH1mut/ATRXwt group and the high-risk group, and CIC mutation accompany with 1p/19q codeletion.
Then the differential methylation analysis of high-grade and low-grade gliomas was performed on 62,813 methylation regions, of which 47,271 regions were significantly correlated with the risk score (r>0.5, p<1.0E-15) and were widely distributed on all chromosomes. Among them, 46,116 (97.6%) regions were negatively correlated with the risk score and 1155 (2.4%) regions had a positive correlation. These negative-correlated methylations, which accumulated in LowRisk_IDH1mut/ATRXmut and LowRisk_IDH1mut/ATRXwt subtypes of the low-risk group, were mainly associated with IDH1 mutation. Meanwhile, 1155 positive-correlated methylation regions were mainly associated with IDH wild type (Fig. S7A). We further explored the degree of methylation of 154 probes that could further distinguish patients of the high-risk group into two subgroups with significant differences in overall survival (Table S7).
The CNV-changing genes that were significantly associated with risk scores were mainly enriched on chr1, 7, 10, and 19. The gene deletion on chr1 was mainly enriched in LowRisk_IDH1mut/ATRXwt subgroup; while chr7 was mainly amplified in all grades of gliomas, especially in the high-risk group. In IDH1 wild-type gliomas, chr10 deletion coexisted with chr7. Chr19 was mainly characterized by the deletion in LowRisk_IDH1mut/ATRXmut and LowRisk_IDH1mut/ATRXwt subgroups, especially in the latter subgroup, and its amplification predominantly in the high-risk group. The frequency of changes in chr19 in LowRisk_IDH1mut/ATRXmut subgroup was significantly lower than that of chr1, indicating that the co-deletion of chr1 and chr19 occurred only in LowRisk_IDH1mut/ATRXwt subgroup (Fig. S7B). We further found that the 314 genes, as risk factors, significantly affected the overall survival rate of patients with LowRisk_IDH1mut/ATRXmut subtype gliomas. These genes were located on chromosomes 9p22 and 10q24. And the amplification of 212 genes, locating at chromosomes 8p21 and 7q21, significantly affected the overall survival rate of patients with LowRisk_IDH1mut/ATRXwt subtype gliomas (Table S8).
Discussion
All four genes were positively correlated with tumor pathological grades. Epithelial Membrane Protein 3 (EMP3), a 4-transmembrane glycoprotein, is identified firstly as a putative tumor suppressor in gliomas [14]. Jun F et al. [15] found that EMP3 is highly expressed in CD44-high primary GBMs, and promote tumor progression by TGF-β/Smad2/3 signaling pathway activation. Recent studies [16] showed that EMP3 expression, whose high-level expression is identified as a prognostic indicator of poor survival, is significantly higher in high-grade gliomas than in low-grade gliomas or normal brain tissues. KDELR2, a transmembrane protein of the endoplasmic reticulum, could recognize proteins with KDEL (lam-aspartate-glut-leucine) tetrapeptide sequence, then mediating these proteins' recycling from the Golgi back to the endoplasmic reticulum. It has been found that KDELR2 stimulates ECM degradation by inducing Src activation at the invadopodia and leads to phosphorylation of the Src substrates, cortactin, thereby promoting tumor metastasis and invasive growth [17]. The expression level of KDELR2 in GBM is significantly higher than that of LGG and could be used as a prognostic marker for overall survival [6]. TAGLN2, an actin-binding protein, could regulate cell morphology, movement and transformation by binding to actin. TAGLN2 is abnormally expressed in a variety of cancers [18], and its deregulation is considered to correlate with tumorigenesis and tumor development. In gliomas, TAGLN2 is a potential oncogenic factor, which is regulated by TGFβ2 to promote glioma invasion and growth [19]. Its expression, particularly enriched in mesenchymal subtype of glioma, is associated with pathological grades and poor prognosis. TIMP1 belongs to the matrix metalloproteinase (MMP) family and inhibits most MMPs, especially selectively inhibits MMP9, participating in the homeostatic regulation of the extracellular matrix. TIMP1 plays an important role in the IDH wild type gliomas, which could promote the survival of cancer cells by negatively regulating the adaptive immune response [20]. It has also been reported that glioblastoma patients with lower expression of TIMP-1get longer survival [21]. Aaberg-Jessen et al. [22] found that co-expression of TIMP-1 and CD63 have effects in glioblastoma stemness and contribute to the poor prognosis of patients through influencing tumor aggressiveness and resistance of therapy. These above evidences reveal the prognostic value of the four genes for glioma patients which could further be used as potential drug targets or gene candidates in predicting patients' prognosis.
GSEA of the 4-gene signature showed that macrophages, dendritic cells and gamma delta T cells activities related to patients' high-risk scores. Also, KEGG CYTOKINE CYTOKINE RECEPTOR INTERACTION, KEGG JAK-STAT SIGNALING PATHWAY, KEGG FOCAL ADHESION were significantly enriched. Macrophages/microglial cells constitute the largest immune cell populations in GBMs [23]. These cells promote tumor proliferation, invasion, and maintenance [24]. The cytokines, secreted by immune cells or stromal cells (such as vascular endothelial cells, epidermal cells, and fibroblasts), participate in the immune response and inflammatory process, regulating cell proliferation, differentiation, and apoptosis. JAK/STAT is a common pathway for many cytokine-signaling [25]. Cell adhesion is essential for interaction with the extracellular matrix (ECM) during tumor cells invasion [26]. The percentage of ECM components and inflammatory immune response in the microenvironment is associated with tumor purity. The progress of glioma is accompanied by angiogenesis and invasiveness, which inevitably depends on the production of a large number of adhesion molecules and extracellular matrices [27]. The low level of ECM and adhesion molecules in tumor means high tumor purity, and patients with high tumor purity usually commit low-grade gliomas, IDHmut glioma, or proneural GBM with better clinical outcomes [28]. In contrast, low-purity tumors have higher cell adhesion and extracellular matrix content, mainly found in IDHwt and mesenchymal subtype GBM and associated with poor prognosis [29]. Meanwhile, these low-purity gliomas are enriched with immunological processes and inflammation [30]. Thus, we applied the ESTIMATE algorithm [31] to predict tumor purity using gene expression profiles. It showed a significant positive relationship of ESTIMATE score, immune score, stromal score, low tumor purity (an indicator of poor prognosis in glioma [28]) and high-risk score.
The clinical features of glioma are also important factors that influence the prognosis of patients. We found that the risk scores of older patients were higher than the youth, which means a worse prognosis in older patients, and the result was consistent with the existing research conclusions [32]. Compared with the low-risk group, the high-risk group was mainly composed of GBM and lower-grade glioma (G2/G3) with poor prognosis. This group mainly contained the currently known molecular and genetic characteristics that contribute to poor prognosis, such as CL and ME subtypes [13], non-LOH at 1p/19q, IDH1wt, G-CIMP- and MGMT promoter unmethylation [33], chr7 gain and chr10 loss [29]. We also found that a small number of GBM patients with a relatively good prognosis can be divided into the low-risk group by this scoring system. To further understand the underlying molecular mechanisms of risk score, we used TCGA data to analyze the association of gene mutations, methylation, CNV and risk score. We found that patients in high and low-risk groups had significant differences in gene mutation characteristics. Even within the same risk group, the patients in the low-risk group could be divided into three subtypes with different overall survival prognosis based on IDH1 and ATRX mutation. ATRX mutation is mutually exclusive with 1p/19q codeletion [34] and 1p/19q codeletion often represents a better prognosis. Methylation analysis revealed that methylation probes, negative-correlated with risk scores, were enriched in the low-risk group and correlated with IDH1 mutations. On the contrary, positive-correlated methylation probes were primarily associated with IDH wild type glioma. We found that CNV-changing genes that significantly associated with risk scores were mainly enriched on chr1, 7, 10, and 19, and each risk group had specific CNV characteristics respectively. In our study, the risk score was correlated with the current major glioma molecular characteristics, and through combining methylation and CNV features this model can be used to further subdivide gliomas into different subtypes. We also found that the deletion of genes on 9p22/10q24 and 8p21/7q21 affected the prognosis of low-risk group patients with IDH mutations, which suggests that amplification or deletion of these chromosomal fragments may play a potential role in specific LGG subtypes. Simultaneously, partial methylation probes possess similar ability to stratify the patients in high-risk groups. All these deserve further study.
However, several limitations of our study should be taken into consideration. The incompleteness of follow-up data, no progress-free survival analysis was performed, and no more datasets were further validated for the re-stratification of the four subtypes (CL, PN, NE, ME). Second, all data were based on microarray and sequencing expression data, so their predictive effects were only applicable to mRNA expression and not to protein expression levels. Third, the prognostic model only considered genes that were highly expressed in lower-grade glioma relative to adjacent cancer but did not consider the prognostic role of non-differentiated genes. Some molecules might not be highly expressed in cancer, but still affected the prognosis of patients via other means. Furthermore, the molecular mechanisms of how the 4-gene signature affected the prognosis of glioma patients should be further elucidated by a series of experiments.
Conclusion
In summary, we established a malignant-related 4-gene molecular marker by glioma expression profile data from multiple microarrays and sequencing data. The four markers had good predictive power on the overall survival of glioma patients and were independent of pathological grades which could be potential treating targets for improving glioma patients' prognosis. To our knowledge, the 4-gene signature-related integrated multi-omics prognostic model has not been reported previously and could be a useful prognostic and diagnostic classification tool of diffuse gliomas.
Abbreviations
DGs: diffuse gliomas; LGG: lower-grade gliomas; GBM: glioblastomas; IDH: isocitrate dehydrogenase; MGMT: O6methylguanine DNA methyltransferase; TERT: telomerase reverse transcriptase; CNV: copy number variation; TCGA: the cancer genome atlas; CGGA: Chinese glioma genome atlas; TOM: topological overlap matrix; MEs: module eigengenes; CPE: Concordance Probability Estimate; IDI: integrated discrimination improvement; ROC: receiver operating characteristic curve; KEGG: Kyoto Encyclopedia of Genes and Genomes; GO: Gene Ontology; GSEA: gene set enrichment analysis; O: oligodendrogliomas; OA: oligoastrocytomas; A: astrocytomas; PN: proneural subtype; NE: neural subtype; CL: classical subtype; ME: mesenchymal subtype; G-CIMP: Glioma CpG island methylator phenotype; LOH: loss of heterozygosity; ATRX: X - linked alpha thalassemia mental retardation syndrome gene; MMP: the matrix metalloproteinase; ECM: extracellular matrix.
Supplementary Material
Supplementary figures.
Supplementary tables.
Acknowledgements
We gratefully acknowledge the TCGA and CGGA project organizers as well as all study participants for making data and results available.
Funding
This work was supported by the National Natural Science Foundation of China (Grant Nos. 81770781, 81472594) for Xuejun Li and the National Natural Science Foundation of China (Grant No. 81560414) for Chunhai Huang.
Availability of data and materials
The RNA sequencing data and microarray data of human glioma samples were obtained from the TCGA data portal (https://portal.gdc.cancer.gov) and CGGA data portal (http://cgga.org.cn). GSE43378, GSE19728, GSE4290, GSE61374, GSE43289, GSE7696, GSE16011, GSE68848 and GSE74187 were from GEO database (https://www.ncbi.nlm.nih.gov/geo). Copy number variation data, DNA methylation data, mutation data and corresponding clinical information of glioma samples were from the TCGA data portal.
Author Contributions
Chunhai Huang and Zujian Xiong conducted the analysis, Qi Yang assisted some of the analysis. Zujian Xiong wrote this manuscript and Xuejun Li came up with this idea and supported this paper.
Competing Interests
The authors have declared that no competing interest exists.
References
1. Louis DN, Perry A, Reifenberger G, von Deimling A, Figarella-Branger D, Cavenee WK. et al. The 2016 World Health Organization Classification of Tumors of the Central Nervous System: a summary. Acta neuropathologica. 2016;131:803-20
2. Dixit K, Raizer J. Newer Strategies for the Management of Low-Grade Gliomas. Oncology (Williston Park, NY). 2017;31:680-685
3. Jooma R, Waqas M, Khan I. Diffuse Low-Grade Glioma - Changing Concepts in Diagnosis and Management: A Review. Asian journal of neurosurgery. 2019;14:356-63
4. Zhao Z, Zhang K, Wang Z, Wang K, Liu X, Wu F. et al. A comprehensive review of available omics data resources and molecular profiling for precision glioma studies. Biomedical reports. 2019;10:3-9
5. Westphal M, Lamszus K. Circulating biomarkers for gliomas. Nature reviews Neurology. 2015;11:556-66
6. Hsu JB, Chang TH, Lee GA, Lee TY, Chen CY. Identification of potential biomarkers related to glioma survival by gene expression profile analysis. BMC medical genomics. 2019;11:34
7. Langfelder P, Horvath S. WGCNA: an R package for weighted correlation network analysis. BMC bioinformatics. 2008;9:559
8. Tang J, Kong D, Cui Q, Wang K, Zhang D, Gong Y. et al. Prognostic Genes of Breast Cancer Identified by Gene Co-expression Network Analysis. Frontiers in oncology. 2018;8:374
9. Liang R, Zhi Y, Zheng G, Zhang B, Zhu H, Wang M. Analysis of long non-coding RNAs in glioblastoma for prognosis prediction using weighted gene co-expression network analysis, Cox regression, and L1-LASSO penalization. OncoTargets and therapy. 2019;12:157-68
10. Dai W, Li Y, Mo S, Feng Y, Zhang L, Xu Y. et al. A robust gene signature for the prediction of early relapse in stage I-III colon cancer. Molecular oncology. 2018;12:463-75
11. Yu G, Wang LG, Han Y, He QY. clusterProfiler: an R package for comparing biological themes among gene clusters. Omics: a journal of integrative biology. 2012;16:284-7
12. Gundem G, Perez-Llamas C, Jene-Sanz A, Kedzierska A, Islam A, Deu-Pons J. et al. IntOGen: integration and data mining of multidimensional oncogenomic data. Nature methods. 2010;7:92-3
13. Verhaak RG, Hoadley KA, Purdom E, Wang V, Qi Y, Wilkerson MD. et al. Integrated genomic analysis identifies clinically relevant subtypes of glioblastoma characterized by abnormalities in PDGFRA, IDH1, EGFR, and NF1. Cancer cell. 2010;17:98-110
14. Alaminos M, Davalos V, Ropero S, Setien F, Paz MF, Herranz M. et al. EMP3, a myelin-related gene located in the critical 19q13.3 region, is epigenetically silenced and exhibits features of a candidate tumor suppressor in glioma and neuroblastoma. Cancer research. 2005;65:2565-71
15. Jun F, Hong J, Liu Q, Guo Y, Liao Y, Huang J. et al. Epithelial membrane protein 3 regulates TGF-beta signaling activation in CD44-high glioblastoma. Oncotarget. 2017;8:14343-58
16. Guo XX, Su J, He XF. A 4-gene panel predicting the survival of patients with glioblastoma. Journal of cellular biochemistry. 2019;120:16037-43
17. Ruggiero C, Fragassi G, Grossi M, Picciani B, Di Martino R, Capitani M. et al. A Golgi-based KDELR-dependent signalling pathway controls extracellular matrix degradation. Oncotarget. 2015;6:3375-93
18. Jeon BN, Kim HR, Chung YS, Na BR, Park H, Hong C. et al. Actin stabilizer TAGLN2 potentiates adoptive T cell therapy by boosting the inside-out costimulation via lymphocyte function-associated antigen-1. Oncoimmunology. 2018;7:e1500674
19. Han MZ, Xu R, Xu YY, Zhang X, Ni SL, Huang B. et al. TAGLN2 is a candidate prognostic biomarker promoting tumorigenesis in human gliomas. Journal of experimental & clinical cancer research: CR. 2017;36:155
20. Xu Y, Geng R, Yuan F, Sun Q, Liu B, Chen Q. Identification of differentially expressed key genes between glioblastoma and low-grade glioma by bioinformatics analysis. PeerJ. 2019;7:e6560
21. Aaberg-Jessen C, Christensen K, Offenberg H, Bartels A, Dreehsen T, Hansen S. et al. Low expression of tissue inhibitor of metalloproteinases-1 (TIMP-1) in glioblastoma predicts longer patient survival. Journal of neuro-oncology. 2009;95:117-28
22. Aaberg-Jessen C, Sorensen MD, Matos A, Moreira JM, Brunner N, Knudsen A. et al. Co-expression of TIMP-1 and its cell surface binding partner CD63 in glioblastomas. BMC cancer. 2018;18:270
23. Mirzaei R, Sarkar S, Yong VW. T Cell Exhaustion in Glioblastoma: Intricacies of Immune Checkpoints. Trends in immunology. 2017;38:104-15
24. Hambardzumyan D, Gutmann DH, Kettenmann H. The role of microglia and macrophages in glioma maintenance and progression. Nature neuroscience. 2016;19:20-7
25. Morris R, Kershaw NJ, Babon JJ. The molecular details of cytokine signaling via the JAK/STAT pathway. Protein science: a publication of the Protein Society. 2018;27:1984-2009
26. Xian J, Zhang Q, Guo X, Liang X, Liu X, Feng Y. A prognostic signature based on three non-coding RNAs for prediction of the overall survival of glioma patients. FEBS open bio. 2019;9:682-92
27. Shimizu T, Kurozumi K, Ishida J, Ichikawa T, Date I. Adhesion molecules and the extracellular matrix as drug targets for glioma. Brain tumor pathology. 2016;33:97-106
28. Zhang C, Cheng W, Ren X, Wang Z, Liu X, Li G. et al. Tumor Purity as an Underlying Key Factor in Glioma. Clinical cancer research: an official journal of the American Association for Cancer Research. 2017;23:6279-91
29. Behnan J, Finocchiaro G, Hanna G. The landscape of the mesenchymal signature in brain tumours. Brain: a journal of neurology. 2019;142:847-66
30. Wang Q, Hu B, Hu X, Kim H, Squatrito M, Scarpace L. et al. Tumor Evolution of Glioma-Intrinsic Gene Expression Subtypes Associates with Immunological Changes in the Microenvironment. Cancer cell. 2017;32:42-56.e6
31. Yoshihara K, Shahmoradgoli M, Martinez E, Vegesna R, Kim H, Torres-Garcia W. et al. Inferring tumour purity and stromal and immune cell admixture from expression data. Nature communications. 2013;4:2612
32. Corell A, Carstam L, Smits A, Henriksson R, Jakola AS. Age and surgical outcome of low-grade glioma in Sweden. Acta neurologica Scandinavica. 2018;138:359-68
33. Malta TM, de Souza CF, Sabedot TS, Silva TC, Mosella MS, Kalkanis SN. et al. Glioma CpG island methylator phenotype (G-CIMP): biological and clinical implications. Neuro-oncology. 2018;20:608-20
34. Mellai M, Annovazzi L, Senetta R, Dell'Aglio C, Mazzucco M, Cassoni P. et al. Diagnostic revision of 206 adult gliomas (including 40 oligoastrocytomas) based on ATRX, IDH1/2 and 1p/19q status. Journal of neuro-oncology. 2017;131:213-22
Author contact
![]() Corresponding author: Xuejun Li, Tel: 137 5501 0518; E-mail: lxjneuroedu.cn.
Corresponding author: Xuejun Li, Tel: 137 5501 0518; E-mail: lxjneuroedu.cn.