Impact Factor ISSN: 1837-9664

 Global reach, higher impact
J Cancer 2021; 12(16):4791-4809. doi:10.7150/jca.55570 This issue Cite
Research Paper
Upregulating KTN1 promotes Hepatocellular Carcinoma progression
Jian Pan1,10, Nai-Xia Chao2 ![]() , Yao-Yao Zhang3, Tian-Ming Huang4, Cheng-Xiao Chen5, Qiu-Hong Qin6, Jin-Hong Guo7, Rong-Shi Huang8, Guo-Rong Luo9,10
, Yao-Yao Zhang3, Tian-Ming Huang4, Cheng-Xiao Chen5, Qiu-Hong Qin6, Jin-Hong Guo7, Rong-Shi Huang8, Guo-Rong Luo9,10 ![]()
1. Department of Human Anatomy, Guangxi Medical University.
2. Department of Biochemistry and Molecular Biology, Guangxi Medical University.
3. Department of Histology and Embryology, Guangxi Medical University.
4. Department of Histology and Embryology, Guangxi Medical University.
5. The Ninth Affiliated Hospital of Guangxi Medical University, Guangxi Medical University.
6. Jiang bin Hospital of Guangxi Zhuang Autonomous Region.
7. Guangxi Medical University.
8. Department of Histology and Embryology, Guangxi Traditional Chinese Medical University.
9. Department of Histology and Embryology, Guangxi Medical University.
10. Guangxi Colleges and Universities Key Laboratory of Human Development and Disease Research, Guangxi Medical University, Nanning, China.
Received 2020-11-6; Accepted 2021-5-23; Published 2021-6-11
Abstract

Background: Hepatocellular carcinoma (HCC) presents a common malignant tumor worldwide. Although kinectin 1 (KTN1) is the most frequently identified antigen in HCC tissues, the detailed roles of KTN1 in HCC remain unknown. This study seeks to clarify the expression status and clinical value of KTN1 in HCC and to explore the complicated biological functions of KTN1 and its underlying mechanisms.
Methods: In-house reverse transcription quantitative polymerase chain reaction (RT-qPCR) was used to detect the expression of KTN1 in HCC tissues. External gene microarrays and RNA-sequencing datasets were downloaded to confirm the expression patterns of KTN1. The prognostic ability of KTN1 in HCC was assessed by a Kaplan-Meier curve and a hazard ratio forest plot. The CRISPR/Cas9 gene-editing system was used to knock out KTN1 in Huh7 cells, which was verified by PCR-Sanger sequencing and western blotting. Assays of cell migration, invasion, viability, cell cycle, and apoptosis were conducted to explore the biological functions. RNA sequencing was performed to quantitatively analyze the functional deregulation in KTN1-knockout cells compared to Huh7-wild-type cells. Upregulated genes that co-expressed with KTN1 were identified from HCC tissues and were functionally annotated.
Results: KTN1 expression was increased in HCC tissues (standardized mean difference [SMD] = 0.20 [0.04, 0.37]). High KTN1 expression was significantly correlated with poorer prognosis of HCC patients, and KTN1 may be an independent risk factor for HCC (pooled HRs = 1.31 [1.05, 1.64]). After KTN1-knockout, the viability, migration, and invasion ability of HCC cells were inhibited. The proportion of HCC cells in the G0-G1 phases increased after KTN1 knockout, which also elevated the apoptosis rates in HCC cells. Several cascades, including innate immune response, chemical carcinogenesis, and positive regulation of transcription by RNA polymerase II, were dramatically changed after KTN1 knockout. KTN1 primarily participated in the cell cycle, DNA replication, and microRNAs in cancer pathways in HCC tissues.
Conclusion: Upregulation of KTN1 served as a promising prognosticator in HCC patients. KTN1 promotes the occurrence and deterioration of HCC by mediating cell survival, migration, invasion, cell cycle activation, and apoptotic inhibition. KTN1 may be a therapeutic target in HCC patients.
Keywords: hepatocellular carcinoma, kinectin 1, CRISPR/Cas9, mechanism
Introduction
Hepatocellular carcinoma (HCC) is one of the most concealed, malignant, lethal solid tumors in the world. Nearly seven million people are diagnosed with HCC and over six million people die from it per year [1, 2]. It predominates in Africa and eastern Asia, especially China, where Guangxi possesses large numbers of HCC patients [3, 4]. Chronic hepatic diseases, metabolic syndromes, and smoking are primary risk factors for HCC [5-7]. Although the exact pathogenesis of HCC remains unclear, its development involves successive stages of inflammation, pathogenic genetic alterations, and epigenic deregulation [8-13]. Surgical resection is the optimal choice for HCC patients in addition to transplantation, chemoembolization, and local ablation [14-17]. However, many HCC patients lack access to this treatment opportunity because of the absence of symptoms in the early stages and progression in late HCC [18-20]. Furthermore, HCC patients in the same clinical stages have inexplicably distinct outcomes. A classification of molecular subtypes was proposed to stratify HCC patients according to molecular signatures, such as TP53 mutation and the AKT-mammalian target of rapamycin activation [21]. Nonetheless, more studies are necessary to lay the foundations of HCC treatment and prognosis improvement.
Kinectin 1, encoded by KTN1 (also called KNT, CG1, and MU-RMS-40.19), belongs to an integral membrane protein in the endoplasmic reticulum and participates in organelle transportation [22]. The KTN1 gene is renowned for its relationships with axon transport and cell mitosis [23], and the KTN1 protein regulates the expression of other proteins by binding to translational elongation factor (EF)-δ and participating in the assembly of the EF-1 complex [24, 25]. Studies have confirmed several roles of KTN1 in certain cancers. For instance, KTN1 was significantly upregulated in cutaneous squamous cell carcinoma (CSCC), and a MALAT1-KTN1-EGFR axis, which also existed in melanoma and cervical cancer cells, was demonstrated to promote the development of CSCC cells [26]. KTN1 expression also significantly increased in giant cell tumors of bone compared to normal controls [27]. In HCC, researchers studied HCC-related antigens to determine their clinical implications and reported 24 antigens, where KTN1 was the most common [23]. Moreover, researchers have discovered four alternative splicing sites of KTN1 in HCC: D1 and D4 were responsible for the regulation of protein and mRNA expression, while D2 and D3 mainly affected the molecular function of protein. However, the relationships between KTN1 and HCC have not yet been studied, and the deregulation level of KTN1 and its biological effects in HCC are largely unknown, which must be clarified to understand the roles of KTN1 in HCC.
Therefore, this study clarifies the expression status and clinical value of KTN1 in HCC. More importantly, this study explores the complicated biological functions of KTN1 in HCC cells to pinpoint its underlying mechanisms.
Materials and methods
Expression status and clinical value of KTN1 in HCC
RT-qPCR detection of KTN1 expression in HCC tissues
A total of 50 pairs of surgically resected HCC and adjacent tissues were collected from the First Affiliated Hospital of Guangxi Medical University. The HCC patients had to meet the following inclusion criteria: i) pathological diagnosis was HCC and ii) they signed an informed consent form. This study was approved by the ethics committee of the First Affiliated Hospital of Guangxi Medical University. Total RNA was extracted using the AxyPrep Multisource Total RNA Miniprep Kit (AXYGEN) and was reversely transcribed into cDNA using the HiScript III RT SuperMix for quantitative polymerase chain reaction (qPCR) (Vazyme). A 2X Universal SYBR Green Fast qPCR Mix (ABclonal) reagent was used to perform real-time reverse transcription quantitative polymerase chain reaction (RT-qPCR). The primers were as follows: KTN1 primer upstream: 5'-GGCAGAGATAGCTCACTTGAAG-3'; downstream: 5'-ACCTAGCATAATCCTGGCGTAG-3' (125bp); internal control (Actin Beta) primer upstream: 5'-CAGGCACCAGGGCGTGAT-3'; downstream: 5'-TAGCAACGTACATGGCTGGG-3' (293bp). A LightCycler96 was used according to the protocols of the qPCR reagents. The reaction system was as follows: 10 μl of mix, 0.3 μM of upstream primers, 0.3 μM of downstream primers, and 1 μl of cDNA template, and then add water for a total volume of 20 μl. The reaction conditions contained 95 °C for 3 minutes pre-denaturation, 95 °C for 15 seconds, and 60 °C for one minute. The latter two processes were looped 40 times. The Ct values of the internal control and KTN1 were collected, and the relative expression of KTN1 was calculated by the 2-ΔΔCt method.
External validation of KTN1 expression by gene microarrays and RNA-sequencing datasets
Gene microarrays and RNA-sequencing (RNA-seq) datasets were downloaded from the public biomedical databases Gene Expression Omnibus, Oncomine, ArrayExpress, the Cancer Genome Atlas, and Genotype-Tissue Expression. Three authors independently screened these studies according to the following criteria: i) the organism was a human being, ii) the specimen type was tissue, and iii) the tumor was HCC. Datasets or samples were excluded using the following criteria: i) the mRNA expression level of KTN1 was not detected or ii) the samples were duplicated. Finally, the three authors discussed the screened datasets and reached an agreement. The enrolled datasets were merged into platform matrices using dplyr, and the batch effect was removed using sva. The expression values of KTN1 were extracted from the batch-effect-removed platform matrices. T-tests and SMDs were used to determine the expression levels of KTN1 in HCC.
Potential clinical value of KTN1 in HCC patients
Summary receiver operating characteristic (SROC) curves, sensitivity and specificity forest plots, and positive and negative likelihood ratio forest plots were utilized to appraise the discriminatory ability of KTN1 between HCC and normal liver tissues. HCC patients were divided into KTN1 high- and KTN1 low-expressing groups. Kaplan-Meier curves with a log-rank test and pooled hazard ratios (HRs) forest plots were used to appraise the prognostic value of KTN1 in HCC patients. To explore the potential roles of KTN1 in HCC progression, Barcelona Clinic Liver Cancer (BCLC) and tumor, node, metastases (TNM) staging subgroups were set up, and the expression patterns of KTN1 in progressed HCC were addressed. Three gene chips (i.e., GSE63018, GSE40367, and GSE364) were used to analyze the possible roles of KTN1 in HCC metastasis.
Biological functions of KTN1 in HCC cells
Cell culture
The human cell line Huh7 was maintained at 37 °C in a constant-temperature incubator with 5% CO2. Cells were grown in Dulbecco's Modified Eagle Medium (DMEM) medium (Gilbco) with 10% fetal bovine serum (Gilbco).
Construction of CRISPR/Cas9 plasmid
The pSpCas9(BB)-2A-Puro (PX459) v2.0 (Plasmid #62988) plasmid came from the Addgene website. The plasmid was constructed according to the protocols provided by the website (https://media.addgene.org/data/plasmids/62/62988/62988-attachment_i-jdFt6Gm-ft.pdf). The gRNA sequence was 5'-GTTTCCTCTTCTTCTGGCTTTTC-3'.
Knockout of KTN1 in Huh7 cells by using CRISPR/Cas9
Clustered regularly interspaced short palindromic repeats/CRISPR-associated protein 9 was used to knock out KTN1. Each six-well plate was seeded with 5×10⁵ cells. After 24 hours, the cells were transfected with lipo3000 according to the instructions of the production company (https://www.thermofisher.com/order/catalog/product/L3000150?SID=srch-srp-L3000150). Two μg of plasmid and 4 μl of P3000 were added to 100 μl of reduced-serum media (opti-MEM) (Gilbco) and mixed gently. Then, 100 μl of opti-MEM and 6 μl of lipo3000 were added to another eppendorf tubes, mixed gently, and stood for five minutes. The diluted plasmid was added to the diluted lipo3000. After standing at room temperature for 20 minutes, the mixed liquid was added to the cells. After 24 hours of transfection, it was changed to a complete medium containing 2 μg/ml puromycin for 48 hours and then changed back to a complete medium without puromycin to continue the culture.
Efficiency verification of CRISPR/Cas9-mediated KTN1 knockout
To verify the knockout effect at the DNA level, cell genomic DNA was extracted using the phenol-chloroform method. Primers on both sides of the knockout site were designed, and PCR amplification was performed. Sanger sequencing was conducted to identify the knockout effect. The sequence of the PCR primers was as follows: upstream primer: 5'-TTTCCTCTTCTTCTGGCTTTTC-3'; downstream primer: 5'-AACGACATTCAATGGAACAGGT-3' (253 bp).
To verify the knockout effect at the protein level, western blotting was performed. Cell lysate (94 μL cell lysate plus 6 μL PMSF) was added to the collected 1×10⁶ cells, which was operated on ice. The ice box was placed on a shaker and shaken for 30 minutes, followed by 12,000-rpm centrifugation at 4 °C for 20 minutes. The protein concentration was determined by the bicinchoninic acid assay. Protein loading buffer was added to 20 μg of protein and boiled for 10 minutes. After that, sodium dodecyl sulphate-polyacrylamide gel electrophoresis was performed, where the concentration of concentrated gel was 5%, the concentration of separation gel was 10%, the voltage was 90 V, and the electrophoresis time was 90 minutes. Then, the protein was transferred to the polyvinylidene difluoride (PVDF) membrane, which was sealed in 5% skim milk at room temperature for 1 hour. The primary antibody, rabbit anti-KTN1 polyclonal antibody (Abcam), was diluted at 1:1000 with Tris-buffered saline with Tween-20 (TBST). The PVDF membrane was incubated in the primary antibody at 4 °C overnight and was washed three times with TBST for 5 minutes each time. The PVDF membrane was then incubated with the secondary antibody, goat anti-rabbit IgG H&L (Abcam), which was diluted at 1:10000 with TBST and incubated at room temperature for 2 hours. After washing the membrane three times with TBST again, imaging was performed using the ChemiDoc™ MP Imaging System (Bio-Rad).
Cell viability assay
In total, 2,000 cells were seeded in each well of a 96-well plate. After 24 hours, a CellTiter-Glo Luminescent Cell Viability Assay (Promega) kit was used to detect cell viability and draw cell growth curves.
Cell migration assay
A 24-well plate transwell chamber (Corning, Costar 3422) was used to test the cell migration ability. Respectively, 100 μl and 500 μl of the medium containing 0.5×10⁵ cells were added to the upper and lower chambers. The medium in both chambers was DMEM containing 5% FBS. After incubation at 37 °C for 24 hours, the chambers were removed, and the cells on the top surface of the chambers were gently wiped using a cotton swab. The chambers were washed twice with phosphate buffer saline (PBS) and then fixed in methanol for 30 minutes. When the chambers were dry, 0.1% crystal violet was used to stain for 30 minutes, and excess crystal violet was washed off using PBS. The cells were observed under a microscope after drying.
Cell invasion assay
The cell migration ability was tested by using a 24-well plate transwell chamber (Corning, Costar 3422). Matrigel (BD, 356234) was diluted with serum-free DMEM (Matrigel: DMEM = 1:8), and 60 μl of it was added to the chamber and incubated at 37 °C for 1 hour. After aspirating the liquid, the chamber was washed twice using DMEM. Then, 100 μl of serum-free DMEM containing 0.5×10⁵ cells was added to the upper chamber, and 500 μl of DMEM containing 5% FBS was added to the lower chamber. The transwell chamber was incubated at 37 °C for 24 hours. The subsequent steps were the same as the detection of cell migration above.
Cell cycle assay
In total, 5×10⁵ cells were centrifuged at 1,200 rpm for 5 minutes, and the supernatant was removed. One ml of pre-cooled 75% ethanol was added to the remaining component, and after resuspending, the cells were fixed at 4 °C for 2.5 hours. After centrifuging at 1,200 rpm for 5 minutes, the supernatant was discarded. One ml of PBS was used to wash the cells once, which were centrifuged again and had their supernatant discarded. Propidium Iodide/ribonuclease dye was used for staining. The cells were incubated in the dark at room temperature for 15 minutes, and flow cytometry was used to perform detection within 0.5 hours.
Cell apoptosis assay
In total, 105 cells were centrifuged at 1,200 rpm for 5 minutes, and the supernatant was removed. Then, 50 μl of 1× binding buffer was added to each tube, and after resuspending, different dyes were added according to the groups as follows: I) negative control: no dye; II) single positive control: 5 μl of Annexin V-APC; III) single positive control: 10 μl of 7-AAD. Five μl of Annexin V-FITC and 10 μl PI were added to the sample tube. After shaking the solution gently, it was incubated at room temperature (25 °C) in the dark for 15 minutes, and then 200 μl of 1× binding buffer was added. Flow cytometry was performed for detection within 1 hour.
RNA-seq
Total RNA extraction and RNA-seq
The total RNA extracted from the samples was treated with DNase I, and the magnetic beads with Oligo (dT) were used to enrich the eukaryotic mRNA. A breaking reagent was added to break the mRNA into short fragments, and a strand of cDNA was synthesized with six-base random primers (random hexamers) using the fragmented mRNA as a template. Buffer, dNTPs, and DNA polymerase I were added to synthesize the second strand of cDNA, which was purified and recovered by the kit. After being repaired by sticky ends, added with base “A” at the 3' end, and connected with a sequencing adapter, the resulting fragments were subjected to size selection, PCR amplification, and enrichment. The constructed library was qualified by an Agilent 2100 Bioanalyzer and Applied Biosystems StepOnePlus RT-PCR System. The Illumina sequencing platform was used for sequencing.
Data analysis of RNA-seq
The raw reads obtained by the sequencing platform were subjected to data quality control and filtered to obtain high-quality clean reads, which were aligned to the reference genome. The reads of the aligned genome were further located to the gene exon region using HTseq v0.6.1, and the number of reads on each gene alignment was counted to estimate the gene expression level. To make the estimated gene expression levels of different genes and different experiments comparable, the fragments per kilobase per million fragments (FPKM) [28] were calculated according to the following formula:
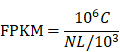
where C is the fragments (pair-end reads) uniquely aligned to the gene, N is the total number of fragments (pair-end reads) uniquely aligned to the reference gene, and L is the number of bases in the coding region of the gene.
Differentially expressed gene analysis, gene ontology (GO), WEGO, and pathway enrichment
Gene-expression analysis was conducted to learn the possible mechanisms of KTN1 in HCC cells. Significantly differentially expressed genes (DEGs) in KTN1-KO cells, compared to Huh7-WT cells, were identified using DEGseq v1.18.0 and DEGseq2 v1.4.5. The screening conditions were as follows: I) fold change ≥2 and II) Q-value ≤0.01. Gene ontology (GO) analysis [29] was performed using GOseq v1.16.2 and topGO v2.16.0. (Web Gene Ontology) WEGO software was used to compare the GO entries of the DEGs with the GO entries of all the reference genes and to find the GO terms that were significantly different from the background. A Kyoto Encyclopedia of Genes and Genomes (KEGG) [30] analysis was also conducted.
Risk prediction signatures based on Cox regression model
Protein-protein-interaction (PPI) analysis was performed to confirm the intimate interaction between KTN1 and DEGs, which was identified from in-house RNA-seq analysis. A PPI network was constructed using the networkD3 package. Hub genes were analyzed. A Cox regression model was utilized to determine putative risk indicators for HCC patients. HCC patients from The Cancer Genome Atlas (TCGA) cohort were grouped into high- and low-risk groups according to the median log (CPM+1) expression value of the putative risk indicators. Ggrisk and rms packages were exploited to analyze the risk distribution and survival conditions between the groups. The two-year and five-year survival rates of HCC patients were predicted based on these gene panels. Calibration curves were drawn and a C-index calculated to assess the accuracy of the established prognostic gene signatures.
Co-expression regulatory network analysis
To explore the potential mechanisms of KTN1 underlying HCC tissues, functional enrichment was performed based on gene expression analysis by using the integrated external gene chips and RNA-seq datasets. DEGs in HCC tissues, compared to normal liver tissues, were identified by using the limma-voom package. The filtration conditions were as follows: I) log2 fold change ≥1 and II) adjusted P <0.05. Co-expressed genes (CEGs) positively related to KTN1 were identified by performing gene co-expression analysis. The criteria were as follows: I) Person's relation coefficient >0.3 and II) P < 0.05. DEGs were intersected by CEGs. GO, KEGG, disease ontology (DO) [31], WikiPathways [32], and Reactome pathways [33] were enriched according to the overlapping genes. Finally, a PPI network was constructed.
Results
Increased KTN1 expression in HCC tissue
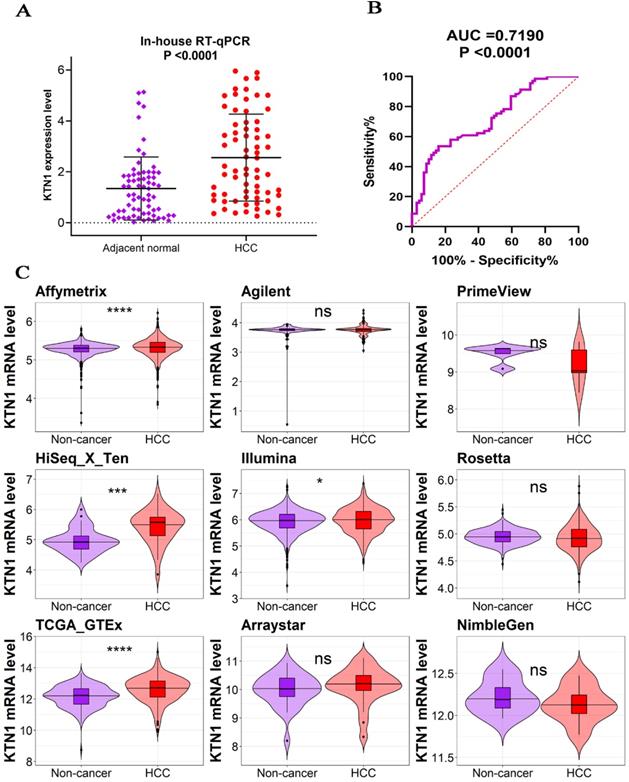
To clarify the expression status of KTN1 and its prognostic value, this study quantitatively detected the expression level of KTN1 and comprehensively analyzed the integrated gene chips and RNA-seq datasets. The results of in-house RT-qPCR indicated that KTN1 was significantly upregulated in 50 HCC tissues compared to 50 pericarcinous tissues (Figure 1A) and that KTN1 had a moderate ability to discriminate between HCC and non-HCC tissues (Figure 1B). External platform matrices integrated from gene chips and RNA-seq datasets covering 3,772 HCC and 2,998 non-HCC samples validated the upregulation trend of KTN1 in HCC tissues (Table 1; Figure 1C) and the general discriminatory ability of KTN1 (Figure S1). A pooled SMD value of 0.20 [0.04, 0.37] confirmed the increased expression level of KTN1 in HCC tissues using a random-effect model (Figure S2A). The SMD value did not change dramatically when each platform was omitted (Figure S2B), and no publication bias influenced the results because P > 0.05 (Figure S2C). A moderate ability of KTN1 to differentiate HCC from non-HCC tissue was detected from the SROC curve (Figure S3A), with a sensitivity (Figure S3B), specificity (Figure S3C), positive likelihood ratio (Figure S3D), and negative likelihood ratio (Figure S3E) of 44% [0.26, 0.63], 81% [0.67, 0.90], 2.36 [1.78, 3.12], and 0.69 [0.55, 0.86], respectively, implying its general accuracy.
Increased mRNA expression level of KTN1 in HCC tissues. (A) Result of the in-house reverse transcription real-time quantitative polymerase chain reaction (RT-qPCR) indicated KTN1 expression was significantly increased in HCC. (B) A moderate discriminatory ability of KTN1 between HCC and adjacent normal liver was shown by in-house RT-qPCR. (C) Validation of KTN1 upregulation based on external datasets. *P <0.05, *** P <0.001, **** P <0.0001. HCC, hepatocellular carcinoma.
Statistical information of the external gene chip and RNA sequencing datasets
| Platform | HCC | Non-HCC | P | TP | FP | FN | TN | ||||
|---|---|---|---|---|---|---|---|---|---|---|---|
| N1 | M1 | SD1 | N2 | M2 | SD2 | ||||||
| Affymetrix | 1656 | 5.3148 | 0.2330 | 1356 | 5.2789 | 0.1702 | <0.0001* | 485 | 157 | 1171 | 1199 |
| Agilent | 186 | 3.7549 | 0.1676 | 131 | 3.7241 | 0.3041 | 0.2493 | 19 | 0 | 167 | 131 |
| PrimeView | 5 | 9.1724 | 0.5436 | 5 | 9.4958 | 0.2363 | 0.2573 | 3 | 0 | 2 | 5 |
| HiSeq X Ten | 35 | 5.4274 | 0.5524 | 35 | 4.9672 | 0.4064 | 0.0002* | 27 | 9 | 8 | 26 |
| Illumina | 1117 | 5.9772 | 0.4806 | 822 | 5.9258 | 0.4293 | 0.0133* | 258 | 102 | 859 | 720 |
| Rosetta | 368 | 4.9271 | 0.2448 | 386 | 4.9482 | 0.1366 | 0.1476 | 109 | 39 | 259 | 347 |
| TCGA-GTEx | 371 | 12.6055 | 0.8301 | 225 | 12.1540 | 0.6789 | <0.0001* | 246 | 82 | 125 | 143 |
| Arraystar | 26 | 10.1334 | 0.6367 | 30 | 9.9886 | 0.5679 | 0.3723 | 21 | 17 | 5 | 13 |
| NimbleGen | 8 | 12.1336 | 0.2197 | 8 | 12.2219 | 0.2027 | 0.4177 | 5 | 3 | 3 | 5 |
*P <0.05 indicated significance.
Potential pro-tumor role of KTN1 in HCC
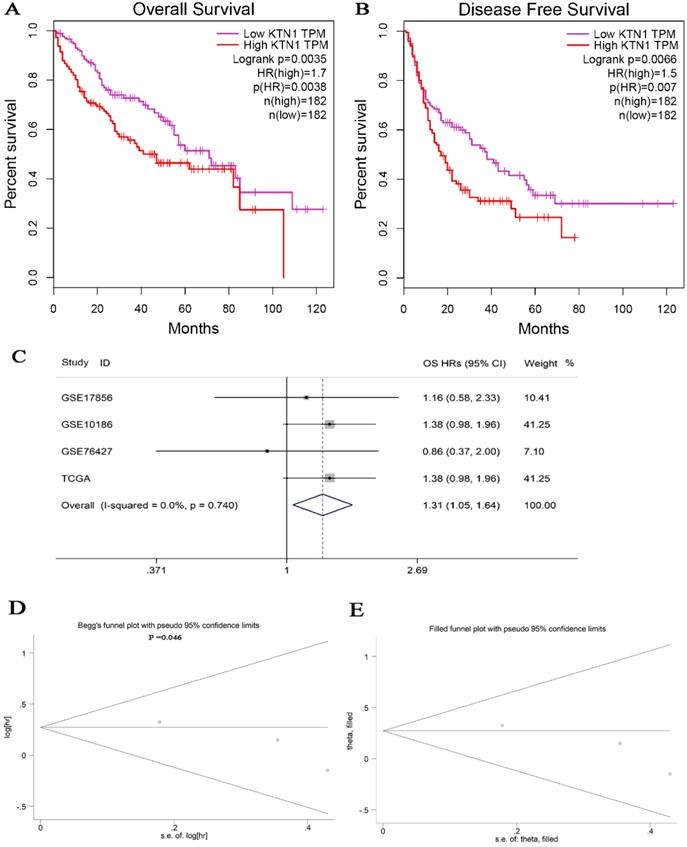
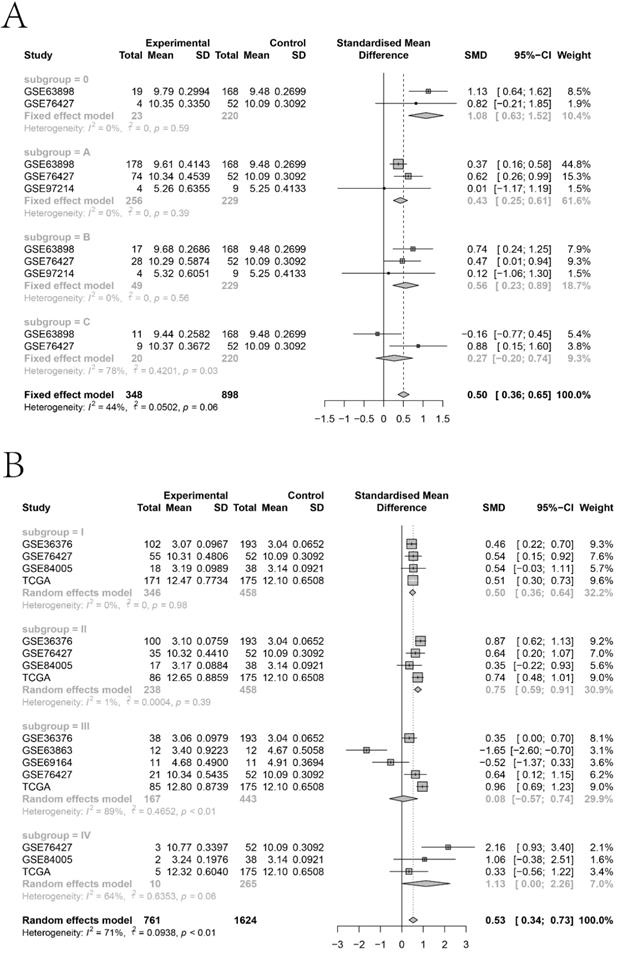
The KTN1 high-KTN1-expression group in HCC had poorer overall survival and disease-free survival conditions than the low-KTN1-expression group (Figure 2A-B). A combined HR value of 1.31 [1.05, 1.64] indicated that KTN1 may be an independent risk factor for HCC (Figure 2C). Trimmed and filled Begg's funnel plots showed the stability of the pooled HR results (Figure 2D-E). Table S1 presents the clinical features of the enrolled HCC patients. Higher KTN1 was correlated with worse Child-Pugh classification grades and lower plasma α-fetoprotein (AFP) levels (Figure S4A-B). Therefore, KTN1 might be an indicator in concealed HCC patients with low AFP expression. Additionally, the expression levels of KTN1 varied from patient to patient. Specifically, KTN1 was significantly upregulated in HCC patients at the zero, A, and B stages in terms of the BCLC system (Figure 3A-B). Interestingly, the upregulation of KTN1 tended to be more obvious in stage-IV HCC patients, with a single SMD of 1.13. However, since the sample size of stage-IV HCC patients was limited, no significance was detected. Metastatic HCC gene chips were analyzed after removing the inter-study batch effect (Figure S5A-B). KTN1 upregulation was a general phenomenon in both localized HCC tissues and metastatic HCC tissues (Figure S5C).
Poor prognosis of KTN1 expression in HCC. (A-B) High KTN1 expression predicted poor prognosis of overall survival and disease-free survival conditions of HCC patients. (C) Forest plot of overall survival hazard ratios signified KTN1 was an independent risk factor of HCC patients. (D) Begg's funnel plot indicated a probability of publication bias. Therefore, Begg's funnel plot with trim and fill was also analyzed (E). HCC, hepatocellular carcinoma.
Subgroup analysis based on the included hepatocellular carcinoma patients. (A) Barcelona Clinic Liver Cancer staging subgroup. (B) TNM staging subgroup.
Decreased expression of KTN1 after knockout in Huh7 cell lines
To explore the biological functions of KTN1 in HCC, the human cell line Huh7 was used to conduct a CRISPR/Cas9-mediated KTN1 knockout. The results of PCR-Sanger sequencing showed an obvious set of peaks at the gRNA binding site, indicating the occurrence of a frame-shift mutation, which confirmed the knockout efficiency (Figure 4A). Western blotting was performed, and decreased KTN1 protein expression was detected, further verifying the knockout efficiency (Figure 4B).
CRISPR/Cas9-mediated KTN1 knockout and biological functions of KTN1 in HCC cells. (A) Result of PCR-sanger sequencing verified the knockout efficiency. An obvious set of peaks was observed at the gRNA binding site, indicating the occurrence of a frame shift mutation. (B) Western blotting result verified the knockout efficiency. KTN1 protein expression was decreased in KTN1-knock-out cells and ACTB was used as internal reference. Panels C, E, and F showed that the migration ability was attenuated in KTN1-knock-out cells as opposed to Huh7 cells. Panels D, G, and H showed that the invasion ability was attenuated in KTN1-knock-out cells as opposed to Huh7 cells. Therefore, KTN1 could promote the migration and invasion of HCC cells. HCC, hepatocellular carcinoma.
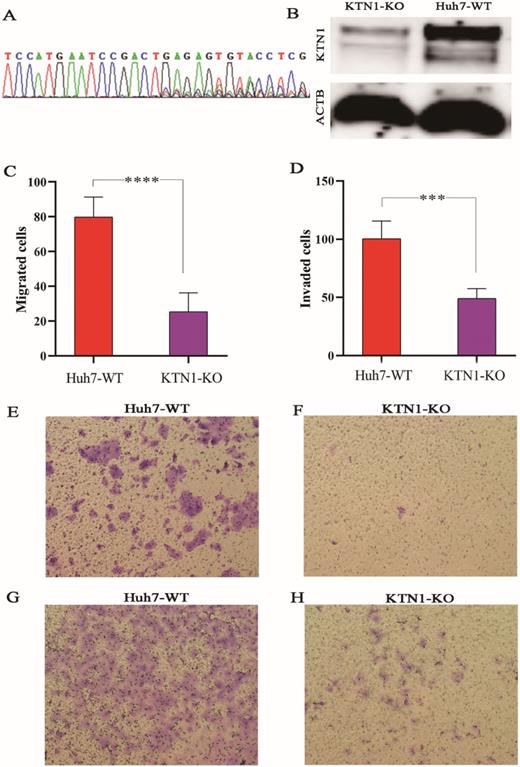
Cell migration and invasion assays
As observed in Figure 4C-H, the migration and invasion abilities were attenuated in KTN1-KO cells compared to Huh7-WT cells, suggesting that KTN1 promotes the migration and invasion of HCC cells.
Cell-viability assay
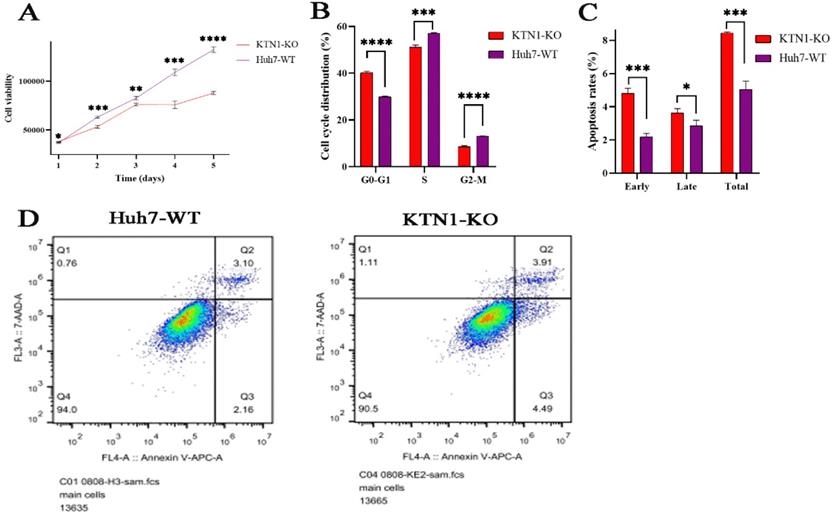
To determine the impact of KTN1 on cell viability, this study continuously detected the relative viability of KTN1-KO cells and Huh7-WT cells within five days of knocking out KTN1. The results signified that cell viability was inhibited in KTN1-KO cells compared to Huh7-WT cells (Figure 5A), indicating that KTN1 could enhance the viability of HCC cells.
Biological functions of KTN1 in HCC. (A) HCC cell viability was inhibited after KTN1 knockout. (B) The proportion of HCC cells in G0-G1 phase increased after KTN1 knockout, suggesting that KTN1 knockout would block the transition from G1 to S phase. (C) KTN1 knockout significantly increased the apoptosis rates in HCC cells in comparison with Huh7 cells, indicating KTN1 could attenuate apoptosis of HCC cells. Panel (D) presented the early and late apoptotic cell ratios. HCC, hepatocellular carcinoma.
Cell cycle and apoptosis assays
The relationships between KTN1, cell cycle regulation, and cell apoptosis were investigated. The proportion of HCC cells in the G0-G1 phases increased after KTN1 knockout, suggesting KTN1that it blocked the transition from the G1-S phases (Figure 5B). Moreover, KTN1 knockout significantly increased the apoptosis rates in HCC cells in comparison to Huh7-WT cells, indicating that KTN1 could attenuate the apoptosis of HCC cells (Figure 5C). Figure 5D presents higher early and late apoptotic cell ratios in KTN1-KO cells compared to Huh7-WT cells. Therefore, KTN1 may accelerate cell cycle progression and hinder apoptosis in HCC cells.
RNA-seq results
Quantitative expression analysis
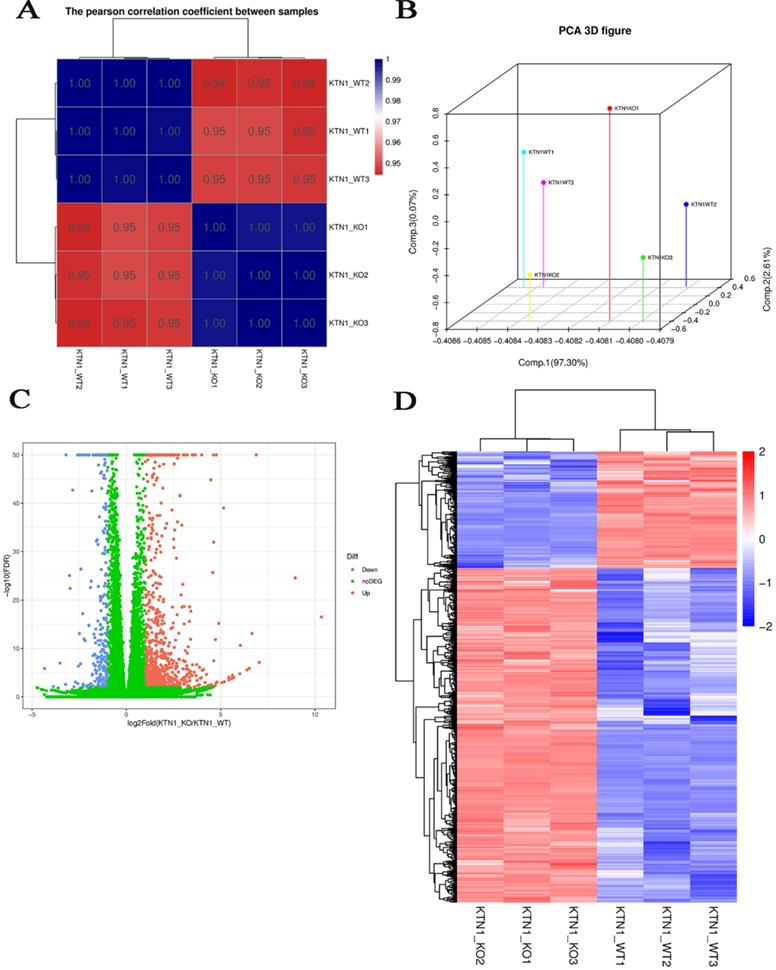
Since KTN1 plays an important role in multiple cellular functions of HCC, this study sought to determine the molecular events of KTN1 underlying HCC. RNA-seq was conducted to analyze gene expressions and structures. Figure S6 displays the processes of transcriptome resequencing experiments and transcriptome resequencing analysis. High-correlation coefficients between samples indicated little variation among KTN1-KO samples, confirming the reproducibility of the experiment (Figure 6A). The results of principal component analysis signified that KTN1 knockout was a reason for different expression levels (Figure 6B). In total, 793 upregulated genes and 277 downregulated genes were identified from the volcano plot (Figure 6C). A cluster analysis was used to compare the DEGs between different samples (Figure 6D).
Quantitative gene expression analysis by RNA-seq. (A) Correlation analysis between samples. (B) Principal component analysis results. Each point in the figure represents a sample (C) DEGs between KTN1-knockout and Huh7-wildtype samples. The X-axis represents the fold change of DEGs, and the Y-axis represents the significance. Red represents upregulated genes, and blue represents downregulated genes. (D) DEGs heat map. DEGs, differently expressed genes.
GO, WEGO, and pathway-enrichment analysis
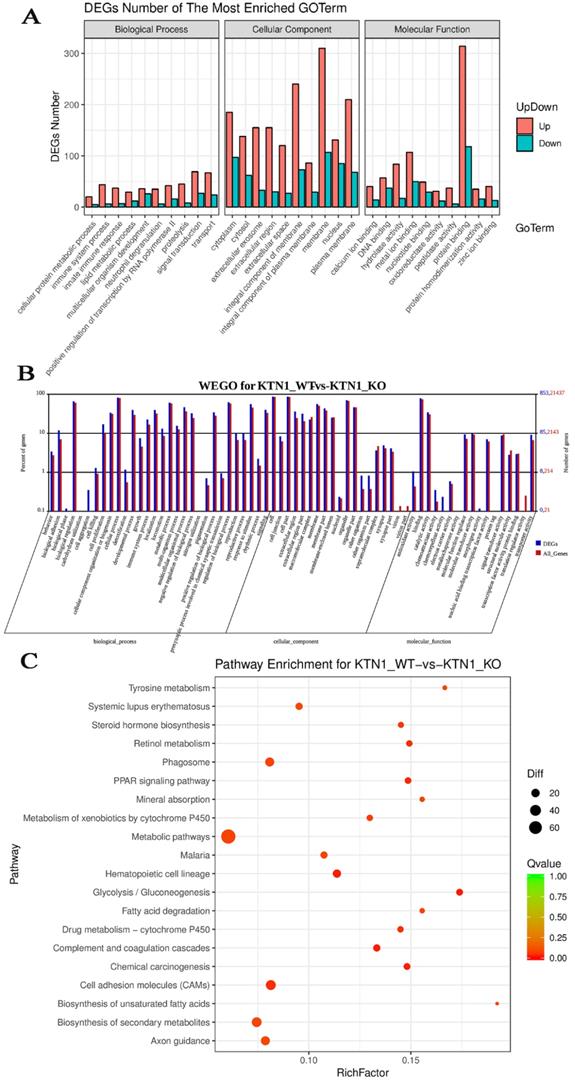
To explore the potential mechanisms of KTN1, functional annotation was based on the DEGs between KTN1-KO cells and Huh7-WT cells, which after KTN1 knockout, were predominantly enriched in signal transduction, transport, immune system process, innate immune response, and positive regulation of transcription by RNA polymerase II in GO biological processes (Figure 7A). Interestingly, “integral component of membrane” was one of the most aggregated GO cellular component terms, which corresponded to the renowned nature of KTN1 as an integral membrane protein. In addition, DNA binding, protein binding, and metal ion binding (i.e., Ca2+ and Zn2+) were the dominant GO molecular function terms. After being normalized by the background, WEGO analysis showed that translation regulator activity, virion, biological phase, cell aggregation, chemorepellent activity, and morphogen activity were the most altered GO terms after the KTN1 knockout KTN1 (Figure 7B). Furthermore, chemical carcinogenesis, metabolic pathways (e.g., tyrosine metabolism, metabolism of xenobiotics by cytochrome P50, and drug metabolism), and cell-adhesion molecules were the most clustered pathways (Figure 7C).
Functional annotation based on the DEGs between KTN1-knockout and Huh7-wildtype samples. (A) Gene ontology enrichment analysis. (B) WEGO analysis. The left Y-axis represents the ratio of gene numbers in each GO term and that in all GO terms. The left Y-axis represents the number of genes corresponding to GO term, where the red number represents the background (all genes) and the blue number represents the differential gene. (C) Kyoto Encyclopedia of Genes and Genomes pathway. DEGs, differently expressed genes.
Identification of risk-prediction signatures
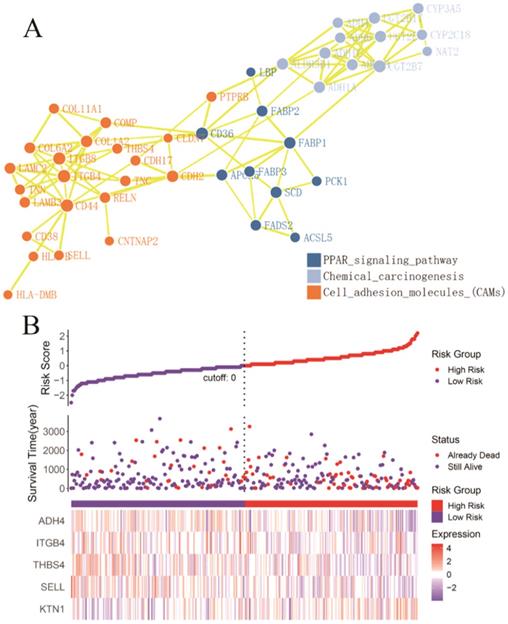
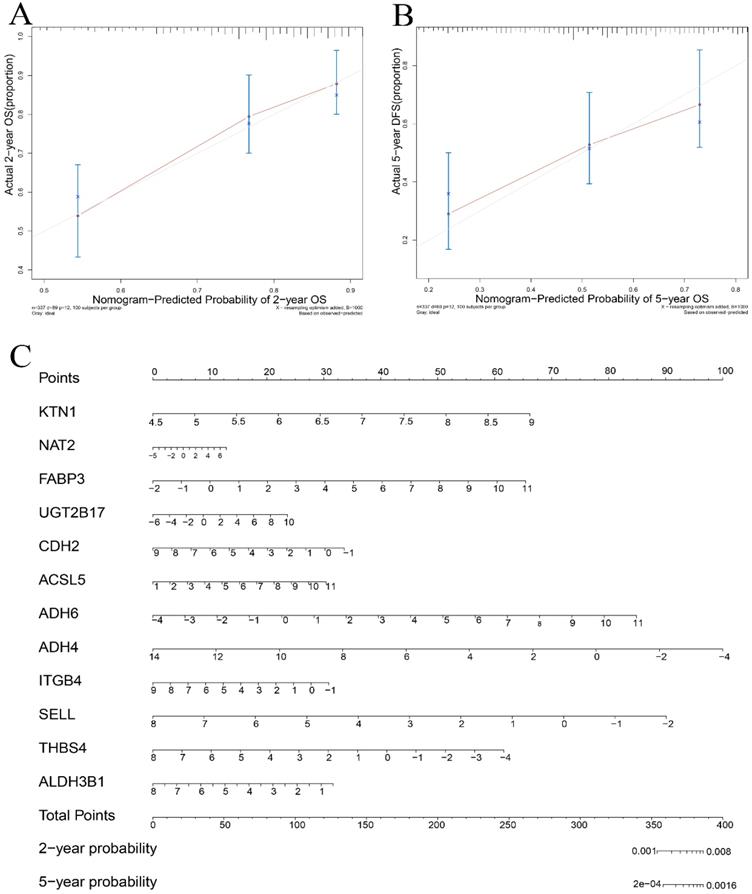
A total of 54 genes aggregated in the chemical carcinogenesis, PPAR signaling pathway, retinol metabolism, and cell-adhesion molecules (Figure 8A) were used to perform a Cox proportional-hazard regression analysis based on the TCGA cohort. Figure 8B presents the risk distribution of the HCC patients. SELL, ITGB4, ALDH3B1, THBS4, and ADH4 were predicted to be protective factors of HCC, while UGT2B17, NAT2, FABP3, CDH2, ACSL5, and ADH6 were forecasted as risk factors of HCC (Table S2). Interestingly, ITGB4 and UGT2B17 were hub genes of the cell-adhesion molecules and retinol metabolism pathways. Combined with KTN1, these risk-predicting signatures showed moderately accurate indications of the 2-year and 5-year survival conditions of HCC patients, with a C-index of 0.7010 [se(C) = 0.0317] (Figure 9A-C). However, more studies are needed to validate the accuracy of the risk model.
Identification of KTN1 associated risk prediction signatures in HCC. (A) Protein-protein interaction network based on the chemical carcinogenesis, PPAR signaling pathway, retinol metabolism, and cell adhesion molecules (Note: genes that enriched in the retinol metabolism pathway all participated in the chemical carcinogenesis pathways). (B) Risk prediction of HCC patients based on the KTN1 associated risk prediction signatures. HCC, hepatocellular carcinoma.
Validation of the risk prediction model in HCC. (A-B) Calibration curve based on the KTN1 associated risk prediction signatures in HCC. (C) Nomogram in predicting the 2-year and 5-year survival condition of HCC patients. HCC, hepatocellular carcinoma.
Co-expression regulatory network analysis
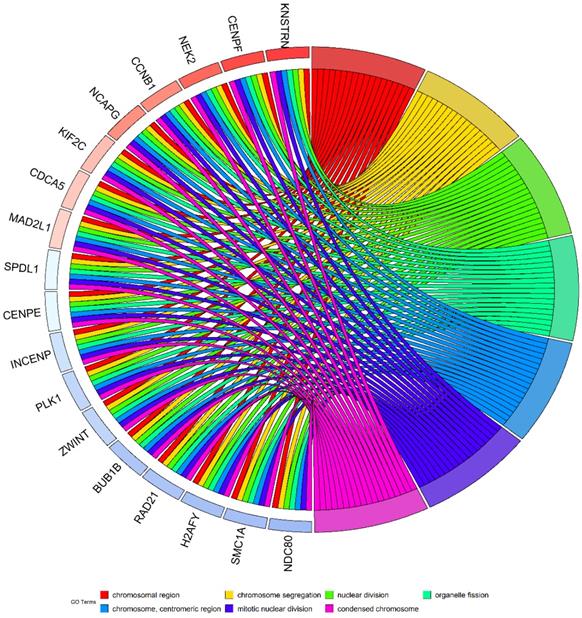
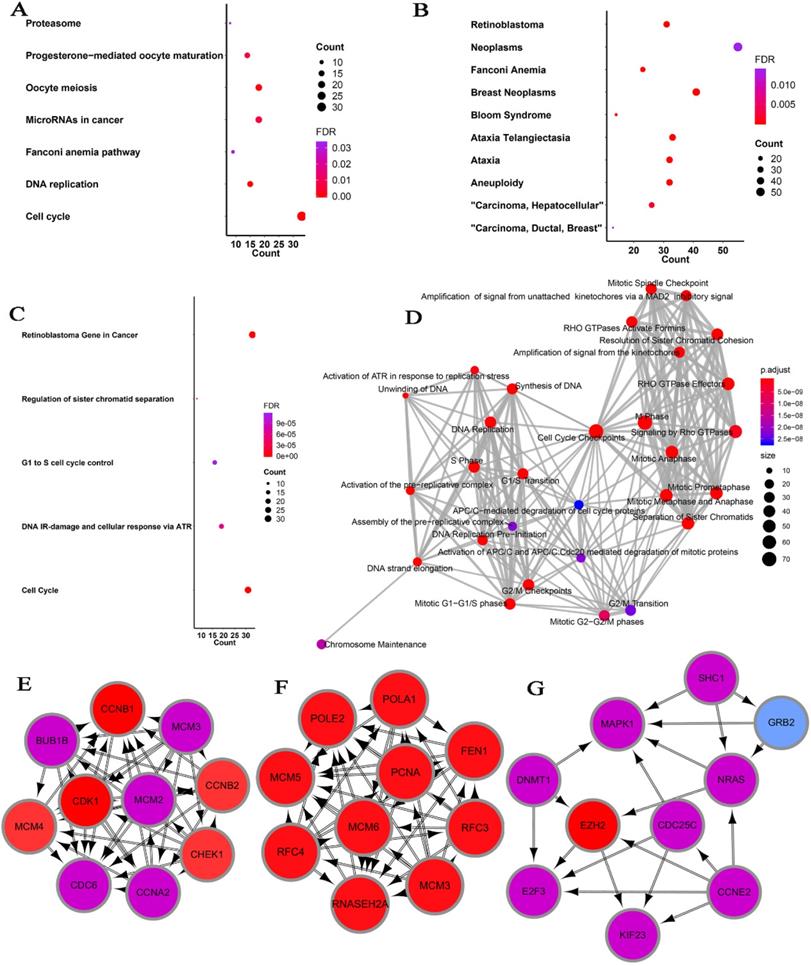
Considering the possibility of distinct mechanisms of KTN1 in HCC cell lines and human tissues, the potential functions of KTN1 in HCC tissues were annotated. In total, 1,499 upregulated genes and 6,872 CEGs positively related to KTN1 were identified from the integrated platform expression matrices. Figure S7A-B shows two expression heatmaps based on the Arraystar and NimbleGen platforms. By intersecting upregulated genes and CEGs positively related to KTN1, 687 overlapping genes were obtained that were significantly enriched in chromosome segregation, nuclear division, organelle fission, microtubule binding, chromatin binding, and tubulin binding in terms of GO (P < 0.05, Figure 10; Table S3). In addition, the cell cycle, DNA replication, oocyte meiosis, and microRNAs in cancer were the top four most aggregated KEGG pathways (P < 0.05, Figure 11A; Table S4). Pertaining to disease annotation, the significantly enriched diseases were HCC, retinoblastoma, and breast neoplasms (P < 0.05, Figure 11B; Table S5). Moreover, the retinoblastoma gene in cancer, cell cycle, regulation of sister chromatid separation, and the G1-S cell cycle control were the significant WikiPathways (P < 0.05, Figure 11C; Table S6). Furthermore, the upregulated genes related to KTN1 in HCC were pronouncedly accumulated in cell cycle checkpoints, the separation of sister chromatids, and DNA replication in terms of Reactome pathways (P < 0.05, Figure 11D; Table S7). PPI networks were constructed to display the co-expression relationships among genes in the cell cycle, DNA replication, and microRNAs of cancer pathways, respectively (Figure 11E-G). CCNB1, MCM6, EZH2, CDK1, MCM3, POLE2, POLA1, MCM5, RNASEH2A, FEN1, RFC4, PCNA, and RFC3 were identified as core genes, and nine of them (i.e., CCNB1, MCM6, EZH2, CDK1, MCM3, POLA1, RNASEH2A, FEN1, and RFC4) were risk factors in HCC patients (all with HRs > 1, P < 0.05).
Gene ontology enrichment analysis based on the intersected genes of DGEs in HCC and CEGs positively related to KTN1. DEGs, differentially expressed genes; CEGs, co-expressed genes; HCC, hepatocellular carcinoma.
Pathway analysis based on the intersected genes of DEGs in HCC and CEGs that related to KTN1. (A) Kyoto Encyclopedia of Genes and Genomes pathway. (B) Disease Ontology. (C) Wikipathway. (D) Reactome pathway. (E-F) Protein-to-protein interaction networks based on the KEGG pathways of cell cycle, DNA replication, and microRNAs in cancer. DEGs, differentially expressed genes; HCC, hepatocellular carcinoma; CEGs, co-expressed genes.
Discussion
HCC is one of the most heterogeneous and pernicious tumors in the world [34-36]. The knowledge gap between KTN1 and HCC necessitates more research to clarify the roles of KTN1 and to direct future development of novel therapies for HCC. In this study, KTN1 was comprehensively analyzed from multi-faceted perspectives for the first time, covering clinical tissues, in vitro experiments, and in silico analysis. This study was prospective on several levels. First, the increased expression levels of KTN1 in HCC were determined by integrated analysisKTN1 and confirmed by in-house RT-qPCR and large external datasets containing gene chips and RNA-seq data with a total of 6,870 participants. In addition, this study enrolled HCC patients from all over the world after careful screening, which makes the results more convincing. Second, the clinical implications of KTN1 were fully evaluated by a retrospective cohort study. High KTN1 expression was significantly correlated to poorer prognosis of HCC patients, and KTN1 may be an independent risk factor for HCC. Third, the biological functions of KTN1 were confirmed by high-quality in vitro experiments using the CRISPR/Cas9 gene-editing system. Excitingly, KTN1 may promote migration and invasion ability, enhance cell viability, accelerate cell cycle progression, and hinder apoptosis in HCC cells. Importantly, a risk-prediction model for HCC patients was established based on the DEGs identified from the in-house RNA-seq. Fourth, the complicated molecular mechanisms of KTN1 underlying HCC were revealed on the cell and tissue levels by analyzing in-house RNA-seq results combined with in silico annotations. Several cascades including innate immune response, chemical carcinogenesis, and positive regulation of transcription by RNA polymerase II, were dramatically changed after KTN1 knockout. Moreover, in human HCC tissues, KTN1 may participate in the cell cycle, DNA replication, and microRNAs in cancer pathways. Therefore, this study has pinpointed a novel role of KTN1 in HCC development.
KTN1 was upregulated in HCC tissues and correlated with unfavorable outcomes in HCC patients. This study provided convincing evidence of the increased expression of KTN1 by analyzing a total of 3,822 HCC tissues and 3,048 non-HCC tissues, results that have not been reported before. Given the upregulated expression pattern of KTN1, the researchers speculate that it has applications in HCC screening and prognosis surveillance. Although the discriminatory ability of KTN1 between HCC and non-HCC tissues was general, the prognostic value of KTN1 in HCC deserves further verification in clinical practice in the future. The increased expression of KTN1 forecasted the poorer survival conditions of HCC patients, and KTN1 may be an independent risk factor for HCC. Therefore, the potential clinical value of KTN1 in HCC is promising, but more studies are required to promote its applications.
KTN1 was successfully knocked out in a Huh7 cell line using the CRISPR/Cas9 gene-editing system, revealing the biological functions of KTN1 in HCC cells. In vitro experiments, including a cell-viability assay, a migration assay, a cell invasion assay, a cell-cycle assay, and an apoptosis assay, determined the impact of KTN1 on HCC at the cell level. Surprisingly, the migration and invasion abilities and cell viability were attenuated in KTN1-KO cells compared to Huh7-WT cells, indicating that KTN1 may enhance cell viability and promote cell migration and invasion in HCC. A previous study reported the role of KTN1 in contributing to the direction of cell migration in breast cancer cells [22], and another disturbed the interaction between KTN1 proteins and kinesin and observed that cell migration was hindered [37]. Such studies point to the promotion effect of KTN1 on cells. Furthermore, KTN1 knockout raised the proportion of HCC cells in the G0-G1 phases and increased apoptosis rates, suggesting that KTN1 promotes cell-cycle progression but inhibits cell apoptosis in HCC. These findings support KTN1's important role in the malignant manifestations of HCC by regulating cell viability, migration, invasion, cell cycle activation, and apoptotic inhibition. In-depth in vivo experiments must be performed to confirm this result.
The genetic expression changes in HCC cells after KTN1 knockout were quantitatively detected by RNA-seq. In this study, a total of 793 upregulated genes and 277 downregulated genes were identified in the KTN1-KO cells, which were aggregated in immune activities (i.e., immune system process and innate immune response), gene expression (i.e., positive regulation of transcription by RNA polymerase II and translation regulator activity), and chemical carcinogenesis. Interestingly, the KTN1 protein, as mentioned in the Introduction, influenced transcription by binding to EF-δ and participating in the assembly of the EF-1 complex, which was consistent with the annotation result in this study. Furthermore, KTN1 was confirmed to be a pathogenic autoimmune antigen in several diseases [38, 39], suggesting its role KTN1in regulating immune systems and being involved in tumor immunity. More importantly, the authors revealed an association between KTN1 and the chemical carcinogenesis pathway, which may be responsible for the onset of HCC. Overall, the KTN1 knockout experiment and RNA-seq analysis make it reasonable to propose that KTN1 induces the development of HCC cells by transcription regulation, immune mechanisms, and chemical carcinogenesis.
The potential molecular mechanisms of KTN1 underlying HCC tissues were functionally annotated. Surprisingly, upregulated genes that co-expressed with KTN1 in HCC tissues were significantly enriched in cell cycle and cell-division-related biological processes (i.e., chromosome segregation, nuclear division, organelle fission, microtubule binding, chromatin binding, and tubulin binding). Specifically, the authors observed that such genes were significantly clustered in the G1-S cell cycle control pathway, which was consistent with the in vivo experimental evidence mentioned in Section 3.5. To the best of our knowledge, KTN1 proteins and kinesin are microtubule-associated proteins that participate in cell division [40-43]. In tumor cells, KTN1 proteins and kinesin may be abused. Therefore, KTN1 indeed plays an essential role in promoting cell cycle G1/S transition and may induce uncontrollable the cell division and malignant biological behaviors of HCC, resulting in its progression. Moreover, such genes were correlated to HCC in terms of disease enrichment, further supporting our proposal.
Furthermore, KTN1 may be a candidate target for developing novel therapies for HCC patients, one reason for which is that KTN1 had immune activity. As mentioned in the Introduction, KTN1 was the most frequently detected antigen in a serological analysis based on HCC tissue samples [23]. More interestingly, even molecules with tandem-repeat features like the KTN1 protein (i.e., CDR34 and CT7) also reacted with the serum antibodies from tumor patients [44, 45]. Nonetheless, more research is required to mine the therapeutic value of KTN1 in HCC.
This study faced several limitations, of course. First, it did not probe the potential sources of high heterogeneity among different platforms. To minimize the interruption effect of the heterogeneity-to-SMD result, a random-effect model was utilized. Second, the biological effect and pro-tumor role of KTN1 in HCC was not verified on the in vivo level. However, to reveal the functions of KTN1 in HCC, this study performed in vitro experiments on KTN1-KO cells using the CRISPR/Cas9 gene-editing system, biological assays, and RNA-seq data. Our study also provided new directions for research on the mechanism of HCC progression, although more experimental evidence must be found to verify the pro-tumor role of KTN1. Third, in silico functional annotation was conducted to explore possible molecular mechanisms, for which further in vivo studies are required to support our findings.
Conclusions
KTN1 was upregulated in HCC and served as a promising prognosticator in patients. KTN1 may induce the occurrence and deterioration of HCC by mediating cell survival, migration, invasion, cell cycle activation, and apoptotic inhibition.
Abbreviations
HCC: hepatocellular carcinoma; KTN1: kinectin 1; EF: elongation factor; CSCC: cutaneous squamous cell carcinoma; RT-qPCR: reverse transcription real-time quantitative-polymerase chain reaction; RNA-seq: RNA sequencing; SMD: standardized mean difference; SROC: summary receiver operating characteristic; HRs: hazard ratios; WT: wild-type; KO: knockout; FPKM: fragment Per Kilo bases per Million fragment; DEGs: differentially expressed genes; GO: Gene Ontology; KEGG: Kyoto Encyclopedia of Genes and Genomes; CEGs: co-expressed genes; DO: Disease Ontology; PPI: protein-protein-interaction.
Supplementary Material
Supplementary figures and tables.
Acknowledgements
Funding
This work was supported by the Natural Science Foundation of Guangxi (2017GXNSFAA198079 and 2018GXNSFAA138144) and Guangxi Education Department Project: The Key Laboratory of Human Development and Disease Research in Guangxi Universities.
Ethics committee approval and patient consent
The study was approved by the ethics committee of First Affiliated Hospital of Guangxi Medical University.
Competing Interests
The authors have declared that no competing interest exists.
References
1. Sagnelli E, Macera M, Russo A, Coppola N, Sagnelli C. Epidemiological and etiological variations in hepatocellular carcinoma. Infection. 2020;48(1):7-17
2. Bray F, Ferlay J, Soerjomataram I, Siegel RL, Torre LA, Jemal A. Global cancer statistics 2018: GLOBOCAN estimates of incidence and mortality worldwide for 36 cancers in 185 countries. CA: a cancer journal for clinicians. 2018;68:394-424
3. Yip TC-F, Wong VW-S, Chan HL-Y, Tse Y-K, Lui GC-Y, Wong GL-H. Tenofovir Is Associated With Lower Risk of Hepatocellular Carcinoma Than Entecavir in Patients With Chronic HBV Infection in China. Gastroenterology. 2020;158(1):215-225
4. Liu Y-W, Yong C-C, Lin C-C, Wang C-C, Chen C-L, Cheng Y-F. et al. Liver resection of hepatocellular carcinoma within and beyond the Barcelona Clinic Liver Cancer guideline recommendations: Results from a high-volume liver surgery center in East Asia. J Surg Oncol. 2020;122(8):1587-1594
5. Forner A, Reig M, Bruix J. Hepatocellular carcinoma. Lancet. 2018;391:1301-14
6. Zeng Y, Chen S, Fu Y, Wu W, Chen T, Chen J. et al. Gut microbiota dysbiosis in patients with hepatitis B virus-induced chronic liver disease covering chronic hepatitis, liver cirrhosis and hepatocellular carcinoma. J Viral Hepat. 2020;27:143-55
7. Sartorius K, Makarova J, Sartorius B, An P, Winkler C, Chuturgoon A. et al. The Regulatory Role of MicroRNA in Hepatitis-B Virus-Associated Hepatocellular Carcinoma (HBV-HCC) Pathogenesis. Cells. 2019;8(12):1504
8. Méndez-Blanco C, Fondevila F, Fernández-Palanca P, García-Palomo A, Pelt Jv, Verslype C. et al. Stabilization of Hypoxia-Inducible Factors and BNIP3 Promoter Methylation Contribute to Acquired Sorafenib Resistance in Human Hepatocarcinoma Cells. Cancers. 2019;11(12):1984
9. Javanmard D, Najafi M, Babaei MR, Karbalaie Niya MH, Esghaei M, Panahi M. et al. Investigation of gene mutations and expression in hepatocellular carcinoma and cirrhosis in association with hepatitis B virus infection. Infect Agent Cancer. 2020;15:37
10. Hou J, Zhang H, Liu J, Zhao Z, Wang J, Lu Z. et al. YTHDF2 reduction fuels inflammation and vascular abnormalization in hepatocellular carcinoma. Mol Cancer. 2019;18:163
11. Zhang X, Wu X, Hu Q, Wu J, Wang G, Hong Z. et al. Mitochondrial DNA in liver inflammation and oxidative stress. Life Sci. 2019;236:116464
12. Ma H-Y, Yamamoto G, Xu J, Liu X, Karin D, Kim JY. et al. IL-17 signaling in steatotic hepatocytes and macrophages promotes hepatocellular carcinoma in alcohol-related liver disease. Journal of hepatology. 2020;72:946-59
13. Moeini A, Torrecilla S, Tovar V, Montironi C, Andreu-Oller C, Peix J. et al. An Immune Gene Expression Signature Associated With Development of Human Hepatocellular Carcinoma Identifies Mice That Respond to Chemopreventive Agents. Gastroenterology. 2019;157(5):1383-1397.e11
14. Chu HH, Kim JH, Kim PN, Kim SY, Lim Y-S, Park SH. et al. Surgical resection versus radiofrequency ablation very early-stage HCC (≤2 cm Single HCC): A propensity score analysis. Liver international: official journal of the International Association for the Study of the Liver. 2019;39:2397-407
15. Kloeckner R, Galle PR, Bruix J. Local and Regional Therapies for Hepatocellular Carcinoma. Hepatology (Baltimore, Md). 2020 Online ahead of print
16. Aoki T, Kubota K, Hasegawa K, Kubo S, Izumi N, Kokudo N. et al. Significance of the surgical hepatic resection margin in patients with a single hepatocellular carcinoma. Br J Surg. 2020;107:113-20
17. Xing H, Zhang W-G, Cescon M, Liang L, Li C, Wang M-D. et al. Defining and predicting early recurrence after liver resection of hepatocellular carcinoma: a multi-institutional study. HPB (Oxford). 2020;22:677-89
18. Song X, Du R, Gui H, Zhou M, Zhong W, Mao C. et al. Identification of potential hub genes related to the progression and prognosis of hepatocellular carcinoma through integrated bioinformatics analysis. Oncology reports. 2020;43:133-46
19. Yu Y, Xu P, Cui G, Xu X, Li K, Chen X. et al. UBQLN4 promotes progression of HCC via activating wnt-β-catenin pathway and is regulated by miR-370. Cancer Cell Int. 2020;20:3
20. Zhai Z, Fu Q, Liu C, Zhang X, Jia P, Xia P. et al. Emerging Roles Of hsa-circ-0046600 Targeting The miR-640/HIF-1α Signalling Pathway In The Progression Of HCC. Onco Targets Ther. 2019;12:9291-302
21. Villanueva A. Hepatocellular Carcinoma. N Engl J Med. 2019;380:1450-62
22. Ng IC, Pawijit P, Teo LY, Li H, Lee SY, Yu H. Kinectin-dependent ER transport supports the focal complex maturation required for chemotaxis in shallow gradients. J Cell Sci. 2016;129:2660-72
23. Wang H-C, Su Y-R, Han K-J, Pang X-W, Peng J-R, Liang B. et al. Multiple variants and a differential splicing pattern of kinectin in human hepatocellular carcinoma. Biochem Cell Biol. 2004;82:321-7
24. Ong L-L, Lin P-C, Zhang X, Chia S-M, Yu H. Kinectin-dependent assembly of translation elongation factor-1 complex on endoplasmic reticulum regulates protein synthesis. J Biol Chem. 2006;281:33621-34
25. Ong L-L, Er CPN, Ho A, Aung MT, Yu H. Kinectin anchors the translation elongation factor-1 delta to the endoplasmic reticulum. J Biol Chem. 2003;278:32115-23
26. Zhang Y, Gao L, Ma S, Ma J, Wang Y, Li S. et al. MALAT1-KTN1-EGFR regulatory axis promotes the development of cutaneous squamous cell carcinoma. Cell Death Differ. 2019;26:2061-73
27. Babeto E, Conceição ALG, Valsechi MC, Peitl Junior P, de Campos Zuccari DAP, de Lima LGCA. et al. Differentially expressed genes in giant cell tumor of bone. Virchows Arch. 2011;458:467-76
28. Eilertsen IA, Moosavi SH, Strømme JM, Nesbakken A, Johannessen B, Lothe RA. et al. Technical differences between sequencing and microarray platforms impact transcriptomic subtyping of colorectal cancer. Cancer letters. 2020;469:246-55
29. Guo T, Hou D, Yu D. Bioinformatics analysis of gene expression profile data to screen key genes involved in intracranial aneurysms. Mol Med Rep. 2019;20:4415-24
30. Kanehisa M, Sato Y. KEGG Mapper for inferring cellular functions from protein sequences. Protein Sci. 2020;29:28-35
31. Barman RK, Mukhopadhyay A, Maulik U, Das S. Identification of infectious disease-associated host genes using machine learning techniques. BMC Bioinformatics. 2019;20:736
32. Rex DAB, Agarwal N, Prasad TSK, Kandasamy RK, Subbannayya Y, Pinto SM. A comprehensive pathway map of IL-18-mediated signalling. J Cell Commun Signal. 2020;14:257-66
33. Fabregat A, Jupe S, Matthews L, Sidiropoulos K, Gillespie M, Garapati P. et al. The Reactome Pathway Knowledgebase. Nucleic Acids Res. 2018;46:D649-D55
34. Pang Y, Liu Z, Han H, Wang B, Li W, Mao C. et al. Peptide SMIM30 promotes HCC development by inducing SRC/YES1 membrane anchoring and MAPK pathway activation. Journal of hepatology. 2020;73:1155-69
35. Viral Analysis. Early Detection of HCC. Cancer Discov. 2020;10:1247-8
36. Wu Z, Guo W, Chen S, Zhuang W. Determinants of pain in advanced HCC patients recieving hepatic artery infusion chemotherapy. Invest New Drugs. 2020 Online ahead of print
37. Zhang X, Tee YH, Heng JK, Zhu Y, Hu X, Margadant F. et al. Kinectin-mediated endoplasmic reticulum dynamics supports focal adhesion growth in the cellular lamella. J Cell Sci. 2010;123:3901-12
38. Lu Y, Ye P, Chen S-l, Tan EM, Chan EKL. Identification of kinectin as a novel Behçet's disease autoantigen. Arthritis Res Ther. 2005;7:R1133-R9
39. Hirano N, Butler MO, Von Bergwelt-Baildon MS, Maecker B, Schultze JL, O'Connor KC. et al. Autoantibodies frequently detected in patients with aplastic anemia. Blood. 2003;102:4567-75
40. Wu W-D, Yu K-W, Zhong N, Xiao Y, She Z-Y. Roles and mechanisms of Kinesin-6 KIF20A in spindle organization during cell division. Eur J Cell Biol. 2019;98:74-80
41. Yu K-W, Zhong N, Xiao Y, She Z-Y. Mechanisms of kinesin-7 CENP-E in kinetochore-microtubule capture and chromosome alignment during cell division. Biol Cell. 2019;111:143-60
42. Lucanus AJ, Yip GW. Kinesin superfamily: roles in breast cancer, patient prognosis and therapeutics. Oncogene. 2018;37:833-8
43. Parvin A, Hao S-L, Tan F-Q, Yang W-X. Inhibition of kinesin motor protein KIFC1 by AZ82 induces multipolar mitosis and apoptosis in prostate cancer cell. Gene. 2020;760:144989
44. Chen YT, Güre AO, Tsang S, Stockert E, Jäger E, Knuth A. et al. Identification of multiple cancer/testis antigens by allogeneic antibody screening of a melanoma cell line library. Proc Natl Acad Sci U S A. 1998;95:6919-23
45. Dropcho EJ, Chen YT, Posner JB, Old LJ. Cloning of a brain protein identified by autoantibodies from a patient with paraneoplastic cerebellar degeneration. Proc Natl Acad Sci U S A. 1987;84:4552-6
Author contact
![]() Corresponding authors: Guo-Rong Luo & Nai-Xia Chao contributed equally to this work. Guo-Rong Luo, Department of Histology and Embryology, Guangxi Medical University, Nanning, Guangxi Zhuang Autonomous Region, 530021, P.R. China. E-mail: luoguorongedu.cn; Nai-Xia Chao, Department of Biochemistry and Molecular Biology, Guangxi Medical University. hurry211625com.
Corresponding authors: Guo-Rong Luo & Nai-Xia Chao contributed equally to this work. Guo-Rong Luo, Department of Histology and Embryology, Guangxi Medical University, Nanning, Guangxi Zhuang Autonomous Region, 530021, P.R. China. E-mail: luoguorongedu.cn; Nai-Xia Chao, Department of Biochemistry and Molecular Biology, Guangxi Medical University. hurry211625com.