Impact Factor ISSN: 1837-9664

 Global reach, higher impact
J Cancer 2021; 12(16):4912-4923. doi:10.7150/jca.57231 This issue Cite
Research Paper
A clinical prediction model identifies a subgroup with inferior survival within intermediate risk acute myeloid leukemia
Xiaoxia Hu1 ![]() *, Bianhong Wang2,3*, Qi Chen4*, Aijie Huang1, Weijia Fu1, Lixia Liu5, Ying Zhang1, Gusheng Tang1, Hui Cheng1, Xiong Ni1, Lei Gao1, Jie Chen1, Li Chen1, Weiping Zhang1, Jianmin Yang1, Shanbo Cao5, Li Yu3,6
*, Bianhong Wang2,3*, Qi Chen4*, Aijie Huang1, Weijia Fu1, Lixia Liu5, Ying Zhang1, Gusheng Tang1, Hui Cheng1, Xiong Ni1, Lei Gao1, Jie Chen1, Li Chen1, Weiping Zhang1, Jianmin Yang1, Shanbo Cao5, Li Yu3,6 ![]() , Jianmin Wang1
, Jianmin Wang1 ![]()
1. Department of Hematology, Institute of Hematology, Changhai Hospital, Shanghai 200433, China.
2. Department of Hematology, Beijing Tsinghua Changgung Hospital, School of Clinical Medicine, Tsinghua University, Beijing 102218, China.
3. Department of Hematology, Chinese PLA General Hospital, Beijing, 100853, China.
4. Department of Health Statistics, Second Military Medical University, Shanghai 200433, China.
5. Acornmed Biotechnology Co., Ltd. Beijing, 100176, China.
6. Department of Hematology and Oncology, Shenzhen University General Hospital; Shenzhen University International Cancer Center, Shenzhen University Health Science Center, Shenzhen, 518000, China.
* These authors contributed equally.
Received 2020-12-27; Accepted 2021-5-19; Published 2021-6-11
Abstract

Intermediate risk acute myeloid leukemia (AML) comprises around 50% of AML patients and is featured with heterogeneous clinical outcomes. The study aimed to generate a prediction model to identify intermediate risk AML patients with an inferior survival. We performed targeted next generation sequencing analysis for 121 patients with 2017 European LeukemiaNet-defined intermediate risk AML, revealing 122 mutated genes, with 24 genes mutated in > 10% of patients. A prognostic nomogram characterized by white blood cell count ≥10×109/L at diagnosis, mutated DNMT3A and genes involved in signaling pathways was developed for 110 patients who were with clinical outcomes. Two subgroups were identified: intermediate low risk (ILR; 43.6%, 48/110) and intermediate high risk (IHR; 56.4%, 62/110). The model was prognostic of overall survival (OS) and relapse-free survival (RFS) (OS: Concordance index [C-index]: 0.703, 95%CI: 0.643-0.763; RFS: C-index: 0.681, 95%CI 0.620-0.741), and was successfully validated with two independent cohorts. Allogeneic hematopoietic stem cell transplantation (alloHSCT) reduced the relapse risk of IHR patients (3-year RFS: alloHSCT: 40.0±12.8% vs. chemotherapy: 8.6±5.8%, P= 0.010). The prediction model can help identify patients with an unfavorable prognosis and refine risk-adapted therapy for intermediate risk AML patients.
Keywords: Acute myeloid leukemia, Intermediate risk, Nomogram, Prediction model, allogenic hematopoietic stem cell transplantation
Introduction
Acute myeloid leukemia (AML) is a heterogeneous disease featured with impaired differentiation and uncontrolled proliferation of myeloid progenitors, accompanied by the suppression of normal hematopoietic cells [1-4]. For several years, cytogenetics has been used for AML risk classification [5-7]. With the advent of next generation sequencing (NGS), numerous mutated somatic genes have been identified in AML [8-10]. In 2010, the European LeukemiaNet (ELN) incorporated the cytogenetic and molecular characteristics and proposed a classification dividing AML patients into favorable, intermediate, and adverse risk groups, and was revised in 2017 [11, 12]. However, this classification does not completely reflect the heterogeneity within each subgroup, in particular, the biology and prognosis of patients in the “intermediate risk AML” group are highly different. Numerous studies have attempted to improve risk stratification [13-22]. A study from Karolinska Institute validated six of most promising molecular-based models for AML risk stratification [17-21]. As expected, these models combining molecular and clinical data added prognostic value to the current risk classification [23].
The more recent 2017 ELN AML classification includes molecular data, however, the mutation data is restricted to NPM1, CEBPA, TP53, ASXL1, RUNX1 and FLT3-ITD. Other gene mutations also have predictive values for prognosis. For instance, DNMT3A mutation can serve as a poor prognostic factor in AML [24, 25]. In an intermediate risk AML cohort treated at Cleveland Clinic, DNMT3A, U2AF1 and EZH2 mutations were important prognostic factors for overall survival (OS) and relapse-free survival (RFS) [26]. Hou et al. re-stratified 229 AML patients with intermediate cytogenetics into three groups with distinct prognoses based on an 8-gene mutation panel including DNMT3A [27].
Appropriate post-remission therapy (PRT) for intermediate risk AML remains inconclusive [28-30]. We previously reported that allogeneic hematopoietic stem cell transplantation (alloHSCT) was a preferable treatment for intermediate risk AML patients [28]. However, long-term survival is discounted by non-relapse mortality (NRM). To select the patients who would truly benefit from alloHSCT at early stage of the disease is the goal of risk stratification. In this study, we developed and validated a prediction model that combined clinical and molecular profiles. The model improved risk stratification by dividing intermediate risk patients into two groups with distinct prognosis and identified patients for whom alloHSCT significantly reduced relapse rates and prolonged survival.
Materials and methods
Patients
In total, 265 newly diagnosed AML patients (excluding acute promyelocytic leukemia), who were diagnosed and treated in Changhai Hospital from January 2010 to January 2019, were included, and patients who were with Eastern Cooperative Oncology Group (ECOG) performance status >3 (n=3), died from any reasons before or during induction (n=4), without bone marrow samples at diagnosis (n=2) were excluded. At diagnosis, the leukemic DNA of all patients was sampled and cryopreserved for mutation analysis. The median follow-up duration was 34 months (range: 1-114 months). The last follow-up was May 31, 2019.
According to the ELN criteria [12], 62 patients were classified as having a favorable risk (62/265, 23.4%), 127 patients with an intermediate risk (47.9%), and 76 patients with adverse risk (28.7%). Among patients with intermediate risk AML, 121 patients were aged ≤ 65 years (Table 1). To build a prediction model, 110 of 121 patients with clinical outcomes were included (Supplementary Figure S1). Patients with a favorable risk had better survival outcomes than those with an intermediate and adverse risk, respectively (Supplementary Figures S2A-2B). For external validation, we used two independent intermediate risk AML cohorts. Cohort 1 was ELN intermediate risk AML patients from The Cancer Genome Atlas (TCGA), who aged between 14 and 65 and treated with intensive therapy (n=41). Because the relapse data were not available in TCGA database, we used OS data of cohort 1 herein. Cohort 2 was patients aged 14-65 years with ELN-defined intermediate risk AML from Chinese PLA General Hospital (n=99, Supplementary Table S1).
Clincal features of intermediate risk AML patients ≤65 years old.
| Parameters | Number of patients |
|---|---|
| Total cohort | 121 |
| Males, n (%) | 70 (57.9%) |
| Females, n (%) | 51 (42.1%) |
| Median age(range), years | 44 (14-65) |
| Laboratory parameters | |
| WBC count, median (range) ×109/L | 11.6 (0.5-210.0) |
| Platelet count, median (range) ×109/L | 31.0 (4.0-561.0) |
| Hemoglobin count, median (range) ×g/L | 87.5 (42.0-204.0) |
| BM blast, median (range) % | 64.5 (21.0-98.1) |
| LDH, median (range) U/L | 260.0 (61.0-2567.0) |
| ECOG Performance Status at Diagnosis, n (%) | |
| ≤1 | 77 (63.6) |
| 2 | 38 (31.4) |
| 3 | 6 (5.0) |
| Normal karyotype | 63 (52.0) |
| Other | 58 (39.7) |
| CR reached after | |
| Cycle1 (early CR) | 74 (61.2) |
| Cycle2 (late CR) | 23 (19.0) |
| Other | 24 (19.8) |
| Hematopoietic stem cell transplantation, n (%) | |
| No | 75 (61.9) |
| Yes | 46 (38.1) |
| Relapse, n (%) | |
| No | 79 (65.3) |
| Yes | 42 (34.7) |
| Death, n (%) | |
| No | 65 (53.7) |
| Yes | 56 (46.3) |
| Treatment, n (%) | |
| DA | 101 (83.5) |
| D-CAG | 12 (9.9) |
| Other | 8 (6.6) |
| 3-year OS, % | 48.3±5.1 |
| 3-year RFS, % | 36.5±5.0 |
| Follow-up, median (range) months | 35.2 (1.1-102.4) |
Abbreviations: WBC, white blood cell count; BM, bone marrow; LDH, lactate dehydrogenase, MRD, minimal residual disease before cycle1, cycle2 or before post remission chemotherapy; ECOG, Eastern Cooperative Oncology Group, AML, acute myeloid leukemia; FAB, French-American British classification; NOS, non-specific type; CR, complete remission; DA, daunorubicin +cytarabine; D-CAG, decitabine combined with low-dose arabinosylcytosine (Ara-c), aclarubicin and granulocyte colony-stimulating factor (G-CSF); OS, overall survival (with event death whatever the cause); RFS, relapse-free survival (with event death in first CR or relapse).
Institutional databases were retrospectively reviewed to extract demographic, clinical and genetic data. All procedures complied with the tenets of the Helsinki Declaration, and approved by respective Institutional Review Boards. The requirement for written informed consent was waived, owing to the non-interventional and retrospective nature of the study.
High-throughput sequencing, data processing and variant calling workflow sequencing
Genomic DNA was extracted from bone marrow samples of the patients at diagnosis using a customized kit, and library amplification was performed on the basis of the KAPA Hyper Prep Kit, and a 210-gene panel (Acornmed Biotechnology, Supplementary Table S2) was used to capture the target region. Multiplexed libraries were sequenced using 150-bp paired-end runs on Illumina Novaseq. To ensure the data quality, the following criteria were applied to filter the raw variant results: average effective sequencing depth of ≥1,000×on target per sample; allele mutation frequency ≥0.5% for a single nucleotide variation, and insertion or deletion; all reads were filtered with a high mapping quality (≥30) and base quality (≥30); the mutant reads were confirmed in the positive and negative strands.
Bioinformatics analysis
Pre-processing of raw sequences and quality control statistics were performed using an in-house QC package for parameter optimization using FastP (0.19.3). The reads were aligned to the hg19 version of the human genome using the Burrows-Wheeler Alignment tool (BWA, version 0.7.12). PCR duplicates were marked using the MarkDuplicates tool in Picard. IndelRealigner and BaseRecalibrator from the Genome Analysis Toolkit (GATK, version 3.8) were used to realign and recalibrate the results of BWA alignment, respectively. Mutect2 was used to identify the variant calling of single nucleotide variants (SNVs), and insertions or deletions (INDELs). Candidate variants were obtained through background database filtering of normal samples. Pindel was used to detect FLT3-ITD. Quantitative analysis of FLT3-ITD was performed using in-house tools based on machine learning. All variants were annotated using the ANNOVAR software. These variants were further filtered to exclude synonymous variants, as well as SNVs listed as SNPs in the 1000 Genomes Project database (Oct 2014 release), dbSNP142 or our in-house SNP database, but were not reported in COSMIC as hematopoietic or somatic mutations.
Treatment protocols
The treatment protocols were previously reported [28]. In brief, patients achieving complete remission (CR) received four cycles of consolidation with cytarabine (PR-CT group) or proceeded to alloHSCT (alloHSCT group) after at least 2 cycles of consolidation, when a matching donor was available. In the alloHSCT group, patients were conditioned with the myeloablative regimen as previously reported [28, 31]. Anti-thymocyte globulin was administered to patients with an unrelated or mismatched related donor. All transplanted patients received cyclosporine, short-term methotrexate, and mycophenolate mofetil as prophylaxis for graft versus host disease [32].
Definitions
Hematological CR was defined as the presence of <5% of blasts in the bone marrow, the absence of extramedullary disease, an absolute neutrophil count of >1.0×10⁹/L, a platelet (PLT) count of >100×109/L, and independence from red blood cell transfusions. Relapse was defined as the presence of ≥5% blasts in the bone marrow aspirate or peripheral blood, or the presence of extramedullary disease. OS was calculated from the date of the diagnosis until death or the last follow-up, while RFS was measured from the date of CR1 until death, the first relapse, or the last follow-up in continuous CR.
Statistical analysis
Clinical characteristics across groups were compared using the chi-square or a two-sided Fisher's exact test for categorical variables, and the t-test or nonparametric test was used for continuous variables. The Kaplan-Meier method was used to estimate OS and RFS. The log-rank test was performed to compare the survival curves. As the median time from diagnosis to alloHSCT was 123 days, a four-month landmark was set for OS in training cohort. For RFS, as the median time from CR to alloHSCT was 96 days, a three-month landmark was set. Correspondingly, three-month and two-month landmarks were set for OS and RFS in cohort 2, respectively. (Supplementary Table S1) Cumulative incidence of relapse (CIR) and NRM were compared between groups as described previously by Gray with estimates reported by Kalbfleisch and Prentice [33].
Next, we used the Least Absolute Shrinkage and Selector Operation (LASSO) Cox regression model to determine prognostic factors from the variables with P<0.05 in the log-rank tests, which is a robust method widely used to select variables and generate a predictive model [34-36]. The penalty parameter λ controls the amount of shrinkage, and the λ values were chosen by 10-time cross-validations using the 1-SE criteria. A formula was derived to generate the prediction model on the basis of variables selected from the LASSO Cox regression model, and weighted using the Cox regression coefficient. X-tile plots were used to generate the optimum cutoff point for the formula [37]. A nomogram was constructed to determine the mortality risk among individuals. The discrimination of the prediction model was measured using the concordance index (C-index) and areas under the time-dependent receiver-operating characteristics (ROC) curves (AUCs), while the calibration of the prediction model was graphically explored using calibration plots. A bootstrap with 1000 re-samples was used for internal validation.
SAS 9.4 (SAS Institute Inc., Cary, NC, USA) and R 3.5.1 were used for the statistical analysis. The following R packages were used: “rms” to construct the nomogram, “glmnet” to conduct the LASSO, and “survival” and “timeROC” to determine the C-index and AUCs, respectively. A P-value of <0.05 was considered statistically significant.
Results
Treatment outcomes
Among 121 intermediate risk AML patients aged ≤65 years, seventy-four patients (74/121, 61.2%) achieved CR after one cycle of induction, and 23 patients (19.0%) after two cycles of induction. 46 patients (46/121, 38.1%) were treated with alloHSCT, and 75 patients (61.9%) received PR-CT. The 3-year OS and RFS were 48.3±5.1% and 36.5±5.0%, respectively. As expected, survival outcomes were in favor of transplantation arm. (OS: alloHSCT 61.2±8.0%, PR-CT 40.8±6.3%, P=0.044; RFS: alloHSCT 56.1±8.0%, PR-CT 26.5±5.7%, P=0.003; Supplementary Figures S2C-2D).
Forty-two patients (34.7%) relapsed. Among these patients, eight patients relapsed after alloHSCT. The 3-year CIR was significantly lower in patients who received alloHSCT when compared to patients treated with PR-CT (16.53±0.34% vs. 60.07±0.47%, P<0.001, Supplementary Figure S2E). NRM was slightly higher in the alloHSCT group than in the PR-CT group (24.27±0.48% vs. 9.86±0.15%, P=0.080; Supplementary Figure S2F).
Mutation spectrum
In total, 122 mutated genes were detected in 121 intermediate risk AML patients. Among these, 24 genes were mutated in more than 10 patients (Figure 1, Supplementary Table S3, Supplementary Table S4). CEBPA (26.4%) and NRAS (26.4%) mutations were the most common molecular events for the entire cohort, followed by KIT (25.6%), DNMT3A (23.1%) and FLT3-ITD (19.8%) mutations (Supplementary Table S3). The median number of mutated genes per patient was six (range: 0-11), and the median number of mutations was seven (range: 0-14). Median variant allele frequency (VAF) of these mutated genes was 0.42. The median VAFs of genes involved in signaling pathways was the lowest (0.16), suggesting that mutations in signaling pathways were acquired in the relatively late phase of AML pathogenesis (Supplementary Figure S3).
The mutation spectrum of intermediate risk AML patients (n=121). The frequency of mutations detected in ≥ 10 patients. The bars are color-coded in accordance with the common functional classification of pathways assigned to each mutated gene. CEBPA and NRAS mutation frequencies were the highest (CEBPA: n=32, 26.4%; NRAS: n=32, 26.4%), followed by those of KIT (n=31, 25.6%), DNMT3A (n=28, 23.1%), and FLT-ITD (n=24, 19.8%).
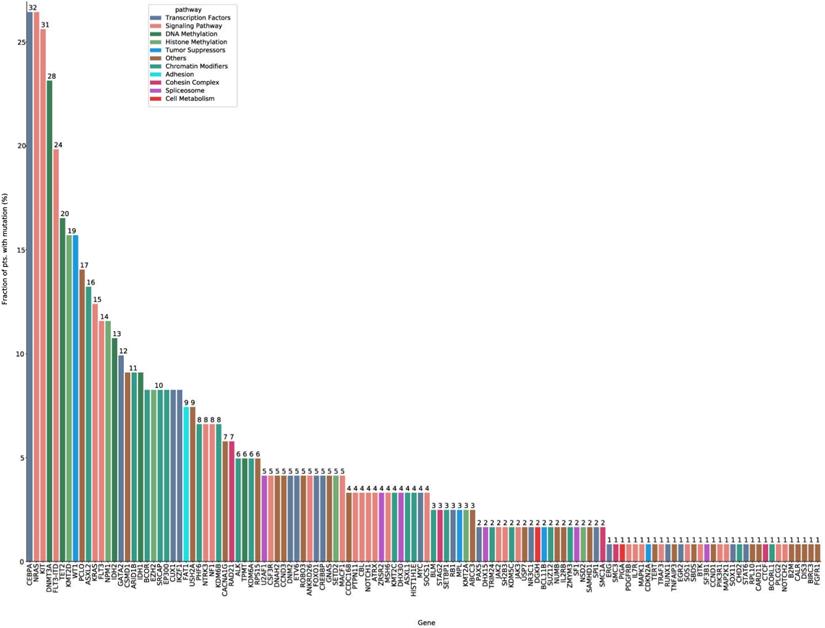
Significant co-occurrence was observed for IKZF1 and CEBPA, EZH2 and CEBPA, GATA2 and CEBPA, FLT3-ITD and DNMT3A, IDH1 and DNMT3A, NPM1 and DNMT3A, ASXL2 and KIT, NPM1 and FLT3-ITD mutations (Supplementary Figure S4).
Correlations between molecular profile and treatment outcomes
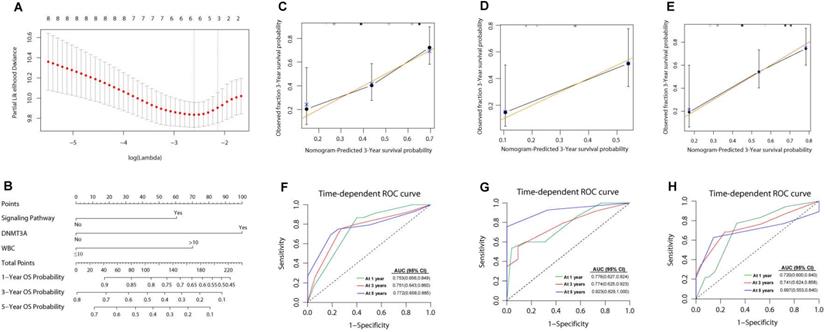
Then we analyzed the impact of several variables on survival outcomes in 121 intermediate risk AML patients who were ≤ 65 years. In univariate analysis, an age of ≥55 years old at diagnosis, treatment modality (PR-CT), WBC count ≥ 10×109/L at diagnosis, and DNMT3A mutation were associated with both reduced OS and an increased risk of relapse (Supplementary Table S5). To perform a multivariate analysis and establish a prognostic prediction model, the LASSO method was adopted for simultaneous shrinkage and variable selection. The optimal tuning parameter identified three variables: mutations in signaling pathway genes, DNMT3A mutation status, and WBC count at diagnosis, as independent factors for OS (Figure 2A, Supplementary Table S6).
Nomogram for patients with intermediate risk AML. (A) Cross-validation for tuning parameter selection in the LASSO model. The solid vertical lines are binomial deviance±standard error (SE). Dotted vertical lines were drawn at the optimal values per the minimum criteria and 1-SE criteria. We plotted the partial likelihood deviance versus log (λ), where λ is the tuning parameter.Herein, a value of ln(λ)=-2.12 was selected through 10-time cross-validations via 1-SE criteria. (B) The nomogram based on data from 110 intermediate risk AML patients to predict individual prognosis. The calibration curves of an alternative nomogram to predict 3-year OS of intermediate risk AML patients (C, n=110), cohort 1 (D, n=41) and cohort 2 (E, n=99). The x-axis represents the predicted survival probability calculated using the nomogram, while the y-axis represents the actual survival probability for patients in the present study. The gold 45-degree line represents the ideal nomogram, while the black line represents the observed nomogram. The AUC values were 0.772-0.753 (F), 0.774-0.923 (G) and 0.697-0.741 (H) in the 110 intermediate risk AML patients, cohort1 and cohort 2, respectively.
Next, we evaluated the characteristics of patients with DNMT3A (DNMT3Amut) mutation in comparison with those with wild type DNMT3A (DNMT3Awt) (Supplementary Table S7). It was found that DNMT3Amut patients were significantly older than DNMT3Awt patients (median: 47 vs. 41 years, P=0.009), and more likely to have higher PLT counts at diagnosis (median: 91.5 vs. 30×109/L, P=0.011). The 3-year OS and RFS for DNMT3Amut patients was 24.0±9.3% and 21.2±9.3%, respectively, and 54.8±5.7% and 46.5±5.9% for DNMT3Awt patients (P=0.001 and P=0.009, respectively; Supplementary Figures S5A-5B). The survival for intermediate risk patients with DNMT3Amut (n=28) was as poor as that of adverse risk AML patients with the same age group (n=65; 3-year OS: 24.0±9.3% vs. 33.3±6.9%, P=0.468; RFS: 20.2±9.3% vs. 39.1±7.4%, P=0.247; Supplementary Figures S5C-5D).
Development of a prediction model combining clinical features and mutation profiles
A nomogram was developed with the risk factors for OS from the multivariate analysis. The risk score was calculated using the following equation: 0.6749 × signaling pathway + 1.1147 × DNMT3A + 0.7829 × WBC; where signaling pathway and DNMT3A equals 1 for the presence and 0 for the absence of a respective feature, and WBC equals 1 if the WBC count was higher than 10×109/L (Figure 2B). The genes in signaling pathways included NRAS, KIT, FLT3-ITD, FLT3, KRAS, NF1, NTRK3, MACF1, ANKRD26, NOTCH1, CSF3R, PTPN11, CBL, MSH6, ATRX, SOCS1, JAK3, JAK2, SH2B3, MAP2K1, PIK3R1, PLCG2, ATM, SOS1, TRAF3, IL7R, MAPK1, BTK, NOTCH2 and PDGFRB. The presence of any mutations in these genes equals 1. The predictive accuracy for OS and RFS calculated using the C-index was 0.703 (95% CI: 0.643-0.763) and 0.681 (95% CI: 0.620-0.741), respectively. In the internal validation, the corrected C-index of OS was 0.697 after bootstraps resampling. Similarly, in the validation calculations, the C-index for OS in cohort 1 was 0.708 (95% CI: 0.620-0.797). In cohort 2, the Cindex of OS and RFS was 0.708 (95% CI: 0.638-0.779) and 0.680 (95%CI: 0.617-0.744), respectively.
The calibration curves of the alternative nomogram to predict the 3-year OS presented in Figures 2C-2E suggested a good fit for the observed nomogram, when compared with the ideal nomogram. The panel displayed an AUC value of 0.753 (95% CI: 0.656-0.849) at 1-year OS, 0.751 (95% CI: 0.643-0.860) at 3-year OS, and 0.772 (95% CI: 0.658-0.885) at 5-year OS (Figure 2F). For validation sets, the panel had high AUC values at these timepoints (cohort 1: 0.776 [95% CI: 0.627-0.924], 0.774 [95% CI: 0.625-0.923], and 0.923 [95% CI: 0.829-1.000], respectively; cohort 2: 0.720 [95% CI: 0.600-0.840], 0.741 [95%CI: 0.624-0.858], and 0.697 [95%CI: 0.553-0.840]; Figure 2G-2H).
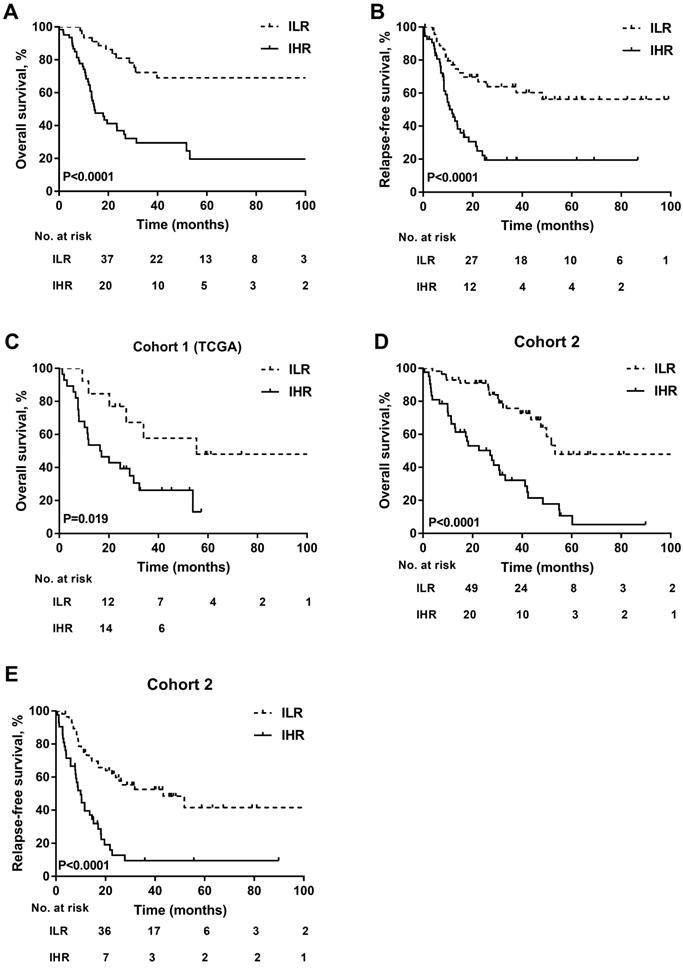
The cut-off point of these risk scores was 1.00. Accordingly, the patients were divided into two subgroups: intermediated-low risk (ILR) group (risk score <1, n=48) and intermediated-high risk (IHR) group (risk score ≥1, n=62). The comparison of clinical characteristics between derivation and validation groups is presented in Table 2. The 3-year OS and RFS in patients with ILR AML were significantly better than those of patients with IHR AML (3-year OS: 72.3±7.2% vs. 29.5±6.6%, P<0.0001, Figure 3A; 3-year RFS: 63.9±7.6% vs. 19.4±6.3%, P<0.0001; Figure 3B). Similar results were obtained in the validation of cohort 1 (ILR vs. IHR: 3-year OS, 57.7±14.7% vs. 26.2±8.7%, P=0.019; Figure 3C) and cohort 2 (ILR vs. IHR: 3-year OS, 75.7±6.6% vs. 32.2±7.8%, P<0.0001; 3-year RFS: 52.5±7.1% vs. 9.6±5.1%, P< 0.0001; Figure 3D-3E). A risk score of ≥1 indicated a risk of 4.43 (95% CI: 2.30-8.52, P<0.0001) for death and 3.10 (95% CI: 1.72-5.59, P<0.0001) for relapse. As shown in Supplementary Figure S6, the prognosis of patients with a risk score of ≥1 was as poor as those of adverse risk AML (n=65, 3-year OS: 29.5±6.6% vs. 33.3±6.9%, P=0.794; 3-year RFS: 19.4±6.3% vs. 39.1±7.4, P=0.294).
Basic characteristics of patients according to the proposed risk score in intermediate risk AML patients (n=110), the cohort 1(n=41) and cohort 2 (n=99).
| Variables | ELN defined intermediate risk AML (n=110) | Cohort 1 (TCGA) (n=41) | Cohort 2 (n=99) | ||||||
|---|---|---|---|---|---|---|---|---|---|
| ILR (risk score < 1) (n=48) | IHR (risk score ≥ 1) (n=62) | P | ILR (n=13) | IHR (n=28) | P | ILR (n=56) | IHR (n=43) | P | |
| Score median (range) | 0.67 (0,0.67) | 1.46 (1.11,2.57) | <0.001 | 0.78 (0, 78) | 1.79 (1.46,2.57) | <0.001 | 0.67 (0, 0.78) | 1.46 (1.11, 2.57) | <0.001 |
| Gender, males, n (%) | 31 (64.58) | 34 (54.84) | 0.303 | 8 (61.54) | 11 (39.29) | 0.184 | 32 (57.14) | 23 (53.49) | 0.717 |
| Females, n (%) | 17 (35.42) | 28 (45.16) | 5 (38.46) | 17 (60.71) | 24 (42.86) | 20 (46.51) | |||
| Age, median (range), years | 44 (16, 61) | 44.5 (14, 65) | 0.290 | 51 (22,63) | 56.5 (25,65) | 0.227 | 44 (19,64) | 43 (15,65) | 0.432 |
| Laboratory parameters | |||||||||
| WBC count, median (range)×109/L | 4.35 (0.54, 207.73) | 25.17 (0.70,210) | <0.001 | 12.1 (0.6,50.3) | 47 (1.20,202.70) | 0.001 | 4.94 (1.10,202.13) | 53.80 (3.60,405.13) | <0.001 |
| PLT, median (range) ×109/L | 30 (4, 268) | 51.5 (5, 561) | 0.139 | NA | NA | NA | NA | NA | |
| Hb, median (g/L, range) | 86 (47, 148) | 88.5 (2, 204) | 0.519 | NA | NA | NA | NA | NA | |
| BM blast, median (range) % | 63 (22, 96.5) | 67 (21,98) | 0.734 | 61 (34,95) | 81.5 (39,100) | 0.025 | 57 (21.5,94.2) | 73.6 (20,94.4) | 0.037 |
| LDH, median (range) U/L | 226 (61, 1370) | 353 (97, 2567) | 0.003 | NA | NA | NA | NA | NA | |
| ECOG at diagnosis, n (%) | 0.595 | NA | NA | NA | NA | NA | NA | ||
| ≤1 | 32 (66.67) | 38 (61.29) | NA | NA | NA | NA | NA | NA | |
| 2 | 15 (31.25) | 20 (32.26) | NA | NA | NA | NA | NA | NA | |
| 3 | 1 (2.08) | 4 (6.45) | NA | NA | NA | NA | NA | NA | |
| DNMT3A mutation | <0.001 | <0.001 | <0.001 | ||||||
| No | 48 (100) | 37 (59.68) | 13 (100) | 11 (39.29) | 56 (100) | 25 (58.14) | |||
| Yes | 0 (0) | 25 (40.32) | 0 (0) | 17 (60.71) | 0 (0) | 18 (41.86) | |||
| Mutations in signaling Pathway | <0.001 | ||||||||
| No | 20 (41.67) | 5 (8.06) | 12 (92.31) | 4 (14.29) | <0.001 | 39 (69.64) | 3 (6.98) | <0.001 | |
| Yes | 28 (58.33) | 57 (91.94) | 1 (7.69) | 24 (85.71) | 17 (30.36) | 40 (93.02) | |||
| Cytogenetics, n (%) | 0.016 | 0.790 | 0.022 | ||||||
| Normal karyotype | 32 (66.67) | 27 (43.55) | 8 (61.54) | 16 (57.14) | 29 (51.79) | 32(74.42) | |||
| Other | 16 (33.33) | 35 (56.45) | 5 (38.46) | 12 (39.29) | 27 (48.21) | 11 (25.58) | |||
| CR reached after | 0.017 | NA | 0.246 | ||||||
| Cycle1 (early CR) | 31 (64.58) | 37 (59.68) | NA | NA | 34 (60.71) | 22 (51.16) | |||
| Cycle2 (late CR) | 13 (27.09) | 8 (12.90) | NA | NA | 15 (26.79) | 10 (23.26) | |||
| Other | 4 (8.33) | 17 (27.42) | NA | NA | 7 (12.50) | 11 (25.58) | |||
| alloHSCT, n (%) | 0.597 | 0.790 | |||||||
| No | 31 (64.58) | 43 (69.35) | 5 (38.46) | 12 (42.86) | 38 (67.86) | 26 (60.47) | 0.446 | ||
| Yes | 17 (35.42) | 19 (30.65) | 8 (61.54) | 16 (57.14) | 18 (32.14) | 17 (39.53) | |||
| Relapse, n (%) | 0.484 | NA | 0.036 | ||||||
| No | 34 (70.83) | 40 (64.52) | NA | NA | 38 (67.86) | 37 (86.05) | |||
| Yes | 14 (29.17) | 22 (35.48) | NA | NA | 18 (32.14) | 6 (13.95) | |||
| 3-year OS (%) | 72.3±7.2 | 29.5±6.6 | <0.0001 | 57.7±14.7 | 26.2±8.7 | 0.019 | 75.7±6.6 | 32.2±7.8 | <0.0001 |
| 3-year RFS (%) | 63.9±7.6 | 19.4±6.3 | <0.0001 | NA | NA | NA | 52.5±7.1 | 9.6±5.1 | <0.0001 |
Abbreviations: WBC, white blood cells; PLT, platelet; Hb, hemoglobin; BM, bone marrow; LDH, lactate dehydrogenase; CR, complete remission; OS, overall survival; RFS, relapse free survival; NA, not available.
Kaplan-Meier curves for OS and RFS for patients withwith different risk score. (A) OS; (B) RFS. The results were validated in cohort 1 (C) and cohort 2 (D-E).
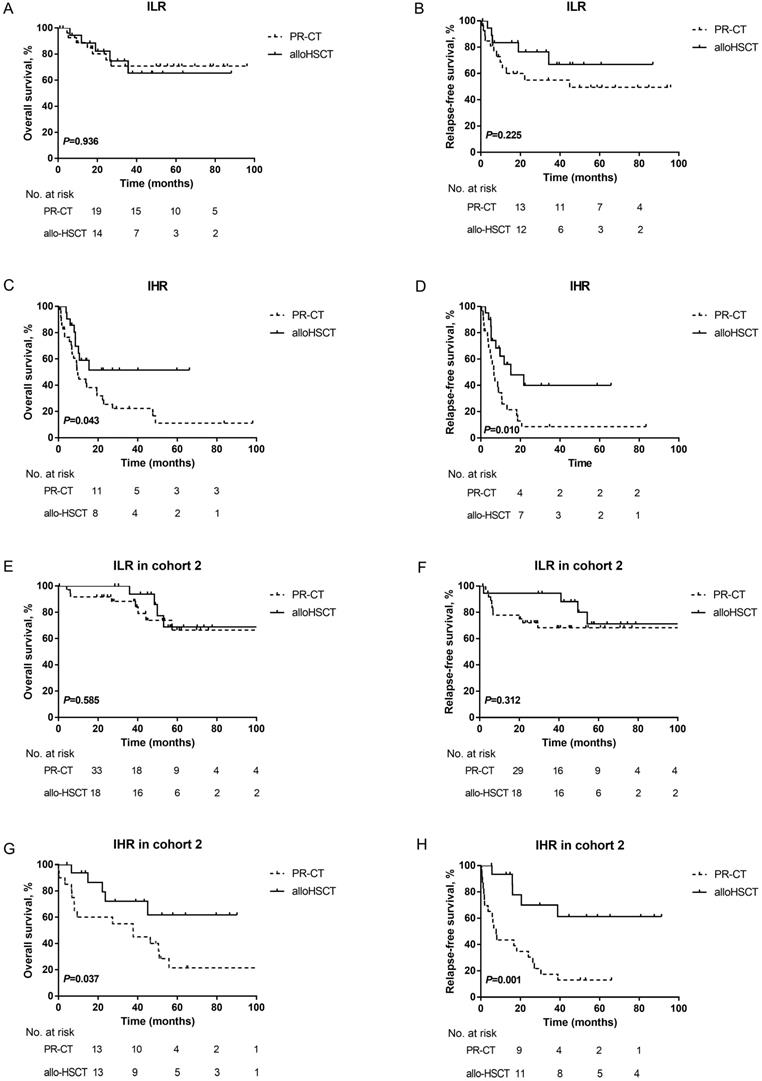
Furthermore, the prognosis of patients in the two subgroups with different PRT was evaluated by landmark analysis. PRT modalities did not influence the survival of ILR patients at the landmark date (3-year OS: PR-CT: 70.8±9.4% vs. alloHSCT: 65.4±13.1%, P=0.936; 3-year RFS: PR-CT: 55.0±10.2% vs. alloHSCT: 66.8±12.8%, P=0.225; Figures 4A-4B). However, patients in the IHR group who underwent alloHSCT had a survival advantage over those treated with PR-CT (3-year OS: 51.6±12.0% vs. 22.3±7.4%, P=0.043; 3-year RFS: 40.0±12.8% vs. 8.6±5.8%, P= 0.010; Figures 4C-4D). Due to the unavailable data in cohort 1, the landmark analysis was only performed in cohort 2. Consistent results were observed (Figure 4 E-4H).
Kaplan-Meier curves for OS and RFS. (A) OS and (B) RFS according to different PRT modalites in ILR group of the training cohort. (C) OS and (D) RFS according to different PRT modalites in IHR group of the training cohort. A landmark was set at 4 months for OS and 3 months for RFS in the training cohort. (E) OS and (F) RFS according to different PRT modalites in ILR group of cohort 2. (G) OS and (H) RFS according to different PRT modalites in IHR group of cohort 2. A landmark was set at 3 months for OS and 2 months for RFS in cohort 2.
Comparison of prediction model
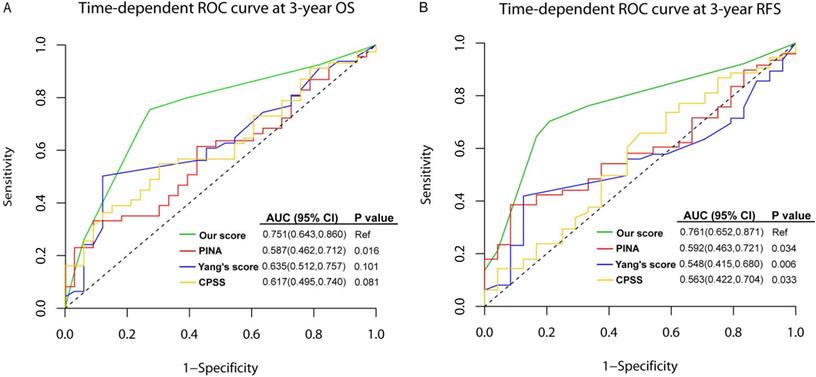
To assess the quality and value of the present prediction model in intermediate-risk AML, we compared the AUCs of this model with other published prediction models in training set, which were PINA score (including NPM1, FLT3-ITD, CEBPA, WBC, age and ECOG) [38], Yang' score system [including age, hematopoietic cell transplantation-comorbidity index (HCT-CI), WBC, Hb, CEBPA, DNMT3A, FLT3-ITD, NPM1, ELN risk status] [39], and CPSS score (including age, FAB, LDH, ECOG, cytogenetics, favorable or unfavorable gene mutations, chromatin-spliceosome) [40]. As shown in Figure 5, the AUC of the present model was higher than other three models in predicting 3-year OS, although only the difference between our model and PINA score was significant [0.751 (95%CI: 0.643-0.860) vs. 0.587 (95%CI: 0.462-0.712), P=0.016]. For 3-year RFS, our model showed statistically higher AUC than others [our score: 0.761 (95%CI: 0.652-0.871), PINA score: 0.592 (0.463-0.721), Yang's score: 0.548 (0.415-0.680), CPSS score: 0.563 (0.422-0.704), all P values <0.05].
The comparison between the present prediction model for intermediate-risk AML and published models in the training set. ROCs of the prediction model for intermediate-risk AML, PINA score, Yang's score system, and CPSS score. (A) time-dependent ROC curve at 3-year OS; (B) time-dependent ROC curve at 3-year RFS.
Discussion
Most studies on the mutation landscape of AML have focused on general AML population, AML with normal cytogenetics, or the comparison of mutation spectrums between young and old patients [26, 41-44]. In the present study, intermediate risk patients were recruited in accordance with the 2017 ELN criteria with strict age limits to increase the homogeneity of the population. It was found that 99.2% (120/121) of AML patients had at least one mutation detected by targeted NGS. Consistent with previous reports [22, 45, 46], only 24 genes were mutated in > 10% patients, with CEBPA and NRAS mutations being the most common (26.4%). In a recent study reported by Wang et al., the frequency of CEBPA mutation in intermediate risk AML was similar to our observations (28.4%) [46]. Previous studies reported a specific association between CEBPA and GATA2 transcription factor mutations was observed in 35%-39% of cases [42, 47]. GATA2 mutation was also detected in 24.2% of patients with CEBPA mutations in our cohort. The frequency of NPM1 mutations in the present cohort (11%) was lower than that reported in other studies [16, 46, 48]. Mutated NPM1 without FLT3-ITD or with FLT3-ITDlow is categorized as favorable risk in 2017 ELN classification, thus decreasing the NPM1 mutation frequency in intermediate-risk group.
The prognostic value of DNMT3A mutations in AML has been previously reported [26, 48, 49]. Young patients with DNMT3A mutation were predisposed to have a lower CR rate after induction therapy [48]. Herein, there were not any strong connections between DNMT3A mutation and CR rate. In a large cohort of AML patients reported by Ley et al., [24] DNMT3A mutation was an independent predictor for inferior survival in patients with intermediate risk cytogenetics. DNMT3A R882H mutation exerts a dramatic effect on transcriptional regulation [50]. In a DNMT3A R882H mutant model, a significant increase in PLT count were observed along with Mpl upregulation. The protein encoded by Mpl, regulates both megakaryocytic progenitors and other myeloid progenitor cells [51]. Consistent with our previous study, DNMT3Amut patients were predisposed to higher PLT counts (≥40×109/L) at diagnosis, and higher PLT counts were associated with poor survival outcome in intermediate risk group [52]. On the other hand, concomitant mutation of NPM1 and FLT-ITD with DNMT3A was observed in our cohort as frequently found in other independent cohorts [53, 54]. Guryanova et al. reported the interactions among the three mutated genes [55]. It was recently reported that simultaneous mutations in the three genes was highly associated with the expression of GPR56, a leukemia stem cell marker [56]. These evidences further demonstrated that the three-gene mutated AML was with very poor outcome.
Long-term survival widely varied among intermediate risk AML patients. The ELN stratified cytogenetically normal AML patients into two risk groups with the mutation profiles of NPM1, FLT3-ITD and CEBPA [11]. The reference models with which our prediction model should be compared are the studies from Patel and Hou's [22, 27]. They developed 18- and 8-gene panels, respectively, to reclassify cytogenetic intermediate-risk AML into favorable, intermediate and unfavorable subgroups. These studies, including Wakita's [57], potentially reduced the proportion of intermediate-risk AML patients, however, these risk profiles were not correlated with treatment modalities. The models identified patients with high risk, but not those for whom alloHSCT significantly prolonged the RFS. We did not observe distinct benefits of alloHSCT for low risk patients within our predictive model. Nevertheless, we demonstrated that alloHSCT would benefit for intermediate risk patients with high risk score, which suggested that high-risk patients benefit substantially from alloHSCT. Tsai et al. recently incorporated long non-coding RNA (IncRNA) expression profiles to refine the 2017 ELN risk classification [58]. The IncRNA scoring system helped dichotomize patients into two groups. However, their intermediate-risk group was a very small cohort (n=29). Additionally, analysis of IncRNA expression was costly and not widely applicable in clinical settings, thus restricting its widespread application. To our knowledge, our study is the first to comprehensively investigate genetic alterations in 2017 ELN intermediate risk AML. Based on the prediction model we proposed, intermediate risk AML patients who can truly benefit from alloHSCT over chemotherapy can be easily and precisely identified upon diagnosis with a higher efficiency as shown in Figure 5.
The risk profile was derived from the retrospective study is the potential limitation to our work. Furthermore, the sizes of the derivation and validation cohorts are relatively small. Further prospective studies with more patients recruited are needed to verify this point.
In conclusion, we described the genetic mutation landscape of young patients with intermediate risk AML. The integration of clinical and molecular profiles would allow evaluation of the possible benefits of alloHSCT for IHR patients who can be rapidly recognized by at diagnosis.
Abbreviations
AML: acute myeloid leukemia; ILR: intermediate low risk; IHR: intermediate high risk; OS: overall survival; RFS: relapse-free survival; C-index: Concordance index; alloHSCT: allogeneic hematopoietic stem cell transplantation; NGS: next generation sequencing; ELN: European LeukemiaNet; PRT: post-remission therapy; NRM: non-relapse mortality; ECOG: Eastern Cooperative Oncology Group; TCGA: The Cancer Genome Atlas; CR: complete remission; PLT: platelet; CIR: cumulative incidence of relapse; LASSO: the Least Absolute Shrinkage and Selector Operation; AUC: areas under the time-dependent receiver-operating characteristics curves; HCT-CI: hematopoietic cell transplantation-comorbidity index; IncRNA: long non-coding RNA.
Supplementary Material
Supplementary figures and tables.
Acknowledgements
This work was supported by National Natural Science Foundation of China (NSFC; 81870143, 81530047, 81770160, 81470321, 81670162, 81970151). X.H. was sponsored by Scholarship from Shanghai Health Bureau (2017BR012). B.W. was supported by Beijing Tsinghua Changgung Hospital Fund (10217C1016). Q.C. was sponsored by Special Clinical Research of Shanghai Health Industry (20184Y0054) and Shanghai Sail Program (19YF1459200).
Data availability statement
The data that support the findings of this study are available from the corresponding author upon reasonable request.
Author Contributions
X.H., B.W., and Q.C. collected and verified patient information, analyzed and interpreted data, and wrote the manuscript; A.H., W.F., L.L. and Y.Z. analyzed and interpreted data; G.T., H.C., X.N., L.G., J.C., L.C., W.Z., and J.Y., performed diagnosis and treatment for patients; S.C. analyzed data; J.W., L.Y. and X.H. designed research, interpreted data, and critically reviewed the manuscript. All authors reviewed and approved the manuscript.
Competing Interests
Author Lixia Liu and Shanbo Cao were employed by the company Acornmed Biotechnology Co. The remaining authors declare that the research was conducted in the absence of any commercial or financial relationships that could be construed as a potential conflict of interest.
References
1. Cheng H, Sun G, Cheng T. Hematopoiesis and microenvironment in hematological malignancies. Cell Regen (Lond). 2018;7:22-6
2. Cheng H, Cheng T. 'Waterloo': when normal blood cells meet leukemia. Curr Opin Hematol. 2016;23:304-10
3. Gong Y, Zhao M, Yang W, Gao A, Yin X, Hu L. et al. Megakaryocyte-derived excessive transforming growth factor beta1 inhibits proliferation of normal hematopoietic stem cells in acute myeloid leukemia. Exp Hematol. 2018;60:40-6 e2
4. Gao A, Gong Y, Zhu C, Yang W, Li Q, Zhao M. et al. Bone marrow endothelial cell-derived interleukin-4 contributes to thrombocytopenia in acute myeloid leukemia. Haematologica. 2019;104:1950-61
5. Grimwade D, Hills RK, Moorman AV, Walker H, Chatters S, Goldstone AH. et al. Refinement of cytogenetic classification in acute myeloid leukemia: determination of prognostic significance of rare recurring chromosomal abnormalities among 5876 younger adult patients treated in the United Kingdom Medical Research Council trials. Blood. 2010;116:354-65
6. Byrd JC, Mrozek K, Dodge RK, Carroll AJ, Edwards CG, Arthur DC. et al. Pretreatment cytogenetic abnormalities are predictive of induction success, cumulative incidence of relapse, and overall survival in adult patients with de novo acute myeloid leukemia: results from Cancer and Leukemia Group B (CALGB 8461). Blood. 2002;100:4325-36
7. Grimwade D, Walker H, Oliver F, Wheatley K, Harrison C, Harrison G. et al. The importance of diagnostic cytogenetics on outcome in AML: analysis of 1,612 patients entered into the MRC AML 10 trial. The Medical Research Council Adult and Children's Leukaemia Working Parties. Blood. 1998;92:2322-33
8. Takahashi S. Current findings for recurring mutations in acute myeloid leukemia. Journal of hematology & oncology. 2011;4:36
9. Gregory TK, Wald D, Chen Y, Vermaat JM, Xiong Y, Tse W. Molecular prognostic markers for adult acute myeloid leukemia with normal cytogenetics. Journal of hematology & oncology. 2009;2:23
10. Kihara R, Nagata Y, Kiyoi H, Kato T, Yamamoto E, Suzuki K. et al. Comprehensive analysis of genetic alterations and their prognostic impacts in adult acute myeloid leukemia patients. Leukemia. 2014;28:1586-95
11. Dohner H, Estey EH, Amadori S, Appelbaum FR, Buchner T, Burnett AK. et al. Diagnosis and management of acute myeloid leukemia in adults: recommendations from an international expert panel, on behalf of the European LeukemiaNet. Blood. 2010;115:453-74
12. Dohner H, Estey E, Grimwade D, Amadori S, Appelbaum FR, Buchner T. et al. Diagnosis and management of AML in adults: 2017 ELN recommendations from an international expert panel. Blood. 2017;129:424-47
13. Mack EKM, Marquardt A, Langer D, Ross P, Ultsch A, Kiehl MG. et al. Comprehensive genetic diagnosis of acute myeloid leukemia by next-generation sequencing. Haematologica. 2019;104:277-87
14. Ng SW, Mitchell A, Kennedy JA, Chen WC, McLeod J, Ibrahimova N. et al. A 17-gene stemness score for rapid determination of risk in acute leukaemia. Nature. 2016;540:433-7
15. Marcucci G, Haferlach T, Dohner H. Molecular genetics of adult acute myeloid leukemia: prognostic and therapeutic implications. J Clin Oncol. 2011;29:475-86
16. Papaemmanuil E, Gerstung M, Bullinger L, Gaidzik VI, Paschka P, Roberts ND. et al. Genomic Classification and Prognosis in Acute Myeloid Leukemia. N Engl J Med. 2016;374:2209-21
17. Bullinger L, Dohner K, Bair E, Frohling S, Schlenk RF, Tibshirani R. et al. Use of gene-expression profiling to identify prognostic subclasses in adult acute myeloid leukemia. N Engl J Med. 2004;350:1605-16
18. Metzeler KH, Hummel M, Bloomfield CD, Spiekermann K, Braess J, Sauerland MC. et al. An 86-probe-set gene-expression signature predicts survival in cytogenetically normal acute myeloid leukemia. Blood. 2008;112:4193-201
19. Marcucci G, Yan P, Maharry K, Frankhouser D, Nicolet D, Metzeler KH. et al. Epigenetics meets genetics in acute myeloid leukemia: clinical impact of a novel seven-gene score. J Clin Oncol. 2014;32:548-56
20. Eppert K, Takenaka K, Lechman ER, Waldron L, Nilsson B, van Galen P. et al. Stem cell gene expression programs influence clinical outcome in human leukemia. Nat Med. 2011;17:1086-93
21. Li Z, Herold T, He C, Valk PJ, Chen P, Jurinovic V. et al. Identification of a 24-gene prognostic signature that improves the European LeukemiaNet risk classification of acute myeloid leukemia: an international collaborative study. J Clin Oncol. 2013;31:1172-81
22. Patel JP, Gonen M, Figueroa ME, Fernandez H, Sun Z, Racevskis J. et al. Prognostic relevance of integrated genetic profiling in acute myeloid leukemia. N Engl J Med. 2012;366:1079-89
23. Wang M, Lindberg J, Klevebring D, Nilsson C, Mer AS, Rantalainen M. et al. Validation of risk stratification models in acute myeloid leukemia using sequencing-based molecular profiling. Leukemia. 2017;31:2029-36
24. Ley TJ, Ding L, Walter MJ, McLellan MD, Lamprecht T, Larson DE. et al. DNMT3A mutations in acute myeloid leukemia. N Engl J Med. 2010;363:2424-33
25. Shivarov V, Gueorguieva R, Stoimenov A, Tiu R. DNMT3A mutation is a poor prognosis biomarker in AML: results of a meta-analysis of 4500 AML patients. Leuk Res. 2013;37:1445-50
26. Saygin C, Hirsch C, Przychodzen B, Sekeres MA, Hamilton BK, Kalaycio M. et al. Mutations in DNMT3A, U2AF1, and EZH2 identify intermediate-risk acute myeloid leukemia patients with poor outcome after CR1. Blood Cancer J. 2018;8:4
27. Hou HA, Lin CC, Chou WC, Liu CY, Chen CY, Tang JL. et al. Integration of cytogenetic and molecular alterations in risk stratification of 318 patients with de novo non-M3 acute myeloid leukemia. Leukemia. 2014;28:50-8
28. Zhang Y, Zhang Y, Chen Q, Tang G, Zhang W, Yang J. et al. Allogeneic hematopoietic stem cells transplantation improves the survival of intermediate-risk acute myeloid leukemia patients aged less than 60 years. Ann Hematol. 2019;98:997-1007
29. Cornelissen JJ, Versluis J, Passweg JR, van Putten WL, Manz MG, Maertens J. et al. Comparative therapeutic value of post-remission approaches in patients with acute myeloid leukemia aged 40-60 years. Leukemia. 2015;29:1041-50
30. Cornelissen JJ, Blaise D. Hematopoietic stem cell transplantation for patients with AML in first complete remission. Blood. 2016;127:62-70
31. Zhang WP, Wang ZW, Hu XX, Chen J, Yang D, Song XM. et al. Preconditioning with fludarabine, busulfan and cytarabine versus standard BuCy2 for patients with acute myeloid leukemia: a prospective, randomized phase II study. Bone Marrow Transplant. 2019;54:894-902
32. Zhang WP, Yang D, Song XM, Ni X, Chen J, Chen L. et al. Allogeneic peripheral blood stem cell transplantation is a promising and safe choice for the treatment of refractory/relapsed acute myelogenous leukemia, even with a higher leukemia burden. Biol Blood Marrow Transplant. 2013;19:653-60
33. Lin DY. Non-parametric inference for cumulative incidence functions in competing risks studies. Stat Med. 1997;16:901-10
34. Zhang JX, Song W, Chen ZH, Wei JH, Liao YJ, Lei J. et al. Prognostic and predictive value of a microRNA signature in stage II colon cancer: a microRNA expression analysis. The Lancet Oncology. 2013;14:1295-306
35. Tibshirani R. Regression shrinkage and selection via the lasso: A retrospective. Journal of the Royal Statistical Society. 2011;73:273-82
36. Smith BA, Sokolov A, Uzunangelov V, Baertsch R, Newton Y, Graim K. et al. A basal stem cell signature identifies aggressive prostate cancer phenotypes. Proceedings of the National Academy of Sciences of the United States of America. 2015;112:E6544-52
37. Camp RL, Dolled-Filhart M, Rimm DL. X-tile: a new bio-informatics tool for biomarker assessment and outcome-based cut-point optimization. Clinical cancer research: an official journal of the American Association for Cancer Research. 2004;10:7252-9
38. Pastore F, Dufour A, Benthaus T, Metzeler KH, Maharry KS, Schneider S. et al. Combined molecular and clinical prognostic index for relapse and survival in cytogenetically normal acute myeloid leukemia. J Clin Oncol. 2014;32:1586-94
39. Ma TT, Lin XJ, Cheng WY, Xue Q, Wang SY, Liu FJ. et al. Development and validation of a prognostic model for adult patients with acute myeloid leukaemia. EBioMedicine. 2020;62:103126
40. Zhou F, Zhou F, Du M, Liu L, Guo T, Xia L. et al. Comprehensive prognostic scoring systems could improve the prognosis of adult acute myeloid leukemia patients. Int J Hematol. 2019;110:575-83
41. Tsai CH, Hou HA, Tang JL, Liu CY, Lin CC, Chou WC. et al. Genetic alterations and their clinical implications in older patients with acute myeloid leukemia. Leukemia. 2016;30:1485-92
42. Konstandin NP, Pastore F, Herold T, Dufour A, Rothenberg-Thurley M, Hinrichsen T. et al. Genetic heterogeneity of cytogenetically normal AML with mutations of CEBPA. Blood Adv. 2018;2:2724-31
43. Prassek VV, Rothenberg-Thurley M, Sauerland MC, Herold T, Janke H, Ksienzyk B. et al. Genetics of acute myeloid leukemia in the elderly: mutation spectrum and clinical impact in intensively treated patients aged 75 years or older. Haematologica. 2018;103:1853-61
44. Wilop S, Chou WC, Jost E, Crysandt M, Panse J, Chuang MK. et al. A three-gene expression-based risk score can refine the European LeukemiaNet AML classification. Journal of hematology & oncology. 2016;9:78
45. Grossmann V, Schnittger S, Kohlmann A, Eder C, Roller A, Dicker F. et al. A novel hierarchical prognostic model of AML solely based on molecular mutations. Blood. 2012;120:2963-72
46. Wang B, Liu Y, Hou G, Wang L, Lv N, Xu Y. et al. Mutational spectrum and risk stratification of intermediate-risk acute myeloid leukemia patients based on next-generation sequencing. Oncotarget. 2016;7:32065-78
47. Greif PA, Dufour A, Konstandin NP, Ksienzyk B, Zellmeier E, Tizazu B. et al. GATA2 zinc finger 1 mutations associated with biallelic CEBPA mutations define a unique genetic entity of acute myeloid leukemia. Blood. 2012;120:395-403
48. Metzeler KH, Herold T, Rothenberg-Thurley M, Amler S, Sauerland MC, Gorlich D. et al. Spectrum and prognostic relevance of driver gene mutations in acute myeloid leukemia. Blood. 2016;128:686-98
49. Hamilton BK, Visconte V, Jia X, Tabarroki A, Makishima H, Hasrouni E. et al. Impact of allogeneic hematopoietic cell transplant in patients with myeloid neoplasms carrying spliceosomal mutations. Am J Hematol. 2016;91:406-9
50. Xu J, Wang YY, Dai YJ, Zhang W, Zhang WN, Xiong SM. et al. DNMT3A Arg882 mutation drives chronic myelomonocytic leukemia through disturbing gene expression/DNA methylation in hematopoietic cells. Proceedings of the National Academy of Sciences of the United States of America. 2014;111:2620-5
51. Rauch PJ, Ellegast JM, Widmer CC, Fritsch K, Goede JS, Valk PJ. et al. MPL expression on AML blasts predicts peripheral blood neutropenia and thrombocytopenia. Blood. 2016;128:2253-7
52. Zhang Y, Gu H, Chen Q, Zhang Y, Cheng H, Yang J. et al. Low Platelet Counts at Diagnosis Predict Better Survival for Patients with Intermediate-Risk Acute Myeloid Leukemia. Acta Haematol. 2019:1-10
53. Cancer Genome Atlas Research N, Ley TJ, Miller C, Ding L, Raphael BJ, Mungall AJ. et al. Genomic and epigenomic landscapes of adult de novo acute myeloid leukemia. N Engl J Med. 2013;368:2059-74
54. Loghavi S, Zuo Z, Ravandi F, Kantarjian HM, Bueso-Ramos C, Zhang L. et al. Clinical features of de novo acute myeloid leukemia with concurrent DNMT3A, FLT3 and NPM1 mutations. Journal of hematology & oncology. 2014;7:74
55. Guryanova OA, Shank K, Spitzer B, Luciani L, Koche RP, Garrett-Bakelman FE. et al. DNMT3A mutations promote anthracycline resistance in acute myeloid leukemia via impaired nucleosome remodeling. Nat Med. 2016;22:1488-95
56. Garg S, Reyes-Palomares A, He L, Bergeron A, Lavallee VP, Lemieux S. et al. Hepatic leukemia factor is a novel leukemic stem cell regulator in DNMT3A, NPM1, and FLT3-ITD triple-mutated AML. Blood. 2019;134:263-76
57. Wakita S, Yamaguchi H, Ueki T, Usuki K, Kurosawa S, Kobayashi Y. et al. Complex molecular genetic abnormalities involving three or more genetic mutations are important prognostic factors for acute myeloid leukemia. Leukemia. 2016;30:545-54
58. Tsai CH, Yao CY, Tien FM, Tang JL, Kuo YY, Chiu YC. et al. Incorporation of long non-coding RNA expression profile in the 2017 ELN risk classification can improve prognostic prediction of acute myeloid leukemia patients. EBioMedicine. 2019;40:240-50
Author contact
![]() Corresponding authors: Jianmin Wang, M.D. or Xiaoxia Hu, M.D. (Department of Hematology, Institute of Hematology, Changhai Hospital, 168 Changhai Road, Shanghai 200433, China. E-mail: jmwangchcom or hu_xiaoxiacom; Tel/ FAX: 86-21-3116-1293), or Li Yu, M.D. (Department of Hematology and Oncology, Shenzhen University General Hospital; Shenzhen University International Cancer Center, Shenzhen University Health Science Center, Xueyuan AVE 1066, Nanshan District, Shenzhen 518000, China. Email: liyu301163.com; Tel/ FAX: 86-0755-21839173).
Corresponding authors: Jianmin Wang, M.D. or Xiaoxia Hu, M.D. (Department of Hematology, Institute of Hematology, Changhai Hospital, 168 Changhai Road, Shanghai 200433, China. E-mail: jmwangchcom or hu_xiaoxiacom; Tel/ FAX: 86-21-3116-1293), or Li Yu, M.D. (Department of Hematology and Oncology, Shenzhen University General Hospital; Shenzhen University International Cancer Center, Shenzhen University Health Science Center, Xueyuan AVE 1066, Nanshan District, Shenzhen 518000, China. Email: liyu301163.com; Tel/ FAX: 86-0755-21839173).