Impact Factor ISSN: 1837-9664

 Global reach, higher impact
J Cancer 2021; 12(16):4971-4984. doi:10.7150/jca.57225 This issue Cite
Research Paper
Integrating 13 Microarrays to Construct a 6 RNA-binding proteins Prognostic Signature for Gastric Cancer patients
Liqiang Zhou*, Qi Zhou*, You Wu, Lin Xin ![]()
Department of General Surgery, The Second Affiliated Hospital of Nanchang University, Nanchang 330006, Jiangxi, China.
*These authors contributed equally to this work.
Received 2020-12-16; Accepted 2021-5-21; Published 2021-6-11
Abstract

Background: It has been confirmed in many tumors that RNA-binding proteins (RBPs) will affect the progress of cancer, but there is still a lack of large-scale research in gastric cancer (GC).
Methods: We obtained 13 microarray mRNA expression profiles of the GPL570 platform, and extracted expression from them after integration to analyze the expression differences of RBPs. Enrichment analysis studies the role of these RBPs in GC. Univariate, Lasso and multivariate Cox regression analysis are used to identify independent prognostic hub RBPs, thereby constructing and verifying a prognostic signature. External data and rt-PCR verified the expression of hub RBPs.
Results: We have identified 51 dysregulated RBPs in GC. Enrichment analysis shows that it can mainly participate in RNA decomposition, modification, processing, etc. and affect the progress of GC. After multiple statistical analysis, six independent prognostic RBPs of GC were determined and a prognostic signature was developed. According to the median risk value, the training cohort was divided into high-risk and low-risk groups. Considering the clinical characteristics, in training, testing, and complete cohorts, the overall survival rate of the high-risk group was significantly lower than that of the low-risk group, which was confirmed by the time-dependent receiver operating characteristic curve. Univariate and multivariate Cox regression analysis of independent prognostic ability of risk score. In addition, we constructed and verified a nomogram based on the prognostic signature, showing accurate prediction performance. rt-PCR and external data verification are consistent with our conclusions.
Conclusion: This study analyzed the overall expression of RPBs in GC and explored its mechanism. A new prognostic signature was developed and verified. A nomogram has also been established and verified, which helps to improve the treatment strategy for GC.
Keywords: gastric cancer, RNA-binding protein, prognosis, signature, nomogram, survival
Introduction
Gastric cancer (GC) is a malignant tumor that originates from epithelial cells of the gastric mucosa. The risk factors include: race, environment, Helicobacter pylori infection, high-salt diet, moldy food, obesity, smoking and other factors. According to the latest statistics, there are 1,033,701 new cases of GC and 782,685 deaths each year, accounting for 5.7% and 8.2% of all tumors, respectively [1]. Reports in 2010 showed that the incidence of gastric cancer in China accounted for as high as 42.6% of the world, and it continues to increase [2]. This is because GC only shows upper abdominal discomfort in the early stage, belching and other symptoms are similar to gastritis, gastric ulcer and other chronic gastric diseases [1, 3]. There are no other specific symptoms, which makes it easy to be ignored, and it is mostly in the late stage when discovered. At present, the main ways to treat GC include: surgery, chemotherapy, and molecular targeted therapy. However, these treatments have the characteristics of easy relapse and drug resistance, which make the 5-year survival rate of GC less than 30% [4]. Due to the late detection of GC, the prognosis is poor. Therefore, it is particularly important to find biomarkers that can accurately predict GC.
RNA-binding proteins are critical regulators of transcriptional and posttranscriptional gene expression possessing multiple biological functions. There are highly species-conservative and play a key role in maintaining homeostasis of gene expression [5, 6]. Multiple evidences suggest that RBPs is involved in various important cellular processes, such as cell transport, localization, development, differentiation and metabolism. In addition, RBP participates in almost every step of post-transcriptional regulation, supervises the formation and function of transcripts, and maintains cell homeostasis, such as RNA shearing, transport, sequence editing, intracellular localization, and translation control by identifying special RNA binding domains and RNA interactions [7, 8]. At present, 1,542 cancer-related RBPs genes have been identified in cancer cells by RNA-seq screening technology [8]. More and more studies have shown that RNA modification mediated by RBPs plays a crucial role in the origin and progression of cancer [9, 10]. They greatly changed the growth and proliferation of tumor cells, avoided immune surveillance, induced angiogenesis and activated metastasis [11]. It has been observed that the expression of RBPs in multiple tumors is dysregulated, and regulate the function of oncogene or tumor suppressor gene [12-15]. Therefore, by revealing the basic mechanism of RBP expression and its potential functions, it helps to find new cancer treatment targets and provide new ideas or methods.
In GC, some reports indicate that the expression of RBPs is unregulated and causes the abnormal expression of its target proteins, and these target proteins are closely related to the prognosis of GC. For example, RBFOX3 is highly expressed in GC and predicts a poor prognosis, which can promote the growth and progression of GC by binding to AP-2β to activate the HTERT signal [16]. In GC stem cells, Lin28B can maintain cell stemness by binding to NRP-1 to activate Wnt/β-catenin signal transduction [17]. In addition, PTBP3 can mediate CAV1 alternative splicing to promote GC metastasis [18]. The above studies suggest that RBPs play an important role in GC, which gives us a preliminary understanding of RBPs in GC. However, there is no report on the overall analysis of research in GC. Therefore, we downloaded 13 microarray GC and healthy tissue expression data from Gene Expression Omnibus (GEO) on the GPL570 platform, and completely analyzed the abnormal expression of RBPs between tumor samples and normal samples. Systematically explored their potential functions and molecular mechanisms. Combined with clinical data, these differentially expressed RBPs are screened for genes with prognostic value, some of which may serve as potential biomarkers for diagnosis and prognosis. In addition, the prognostic signatures constructed based on these prognostic RBPs can accurately predict the development of GC patients and have very good application prospects.
Materials and methods
Identification of differentially expressed RNA binding proteins (DERBPs)
We downloaded the original data containing primary gastric cancer. The 13 microarrays are all on the GPL570 platform, and the gastric cancer samples are all obtained by surgical resection. The data of each microarray is shown in Table 1. The RMA algorithm of the “affy” package is used to extract the expression data of each data set [19], and the “sva” package is used to remove batch effects and merge all data sets [20]. The P value of the differentially expressed genes between the merged data was analyzed by the eBayes test of the “limma” package [21]. The threshold for determining differentially expressed genes (DEGs) is set to |log2 fold change (FC)| ≥ 1.0 and false discovery rate (FDR) <0.05. Based on the RNA-binding protein database RBPTD (http://www.rbptd.com/) [22], we selected differentially expressed RNA-binding proteins (DERBPs) from these DEGs that met the screening criteria.
GEO data sets included in this study
| GEO datasets | Year | Country | Platform | Sample | Tumor (n) | Normal (n) |
|---|---|---|---|---|---|---|
| GSE66229 | 2015 | USA | GPL570 | GC/Normal | 300 | 100 |
| GSE54129 | 2017 | China | GPL570 | GC/Normal | 111 | 21 |
| GSE13911 | 2008 | Italy | GPL570 | GC/Normal | 38 | 31 |
| GSE19826 | 2010 | China | GPL570 | GC/Normal | 12 | 15 |
| GSE79973 | 2016 | China | GPL570 | GC/Normal | 10 | 10 |
| GSE51725 | 2013 | Japan | GPL570 | GC/Normal | 8 | 2 |
| GSE15459 | 2009 | Switzerland | GPL570 | GC | 200 | 0 |
| GSE51105 | 2014 | Australia | GPL570 | GC | 94 | 0 |
| GSE35809 | 2012 | Singapore | GPL570 | GC | 70 | 0 |
| GSE57303 | 2014 | China | GPL570 | GC | 70 | 0 |
| GSE34942 | 2014 | Singapore | GPL570 | GC | 56 | 0 |
| GSE22377 | 2011 | Germany | GPL570 | GC | 43 | 0 |
| GSE38749 | 2012 | Brazil | GPL570 | GC | 15 | 0 |
Gene Ontology (GO) and Kyoto Encyclopedia of Genes and Genomes (KEGG) gene function enrichment analysis
The GO database has three categories, namely Biological Process (BP), Cellular Component (CC) and Molecular Function (MF). Each describes the molecular functions that gene products may perform. The cellular environment and the biological processes involved. The KEGG database helps to research genes and expression information as a whole network. KEGG integrates data on genomes, chemical molecules and biochemical systems, including metabolic pathways (PATHWAY), drugs (DRUG), diseases (DISEASE), gene sequences (GENES), and genomes (GENOME).
Identify prognostic-related RBPs
In order to identify RBPs related to prognosis, we used a series of complete statistical analyses. We first use the “survival analysis” package to perform single-factor Cox regression analysis on the probe ID of DERBPs. Subsequently, based on the results of the previous step, Lasso regression was used for further screening to obtain RBPs that are significantly related to the prognosis of GC patients. In addition, we also used multivariate Cox regression analysis to test the results of Lasso regression and found hub RBPs that can independently predict the prognosis of GC.
Construction and verification of the prognostic model of RBPs
We randomly divide all GC samples into training set (n=248) and validation set (n=244). We first used multivariate Cox regression analysis in the training set to construct a risk ratio model for predicting the prognosis of GC based on hub RBPs. We first used multivariate Cox regression analysis in the training set to construct a risk ratio model for predicting the prognosis of GC based on hub RBPs. We obtained the HR of hub RBPs, the 95% confidence interval of HR and the regression coefficient (β) of the corresponding gene. According to the expression of each gene and the regression coefficient, we can calculate the risk score of each patient according to: Risk score=β1*Exp1+β2*Exp2+βi*Expi. The GC patients were divided into high-risk and low-risk groups based on the median risk score, and Kaplan-Meier survival curve was drawn. The difference in OS between the two groups was analyzed by log-Rank test. We also draw a 5-year ROC curve with “SurvivalROC” package, and calculate the AUC value to evaluate the predictive ability of the predictive model. In addition, we also collected the clinical information of these chips (Supplementary Table 1), and evaluated the risk scores and clinicopathological characteristics of the HR value and P value through single factor and multivariate Cox regression analysis to determine whether the risk value is an independent prognostic factor for GC patients. In order to verify the signature we built, we not only used the validation set to verify the model built using the same method, but also conducted an overall analysis of all GC samples to verify the prognostic model of RBPs.
Bioinformatics analysis
We used the chi-square test to analyze the relationship between the expression of each hub RBPs and the clinicopathological characteristics of patients with GC, and search for the potential mechanisms that affect tumor progression. In addition, in order to study the differences between different risk groups, we first analyzed the relationship between high and low risk groups and clinicopathological characteristics, and secondly, we also used Gene Set Enrichment Analysis (GSEA) to further analyze the overall differences between different risk groups [23]. We use GSEA4.0 based on the molecular signature database (MSigDB), with hallmark7.1 as the control gene and |NSE|> 1, FDR <0.001 as the screening conditions to identify the development mechanism of GC in the high-risk group.
RBPs nomogram construction and verification
We use “rms” to draw a nomogram based on the RBPs prognostic risk model, and obtain the corresponding score by analyzing the expression level of each hub RBPs, and adding the scores of all hub genes to obtain the corresponding total score. By drawing a vertical line on the total score line, we can predict the probability of survival for patients with GC in 1 to 5 years. In addition, in order to test the prediction ability of the nomogram, we draw a 5-year calibration curve by analyzing the survival probabilities of the predicted value and the actual value at the quartile of all GC patients. If the actual value is close to the predicted value, the nomogram has good predictive performance.
Verification of hub RBPs expression and prognosis
In order to verify the prognosis of hub RBPs, we used Kaplan-Meier Plotter (http://kmplot.com/) to verify it in the GSE29272 data set [24]. For the verification of hub RBPs expression, we first use the GEPIA network tool for verification, which contains data from the TCGA and GTEx databases [25]. In addition, we also collected surgical samples from 10 pairs of gastric cancer patients. The process was approved by the patient's informed consent and the ethics committee of the Second Affiliated Hospital of Nanchang University. After homogenizing the clinical samples, the Trizol (Thermo Fisher, USA) method was used to extract total RNA. The obtained RNA was reverse transcribed using reverse transcription kit RR047A (Takara, Japan). ACTB was used as the internal reference gene, and the mRNA expression of hub RBPs was analyzed by fluorescence quantitative PCR using the RR820 kit (Takara, Japan) on the 7900-HT system (Thermo Fisher, USA). The primers used are all synthesized by Shanghai Shenggong Company, and the sequences of all primers are in Supplementary Table 2.
Results
Identify DERBPs
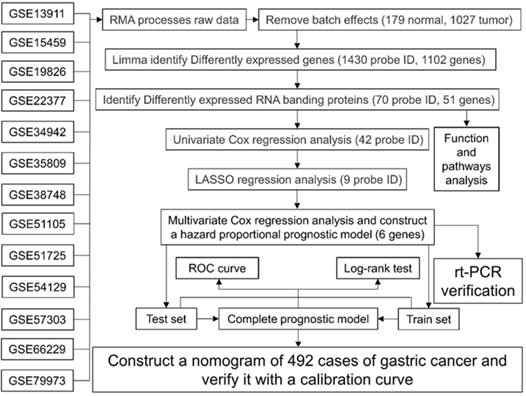
The flowchart of this study is shown in Fig. 1, and the details of the GEO data set included in this study are shown in Table 1. After extracting expression data from each data set, removing batch effects and merging, a single expression data of 179 normal stomach and 1027 GC tissues were obtained. After the difference analysis of the “limma” package, we obtained 1430 probe differences (1102 genes) that met the screening conditions, and used R to draw the heat map and volcano map. After further screening, we got 70 One probe ID (51 genes) representing RBPs, of which 25 RBPs were up-regulated and 26 genes were down-regulated (Table 2).
Work flow chart of this research.
51 differentially expressed RNA binding proteins
| Upregulate RNA binding protein | Down-regulate RNA binding protein | ||||||
|---|---|---|---|---|---|---|---|
| Prob ID | Gene ID | Log2FC | P | Prob ID | Gene ID | Log2FC | P |
| 203820_s_at | IGF2BP3 | 2.83 | 1.46E-68 | 225939_at | EIF4E3 | -1.03 | 9.43E-64 |
| 203819_s_at | IGF2BP3 | 2.62 | 1.52E-61 | 235004_at | RBM24 | -1.03 | 8.64E-27 |
| 201291_s_at | TOP2A | 2.06 | 1.60E-72 | 204422_s_at | FGF2 | -1.04 | 6.92E-28 |
| 201292_at | TOP2A | 1.87 | 4.50E-68 | 219778_at | ZFPM2 | -1.06 | 1.64E-19 |
| 209408_at | KIF2C | 1.65 | 9.88E-89 | 232676_x_at | MYEF2 | -1.06 | 1.08E-28 |
| 211519_s_at | KIF2C | 1.21 | 5.58E-63 | 222771_s_at | MYEF2 | -1.21 | 6.44E-29 |
| 204822_at | TTK | 1.62 | 2.78E-54 | 212328_at | LIMCH1 | -1.07 | 6.54E-42 |
| 202870_s_at | CDC20 | 1.61 | 2.41E-64 | 212327_at | LIMCH1 | -1.10 | 6.49E-50 |
| 223229_at | UBE2T | 1.55 | 1.17E-76 | 208281_x_at | DAZ1 | -1.09 | 6.49E-08 |
| 203358_s_at | EZH2 | 1.53 | 4.76E-76 | 208282_x_at | DAZ1 | -1.32 | 4.91E-09 |
| 221258_s_at | KIF18A | 1.42 | 8.18E-64 | 207909_x_at | DAZ1 | -1.33 | 2.36E-09 |
| 204603_at | EXO1 | 1.40 | 5.88E-87 | 207912_s_at | DAZ1 | -1.78 | 8.96E-11 |
| 221730_at | COL5A2 | 1.39 | 1.21E-65 | 205141_at | ANG | -1.09 | 3.31E-36 |
| 221729_at | COL5A2 | 1.36 | 1.16E-67 | 239587_at | TLR3 | -1.09 | 1.79E-35 |
| 225827_at | AGO2 | 1.33 | 2.04E-119 | 206042_x_at | SNRPN | -1.11 | 1.10E-48 |
| 213310_at | AGO2 | 1.12 | 1.45E-74 | 201522_x_at | SNRPN | -1.15 | 2.00E-51 |
| 211762_s_at | KPNA2 | 1.32 | 5.99E-93 | 218651_s_at | LARP6 | -1.15 | 4.93E-43 |
| 201088_at | KPNA2 | 1.11 | 2.68E-86 | 207158_at | APOBEC1 | -1.19 | 2.60E-22 |
| 204444_at | KIF11 | 1.28 | 4.36E-47 | 213397_x_at | RNASE4 | -1.20 | 1.86E-49 |
| 201926_s_at | CD55 | 1.27 | 2.67E-41 | 205158_at | RNASE4 | -1.23 | 2.58E-43 |
| 1555950_a_at | CD55 | 1.24 | 8.41E-41 | 56256_at | SIDT2 | -1.20 | 2.36E-104 |
| 201925_s_at | CD55 | 1.20 | 1.92E-38 | 205794_s_at | NOVA1 | -1.23 | 2.71E-52 |
| 202503_s_at | KIAA0101 | 1.23 | 2.11E-41 | 201495_x_at | MYH11 | -1.23 | 1.40E-25 |
| 218984_at | PUS7 | 1.20 | 3.75E-90 | 207961_x_at | MYH11 | -1.77 | 2.79E-41 |
| 206632_s_at | APOBEC3B | 1.15 | 6.95E-22 | 228133_s_at | MYH11 | -1.89 | 4.34E-34 |
| 205895_s_at | NOLC1 | 1.14 | 1.08E-98 | 201497_x_at | MYH11 | -2.15 | 3.31E-41 |
| 214697_s_at | PTBP3 | 1.12 | 3.86E-56 | 201496_x_at | MYH11 | -2.44 | 2.35E-40 |
| 201614_s_at | RUVBL1 | 1.10 | 1.36E-101 | 209309_at | AZGP1 | -1.46 | 2.04E-22 |
| 203612_at | BYSL | 1.08 | 3.49E-87 | 221868_at | PAIP2B | -1.57 | 1.20E-111 |
| 213175_s_at | SNRPB | 1.07 | 1.04E-93 | 206160_at | APOBEC2 | -1.60 | 1.09E-102 |
| 203022_at | RNASEH2A | 1.05 | 1.33E-68 | 228802_at | RBPMS2 | -1.65 | 5.45E-51 |
| 225841_at | HENMT1 | 1.04 | 5.88E-49 | 229849_at | WIPF3 | -1.66 | 1.14E-64 |
| 218239_s_at | GTPBP4 | 1.00 | 6.11E-82 | 221667_s_at | HSPB8 | -1.66 | 8.68E-38 |
| - | - | - | - | 227719_at | SMAD9 | -1.76 | 2.84E-50 |
| - | - | - | - | 201785_at | RNASE1 | -1.91 | 1.43E-87 |
| - | - | - | - | 227198_at | AFF3 | -1.92 | 3.17E-74 |
| - | - | - | - | 205200_at | EXOSC7 | -2.21 | 1.62E-98 |
GO and KEGG gene function enrichment analysis
We performed GO and KEGG functional enrichment analysis on these DERBPs. The results suggest that 51 DERBPs are enriched in posttranscriptional regulation of gene expression, mRNA binding, nucleicase activity, regulation of cellular amide metabolic process, catalytic activity, acting on RNA, nuclear acid phosphodiester bond hydrolysis, RNA catabolic process, AU-rich element binding, RNA modification, debtinase activity, mRNA processing, regulation of mRNA metabolic process, DNA modification, ribonucleoprotein complex biogenesis (Table 3). For the KEGG functional enrichment analysis, we did not find an item that met the filter criteria.
Gene Ontology enrichment analysis results of differentially expressed RBPs
| Accession | Ontology | Description | P-value | FDR |
|---|---|---|---|---|
| GO:0010608 | BP | posttranscriptional regulation of gene expression | 1.62E-10 | 2.11E-07 |
| GO:0034248 | BP | regulation of cellular amide metabolic process | 2.51E-07 | 8.20E-05 |
| GO:0090305 | BP | nucleic acid phosphodiester bond hydrolysis | 2.78E-06 | 6.04E-04 |
| GO:0006401 | BP | RNA catabolic process | 9.62E-06 | 1.79E-03 |
| GO:0009451 | BP | RNA modification | 1.09E-04 | 1.43E-02 |
| GO:0006397 | BP | mRNA processing | 1.21E-04 | 1.43E-02 |
| GO:1903311 | BP | regulation of mRNA metabolic process | 1.71E-04 | 1.86E-02 |
| GO:0006304 | BP | DNA modification | 3.43E-04 | 3.44E-02 |
| GO:0022613 | BP | ribonucleoprotein complex biogenesis | 4.07E-04 | 3.79E-02 |
| GO:0003729 | MF | mRNA binding | 3.75E-08 | 2.45E-05 |
| GO:0004518 | MF | nuclease activity | 2.14E-07 | 8.20E-05 |
| GO:0140098 | MF | catalytic activity, acting on RNA | 1.17E-06 | 3.06E-04 |
| GO:0017091 | MF | AU-rich element binding | 8.90E-05 | 1.43E-02 |
| GO:0019239 | MF | deaminase activity | 1.10E-04 | 1.43E-02 |
Identification of prognostic-related hub RBPs
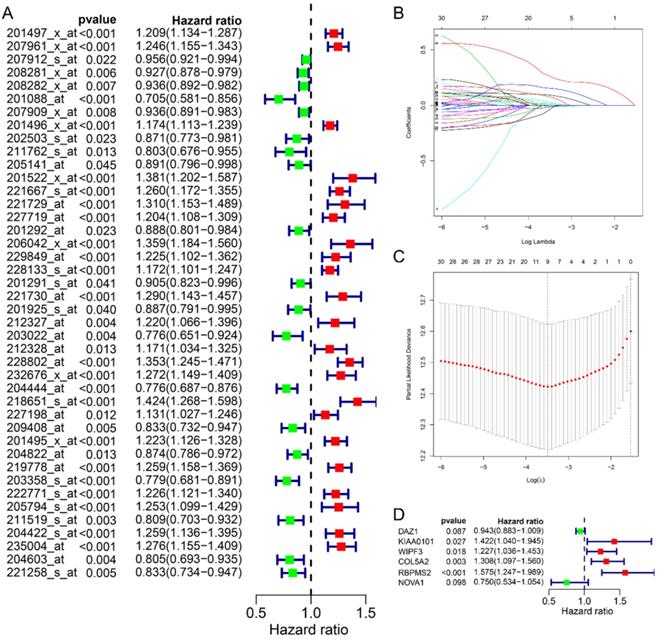
In this study, we collected a total of 492 samples with clinical information for further research. First, the univariate Cox regression analysis was used to analyze the relationship between 70 RBPs probes and prognosis, and the results suggested that 42 RBPs probes were related to the prognosis of GC patients (Fig. 2A). Subsequently, Lasso regression further analyzed the results of the previous step and screened the RBPs probes that are significantly related to the prognosis. We obtained 9 key RBPs probes that are significantly related to the prognosis of GC patients (Fig. 2B and C). In addition, we also used multivariate Cox regression analysis of these 9 key probes, and the results showed that 6 hub RBPs probes (6 RBPs) are independent prognostic factors for patients with GC. Among them, HR>1 includes KIAA0101, WIPF3, COL5A2, RBPMS2, and HR<1 includes DAZ1 and NOVA1.
Identify prognostic-related hub RBPs. A Univariate Cox regression analysis identified prognostic-related RBPs in the entire cohort. B Selecting the best parameters for gastric cancer in LASSO regression analysis. C Multivariate Cox regression analysis identified prognostic-related hub RBPs.
Construction of a prognostic model of GC based on RBPs
We randomly divided 492 GC samples with clinical information into training set (n=248) and test set (n=244). We first assign the corresponding regression coefficients (β) to the 6 hub RBPs in the training set, and then synthesize their expression levels to construct a prognostic model. Each GC patient gets a risk score according to the following formula: Risk score= -0.058 *ExpDAZ1+ 0.3524 *ExpKIAA0101+ 0.2045 *ExpWIPF3 + 0.2687 *ExpCOL5A2 + 0.4544 * EXPRBPMS2 + -0.2872 * ExpNOV1, divided into high-risk group and low-risk group based on the median Risk group. The KM curve indicated that the survival rate of GC patients in the high-risk group was significantly lower than that in the low-risk group (Fig. 3A), and the 5-year AUC was calculated as 0.713 (Fig. 3B). The distribution of survival status indicated that the survival time and number of patients in the high-risk group was lower in the risk group, low (Fig. 3C).
Prognostic analysis of 6-RBPs signature in the train cohort. A The survival analysis of 6-RBPs signature in the testing cohort. B 5-year time-dependent ROC for survival prediction models. C The distribution of risk score, OS and OS status of prognostic 6-RBPs signature in the testing cohort. D Univariate Cox regression analysis on the prognosis of clinicopathological characteristics and risk scores in patients with gastric cancer. E Multivariate Cox regression analysis on the prognosis of clinicopathological characteristics and risk scores in patients with gastric cancer.
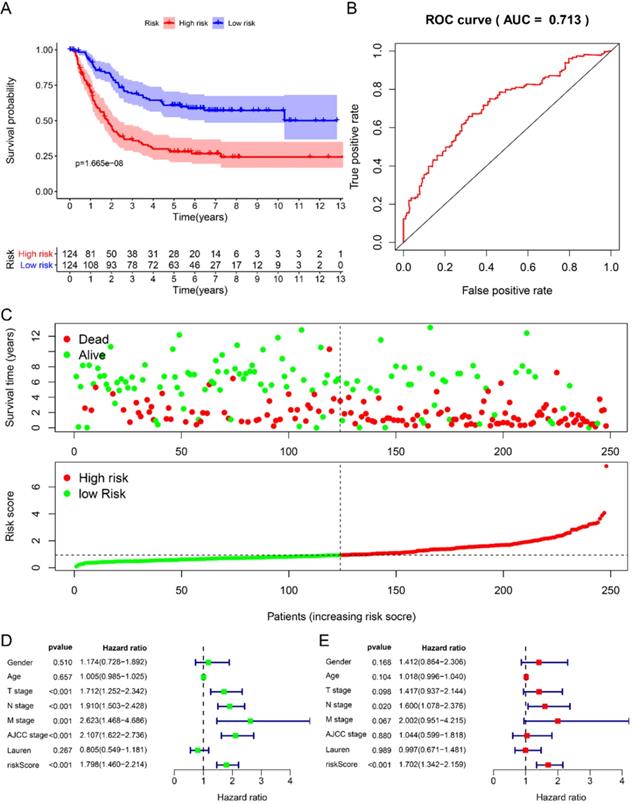
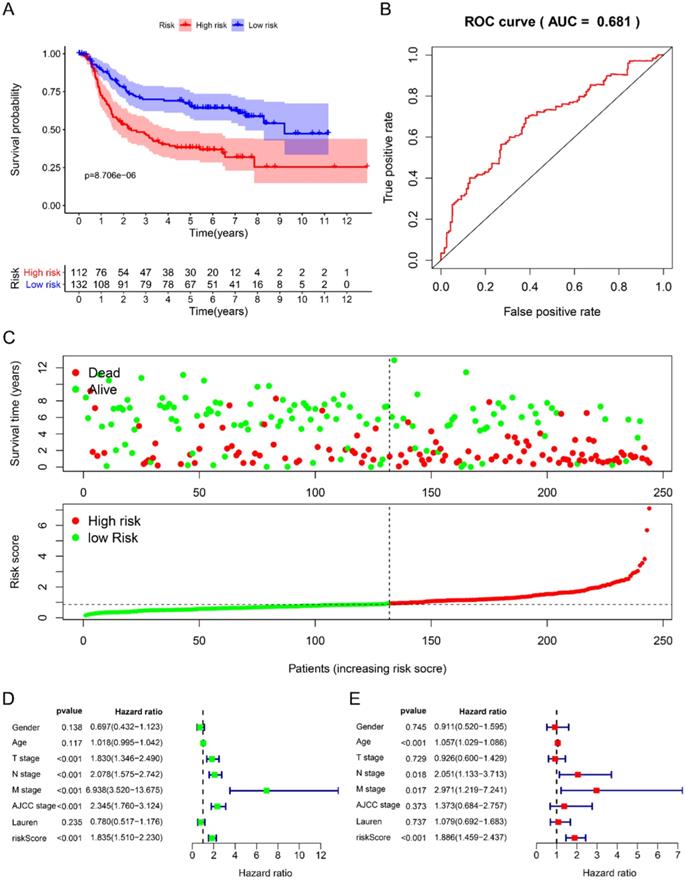
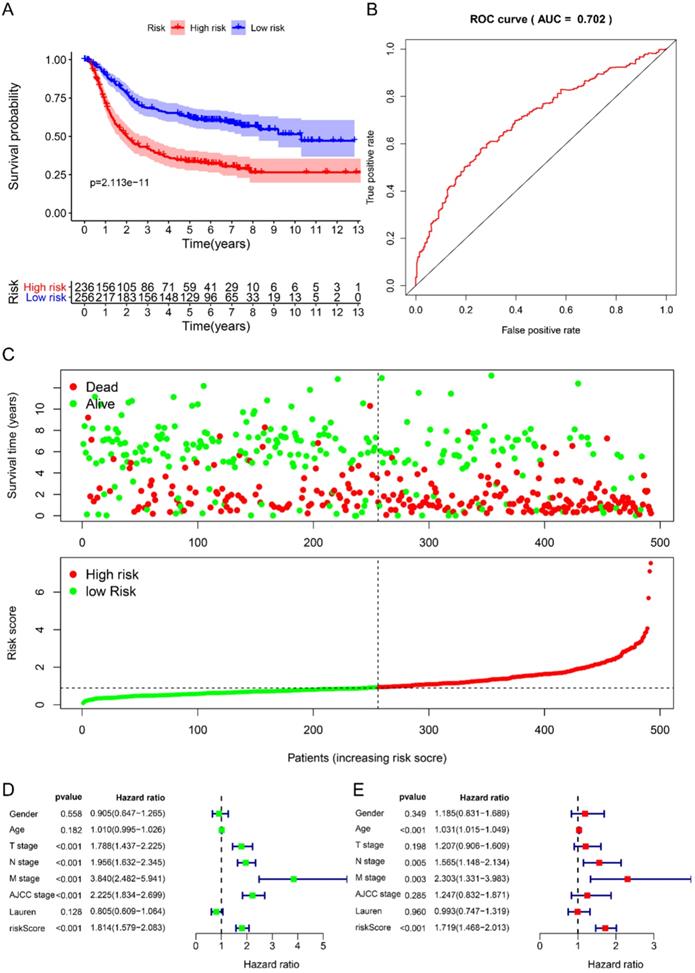
Using univariate Cox to analyze the relationship between risk value and clinicopathological parameters and overall survival (Fig. 3D), T stage [HR=1.712, 95%CI (1.252-2.342)], N stage [HR=1.910, 95%CI (1.503-2.428)], AJCC stage [HR=2.107, 95%CI (1.622-2.736)] and risk value [HR=1.798, 95%CI (1.460-2.214)] are related to prognosis. Multivariate Cox regression analysis further showed (Fig. 3E) that N stage [HR=1.600, 95%CI (1.078-2.376)] and risk score [HR=1.702, 95%CI (1.342-2.159)] are independent of GC patient prognostic factors. There are 112 samples in the high-risk group in the training set and 132 samples in the low-risk group. The KM curve indicates that the high-risk group has a worse prognosis (Fig. 4A), 5-year AUC=0.681 (Fig. 4B), and the survival status diagram is similar to the training set (Fig. 4C). Single-factor Cox regression analysis shows that the risk value of T stage, N stage, M stage, AJCC stage is related to OS (Fig. 4D). Multivariate Cox regression shows that Age, N stage, M stage, and risk values can independently predict the prognosis of GC patients (Fig. 4E). In addition, we combined the training set and the validation set to form a complete prognostic model. The K-M curve showed that the low-risk group had a better prognosis (Fig. 5A), 5-year AUC=0.702 (Fig. 5B), and the survival status chart indicated that the high-risk group had lower survival time and number of survivals (Fig. 5C). Single-factor Cox regression analysis shows that T stage, N stage, M stage, AJCC stage, and risk scores are related to prognosis (Fig. 5D). Multivariate Cox regression analysis suggests that Age, N stage, M stage, and risk values have the ability to independently predict GC (Fig. 5E).
Prognostic analysis of 6-RBPs signature in the test cohort. A The survival analysis of 6-RBPs signature in the testing cohort. B 5-year time-dependent ROC for survival prediction models. C The distribution of risk score, OS and OS status of prognostic 6-RBPs signature in the testing cohort. D Univariate Cox regression analysis on the prognosis of clinicopathological characteristics and risk scores in patients with gastric cancer. E Multivariate Cox regression analysis on the prognosis of clinicopathological characteristics and risk scores in patients with gastric cancer.
Prognostic analysis of 6-RBPs signature in the complete cohort. A The survival analysis of 6-RBPs signature in the testing cohort. B 5-year time-dependent ROC for survival prediction models. C The distribution of risk score, OS and OS status of prognostic 6-RBPs signature in the testing cohort. D Univariate Cox regression analysis on the prognosis of clinicopathological characteristics and risk scores in patients with gastric cancer. E Multivariate Cox regression analysis on the prognosis of clinicopathological characteristics and risk scores in patients with gastric cancer.
Bioinformatics analysis
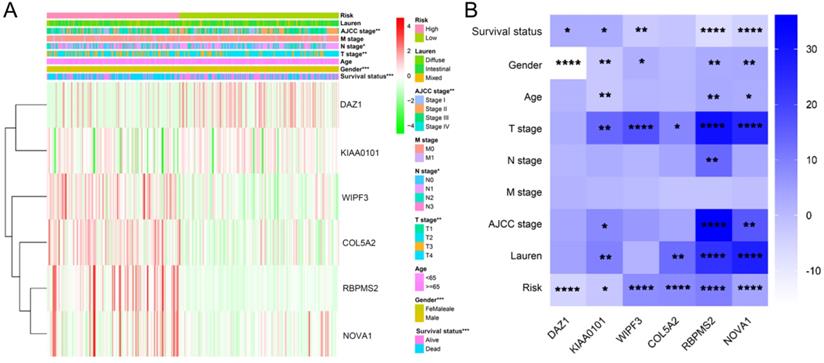
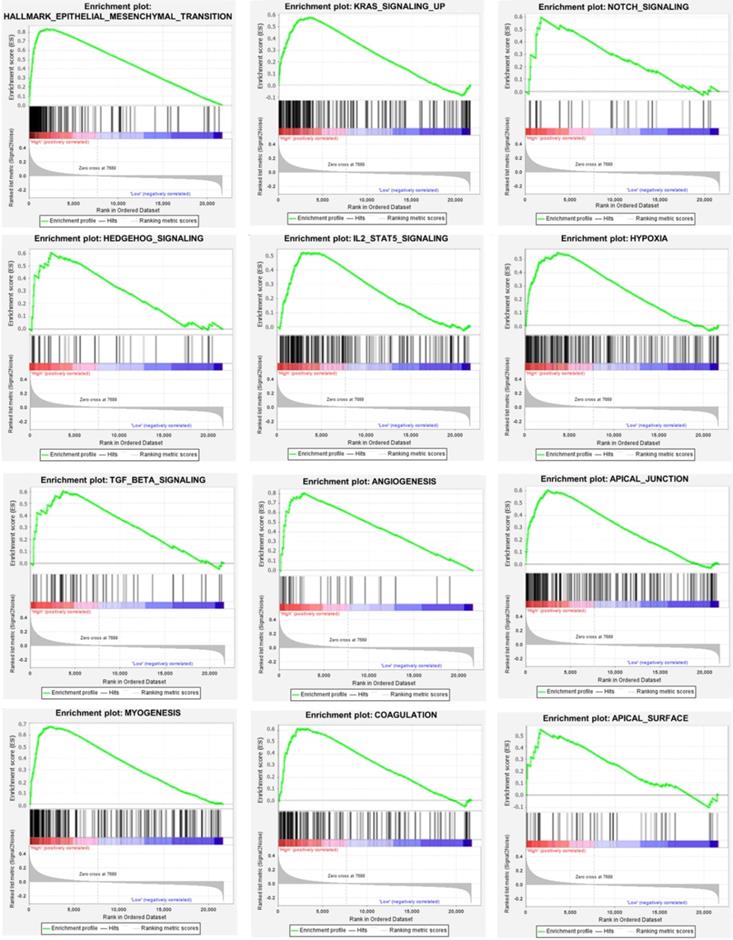
We used the chi-square test to analyze the clinicopathological characteristics and hub RBPs (Fig. 6A), with different risk groups. The results show that AJCC stage, N stage, T stage, Gende and survival status are related to high and low risk values. Among the 6 hub RBPs, RBPMS2, KIAA0101 and NOVA1 are related to 6 or more clinicopathological features, while WIPF3, COL5A2 and DAZ1 are only related to a few clinicopathological features (Fig. 6B). In addition, in order to study the differences between the high and low risk groups of GC patients, we used GSEA to analyze them. The results indicate (Fig. 7) that the samples of the high-risk group were mostly enriched in epithelial-mesenchymal transition, KRAS signal up-regulation, NOTCH signal, TGF-β signal, Angiogenesis, Hedgehog signal, IL2/STAT5 signal, Hypoxia, Myogenesis, Coagulation, UV response UP, Apical junction, APICAL SURFACE.
The relationship between different risk groups and 6hub-RBPs and clinicopathological characteristics. A The relationship between different risk groups and 6hub-RBPs and clinicopathological characteristics. B The relationship between 6-hub RBPs and clinicopathological characteristics.
Gene set enrichment analysis of functional gene set differences between high and low risk groups.
Nomogram drawing and verification
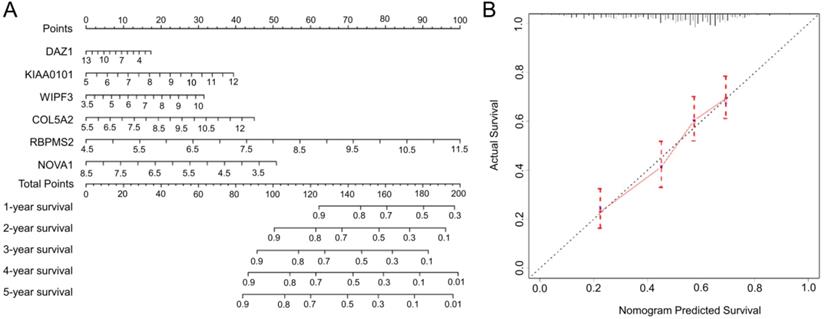
Based on the complete prognosis model we constructed, we established a nomogram to predict the survival rate of GC in 1-5 years (Fig. 8A). By detecting the expression levels of the 6 hub RBPs and obtaining the corresponding scores, the total scores obtained can intuitively predict the short-term survival probability of patients with GC, which will provide clinicians with precise and individualized diagnosis and treatment. In order to verify the accuracy of the nomogram, we calculated the predicted survival rate of 492 samples as the X-axis and the actual survival rate as the Y-axis to draw a 5-year calibration curve. The results indicate (Fig. 8B) that the predicted survival rate of the nomogram is almost equal to the actual survival rate, and the slope of the drawn curve is almost 1, indicating the accurate predictive ability of the nomogram.
The nomogram and the calibration chart are used to predict the OS survival rate of gastric cancer patients. A Nomogram for the prediction of OS at 1-5 year. B Calibration plots for predicting OS at 5 year.
Expression and prognostic verification of hub RBPs
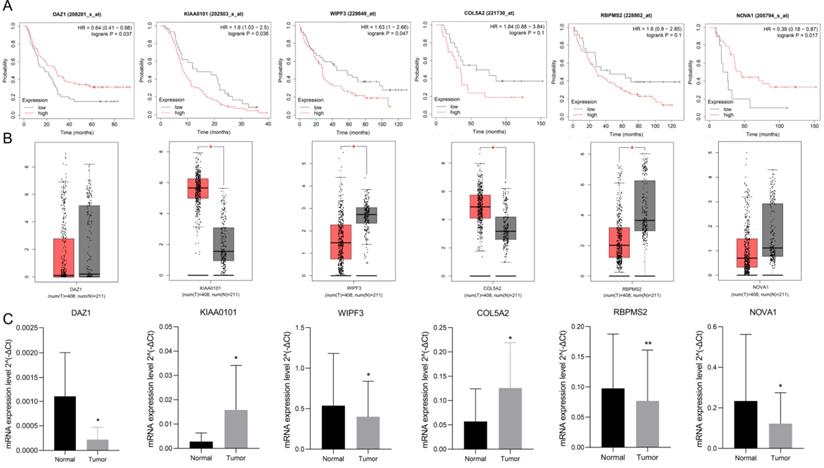
Use K-M plotter to analyze 6 hub gene prognosis prompts (Fig. 9A), high expression of DAZ1, NOVA1 suggests a better prognosis (P<0.05), increased expression of KIAA0101, WIPF3 prompts a poor prognosis (P<0.05), high expression of COL5A2, RBPMS2 It is nega-tively correlated with prognosis, but it is not statistically significant (P=0.1). We used GEPIA to verify the expression of 6 hub RBPs, which contains the se-quencing data of TCGA and GTEx. GEPIA analysis results showed (Fig. 9B) that the expression of KIAA0101 and COL5A2 in GC tissues was significantly higher than that in normal tissues (P<0.05), and the expression of WIPF3 and RBPMS2 in normal tissues were increased (P<0.05). It is worth noting that DAZ1 and NOVA1 were higher in normal tissues, but they were not statistically significant. rt-PCR verified the expression of hubRBPs in 10 pairs of clinical samples. The results showed that (Fig. 9C) DAZ1, WIPF3, RBPMS2, and NOVA1 were low expressed in gastric cancer (P<0.05), and KIAA0101 and COL5A2 were highly expressed (P<0.05).
Verify the prognosis and expression of 6 hub-RBPs. A K-M plotter verifies the prognosis of 6 hub-RBPs. B GEPIA verifies the expression level. C rt-PCR verifies the expression of hub RBPs in clinical samples.
Discussion
RBPs have diverse structures and functions, which regulate several necessary cellular processes. Some of these RBPs are usually expressed and conservatively evolved to maintain the basic processes of the cell. Unregulated expression of RNAs can cause many diseases, including cancer [26]. The abnormality of RBPs has an important influence on tumor phenotype. Such as, mutations in TRBP lead to abnormal expression of miRNA and cancer cell proliferation and differentiation [27]. hnRNPs promote the synthesis of PKM2, thereby enhancing the Warburg effect [28]. RBM38 can inhibit breast cancer metastasis by promoting STARD13-related competitive endogenous RNA network [29]. In GC, only a few literatures have reported that RBPs are dysregulated in GC, there are also reports that RBPs are involved in tumor cell proliferation, metastasis and other phenotypes [16-18]. To this end, we collected 13 GPL570 platform microarray data in the GEO database to systematically identify the differentially expressed RBPs in GC. We have identified 25 up-regulated and 26 down-regulated RBPs. These DERBPs have been reported to be abnormally expressed in GC and play an important role. Among them, EZH2 is up-regulated in GC and is a good prognostic marker, which can inhibit p21 and promote the proliferation of GC [30]. In addition, it can also inhibit FBXO32 epigenetically and contribute to the resistance of GC [31]. However, some studies suggest that it plays a tumor suppressor effect in GC. Research by Zhao et al. suggested that EZH2-mediated epigenetic suppression of EphB3 can down-regulate E-cadherin and vimentin and inhibit GC metastasis [32]. This indicates that the role of RBPs in tumors is heterogeneous.
In order to further understand the possible mechanism of DERBPs affecting the progression of GC, we performed enrichment analysis on 51 RBPs. The results show that these DERBPs are mainly enriched in items such as posttranscriptional regulation of gene expression, mRNA binding, RNA catabolic process, RNA modification, and mRNA processing, some of them have been considered to play an important role in cancer progression. The most important thing in these processes is that RBPs can bind to mRNA, promote its stability, and regulate target gene expression. For example, PTBP3 can regulate the expression of the transcription factor ZEB1 by binding to the 3'UTR of its mRNA, thereby preventing its degradation, inducing the epithelial-mesenchymal transition of breast tumor cells and promoting their invasive growth and metastasis [33]. In addition, RBPs can also promote the degradation of mRNA. IGF2BP3 can accelerate the degradation of EIF4E-BP2 mRNA, thereby promoting the proliferation of cervical cancer cells [34]. RBP-mediated selective splicing is a post-transcriptional regulatory mechanism that contributes to protein diversity and mRNA stability. Abnormal or wrong splicing is the main cause of abnormal function of RBPs, which promotes cancer [35]. Research by Liu et al. showed that SNRPB, the core component of alternative splicing, regulates the alternative splicing of intron 7 and its expression in RAB26 mRNA by activating NMD, mediating tumor growth and metastasis [36]. RBPs also participate in the addition of a poly(A) tail to the 3'end of the mRNA. Among them, alternative polyadenylation is a widespread basic regulatory mechanism in eukaryotes. This process can promote mRNA maturation, stability, nuclear transport and efficient translation. In cancer, research suggests that RBPs can regulate polyadenylation of transcripts, extend poly(A) tails and improve translation efficiency of target genes, and promote tumor progression [37].
In addition, RBPs can not only affect tumor occurrence and development, but also serve as prognostic markers. We performed univariate Cox regression, Lasso regression and multivariate Cox regression analysis on all RBPs probe probes, and obtained 4 RBPs (DAZ1, KIAA0101, WIPF3, COL5A2, RBPMS2, NOVA1) that independently predict the prognosis of GC. In addition, we also analyzed their relationship with clinicopathological characteristics, suggesting that they are closely related to T staging and Lauren classification. There are reports that GC patients with high expression of KIAA0101 showed a high recurrence rate, and accompanied by a poor prognosis, the vitality of GC cells was significantly inhibited after inhibiting its expression [38]. Research by Li et al. suggested that the low expression of NOVA1 in GC is related to lymphatic metastasis and poor prognosis [39]. Inhibiting the expression of NOVA1 in cells promotes the epithelial-mesenchymal transition of GC cells [39, 40]. Although some genes have not been studied in GC, they have been reported in other tumors. Research by Hapkova et al. suggested that RBPMS2 is highly expressed in gastrointestinal stromal tumors, and indicated that it is a new diagnostic marker and a potential cancer treatment target [41]. Among them, some reports are different from our conclusions. COL5A2 is considered to be a favorable prognostic factor for tongue squamous cell carcinoma [42]. However, high expression of this gene in muscle-invasive bladder cancer suggests that the prognosis is poor, and it is closely related to tumor invasion [43, 44]. DAZ1 and WIPF3 have not been reported in tumors, which suggests that they may be new predictive markers and therapeutic targets for GC and require more in-depth research.
Our other result is the construction of a prognostic signature based on RBPs. First we divide the whole cohort into a train set and a test set, build a prognostic signature in the train set based on hub RBPs, and verify it in the test set. The results show that the survival rates of the two concentrated high-risk groups are lower than those of the low-risk group, and the risk scores obtained are independent prognostic factors. The 5-year AUC calculated by the ROC curve is not 0.713 and 0.681, respectively, indicating that the model has broad applicability and accuracy. We also integrated the two sets into a complete prognostic signature, and obtained the same result as the training set after analysis, with a 5-year AUC value of 0.702. We further used the chi-square test to analyze the relationship between clinicopathological characteristics between high and low risk groups. The results show that it is related to AJCC stage, N stage, T stage, gender and survival status. We also used GSEA to analyze the differences in mechanisms affecting GC between high and low risk groups. The results suggest that high-group GC samples are mainly enriched in epithelial-mesenchymal transition (EMT), Kras, Notch, TGF-β, angiogenesis, Hedgehog, IL2-Stat5, hypoxia and other signals. Multiple reports suggest that RBPs mediate the above related signals to affect tumor progression. EMT is a biological process in which differentiated epithelial cells lose their epithelial characteristics and gain mesenchymal cell migration. Tumor cells with this characteristic exhibit high invasiveness and antagonistic ability to radiotherapy and chemotherapy. There are many ways to participate in EMT, including Notch, TGF-β, Hedgehog, Wnt, etc. [45]. It is reported that KIAA0101 can participate in the EMT of liver cancer and induce tumor cell migration and angiogenesis [46]. This may be triggered by the activation of Wnt signal conduction [47-49]. NOVA1 can also participate in EMT transition, which may be triggered by direct binding to β-catenin RNA [50]. Other ways have played an indispensable role in tumor development, so won't repeat them.
We used the nomogram to optimize the prognostic signature and visualized it. Clinicians can detect the expression of hub RBPs and obtain the corresponding total score, which can predict the survival rate of GC patients in 1-5 years. In addition, we drew a calibration chart. Through the calibration chart, we can find that the predicted 5-year survival rate is almost the same as the actual survival rate, which shows the precise predictive ability of the nomogram. To verify the expression and prognosis of hub-RBPs. We verified the expression of hub RBPs in GEPIA, suggesting that their expression trends are consistent with our analysis. The results of K-M plotter suggest that the predictive ability of hub RBPs for GC is consistent with our analysis.
In a word, we have integrated 13 microarrays on the GPL570 platform, and after systematic bioinformatics analysis, we have identified the differentially expressed RBPs in GC and analyzed their potential mechanisms affecting GC. We also constructed a GC prognostic signature based on RBPs, analyzed and verified its good predictive abilityWe also verified the expression of hub RBPs that construct the prognostic signature through external databases and clinical samples. We found that some RBPs are related to the pathogenesis of GC, but there is a lack of relevant literature reports and further studies on GC. This is the limitation of our research.
Supplementary Material
Supplementary tables.
Acknowledgements
National Natural Science Foundation of China, Grant/Award Numbers: 81872480, 81760549, 81560492; Key R&D Program of Jiangxi Province, Grant/Award Numbers: 20203BBG73056; Science and Technology Research Project of Education Department of Jiangxi Province, Grant/Award Number: GJJ180024.
Ethics approval and consent to participate
All gastric cancer clinical samples involved were approved by the patient's informed consent and the ethics committee of the Second Affiliated Hospital of Nanchang University.
Availability of data statement and materials
All data can be obtained from the corresponding author's office and public databases.
Competing Interests
The authors have declared that no competing interest exists.
References
1. Bray F, Ferlay J, Soerjomataram I, Siegel RL, Torre LA, Jemal A. Global cancer statistics 2018: GLOBOCAN estimates of incidence and mortality worldwide for 36 cancers in 185 countries. CA Cancer J Clin. 2018;68:394-424
2. Chen W, Zheng R, Zhang S, Zhao P, Zeng H, Zou X. Report of cancer incidence and mortality in China, 2010. Ann Transl Med. 2014;2:61
3. Van Cutsem E, Sagaert X, Topal B, Haustermans K, Prenen H. Gastric cancer. Lancet. 2016;388:2654-2664
4. Sun P, Xiang J, Chen Z. Meta-analysis of adjuvant chemotherapy after radical surgery for advanced gastric cancer. Br J Surg. 2009;96:26-33
5. Matia-González AM, Laing EE, Gerber AP. Conserved mRNA-binding proteomes in eukaryotic organisms. Nat Struct Mol Biol. 2015;22:1027-1033
6. Anantharaman V, Koonin EV, Aravind L. Comparative genomics and evolution of proteins involved in RNA metabolism. Nucleic Acids Res. 2002;30:1427-1464
7. Wang Z, Li B, Luo Y, Lin Q, Liu SR, Zhang XQ. et al. Comprehensive Genomic Characterization of RNA-Binding Proteins across Human Cancers. Cell Rep. 2018;22:286-298
8. Gerstberger S, Hafner M, Tuschl T. A census of human RNA-binding proteins. Nat Rev Genet. 2014;15:829-845
9. Jang H, Lee H, Kim S, Hong S, Lee WS. RBM3 Expression of RNA-binding Motif Protein 3 and Cold-inducible RNA-binding protein Is Associated with Improved Clinical Outcome in Patients with Colon Cancer. Anticancer Res. 2017;37:1779-1785
10. Busà R, Paronetto M, Farini D, Pierantozzi E, Botti F, Angelini DF. et al. The RNA-binding protein Sam68 contributes to proliferation and survival of human prostate cancer cells. Oncogene. 2007;26:4372-4382
11. Tavano L, Mazzotta E, Muzzalupo R. Nanovesicular Formulations for Cancer Gene Therapy. Curr Pharm Des. 2017;23:5327-5335
12. Lukong K, Chang K, Khandjian E, Hentze MW. RNA-binding proteins in human genetic disease. Trends Genet. 2008;24:416-425
13. Neelamraju Y, Hashemikhabir S, Janga S. The human RBPome: from genes and proteins to human disease. J Proteomics. 2015;127:61-70
14. Darnell R. RNA regulation in neurologic disease and cancer. Cancer Res Treat. 2010;42:125-129
15. Lujan DA, Ochoa JL, Hartley RS. Cold-inducible RNA binding protein in cancer and inflammation. Wiley Interdiscip Rev RNA. 2018;92:e1462
16. Luo C, Zhu X, Luo Q, Bu F, Huang C, Zhu J. et al. RBFOX3 Promotes Gastric Cancer Growth and Progression by Activating HTERT Signaling. Front Oncol. 2020;10:1044
17. Wang X, Hu H, Liu H. RNA binding protein Lin28B confers gastric cancer cells stemness via directly binding to NRP-1. Biomed Pharmacother. 2018;104:383-389
18. Liang X, Chen W, Shi H. PTBP3 contributes to the metastasis of gastric cancer by mediating CAV1 alternative splicing. Cell Death Dis. 2018;9:569
19. Gautier L, Cope L, Bolstad B, Irizarry RA. affy-analysis of Affymetrix GeneChip data at the probe level. Bioinformatics. 2004;20:307-315
20. Leek J, Johnson W, Parker H, Jaffe AE, Storey JD. The sva package for removing batch effects and other unwanted variation in high-throughput experiments. Bioinformatics. 2012;28:882-883
21. Ritchie M, Phipson B, Wu D, Hu Y, Law CW, Shi W. et al. limma powers differential expression analyses for RNA-sequencing and microarray studies. Nucleic Acids Res. 2015;43:e47
22. Li K, Guo Z, Zhai X, Yang XX, Wu YS, Liu TC. RBPTD: a database of cancer-related RNA-binding proteins in humans. Database 2020. 2020
23. Subramanian A, Tamayo P, Mootha VK, Mukherjee S, Ebert BL, Gillette MA. et al. Gene set enrichment analysis: A knowledge-based approach for interpreting genome-wide expression profiles. Proc Natl Acad Sciences U S A. 2005;102:15545-15550
24. Szász A, Lánczky A, Nagy Á, Förster S, Hark K, Green JE. et al. Cross-validation of survival associated biomarkers in gastric cancer using transcriptomic data of 1,065 patients. Oncotarget. 2016;7:49322-49333
25. Tang Z, Li C, Kang B, Gao G, Li C, Zhang Z. GEPIA: a web server for cancer and normal gene expression profiling and interactive analyses. Nucleic Acids Res. 2017;45:W98-W102
26. Nyati KK, Agarwal RG, Sharma P, Kishimoto T. Arid5a Regulation and the Roles of Arid5a in the Inflammatory Response and Disease. Front Immunol. 2019;10:2790
27. Lin S, Gregory RI. MicroRNA biogenesis pathways in cancer. Nat Rev Cancer. 2015;15:321-333
28. Clower CV, Chatterjee D, Wang Z, Cantley LC, Vander Heiden MG, Krainer AR. The alternative splicing repressors hnRNP A1/A2 and PTB influence pyruvate kinase isoform expression and cell metabolism. Proc Natl Acad Sci U S A. 2010;107:1894-1899
29. Li XX, Shi L, Zhou XJ, Wu J, Xia TS, Zhou WB. The role of c-Myc-RBM38 loop in the growth suppression in breast cancer. J Exp Clin Cancer Res. 2017;36:49
30. Xu J, Wang Z, Lu W, Jiang H, Lu J, Qiu J. EZH2 promotes gastric cancer cells proliferation by repressing p21 expression. Pathology Res Prac. 2019;215:152374
31. Wang C, Li X, Zhang J, Chen H, Hu J. EZH2 contributes to 5-FU resistance in gastric cancer by epigenetically suppressing FBXO32 expression. Onco Targets Ther. 2018;11:7853-7864
32. Zhao K, He J, Wang Y, Fan Y, Fang N, Qian J. et al. EZH2-mediated epigenetic suppression of EphB3 inhibits gastric cancer proliferation and metastasis by affecting E-cadherin and vimentin expression. Gene. 2019;686:118-124
33. Hou P, Li L, Chen F, Liu H, Li J, Bai J. et al. PTBP3-Mediated Regulation of ZEB1 mRNA Stability Promotes Epithelial-Mesenchymal Transition in Breast Cancer. Cancer Res. 2018;78:387-398
34. Mizutani R, Imamachi N, Suzuki Y, Yoshida H, Tochigi N, Oonishi T. et al. Oncofetal protein IGF2BP3 facilitates the activity of proto-oncogene protein eIF4E through the destabilization of EIF4E-BP2 mRNA. Oncogene. 2016;35:3495-3502
35. Fu XD, Ares M Jr. Context-dependent control of alternative splicing by RNA-binding proteins. Nat Rev Genet. 2014;15:689-701
36. Liu N, Wu Z, Chen A, Wang Y, Cai D, Zheng J. et al. SNRPB promotes the tumorigenic potential of NSCLC in part by regulating RAB26. Cell Death Dis. 2019;10:667
37. D'Ambrogio A, Nagaoka K, Richter JD. Translational control of cell growth and malignancy by the CPEBs. Nat Rev Cancer. 2013;13:283-290
38. Zhu K, Diao D, Dang C, Shi L, Wang J, Yan R. et al. Elevated KIAA0101 expression is a marker of recurrence in human gastric cancer. Cancer Sci. 2013;104:353-359
39. Li K, Zhu X, Chen X, Wang X. MicroRNA-27a-3p promotes epithelial-mesenchymal transition by targeting NOVA alternative splicing regulator 1 in gastric cancer. Mol Med Rep. 2020;21:1615-1622
40. Shen B, Zhang Y, Yu S, Yuan Y, Zhong Y, Lu J. et al. MicroRNA-339, an epigenetic modulating target is involved in human gastric carcinogenesis through targeting NOVA1. FEBS Lett. 2015;589:3205-3211
41. Hapkova I, Skarda J, Rouleau C, Thys A, Notarnicola C, Janikova M. et al. High expression of the RNA-binding protein RBPMS2 in gastrointestinal stromal tumors. Exp Mol Pathol. 2013;94:314-321
42. Chen H, Tseng Y, Shu C, Weng TJ, Liou HH, Yen LM. et al. Differential clinical significance of COL5A1 and COL5A2 in tongue squamous cell carcinoma. J Oral Pathol Med. 2019;48:468-476
43. Meng X, Shi M, Zeng Z, Chen C, Liu TZ, Wu QJ. et al. The Role of COL5A2 in Patients with Muscle-Invasive Bladder Cancer: A Bioinformatics Analysis of Public Datasets Involving 787 Subjects and 29 Cell Lines. Front Oncol. 2018;8:659
44. Zeng X, Liu X, Liu T, Wang XH. et al. The clinical significance of COL5A2 in patients with bladder cancer: A retrospective analysis of bladder cancer gene expression data. Medicine. 2018;97:e0091
45. Derynck R, Weinberg R. EMT and Cancer: More Than Meets the Eye. Dev Cell. 2019;49:313-316
46. Zhang T, Guo J, Gu J, Chen K, Wang Z, Li H. et al. KIAA0101 is a novel transcriptional target of FoxM1 and is involved in the regulation of hepatocellular carcinoma microvascular invasion by regulating epithelial-mesenchymal transition. J Cancer. 2019;10:3501-3516
47. Wang X, Jung Y, Jun S, Lee S, Wang W, Schneider A. et al. PAF-Wnt signaling-induced cell plasticity is required for maintenance of breast cancer cell stemness. Nat Commun. 2016;7:10633
48. Chen H, Xia B, Liu T, Lin M, Lou G. KIAA0101, a target gene of miR-429, enhances migration and chemoresistance of epithelial ovarian cancer cells. Cancer Cell Int. 2016;16:74
49. Jung H, Jun S, Lee M, Kim HC, Wang X, Ji H. et al. PAF and EZH2 induce Wnt/β-catenin signaling hyperactivation. Mol Cell. 2013;52:193-205
50. Tang S, Zhao Y, He X, Zhu J, Chen S, Wen J. et al. Identification of NOVA family proteins as novel β-catenin RNA-binding proteins that promote epithelial-mesenchymal transition. RNA Bio. 2020;17:881-891
Author contact
![]() Corresponding author: Lin Xin, M.D., Ph.D., Department of General Surgery, The Second Affiliated Hospital of Nanchang University, Nanchang 330006, Jiangxi, China. E-mail: xlyxbscom.
Corresponding author: Lin Xin, M.D., Ph.D., Department of General Surgery, The Second Affiliated Hospital of Nanchang University, Nanchang 330006, Jiangxi, China. E-mail: xlyxbscom.