Impact Factor ISSN: 1837-9664

 Global reach, higher impact
J Cancer 2021; 12(16):5066-5075. doi:10.7150/jca.45648 This issue Cite
Research Paper
Evaluation of the value of Preoperative Sialic Acid Levels in Diagnosis and Localization of Urothelial Tumors
Dongshan Chen1*, Dawei Li1*, Zhanwu Cui2, Cong Zhang1, Zhao Zhang1, Lei Yan1 ![]()
1. Department of Urology, Qilu Hospital of Shandong University, Wenhuaxi Road 107#, Jinan, 250012, P.R. China.
2. Department of Urology, Second Traditional Chinese Medicine Hospital of Dezhou City, Zhongxing Road 245#, Dezhou , 253500, P.R. China.
*These authors contributed equally to the manuscript.
Received 2020-3-4; Accepted 2021-5-26; Published 2021-6-16
Abstract

Objective: To explore SA levels in the serum of urothelial tumor patients and their correlation with clinical pathological features and localization.
Materials and Methods: Our research retrospectively collected data from 591 patients with urothelial tumors between July 2014 and April 2018. The SA levels in the serum of urothelial tumor patients and their correlation with clinical pathological features and localization were investigated. Univariate and multivariate logistic regression analyses were further performed to identify independent associations.
Results: The levels of SA were significantly associated with the malignant degree (tumor grade and infiltration) of bladder cancer and tumor localization (all p < 0.05). The multivariate logistic regression model showed that SA levels were independently associated with the presence of high-grade urothelial carcinoma (BUC: HR = 1.941, UTUC: HR = 3.820, all p <0.05) and upper urinary tract urothelial carcinoma (HR = 2.047, p < 0.05). Finally, we validated the diagnosis and localization value of SA in an independent cohort from another institutions.
Conclusions: Elevated serum SA levels are an independent predictor of high-grade urothelial carcinoma and upper urinary tract urothelial carcinoma, indicating that SA levels may be a potential biomarker for the diagnosis, prognosis and localization of urothelial tumors.
Keywords: sialic acid, urothelial tumor, diagnosis, localization
Introduction
Urothelial carcinoma (UC) is the ninth most common cancer and is the thirteenth most common cause of death due to cancer, accounting for approximately 430,000 new cases and 165,000 mortalities globally [1, 2]. In China, there are 80,500 incident cases and 32,900 mortalities caused by UC each year [3]. UC is the most frequent type of cancer of the bladder (BUC) and upper urinary tract [4], while the morbidity and mortality of UC have gradually increased over recent years. Therefore, early detection and diagnose have an important significance to the prognosis and quality of life of patients with UC. Cytological experiments and biopsies under an ureteroscope and a bladder scope are currently the two main means of UC early detection and diagnosis [5]. However, use of the ureteroscope and bladder scope not only is invasive but also has a high rate of missed diagnosis, especially for UC in situ and upper tract urothelial carcinoma (UTUC) [5, 6]. Therefore, the search for a specific, highly sensitive marker, that can predict the biological behavior of UC, as an index for predicting tumor progression and metastasis, in order to guide clinical diagnosis and therapy is particularly important.
Sialic acid (SA) is a monosaccharide with a nine-carbon backbone that occupies the terminal position on macromolecules and cell membranes [7]. SA is involved in autoimmune diseases, microbial invasion, virulence pathogenesis and tumor growth [8]. Malignant cells often have an increased concentration of SA on the surface and secrete SA to increase the concentration in blood [9]. In previous studies, it was found that the lipid-bound subfraction of SA concentration was of limited value for detecting early stages of genitourinary malignancies [10]. However, small sample sizes, no further analyses of multiple factors, no assessment of localization values and no validated cut-off values existed in these studies. Therefore, the present study aimed to assess SA levels in patients with UC to determine the pathogenesis and development of UC.
Materials and methods
Patients
From July 2014 to April 2018, the clinical data of 591 patients with urothelial carcinoma who underwent surgical treatment in the Department of Urology, Qilu Hospital of Shandong University, were retrospectively analyzed. Among 591 UC patients, 406 patients were diagnosed with bladder tumors, 99 with ureteral tumors and 86 with renal pelvic tumors. Additionally, a total of 322 consecutive UC patients (including 185 BUC patients, 77 ureteral carcinoma patients and 60 renal pelvis carcinoma) treated at Shandong Provincial Hospital between July 2017 to Mar 2021 were used for validation set.
The inclusion criteria for the patients enrolled in the study were as follows:
- Patients with a pathological diagnosis of urothelial tumors, including bladder tumors, ureteral tumors and renal pelvic tumors, and patients who underwent surgical treatment at Qilu Hospital of Shandong University;
- Patients with complete clinical and pathological data, such as preoperative blood parameters, postoperative pathological results and other basic information;
- Patients who did not undergo any adjuvant treatments, such as radiotherapy or chemotherapy, before surgery.
The exclusion criteria for the patients enrolled in the study were as follows:
- The coexistence of any other malignant tumor;
- A pathological diagnosis of nonurothelial tumors;
- A history of bladder urothelial tumors and upper tract urothelial tumors;
- A history of cerebral infarction and cerebral hemorrhage within the last 1 month or myocardial infarction within the latest 6 months;
- The administration of procoagulant or anticoagulant drugs within the past 2 weeks;
- The presence of obvious infection or inflammation.
Data collection
Clinical data including patient age at the time of diagnosis, sex, smoking history, routine blood examination results (white blood cell count, platelet count, plasma fibrinogen level, etc.), and tumor characteristics were obtained from the electronic patient records at our institution.
SA measurement
Before any clinical treatment, 5 mL venous blood samples from patients after 8 hours of fasting were collected for the evaluation of SA levels. Blood samples are stored in tubes containing clotting activators and gels. The Roche Cobas 8000 automatic analyzer was used for the determination of SA in serum. SA levels of 45.6-75.4 mg/dL were defined as normal.
Statistical analysis
The Kolmogorov-Smirnov test was adopted to assess whether the level of SA conformed to a normal distribution, and the values were presented as the mean ± standard deviation (SD). Student's t-test and one-way ANOVA were used for normally distributed data; if the data distribution was not normal, the Mann-Whitney U-test and Kruskal-Wallis H-test were employed for the nonparametric analysis. Data were analyzed and processed using the Statistical Package for Social Sciences version 22.0 (SPSS Inc., Chicago, IL, USA). P values < 0.05 in two-tailed tests were considered statistically significant.
Results
Clinicopathological characteristics of patients
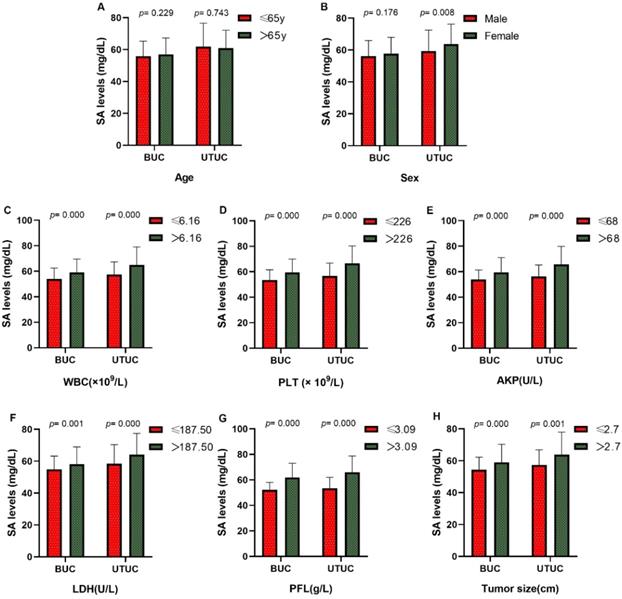
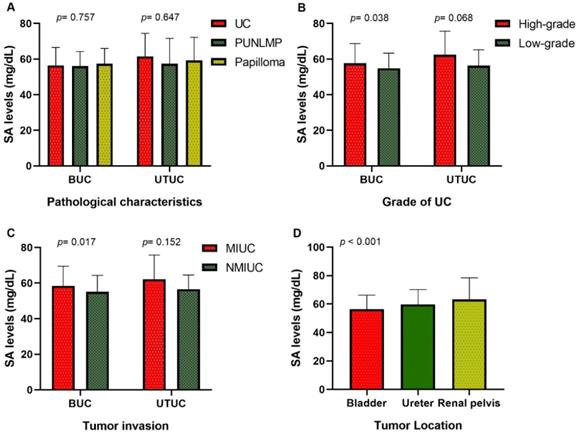
Our research collected data from 591 patients with urothelial tumors; 448 (75.80 %) were male, and 143 (24.20%) were female. The median age was 65 years, ranging from 17 to 94 years. The mean serum SA level of all patients was 56.41 ± 9.85 mg/dL and 61.40 ± 12.93 mg/dL for BUC and UTUC respectively. There was a significant correlation between serum SA levels and sex, WBC, PLT, AKP, LDH, PFL, and tumor size (all p < 0.05, Fig. 1). Most importantly, the serum levels of SA in advanced-stage patients were significantly higher than those in early-stage patients (high-grade UC vs. low-grade UC: 57.69 ± 11.06 vs. 54.84 ± 8.52 mg/dL [BUC, p < 0.05], 62.40 ± 13.32 vs. 56.32 ± 8.98 mg/dL [UTUC, p = 0.068], Fig. 2B; MIUC vs. NMIUC: 58.40 ± 11.11 vs. 55.07 ± 9.31 [BUC, p < 0.05], 62.21 ± 13.54 vs. 56.61 ± 7.94 [UTUC, p = 0.152], Fig. 2C). According to the previously collected data, 517 patients (87.48%) developed urothelial carcinoma, 60 patients (10.15%) developed PUNLMP, and 14 patients (2.37%) developed papilloma. However, there was no statistically significant difference in SA levels among UC, PUNLMP and papilloma cases (BUC: p = 0.757, UTUC: p = 0.647, Fig. 2A). The clinical characteristics of the enrolled patients are shown in Table 1.
The comparisons of serum SA levels in various groups of patients with urothelial tumor. (A) Age; (B) sex; (C) WBC; (D) PLT; (E) AKP;(F) LDH; (G) PFL; (H) tumor size.
Comparison of SA levels (A) among UC, PUNLMP and papilloma patients; (B) between high-grade and low-grade UC patients; (C) between MIUC and NMIUC patients; (D) among bladder urothelial carcinoma, ureteral tumor and renal pelvis tumor patients.
Correlations between preoperative SA levels and clinicopathological parameters
| Variables | BUC | UTUC | ||||
|---|---|---|---|---|---|---|
| No. of patients (%) | SA levels (mg/dL, Mean ± SD) | p value | No. of patients (%) | SA levels (mg/dL, Mean ± SD) | p value | |
| Patients | 406 | 56.41 ± 9.85 | 185 | 61.40 ± 12.93 | ||
| Agea | 0.743# | |||||
| ≤ 65y | 217 | 55.85 ± 9.46 | 0.229# | 87 | 61.93 ± 14.63 | |
| > 65y | 189 | 57.06 ± 10.26 | 98 | 60.92 ± 11.27 | ||
| Sex | 0.008# | |||||
| Male | 345 | 56.16 ± 9.79 | 0.176# | 103 | 59.45 ± 13.03 | |
| Female | 61 | 57.85 ± 10.12 | 82 | 63.84 ± 12.47 | ||
| Smoking history | 0.188# | |||||
| Ever | 159 | 56.22 ±9.35 | 0.931# | 58 | 60.35 ± 14.38 | |
| Never | 247 | 56.54 ± 10.17 | 127 | 61.88 ± 12.25 | ||
| Painless macroscopic hematuria | ||||||
| Yes | 299 | 56.66 ±9.99 | 0.436# | 125 | 61.04 ± 12.79 | 0.647# |
| No | 107 | 55.72 ± 9.46 | 60 | 62.14 ± 13.30 | ||
| WBCa | 0.000# | |||||
| ≤ 6.16 ×10⁹/L | 211 | 54.01 ± 8.53 | 0.000# | 86 | 57.34 ± 10.07 | |
| > 6.16 ×10⁹/L | 195 | 59.01 ± 10.52 | 99 | 64.93 ± 14.11 | ||
| PLTa | 0.000# | |||||
| ≤ 226 × 109/L | 205 | 53.44 ± 8.09 | 0.000# | 97 | 56.67 ± 10.19 | |
| > 26 × 109/L | 201 | 59.44 ±10.55 | 88 | 66.61 ± 13.67 | ||
| AKPa | 0.000# | |||||
| ≤ 68 U/L | 228 | 53.93 ± 7.41 | 0.000# | 85 | 56.30 ± 9.01 | |
| > 68 U/L | 178 | 59.59 ± 11.54 | 100 | 65.73 ± 14.17 | ||
| LDHa | 0.000# | |||||
| ≤ 187.50 U/L | 207 | 54.81 ± 8.43 | 0.001# | 89 | 58.49 ± 11.92 | |
| > 187.50 U/L | 199 | 58.08 ± 10.90 | 96 | 64.10 ± 13.31 | ||
| PFLa | 0.000# | |||||
| ≤ 3.09 g/L | 229 | 52.22 ± 5.86 | 0.000# | 68 | 53.49± 8.59 | |
| > 3.09 g/L | 177 | 61.84 ± 11.23 | 117 | 65.99 ± 12.84 | ||
| Tumor number | 0.582# | |||||
| Single | 228 | 55.95 ± 9.94 | 0.401# | 156 | 61.22 ±12.65 | |
| Multiple | 159 | 56.33 ± 9.52 | 10 | 68.02 ± 20.14 | ||
| Missing information | 19 | -- | 19 | -- | ||
| Tumor sizeab | 0.001# | |||||
| ≤ 2.7 cm | 226 | 54.30 ± 7.94 | 0.000# | 70 | 57.43 ± 9.45 | |
| > 2.7 cm | 180 | 59.06 ± 11.29 | 115 | 63.81 ± 14.16 | ||
| Pathological characteristics | 0.647* | |||||
| Papilloma | 8 | 57.40 ± 8.62 | 0.757* | 6 | 59.26 ± 12.94 | |
| PUNLMP | 56 | 56.01 ± 8.27 | 4 | 57.40 ± 14.23 | ||
| UC | 342 | 56.46 ± 10.13 | 175 | 61.56 ± 12.96 | ||
| Grade | 0.068# | |||||
| High-grade | 194 | 57.69 ± 11.06 | 0.038# | 151 | 62.40 ± 13.32 | |
| Low-grade | 148 | 54.84 ± 8.52 | 24 | 56.32 ± 8.98 | ||
| Tumor invasion | 0.152# | |||||
| MIUC | 169 | 58.40 ± 11.11 | 0.017# | 148 | 62.21 ± 13.54 | |
| NMIUC | 98 | 55.07 ± 9.31 | 13 | 56.61 ± 7.94 | ||
| Unknown | 75 | -- | 14 | -- | ||
Continuous variables are expressed as mediansa. Bold values are statistically significant (p < 0.05). Abbreviations: PUNLMP papillary urothelial neoplasm of low malignant potential; UC urothelial cancer; MIUC muscle-invasive urothelial cancer; NMIUC non-muscle-invasive urothelial cancer. p*: Kruskal-Wallis H-test; p#: Mann-Whitney U-test.
The role of SA level in the localization diagnosis of UC
Of all patients, 406 (68.70%) had bladder tumors, 99 (16.75%) had ureteral tumors, and 86 (14.55%) had renal pelvic tumors. Our study found that the serum SA level in the renal pelvic tumor and ureteral tumor groups was significantly higher than that in patients with bladder tumors (p < 0.05, Fig. 2D and Table 2), indicating that the serum SA level may have valuable applications in the localization diagnosis of urothelial tumors.
The level of serum SA in patients with urothelial tumors
| Tumor location | No. of patients (%) | SA levels (mg/dL, Mean ± SD) | p value |
|---|---|---|---|
| Bladder | 406 | 56.41 ± 9.85 | <0.001* |
| Ureter | 99 | 59.81 ± 10.37 | |
| Renal pelvis | 86 | 63.23 ± 15.23 |
Bold values are statistically significant (p < 0.05). p*: Kruskal-Wallis H-test.
Correlation analyses
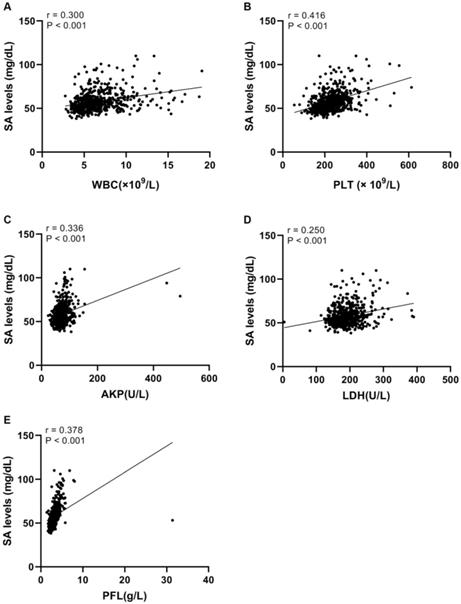
Linear correlation analyses were conducted to further explore correlations between SA levels and WBC, PLT, LDH, AKP, and PFL in UC patients. We found that there was a significant positive relationship between serum SA levels and WBC (r = 0.300, p <0.05, Fig. 3A), PLT (r = 0.416, p <0.05, Fig. 3B), AKP (r = 0.336, p <0.05, Fig. 3C), LDH (r = 0.250, p <0.05, Fig. 3D), and PFL (r = 0.378, p <0.05, Fig. 3E).
Linear correlations between SA levels and WBC, PLT, AKP, LDH, and PFL in urothelial tumor patients. (A) Linear correlation between SA levels and WBC. (B) Linear correlation between SA levels and PLT. (C) Linear correlation between SA levels and AKP. (D) Linear correlation between SA levels and LDH. (E) Linear correlation between SA levels and PFL.
The value of serum SA level in accurate location and qualitative diagnosis for UC patients
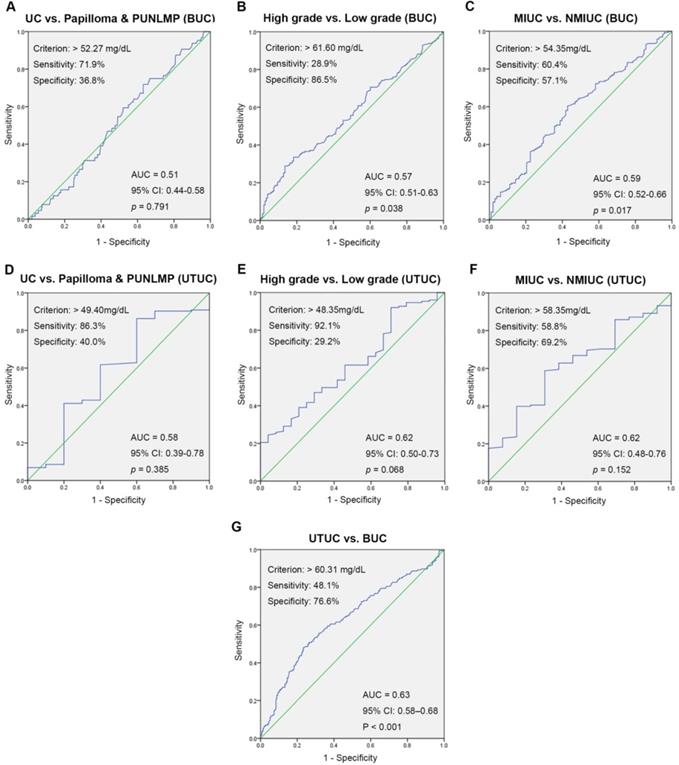
ROC curve analysis for preoperative SA levels was used to evaluate the value of localization and qualitative diagnoses. The optimal threshold values for preoperative SA levels were > 52.27 mg/dL, > 49.40 mg/dL (UC vs. papilloma and PUNLMP, BUC and UTUC), > 61.60 mg/dL, > 48.35 mg/dL (high-grade UC vs. low-grade UC, BUC and UTUC), > 54.35 mg/dL, > 58.35 mg/dL (MIUC vs. NMIUC, BUC and UTUC), and 60.31 mg/dL (UTUC vs. BUC). Remarkably, there was no clinical value of SA levels in differential diagnosis of UC and papilloma and PUNLMP (BUC: p = 0.791; UTUC: p = 0.385). Fig. 4 also showed the areas under the ROC curve (AUC), sensitivity and specificity for accuracy of each threshold values.
ROC curves for determination of the cut-off value of SA levels regarding the prediction of UC, high-grade UC, MIUC and UTUC.
Univariable and multivariable logistic regression analyses were conducted to further explore the clinical application value of serum SA levels for predicting the prognosis and orientation of urothelial tumors. The univariate analysis showed that there was a significant correlation between elevated preoperative SA levels and tumor orientation (HR = 3.305, p < 0.05) and poor clinical pathology diagnoses (UC: HR = 1.491 [BUC, p = 0.183], HR = 4.194 [UTUC, p < 0.05]; high-grade: HR = 2.597 [BUC, p < 0.05], HR = 4.770 [UTUC, p < 0.05]; MIUC: HR = 2.030 [BUC, p < 0.05], HR = 3.209 [UTUC, p = 0.062]; Table 3). Furthermore, tumor size was a significant predictor of tumor orientation (HR = 2.063, p < 0.05), malignant degree and prognosis (UC: HR = 3.744 [BUC, p < 0.05], HR = 1.692 [UTUC, p = 0.419]; high-grade: HR = 3.137 [BUC, p < 0.05], HR = 0.520 [UTUC, p = 0.191]; MIUC: HR = 4.226 [BUC, p < 0.05], HR = 3.917 [UTUC, p = 0.029]; [Table 3]). The univariate analysis results of other relevant variables were displayed in Table 3. Subsequently, sex, LDH, PFL, tumor size and SA level were incorporated into multivariate analysis. We found that SA level > 61.60 mg/dL, SA level > 48.35 mg/dL and SA level > 60.31 mg/dL were independent risk factors for high-grade BUC (HR = 1.941, p < 0.05; Table 4), high-grade UTUC (HR = 3.820, p < 0.05; Table 4), and UTUC (HR = 2.047, p < 0.05; Table 4), respectively. In addition, tumor size was independent risk factors for poor clinicopathology outcomes in BUC patients (UC: HR = 3.924, high grade: HR = 2.802, MIUC: HR = 3.985; all p < 0.05, Table 4), and was a predictor for the tumor localization (UTUC: HR = 1.660, p < 0.05, Table 4).
Univariate analysis of preoperative variables prognostic for UC, high-grade UC, MIUC and UTUC
| Variables | UC vs. Papilloma & PUNLMP | High grade vs. Low grade | MIUC vs. NMIUC | UTUC vs. BUC | ||||
|---|---|---|---|---|---|---|---|---|
| HR (95%CI) | p | HR (95%CI) | p | HR (95%CI) | p | HR (95%CI) | p | |
| Age | 1.293 (0.913~1.832) | 0.148 | ||||||
| BUC | 1.681 (0.967~2.923) | 0.065 | 1.260 (0.820~1.935) | 0.291 | 1.036 (0.630~1.704) | 0.889 | ||
| UTUC | 1.741 (0.475~6.385) | 0.403 | 1.021 (0.430~2.424) | 0.962 | 1.019 (0.327~3.177) | 0.974 | ||
| Sex | 0.222 (0.149~0.331) | 0.000 | ||||||
| BUC | 1.970 (1.022~3.798) | 0.043 | 1.354 (0.713~2.571) | 0.354 | 1.129 (0.535~2.383) | 0.750 | ||
| UTUC | 0.321 (0.080~1.284) | 0.108 | 3.284 (1.166~9.252) | 0.024 | 2.757 (0.729~10.427) | 0.135 | ||
| WBC | 1.246 (0.879~1.765) | 0.217 | ||||||
| BUC | 1.183 (0.693~2.018) | 0.538 | 1.217 (0.792~1.870) | 0.370 | 1.258 (0.764~2.070) | 0.368 | ||
| UTUC | 1.323 (0.361~4.851) | 0.673 | 1.276 (0.533~3.052) | 0.584 | 1.019 (0.327~3.177) | 0.974 | ||
| PLT | 0.925 (0.653~1.310) | 0.662 | ||||||
| BUC | 1.024 (0.600~1.746) | 0.932 | 1.548 (1.007~2.382) | 0.047 | 1.280 (0.777~2.107) | 0.333 | ||
| UTUC | 0.369 (0.092~1.475) | 0.159 | 1.188 (0.502~2.814) | 0.695 | 2.250 (0.664~7.629) | 0.193 | ||
| AKP | 1.507 (1.063~2.137) | 0.021 | ||||||
| BUC | 0.732 (0.423~1.268) | 0.266 | 1.251 (0.813~1.926) | 0.309 | 1.016 (0.617~1.673) | 0.950 | ||
| UTUC | 1.187 (0.332~4.249) | 0.792 | 1.221 (0.515~2.890) | 0.650 | 1.934 (0.604~6.191) | 0.266 | ||
| LDH | 1.122 (0.792~1.589) | 0.517 | ||||||
| BUC | 1.412 (0.825~2.417) | 0.208 | 1.660 (1.077~2.559) | 0.022 | 1.417 (0.860~2.335) | 0.172 | ||
| UTUC | 1.083 (0.303~3.875) | 0.902 | 1.332 (0.561~3.160) | 0.516 | 7.219 (1.546~33.717) | 0.012 | ||
| PFL | 2.226 (1.557~3.183) | 0.000 | ||||||
| BUC | 0.741 (0.428~1.284) | 0.285 | 1.418 (0.920~2.186) | 0.114 | 1.467 (0.887~2.427) | 0.135 | ||
| UTUC | 1.156 (0.314~4.251) | 0.827 | 1.283 (0.534~3.084) | 0.578 | 1.219 (0.358~4.150) | 0.752 | ||
| Tumor size | 2.063 (1.445~2.944) | 0.000 | ||||||
| BUC | 3.744 (1.965~7.134) | 0.000 | 3.137 (2.005~4.908) | 0.000 | 4.226 (2.479~7.205) | 0.000 | ||
| UTUC | 1.692 (0.472~6.068) | 0.419 | 0.520 (0.195~1.385) | 0.191 | 3.917 (1.151~13.325) | 0.029 | ||
| SA level | n.d. | n.d. | n.d. | |||||
| BUC (>52.27 * vs ≤52.27) | 1.491 (0.828~2.683) | 0.183 | ||||||
| UTUC (>49.40* vs ≤49.40) | 4.194 (1.102~15.962) | 0.035 | ||||||
| SA level | n.d. | n.d. | ||||||
| BUC (>61.60 * vs ≤61.60) | 2.597 (1.477~4.567) | 0.001 | n.d. | |||||
| UTUC (>48.35 * vs ≤48.35) | 4.770 (1.653~13.760) | 0.004 | ||||||
| SA level | n.d. | |||||||
| BUC (>54.35 * vs ≤54.35) | n.d. | n.d. | 2.030 (1.225~3.364) | 0.006 | ||||
| UTUC (>58.35* vs ≤58.35) | 3.209 (0.945~10.896) | 0.062 | ||||||
| SA level (>60.31* vs ≤60.31) | n.d. | n.d. | n.d. | 3.035 (2.099~4.388) | 0.000 | |||
Bold values are statistically significant (p < 0.05). Abbreviations: PUNLMP papillary urothelial neoplasm of low malignant potential; UC urothelial cancer; UTUC upper tract urothelial carcinoma; BUC bladder urothelial carcinoma; MIUC muscle-invasive urothelial cancer; NMIUC non-muscle-invasive urothelial cancer; HR hazard ratio; 95% CI 95% confidence interval.
Multivariate analysis of preoperative variables prognostic for high-grade UC, MIUC and UTUC
| Variables | UC vs. Papilloma & PUNLMP | High grade vs. Low grade | MIUC vs. NMIUC | UTUC vs. BUC | ||||
|---|---|---|---|---|---|---|---|---|
| HR (95%CI) | p | HR (95%CI) | p | HR (95%CI) | p | HR (95%CI) | p | |
| Sex | 0.873 | 4.128 (2.726~6.250) | 0.000 | |||||
| BUC | 1.908 (0.961~3.788) | 0.065 | 1.365 (0.692~2.693) | 0.369 | 0.937 (0.419~2.092) | |||
| UTUC | 0.194 (0.041~0.923) | 0.039 | 2.412 (0.800~7.270) | 0.118 | 3.391 (0.805~14.297) | 0.096 | ||
| LDH | 1.080 (0.733~1.591) | 0.697 | ||||||
| BUC | 1.521 (0.868~2.667) | 0.143 | 1.595 (1.011~2.518) | 0.045 | 1.272 (0.738~2.191) | 0.386 | ||
| UTUC | 1.107 (0.283~4.338) | 0.884 | 1.195 (0.482~2.966) | 0.701 | 6.181 (1.208~31.615) | 0.029 | ||
| PFL | 1.462 (0.957~2.234) | 0.079 | ||||||
| BUC | 1.293 (0.708~2.364) | 0.403 | 1.093 (0.660~1.808) | 0.731 | 1.130 (0.613~2.085) | 0.695 | ||
| UTUC | 1.983 (0.342~11.490) | 0.445 | 1.194 (0.426~3.341) | 0.736 | 3.126 (0.708~13.808) | 0.133 | ||
| Tumor size | 1.660 (1.115~2.474) | 0.013 | ||||||
| BUC | 3.924 (2.017~7.634) | 0.000 | 2.802 (1.761~4.460) | 0.000 | 3.985 (2.302~6.899) | 0.000 | ||
| UTUC | 1.706 (0.440~6.608) | 0.440 | 2.050 (0.730~5.755) | 0.173 | 4.100 (1.081~15.549) | 0.038 | ||
| SA level | n.d. | |||||||
| BUC (>52.27 * vs ≤52.27) | 1.810 (0.959~3.414) | 0.067 | n.d. | n.d. | ||||
| UTUC (>49.40* vs ≤49.40) | 10.889 (1.720~68.946) | 0.011 | ||||||
| SA level | n.d. | |||||||
| BUC (>61.60 * vs ≤61.60) | n.d. | 1.941 (1.017~3.707) | 0.044 | n.d. | ||||
| UTUC (>48.35 * vs ≤48.35) | 3.820 (1.108~13.170) | 0.034 | ||||||
| SA level | n.d. | |||||||
| BUC (>54.35 * vs ≤54.35) | n.d. | n.d. | 1.643 (0.889~3.038) | 0.113 | ||||
| UTUC (>58.35* vs ≤58.35) | 2.129 (0.477~9.506) | 0.322 | ||||||
| SA level (>60.31* vs ≤60.31) | n.d. | n.d. | n.d. | 2.047 (1.310~3.198) | 0.002 | |||
Bold values are statistically significant (p < 0.05). Abbreviations: PUNLMP papillary urothelial neoplasm of low malignant potential; UC urothelial cancer; UTUC upper tract urothelial carcinoma; BUC bladder urothelial carcinoma; MIUC muscle-invasive urothelial cancer; NMIUC non-muscle-invasive urothelial cancer; HR hazard ratio; 95% CI 95% confidence interval.
Validation in an independent cohort
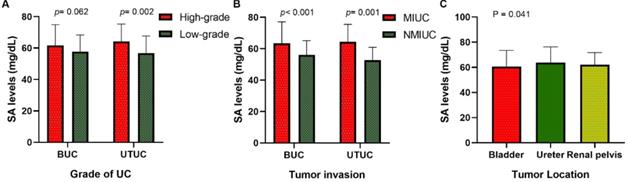
To find out whether the effect of SA was applicable for other UC cases, we reviewed the medical records of 322 UC patients from another institutions as an independent cohort. Our study validates the serum levels of SA in advanced-stage patients were significantly higher than those in early-stage patients (high-grade UC vs. low-grade UC: 61.70 ± 13.27 vs. 57.83 ± 10.56 mg/dL [BUC, p = 0.062], 64.14 ± 11.13 vs. 56.91 ± 10.77 mg/dL [UTUC, p < 0.05], Fig. 5A; MIUC vs. NMIUC: 63.40 ± 13.67 vs. 56.00 ± 9.18 [BUC, p < 0.05], 64.53 ± 10.97 vs. 52.72 ± 8.20 [UTUC, p < 0.05], Fig. 5B). In addition, serum SA level was obviously elevated in UTUC patients compared to BUC patients (p < 0.05, Fig. 5C). The detailed clinicopathological data was presented in Table 5 and Table 6.
Comparison of SA levels of validation set (A) between high-grade and low-grade UC patients; (B) between MIUC and NMIUC patients; (C) among bladder urothelial carcinoma, ureteral tumor and renal pelvis tumor patients.
The level of serum SA in patients with urothelial tumors in the validation set
| Variables | BUC | UTUC | ||||
|---|---|---|---|---|---|---|
| No. of patients (%) | SA levels (mg/dL, Mean ± SD) | p value | No. of patients(%) | SA levels (mg/dL, Mean ± SD) | p value | |
| Patients | 185 | 60.72 ± 12.72 | 137 | 62.98 ± 11.35 | ||
| Grade | 0.062# | 0.002# | ||||
| High-grade | 138 | 61.70 ± 13.27 | 115 | 64.14 ± 11.13 | ||
| Low-grade | 47 | 57.83 ± 10.56 | 22 | 56.91 ± 10.77 | ||
| Tumor invasion | <0.001# | <0.001# | ||||
| MIUC | 118 | 63.40 ± 13.67 | 119 | 64.53 ± 10.97 | ||
| NMIUC | 67 | 56.00 ± 9.18 | 18 | 52.72 ± 8.20 | ||
Bold values are statistically significant (p < 0.05). Abbreviations: MIUC muscle-invasive urothelial cancer; NMIUC non-muscle-invasive urothelial cancer. p#: Mann-Whitney U-test.
The level of serum SA in patients with urothelial tumors in the validation set
| Tumor location | No. of patients (%) | SA levels (mg/dL, Mean ± SD) | p value |
|---|---|---|---|
| Bladder | 185 | 60.72 ± 12.72 | 0.041* |
| Ureter | 77 | 63.75 ± 12.46 | |
| Renal pelvis | 60 | 61.99 ± 9.76 |
Bold values are statistically significant (p < 0.05). p*: Kruskal-Wallis H-test.
Discussion
Urothelial carcinoma can be divided mainly into UTUC and BUC, and has a notably high rate of clinical variability, recurrence, progression, and cancer-specific mortality [11, 12]. UTUC has symptoms and signs similar to those of BUC [13], whereas UTUC is markedly more aggressive and seems to have a higher burden of nodal metastases at diagnosis than BUC [14, 15]. Our current diagnostic and detection methods for UC are invasive, radioactive and expensive procedures [16], such as CT, MRI and pathology. Therefore, there is an urgent need to find an effective, simple and noninvasive method for the diagnosis, orientation and guidance of clinical treatments for UC.
Sialic acids, a family of monosaccharides with negative charges, are typically located at the terminal positions of cell surface glycoproteins and glycolipids [17]. Due to their special physical and chemical properties, such as charge and size, SAs are involved in a variety of biologically important processes and influence both the degree of severity and the progression of disease in a range of illnesses. Moreover, the combinatorial diversity enables SAs to influence the structure and function of glycoproteins and lipids as well as to regulate cell-cell and cell-extracellular matrix interactions [18]. For example, sialic acids can mediate pathogen infection, immunogenicity, cell adhesion and migration, vascularization and differentiation and can serve as ligands of sialic acid-binding proteins, such as factor H, selectins and Siglecs [19-21].
There are quantitative and qualitative changes in the expression of cellular surface molecules in the canceration course, which is crucial for the unlimited proliferation and malignant behavior of neoplastic cells [22]. Glycoconjugates including glycoproteins and glycolipids, are ubiquitous, essential components of cell membranes and therefore participate in malignant transformation and tumor progression [23]. The aberrant expression of SA facilitates cancer cell migration and metastasis formation and is an important factor in tumor immunological escape and the immunosuppressive microenvironment [24-26]. Strikingly, these glycoconjugates are released into the circulation through increased turnover, secretion and/or shedding from malignant cells, which results in increased SA levels in the blood [9, 27]. Previous studies have confirmed that there is marked clinical significance for measuring serum SA in the diagnosis and treatment evaluation of several solid tumors, including colorectal cancer [28], osteosarcoma [29], oral squamous cell carcinoma [27], pancreatic cancer [30], melanoma [26], and prostatic cancer [31].
In the present study, we examined preoperative SA levels and other clinical features of 591 patients with newly diagnosed urothelial tumors. We found that the extent of malignancy was significantly correlated with serum SA levels. Meanwhile, we noticed that the SA level in patients with renal pelvis carcinoma and ureteral tumors was higher than that in patients with bladder tumors. To further understand the association between SA levels and other clinical features, linear correlation analyses were performed and showed that serum indicators such as WBC, PLT, LDH, AKP, and PFL were linearly correlated with SA levels. Furthermore, ROC curves further confirmed the practical application value of SA levels in the diagnosis and localization of urothelial tumors. The optimal cut-off values with the maximum Youden index were > 61.60 mg/dL (BUC: high-grade vs. low-grade), 54.35 mg/dL (BUC: MIUC vs. NMIUC), and 60.31 mg/dL (UTUC vs. BUC). Logical regression analysis showed that the SA level was a powerful independent predictor of high-grade UC and UTUC, which supported the potential utility of SA levels in clinical practice as a noninvasive biomarker for the diagnosis and localization of urothelial tumors. Finally, we validated the diagnosis and localization value of SA in an independent cohort from another institution. However, there are still some controversies regarding the quantitative changes in SA occurring in patients with urothelial tumors. In a study performed by Habibi et al. [32], lipid-bound sialic acid (LBSA) and protein-bound sialic acid (PBSA) levels were significantly higher in bladder cancer patients than in normal controls and were significantly correlated with tumor grade, which was in accordance with some earlier reports [10, 33]. In contrast, in a report by Lagana et al. [34], the levels of total sialic acid (TSA) and LBSA in patients with bladder tumors were not significantly different from those in normal subjects, which was in agreement with our finding that SA levels in UC patients did not differ significantly from those in patients with papilloma and PUNLMP. In addition, some early studies observed that SA levels were also elevated in benign diseases, such as severe infection [35], type II diabetes [36], rheumatoid arthritis [37] and prostatitis [10], and may serve as a nonspecific acute phase reactant, which may have given rise to bias and disturbed the results of our study. According to the results of our study, we speculate that serum SA levels have strong limitations in the screening of early UC but that they may be useful primarily in the evaluation of the malignant degree of advanced disease and in the localization of urothelial tumors.
However, there were several shortcomings and limitations in this study. First, because the design was analytical and retrospective, the study may have suffered from confounding bias. Besides, the postoperative pathology results collected in clinical practice couldn't provide sufficient information for clinicopathologic stage. Additionally, the gathered clinical information didn't involve patient prognosis, such as relapse-free and overall survival, which would be the focus of our future work.
In conclusion, we believe that SA can be a useful biomarker for the evaluation of the malignant degree of UC and the localization of urothelial tumors. However, further studies are needed to determine whether serum SA levels have applicable clinical value as a single biomarker or as an auxiliary test to traditional approaches in the detection and localization of urothelial tumors.
Abbreviations
UC: urothelial carcinoma; UTUC: upper tract urothelial carcinoma; SA: sialic acid; LBSA: lipid-bound sialic acid; PBSA: protein-bound sialic acid; TSA: total sialic acid; SD: mean ± standard deviation; WBC: white blood cell; LDH: lactate dehydrogenase; PLT: platelet; AKP: alkaline phosphatase; PFL: plasma fibrinogen; ROC: receiver operative characteristic; AUC: the area under the ROC; HR: hazard ratios; 95% CI: 95% confidence interval.
Acknowledgements
This study was supported by financial grants from the National Natural Science Foundation of China (grant Nos: 81502213); the Focused Research and Development Program of Shandong Province (grant Nos: 2019GSF108255).
Ethical approval
Ethical approval was waived by the local Ethics Committee of Qilu Hospital of Shandong University in view of the retrospective nature of the study and the fact that all the procedures performed were part of routine care.
Competing Interests
The authors have declared that no competing interest exists.
References
1. McGuire S. World Cancer Report 2014. Geneva, Switzerland: World Health Organization, International Agency for Research on Cancer, WHO Press, 2015. Advances in nutrition. 2016;7(2):418-9
2. Niegisch G, Gerullis H, Lin SW. et al. A Real-World Data Study to Evaluate Treatment Patterns, Clinical Characteristics and Survival Outcomes for First- and Second-Line Treatment in Locally Advanced and Metastatic Urothelial Cancer Patients in Germany. Journal of Cancer. 2018;9(8):1337-48
3. Chen W, Zheng R, Baade PD. et al. Cancer statistics in China, 2015. CA: a cancer journal for clinicians. 2016;66(2):115-32
4. Munoz JJ, Ellison LM. Upper tract urothelial neoplasms: incidence and survival during the last 2 decades. The Journal of urology. 2000;164(5):1523-5
5. Wang X, Gu Y, Zhang S. et al. Unbiased enrichment of urine exfoliated cells on nanostructured substrates for sensitive detection of urothelial tumor cells. Cancer medicine. 2020;9(1):290-301
6. Lerner SP, Liu H, Wu MF. et al. Fluorescence and white light cystoscopy for detection of carcinoma in situ of the urinary bladder. Urologic oncology. 2012;30(3):285-9
7. Varki A. Glycan-based interactions involving vertebrate sialic-acid-recognizing proteins. Nature. 2007;446(7139):1023-9
8. Altay M, Karakoc MA, Cakir N. et al. Serum Total Sialic Acid Level is Elevated in Hypothyroid Patients as an Atherosclerotic Risk Factor. Journal of clinical laboratory analysis. 2017;31(2):e22034
9. Joshi M, Patil R. Estimation and comparative study of serum total sialic acid levels as tumor markers in oral cancer and precancer. Journal of cancer research and therapeutics. 2010;6(3):263-6
10. Erbil KM, Sen SE, Zincke H, Jones JD. Significance of serum protein and lipid-bound sialic acid as a marker for genitourinary malignancies. Cancer. 1986;57(7):1389-94
11. Martin-Doyle W, Leow JJ, Orsola A. et al. Improving selection criteria for early cystectomy in high-grade t1 bladder cancer: a meta-analysis of 15,215 patients. Journal of clinical oncology: official journal of the American Society of Clinical Oncology. 2015;33(6):643-50
12. Cookson MS, Herr HW, Zhang ZF. et al. The treated natural history of high risk superficial bladder cancer: 15-year outcome. The Journal of urology. 1997;158(1):62-7
13. Miyazaki J, Nishiyama H. Epidemiology of urothelial carcinoma. International journal of urology: official journal of the Japanese Urological Association. 2017;24(10):730-4
14. Roupret M, Babjuk M, Comperat E. et al. European Association of Urology Guidelines on Upper Urinary Tract Urothelial Cell Carcinoma: 2015 Update. European urology. 2015;68(5):868-79
15. Sathianathen NJ, Risk MC, Konety BR. Lymphadenectomy for Muscle-Invasive Bladder Cancer and Upper Tract Urothelial Cell Carcinoma. The Urologic clinics of North America. 2018;45(2):215-28
16. Luo Y, She DL, Xiong H. et al. Diagnostic Value of Liquid-Based Cytology in Urothelial Carcinoma Diagnosis: A Systematic Review and Meta-Analysis. PloS one. 2015;10(8):e0134940
17. Heimburg-Molinaro J, Lum M, Vijay G. et al. Cancer vaccines and carbohydrate epitopes. Vaccine. 2011;29(48):8802-26
18. Moons SJ, Adema GJ, Derks MT. et al. Sialic acid glycoengineering using N-acetylmannosamine and sialic acid analogs. Glycobiology. 2019;29(6):433-45
19. Schauer R. Sialic acids as regulators of molecular and cellular interactions. Current opinion in structural biology. 2009;19(5):507-14
20. Wratil PR, Horstkorte R. Metabolic Glycoengineering of Sialic Acid Using N-acyl-modified Mannosamines. Journal of visualized experiments. 2017(129):55746
21. Wratil PR, Horstkorte R, Reutter W. Metabolic Glycoengineering with N-Acyl Side Chain Modified Mannosamines. Angewandte Chemie. 2016;55(33):9482-512
22. Dadhich M, Prabhu V, Pai VR. et al. Serum and salivary sialic acid as a biomarker in oral potentially malignant disorders and oral cancer. Indian journal of cancer. 2014;51(3):214-8
23. Rao VR, Krishnamoorthy L, Kumaraswamy SV, Ramaswamy G. Circulating levels in serum of total sialic acid, lipid-associated sialic acid, and fucose in precancerous lesion and cancer of the oral cavity. Cancer detection and prevention. 1998;22(3):237-40
24. Bull C, Stoel MA, den Brok MH, Adema GJ. Sialic acids sweeten a tumor's life. Cancer research. 2014;74(12):3199-204
25. Bull C, den Brok MH, Adema GJ. Sweet escape: sialic acids in tumor immune evasion. Biochimica et biophysica acta. 2014;1846(1):238-46
26. Bull C, Boltje TJ, Balneger N. et al. Sialic Acid Blockade Suppresses Tumor Growth by Enhancing T-cell-Mediated Tumor Immunity. Cancer research. 2018;78(13):3574-88
27. Achalli S, Madi M, Babu SG. et al. Sialic acid as a biomarker of oral potentially malignant disorders and oral cancer. Indian journal of dental research: official publication of Indian Society for Dental Research. 2017;28(4):395-9
28. Verazin G, Riley WM, Gregory J. et al. Serum sialic acid and carcinoembryonic levels in the detection and monitoring of colorectal cancer. Diseases of the colon and rectum. 1990;33(2):139-42
29. Sandhu R, Lal H, Kundu ZS, Kharb S. Serum fluoride and sialic acid levels in osteosarcoma. Biological trace element research. 2011;144(1-3):1-5
30. Gruszewska E, Chrostek L, Cylwik B. et al. Serum sialic acid as a marker of pancreatic cancers. Clinical laboratory. 2013;59(7-8):781-8
31. Zhang C, Yan L, Song H. et al. Elevated Serum Sialic Acid Levels Predict Prostate Cancer As Well As Bone Metastases. Journal of Cancer. 2019;10(2):449-57
32. Habibi S, Jamshidian H, Kadivar M. et al. A study of lipid- and protein- bound sialic acids for the diagnosis of bladder cancer and their relationships with the severity of malignancy. Reports of biochemistry & molecular biology. 2014;2(2):70-5
33. Oztokatli A, Ozkardes H, Ovul E, Erol D. The significance of serum lipid-bound sialic acid in bladder tumours. International urology and nephrology. 1992;24(2):125-9
34. Lagana A, Pardo-Martinez B, Marino A. et al. Determination of serum total lipid and free N-acetylneuraminic acid in genitourinary malignancies by fluorimetric high performance liquid chromatography. Relevance of free N-acetylneuraminic acid as tumour marker. Clinica chimica acta; international journal of clinical chemistry. 1995;243(2):165-79
35. Rajendiran KS, Ananthanarayanan RH, Satheesh S, Rajappa M. Elevated levels of serum sialic acid and high-sensitivity C-reactive protein: markers of systemic inflammation in patients with chronic heart failure. British journal of biomedical science. 2014;71(1):29-32
36. Ekin S, Meral I, Gunduz H, Mert N. Comparative study of total protein, and total and lipid-associated serum sialic acid levels in patients with type 2 diabetes mellitus. Journal of clinical laboratory analysis. 2003;17(4):124-6
37. O'Kennedy R, Berns G, Moran E. et al. A critical analysis of the use of sialic acid determination in the diagnosis of malignancy. Cancer letters. 1991;58(1-2):91-100
Author contact
![]() Corresponding author: Lei Yan, Department of Urology, Qilu Hospital of Shandong University, Wenhuaxi Road 107#, Jinan, 250012, P.R. China. Tel.: +86-531-82166701; Fax: +86-531-82169044; E-mail: yanlei5309com.
Corresponding author: Lei Yan, Department of Urology, Qilu Hospital of Shandong University, Wenhuaxi Road 107#, Jinan, 250012, P.R. China. Tel.: +86-531-82166701; Fax: +86-531-82169044; E-mail: yanlei5309com.