Impact Factor ISSN: 1837-9664

 Global reach, higher impact
J Cancer 2021; 12(21):6588-6599. doi:10.7150/jca.63236 This issue Cite
Research Paper
CD161, a promising Immune Checkpoint, correlates with Patient Prognosis: A Pan-cancer Analysis
Wenrui Ye1*, Cong Luo2*, Chenglong Li1, Zhixiong Liu1, Fangkun Liu1,3 ![]()
1. Department of Neurosurgery, Xiangya Hospital, Central South University, 87 Xiangya Road, Changsha, Hunan, 410008, China.
2. Department of Urology, Xiangya Hospital, Central South University, 87 Xiangya Road, Changsha, Hunan, 410008, China.
3. National Clinical Research Center for Geriatric Disorders, Xiangya Hospital, Central South University, 87 Xiangya Road, Changsha, Hunan, 410008, China.
*These authors have contributed equally to this work and share first authorship.
Received 2021-5-27; Accepted 2021-8-24; Published 2021-9-9
Abstract

Background: CD161 is a promising immune checkpoint mainly expressed on natural killer (NK) cells and is essential for immunoregulatory functions. However, it remains obscure how CD161 correlates with immune infiltration and patient prognosis in pan-cancer.
Methods: We employed HPA, TCGA, GTEx, TIMER2.0, and GEPIA2 databases as well as R language to analyze and visualize CD161 in cancers. Our twenty-four glioma samples were sequenced for validation.
Results: Overall, CD161 was differentially expressed between most paired cancer and normal controls. Higher CD161 expression was associated with poorer overall survival (OS) in the TCGA LGG (HR = 2.18, 95%CI = 1.79-2.66, P < 0.001) and UVM (HR = 1.32, 95%CI = 1.05-1.65, P = 0.016) cohorts. In these two cancer types, CD161 was significantly correlated with expression levels of recognized immune checkpoints and the abundance of markers of specific immune subsets, including CD8+ T cells, dendric cells (DCs), M2 macrophages, and exhausted T cells (Texs). In addition, CD161 was involved in several immune pathways in LGG and UVM, highlighting its role in regulating immune processes in the context of oncology.
Conclusions: CD161 is a potential prognostic biomarker and immunotherapy target in human cancers, especially brain lower grade gliomas.
Keywords: CD161, biomarker, cancer, bioinformatics, prognosis, immune infiltration
Introduction
Cancer has gradually become the top killer threatening human life over the past few decades [1]. Fortunately, with the deeper understanding of the intrinsic mechanisms underlying oncogenesis, researchers have launched more options for combating cancer [2]. Flourishing efforts to target co-inhibitory or immune checkpoint receptors [For example, cytotoxic T lymphocyte associated protein 4 (CTLA-4) and programmed death-1 (PD-1)] responsible for an immunosuppressive phenotype, have shown great success in the treatment across various cancer types [3, 4]. Despite the great success of immune checkpoint blockade (ICB), a significant number of patients do not respond to currently available immunotherapies or acquire resistance after a certain treatment duration [5]. Thus, this conundrum has attracted attention for exploring novel immune checkpoints that can be safely targeted with high anti-tumor efficacy in the hope of achieving high response rates and better therapeutic outcomes.
CD161, encoded by killer cell lectin-like receptor subfamily B member 1 (KLRB1), is a C-type lectin-like receptor expressed on human natural killer NK cells [6] and various T lymphocyte subsets [7]. CD161 may act as a lectin, binding to terminal carbohydrate gal alpha (1,3) gal epitopes as well as N-acetyllactosamine epitopes. As for the role in immunity, activation of CD161 resulted in significantly enhanced anti-CD3-induced T cell proliferation. In addition, it also binds to CLEC2D/LLT1 as a ligand (similar to PD-1/PD-L1 axis) and inhibits NK cell-mediated cytotoxicity as well as interferon-γ secretion in target cells.
Leveraging single-cell RNA sequencing (RNA-seq) analysis of tumor-infiltrating T cells in glioma patients, a recent study identified a T cell population co-expressing a cytotoxicity program and natural killer cell receptors. Specifically, genetic inactivation of KLRB1 or antibody-mediated CD161 blockade enhances T cell-mediated killing of glioma cells in vitro and their anti-tumor function in vivo [8], identifying CD161-CLEC2D pathway as a potential target for immunotherapy. Furthermore, KLRB1 was also expressed by a subset of tumor-infiltrating CD4+ and CD8+ T cells in other tumor types including melanoma, non-small cell lung cancer (NSCLC), hepatocellular carcinoma, and colorectal cancer indicated by several published scRNA-seq datasets [9-12].
However, studies on CD161 in other tumor types have rarely been reported yet, which makes it inconclusive whether CD161 functions as an immune checkpoint. More comprehensive analysis of CD161 profile in human cancer is warranted to understand the intrinsic role of CD161 in tumor immunity. We herein conducted a pan-cancer analysis to illustrate the profile of CD161, including expression, mutation status, correlation with signatures of interest, and contribution to patient survival. In this study, all data was elicited from widely applied open databases, and all these analyses were performed based on webtools and R language, version 4.0.2.
Materials and Methods
Data Source and Processing
The Cancer Genome Atlas (TCGA) is a landmark cancer genomics program, which has molecularly characterized over 20,000 primary cancer and matched normal samples spanning thirty-three cancer types until April, 2021. We collected CD161 data from various cancer samples in the TCGA database [13]. Fragments per kilobase million (FPKM) values were transformed into transcripts per kilobase million (TPM) values, and were further log transformed for better comparisons between samples. The genotype-tissue expression (GTEx) database provides publicly available gene expression data from fifty-four normal tissue sites across nearly 1000 people [14]. Normal samples from both TCGA and GTEx databases were integrated for comparisons between cancer and normal tissues.
CD161 Expression Profiles
The Human Protein Atlas (HPA) is a program for mapping human proteins in cells, tissues and organs using integration of various omics technologies [15, 16]. We obtained the immunohistochemistry results of CD161 proteins in certain tissues (including tumor and normal tissues) in the tissue atlas and pathology atlas in HPA database.
Survival Analysis
We used the TCGA data and performed survival analysis, computed the log-rank P value and hazard ratio (HR) with 95% confidence interval (95%CI). The results were displayed as forest plots (using “forestplot” package in R) and survival curves (using “survival” package in R).
Correlation Analysis
The correlations between CD161 and immune checkpoints (including but not limited to PDCD1, CD28 and CTLA4) were calculated [17]. In addition, we examined the relationship between CD161 expression and genomic alteration signatures, including tumor mutation burden (TMB), microsatellite instability (MSI), mismatch repair (MMR) genes as well as DNA methyltransferases. The mismatch repair mechanism plays a key role in the identification and repair of mismatched bases during DNA replication and genetic recombination [18]. MMR deficiency and subsequent MSI, a hypermutator phenotype subsequent to frequent polymorphism in short repetitive sequences and single nucleotide substitution [19], lead to accumulated TMB [20]. Those genetic indicators besides DNA methyltransferases are closely linked to tumorigenesis and considered as independent predictors of immunotherapy efficacy [21, 22].
Immune Infiltration and Enrichment Analysis
Tumor purity was estimated using “estimate” package in R. Stromal and Immune score represented the abundance of stromal and immune components, respectively. ESTIMATE score, the sum of stromal and immune scores, represents tumor purity to some extent. Tumor IMmune Estimation Resource 2.0 (TIMER2.0) web server is a comprehensive resource for systematic analysis of immune infiltrates across diverse cancer types [23, 24]. We assessed the correlations between CD161 and six infiltrating lymphocytes, as well as the markers for immune cell subsets including CD8+ T cells, total T cells, B cells, monocytes, tumor-associated macrophages (TAMs), M1 and M2 macrophages, neutrophils, NK cells, DCs, Th1 cells, type 2 helper T cell (Th2), Tfh cells, type 17 helper T cell (Th17), Tregs, exhausted T cells, and follicular dendritic cells (FDC) [25, 26]. Those correlations were re-analyzed using Gene Expression Profiling Interactive Analysis 2 (GEPIA2) [27, 28].
RNA Sequencing of Glioma Samples
We included twenty-four glioma samples diagnosed at the Department of Neurosurgery, Xiangya Hospital from June 2018 to July 2021. Patients with the presence of other cancers or serious underlying diseases were excluded. Their clinical information was summarized in Table S1.
In brief, the fresh glioma samples were collected and then immediately stored in liquid nitrogen. Total RNA was extracted from the tissues using TRIzol (Invitrogen, Carlsbad, CA, USA) according to the instructions. Subsequently, NanoDrop and Agilent 2100 bioanalyzer (Thermo Fisher Scientific, MA, USA) were used to quantify total RNA, which was purified and fragmented into small pieces. Then, first- and second-strand cDNA were synthesized. The cDNA fragments were further amplified by polymerase chain reaction (PCR) after incubating with A-tailing mix and RNA Adapter Index for end repair. The qualified double-stranded PCR products were then used to construct the final library (single-stranded circular DNA). Eventually, the 24 qualified glioma samples were further sequenced on a BGISEQ-500 platform (BGI-Shenzhen, China). The gene expression levels were calculated using RSEM (v1.2.12).
Statistical Analysis
Student's t-test and analysis of variance (ANOVA) test were used for comparisons between two groups and for comparisons of more than two groups, respectively. Spearman's correlation analysis was used to measure the degree of correlation between certain variables, and the following R/rho values were used to judge the correlations: 0-0.19, 'very weak'; 0.20-0.39, 'weak'; 0.40-0.59, 'moderate'; 0.60-0.79, 'strong'; 0.80-1.00, 'very strong'. In most analysis, P < 0.05 was the significance threshold.
Results
KLRB1/CD161 Expression Profiles in Human Cancers
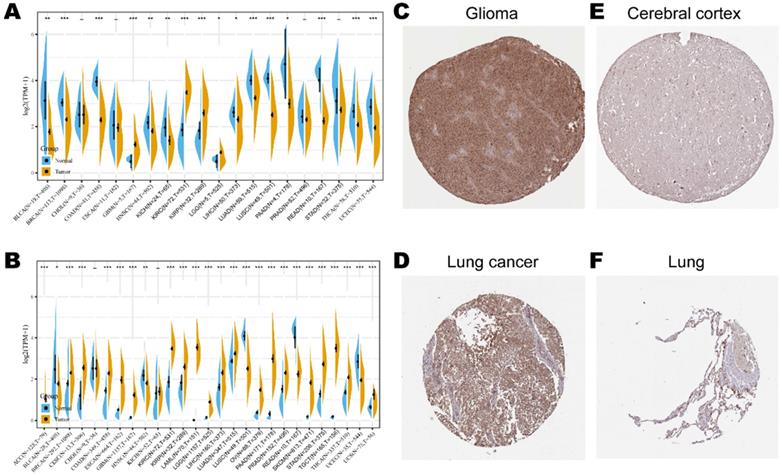
Consistent high expression level of KLRB1 mRNA were observed in tumor samples of BRCA, CHOL, COAD, ESCA, GBM, HNSC, KIRH, KIRC, LGG, LIHC, LUAD, LUSC, STAD, and THCA than normal tissue based on both comparisons (Figure 1A). Considering that the number size of normal tissue in the TCGA database is too small to be statistically convincing (e.g., TCGA glioblastoma multiforme (GBM) cohort has only five normal controls), we integrated the GTEx and TCGA databases to reflect the KLRB1 mRNA expression landscape in a more convincing manner, and found that KLRB1 mRNA level was consistently elevated in most cancers including ACC, BLCA, CESC, CHOL, COAD, ESCA, GBM, HNSC, KIRC, LAML, LGG, LUSC, OV, PAAD, PRAD, SKCM, STAD, TGCT, THCA, and UCS compared to GTEx normal controls (Figure 1B). To detect the CD161 protein expression profiles in human tissues, we evaluated it in various tumor and normal tissues using the HPA database. As showed in immunohistochemistry results (Figure 1C & D), CD161 protein was mainly distributed in cytoplasm or membrane, and was upregulated in several cancers such as glioma and lung cancer compared with corresponding normal tissues. Detailed information of IHC results was summarized in Table 1.
KLRB1/CD161 expression levels in different cancer types. (A) The expression level of KLRB1 mRNA between tumor and normal tissues in twenty cancer types based on the TCGA database. (B) The expression level of KLRB1 mRNA between tumor and normal tissues in twenty-seven cancer types based on the integrated database from TCGA and GTEx datasets. (C-F) Representative IHC images of CD161 expression in glioma, lung cancer, brain cortex, and normal lung tissues.
Clinical information and relative scores of immunohistochemistry results
| Protein | Tissue | Histological type | Age | Gender | Location | Quantity | Intensity | Relative score |
|---|---|---|---|---|---|---|---|---|
| CD161 | Glioma | Malignant glioma (High grade) | 47 | Male | C/M1 | > 75% | Moderate | 8 |
| CD161 | Lung cancer | Squamous cell carcinoma | 65 | Male | C/M1 | > 75% | Moderate | 8 |
| CD161 | Cerebral cortex | Glial cells | 64 | Female | C/M1 | < 25% | Weak | 1 |
| CD161 | Lung | Alveolar cells | 67 | Female | C/M1 | < 25% | Moderate | 2 |
1 C/M: Cytoplasmic/membranous.
The Association between KLRB1/CD161 Expression and Cancer Patient's Prognosis
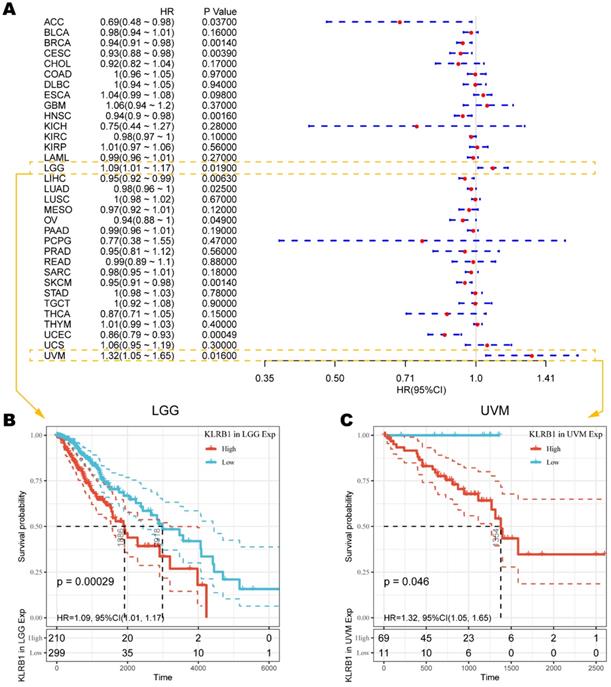
To understand how CD161 impacts patient prognosis, we used cox regression model based on TCGA RNA-seq and clinical data to analyze the prognosis of thirty-three TCGA cancer types. As shown in Figure 2A, elevated KLRB1 mRNA expression was significantly related to prolonged OS time in ACC (HR = 0.69, 95%CI = 0.48-0.98, P = 0.0370), BRCA (HR = 0.94, 95%CI = 0.91-0.98, P = 0.0014), CESC (HR = 0.93, 95%CI = 0.88-0.98, P = 0.0039), HNSC (HR = 0.94, 95%CI = 0.90-0.98, P = 0.0016), LIHC (HR = 0.95, 95%CI = 0.92-0.99, P = 0.0063), LUAD (HR = 0.98, 95%CI = 0.96-1.00, P = 0.0250), OV (HR = 0.94, 95%CI = 0.88-1.00, P = 0.0490), SKCM (HR = 0.95, 95%CI = 0.91-0.98, P = 0.0014), and UCEC (HR = 0.86, 95%CI = 0.79-0.93, P = 0.0005). On the contrary, increased KLRB1 mRNA level was uniquely associated with unfavorable outcome in LGG (HR = 1.09, 95%CI = 1.01-1.17, P = 0.0190) and UVM (HR = 1.32, 95%CI = 1.05-1.65, P = 0.0160), the Kaplan-Meier survival curves of which were displayed as Figure 2B. And the survival curves with significance were summarized in Figure S1.
Survival analysis comparing the high and low expression of KLRB1 on overall survival across different cancers in the TCGA dataset. (A) Forest plot displaying the impact of high expression of KLRB1 mRNA on OS across thirty-three cancer types. (B-C) The correlation between high KLRB1 mRNA expression and unfavorable prognosis in LGG and UVM cohorts.
High CD161 Expression Correlates with Immune Infiltration in LGG and UVM
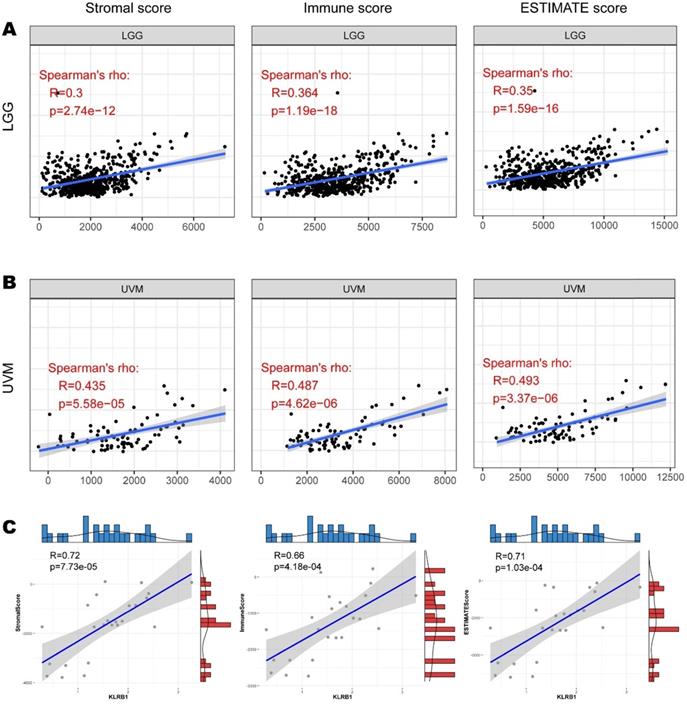
To explore whether CD161 affects the prognosis of patients with LGG or UVM via interventions in immune infiltration, we investigated the relationship between CD161 and tumor purity based on the ESTIMATE algorithm. CD161 expression was positively correlated with Stromal Score, Immune Score, and ESTIMATE Score in both LGG and UVM cohorts (Figure 3A & B). And the correlations between CD161 and those scores across TCGA cancer types were displayed in Figure S2-4. We next used our samples to investigate whether CD161 correlates with tumor purity within glioma. In consistent with the TCGA cohort, CD161 expression was significantly correlated to tumor purity, as it was positively associated with stromal, immune and ESTIMATE scores (Figure 3C).
Correlation between CD161 expression with immune abundance based on ESTIMATE algorithm. (A-B) The correlations between CD161 with Stromal Score, Immune Score, and Estimate Score in LGG and UVM were displayed as scatter plots. (C) The correlations between CD161 with Stromal Score, Immune Score, and Estimate Score in 24 glioma samples.
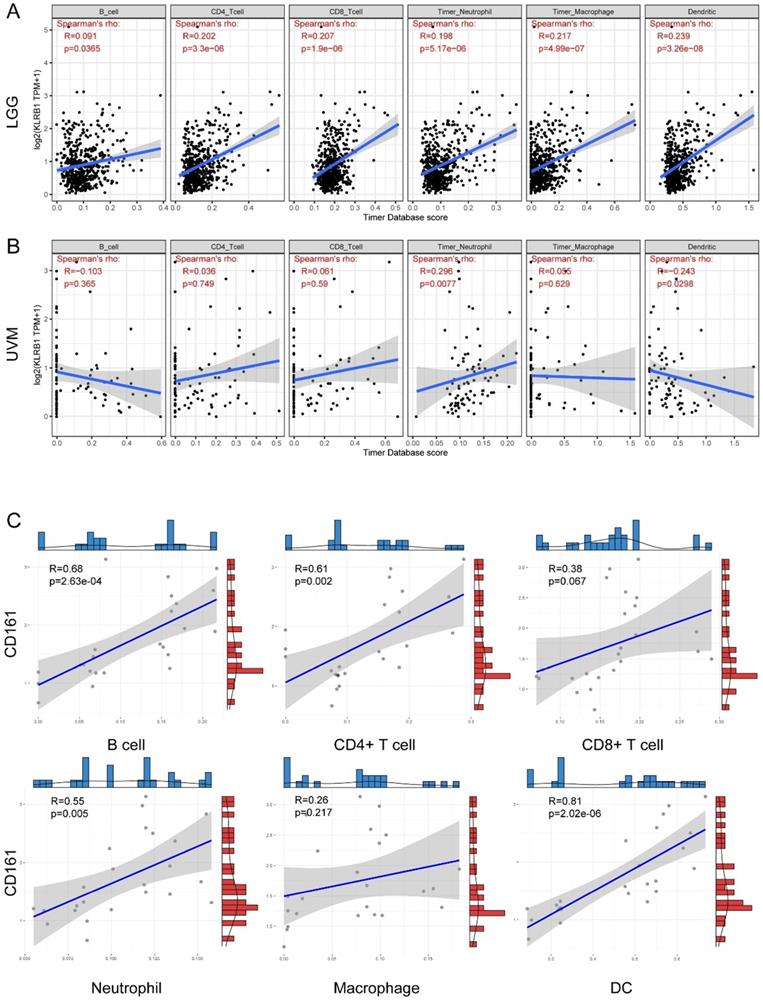
Regarding specific immune infiltrates. In general, CD161 expression was significantly and positively correlated with abundance of B cells, CD4+ T cells, CD8+ T cells, neutrophils, macrophages, and dendritic cells in LGG (Figure 4A). But positive correlations were only identified between CD161 expression and neutrophil infiltration in UVM (Figure 4B). In our samples, positive correlations were observed between CD161 expression and B cells, CD4+ T cells, neutrophils, and dendritic cells (Figure 4C), which was similar to the results obtained from the TCGA cohort.
Correlation between CD161 expression with six immune infiltration levels based on TIMER algorithm. (A-B) The correlations in LGG and UVM were displayed as scatter plots. (C) The correlations in 24 glioma samples.
Relationship between CD161 Expression with Immune Checkpoints, TMB, and MSI
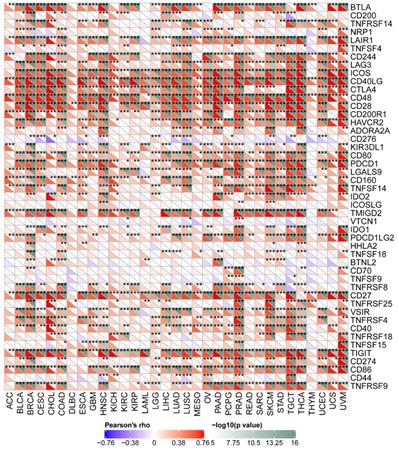
The pan-cancer correlations between CD161 and immune checkpoints were displayed in Figure 5. In most cancers, except ACC, DLBC, and THYM, robust and significant relationships existed between CD161 and recognized immune checkpoints including B- and T-lymphocyte attenuator (BTLA), CD244, inducible T cell costimulator (ICOS), CD40 ligand, CD48, CD28, CD200 receptor 1, transmembrane and immunoglobulin domain containing 2 (TMIGD2), CD27, TIGIT, and CD86. This suggested a potential synergy of CD161 with known immune checkpoints.
Correlation between CD161 expression with expressions of immune checkpoint genes across thirty-three cancer types (***P < 0.001).
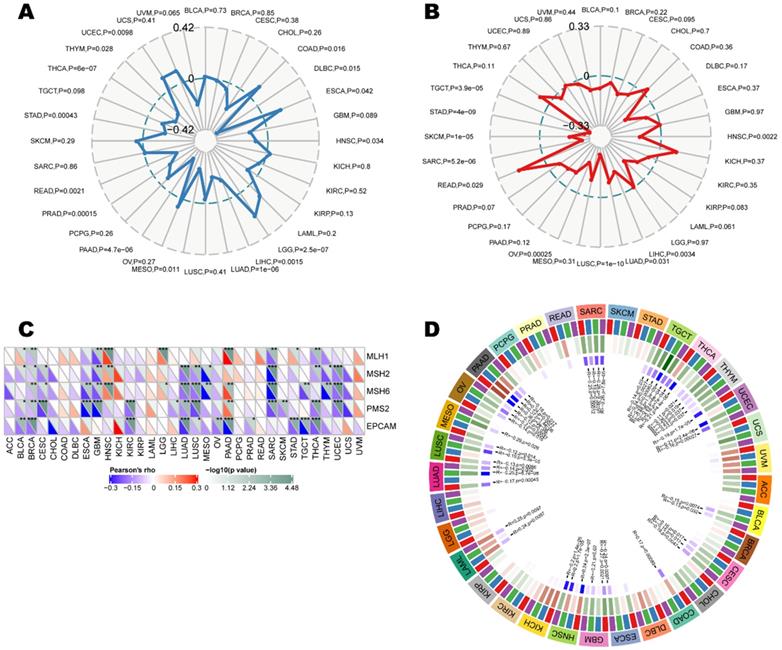
As indicators of a series of genomes or transcriptomes related to cancer initiation and development, tumor mutation burden, microsatellite instability, mismatch repair, and methylation were independent predictors of ICB efficacy. We herein examine the relationship between CD161 and those indicators to investigate whether CD161 affects tumorigenesis by participating in the process of genetic and/or transcriptional alterations. CD161 expression was negatively correlated with TMB in LUAD, PAAD, PRAD, STAD, and THCA (P < 0.001), while it was solely and positively correlated with TMB in LGG (P < 0.001) (Figure 6A). Moreover, MSI-low tumors expressed higher level of CD161 than genetically stable ones in LUSC, OV, SARC, SKCM, STAD and TGCT cohorts (P < 0.001, Figure 6B). In addition, we examined the correlation between CD161 expression and several essential MMR signatures. CD161 expression was positively correlated with MutL homolog 1 (MLH1), MutS homolog 2 (MSH2) and MutS homolog 6 (MSH6) in HNSC, LGG, and PAAD. In contrast, it was negatively correlated with these molecules in BLCA, BRCA, ESCA, GBM, LUAD, LUSC, SARC, THCA, and UCEC (Figure 6C). In terms of the relationship between CD161 expression and DNA methyltransferases, negative correlations were identified in BLCA, CESC, COAD, ESCA, GBM, HNSC, LAML, LUAD, LUSC, MESO, OV, PAAD, SARC, TGCT, THCA, THYM, and UCEC (Figure 6D). Despite the significances of these correlations, they were not such strong across all cancers with coefficients less than 0.6.
Correlations between CD161 expression with ICB efficacy predictors, including (A) tumor mutation burden, (B) microsatellite instability, (C) mismatch repair genes, as well as (D) DNA methyltransferases across thirty-three cancer types.
CD161 impacts Patient Prognosis via intervening in Tumor Immunity
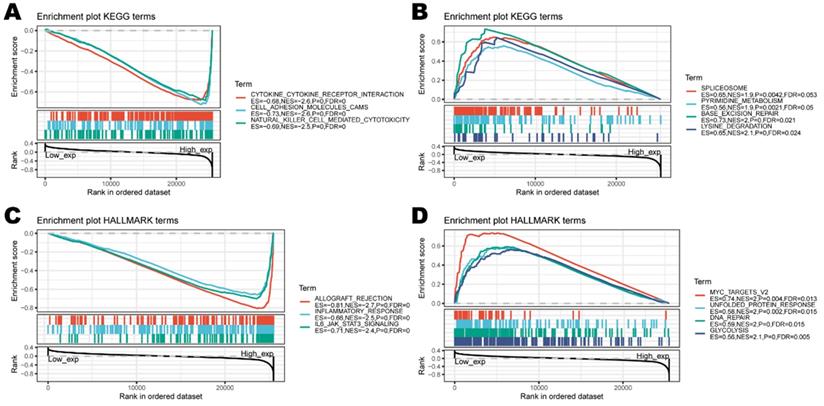
To investigate the biological characteristics associated with CD161 in LGG and UVM, where CD161 was a significant risk factor. We performed gene set enrichment analysis (GSEA) and found that CD161 was mostly associated with immune responses (Figure 7C). Specifically, enriched KEGG pathways included 'cytokine-cytokine receptor interaction' and 'NK cell mediated cytotoxicity'. Meanwhile, HALLMARK enrichment analysis showed similar results that CD161 was involved in several terms such as 'inflammatory response' and 'IL6-JAK-STAT3 signaling'. This indicates that CD161 is involved in the regulation process within immune responses across human cancers, highly suggesting that CD161 influences patient prognosis by intervening in the immuno-oncological processes.
Functional enrichment of KEGG and HALLMARK terms on CD161 through GSEA. (A-B) The top three negative and positive enriched KEGG terms. (C-D) The top three negative and positive enriched HALLMARK terms.
To clarify the specific cell types modulated by CD161 in tumor microenvironment, we summarized the correlations between CD161 expression and immune infiltrating levels in LGG and UVM based on sets of immunological markers using the TIMER2.0 database. We adjusted these results based on tumor purity, revealing strong and significant correlations between CD161 with CD8+ T cells, DCs, M2 macrophages, and Tex markers in both LGG and UVM cohorts (Table 2; Pearson's rho > 0.6, P < 0.001). Further re-examination using the GEPIA2 database revealed consistent results (Table 3).
Correlations between CD161 and immune cell markers in TIMER2.0 (***P < 0.001)
| Description | Markers | LGG (n = 516) | UVM (n = 80) | ||||||
|---|---|---|---|---|---|---|---|---|---|
| None | Purity | None | Purity | ||||||
| rho | P | rho | P | rho | P | rho | P | ||
| CD8+ T cell | CD8A | 0.558 | *** | 0.536 | *** | 0.693 | *** | 0.680 | *** |
| CD8B | 0.491 | *** | 0.448 | *** | 0.719 | *** | 0.716 | *** | |
| T cell (general) | CD3D | 0.741 | *** | 0.719 | *** | 0.685 | *** | 0.670 | *** |
| CD3E | 0.814 | *** | 0.802 | *** | 0.727 | *** | 0.716 | *** | |
| CD2 | 0.806 | *** | 0.792 | *** | 0.718 | *** | 0.708 | *** | |
| B cell | CD19 | 0.356 | *** | 0.310 | *** | 0.385 | *** | 0.360 | *** |
| CD79A | 0.322 | *** | 0.309 | *** | 0.329 | *** | 0.320 | *** | |
| Monocyte | CD86 | 0.425 | *** | 0.397 | *** | 0.747 | *** | 0.737 | *** |
| CD115 (CSF1R) | 0.264 | *** | 0.211 | *** | 0.543 | *** | 0.529 | *** | |
| TAM | CCL2 | 0.396 | *** | 0.373 | *** | 0.611 | *** | 0.598 | *** |
| CD68 | 0.453 | *** | 0.432 | *** | 0.285 | *** | 0.266 | *** | |
| IL10 | 0.425 | *** | 0.412 | *** | 0.583 | *** | 0.564 | *** | |
| M1 Macrophage | INOS (NOS2) | -0.092 | 0.037 | -0.093 | 0.042 | 0.167 | 0.138 | 0.146 | 0.205 |
| IRF5 | 0.371 | *** | 0.335 | *** | 0.595 | *** | 0.575 | *** | |
| COX2 (PTGS2) | 0.211 | *** | 0.181 | *** | 0.350 | *** | 0.332 | *** | |
| M2 Macrophage | CD163 | 0.450 | *** | 0.450 | *** | 0.668 | *** | 0.654 | *** |
| VSIG4 | 0.274 | *** | 0.238 | *** | 0.613 | *** | 0.599 | *** | |
| MS4A4A | 0.452 | *** | 0.452 | *** | 0.724 | *** | 0.712 | *** | |
| Neutrophils | CD66b (CEACAM8) | -0.011 | 0.801 | -0.016 | 0.723 | NA | NA | NA | NA |
| CD11b (ITGAM) | 0.349 | *** | 0.311 | *** | 0.471 | *** | 0.487 | *** | |
| CCR7 | 0.552 | *** | 0.534 | *** | 0.769 | *** | 0.762 | *** | |
| NK cell | KIR2DL1 | 0.159 | *** | 0.169 | *** | 0.349 | *** | 0.368 | *** |
| KIR2DL3 | 0.308 | *** | 0.313 | *** | 0.450 | *** | 0.421 | *** | |
| KIR2DL4 | 0.377 | *** | 0.382 | *** | 0.509 | *** | 0.484 | *** | |
| KIR3DL1 | 0.235 | *** | 0.231 | *** | 0.420 | *** | 0.391 | *** | |
| KIR3DL2 | 0.209 | *** | 0.238 | *** | 0.603 | *** | 0.585 | *** | |
| KIR3DL3 | -0.009 | 0.836 | 0.000 | 0.998 | 0.373 | *** | 0.334 | *** | |
| KIR2DS4 | 0.343 | *** | 0.333 | *** | 0.300 | *** | 0.266 | *** | |
| Dendritic cell | HLA-DPB1 | 0.625 | *** | 0.615 | *** | 0.661 | *** | 0.648 | *** |
| HLA-DQB1 | 0.527 | *** | 0.520 | *** | 0.605 | *** | 0.584 | *** | |
| HLA-DRA | 0.613 | *** | 0.604 | *** | 0.713 | *** | 0.700 | *** | |
| HLA-DPA1 | 0.620 | *** | 0.614 | *** | 0.657 | *** | 0.641 | *** | |
| BCDA-1 (CD1C) | 0.440 | *** | 0.416 | *** | 0.554 | *** | 0.541 | *** | |
| BDCA-4 (NRP1) | 0.378 | *** | 0.405 | *** | 0.547 | *** | 0.524 | *** | |
| CD11c (ITGAX) | 0.304 | *** | 0.268 | *** | 0.549 | *** | 0.530 | *** | |
| Th1 | TBX21 | 0.519 | *** | 0.524 | *** | 0.706 | *** | 0.696 | *** |
| STAT4 | 0.146 | *** | 0.116 | *** | 0.488 | *** | 0.479 | *** | |
| STAT1 | 0.393 | *** | 0.394 | *** | 0.505 | *** | 0.482 | *** | |
| IFN-γ (IFNG) | 0.337 | *** | 0.310 | *** | 0.514 | *** | 0.503 | *** | |
| TNF-α (TNF) | 0.150 | *** | 0.119 | *** | 0.619 | *** | 0.608 | *** | |
| Th2 | GATA3 | 0.450 | *** | 0.413 | *** | 0.625 | *** | 0.618 | *** |
| STAT6 | 0.377 | *** | 0.343 | *** | 0.191 | 0.089 | 0.162 | 0.158 | |
| STAT5A | 0.354 | *** | 0.310 | *** | 0.061 | 0.588 | 0.083 | 0.471 | |
| IL13 | -0.092 | 0.037 | -0.075 | 0.100 | 0.086 | 0.447 | 0.034 | 0.768 | |
| Tfh | BCL6 | -0.165 | *** | -0.141 | *** | 0.213 | 0.058 | 0.234 | *** |
| IL21 | 0.078 | 0.078 | 0.075 | 0.101 | 0.322 | *** | 0.274 | *** | |
| Th17 | STAT3 | 0.280 | *** | 0.283 | *** | 0.282 | *** | 0.253 | *** |
| IL17A | 0.065 | 0.138 | 0.057 | 0.214 | NA | NA | NA | NA | |
| Treg | FOXP3 | 0.009 | 0.831 | 0.014 | 0.758 | 0.458 | *** | 0.430 | *** |
| CCR8 | 0.259 | *** | 0.274 | *** | 0.428 | *** | 0.394 | *** | |
| STAT5B | -0.177 | *** | -0.111 | *** | 0.266 | *** | 0.251 | *** | |
| TGFβ (TGFB1) | 0.285 | *** | 0.242 | *** | 0.440 | *** | 0.419 | *** | |
| Tex | PD-1 (PDCD1) | 0.528 | *** | 0.512 | *** | 0.666 | *** | 0.660 | *** |
| CTLA4 | 0.467 | *** | 0.432 | *** | 0.555 | *** | 0.534 | *** | |
| LAG3 | 0.282 | *** | 0.304 | *** | 0.593 | *** | 0.577 | *** | |
| TIM-3 (HAVCR2) | 0.421 | *** | 0.396 | *** | 0.734 | *** | 0.723 | *** | |
| GZMB | 0.516 | *** | 0.523 | *** | 0.652 | *** | 0.643 | *** | |
| FDC | BAFF (TNFSF13B) | 0.312 | *** | 0.014 | 0.758 | 0.642 | *** | 0.430 | *** |
| CD35 (CR1) | 0.330 | *** | 0.287 | *** | 0.689 | *** | 0.680 | *** | |
| CD21 (CR2) | 0.068 | 0.125 | 0.010 | 0.829 | 0.272 | 0.015 | 0.246 | 0.031 | |
| CD44 | 0.382 | *** | 0.353 | *** | -0.003 | 0.976 | 0.032 | 0.886 | |
| CD29 (ITGB1) | 0.373 | *** | 0.379 | *** | 0.117 | 0.303 | 0.111 | 0.337 | |
Correlations between CD161 and markers of CD8+ T cell, general T cell, M2 Macrophage, DC, Th1, and Treg in GEPIA2 (***P < 0.001)
| Description | Markers | LGG | UVM | ||
|---|---|---|---|---|---|
| Tumor | Tumor | ||||
| R | P | R | P | ||
| CD8+ T cell | CD8A | 0.56 | *** | 0.72 | *** |
| CD8B | 0.51 | *** | 0.74 | *** | |
| T cell (general) | CD3D | 0.75 | *** | 0.72 | *** |
| CD3E | 0.84 | *** | 0.75 | *** | |
| CD2 | 0.81 | *** | 0.75 | *** | |
| M2 Macrophage | CD163 | 0.49 | *** | 0.74 | *** |
| VSIG4 | 0.29 | *** | 0.62 | *** | |
| MS4A4A | 0.46 | *** | 0.73 | *** | |
| DC | HLA-DPB1 | 0.62 | *** | 0.67 | *** |
| HLA-DRA | 0.61 | *** | 0.75 | *** | |
| HLA-DPA1 | 0.61 | *** | 0.68 | *** | |
| Th1 | TBX21 | 0.54 | *** | 0.73 | *** |
| TNF-α (TNF) | 0.16 | *** | 0.60 | *** | |
| Treg | PD-1 (PDCD1) | 0.54 | *** | 0.67 | *** |
| CTLA4 | 0.47 | *** | 0.55 | *** | |
| LAG3 | 0.27 | *** | 0.62 | *** | |
| TIM-3 (HAVCR2) | 0.42 | *** | 0.77 | *** | |
| GZMB | 0.55 | *** | 0.69 | *** | |
Discussion
In this report, we assessed the expression of CD161 in 33 different cancer types, revealing clear differences of pan-cancer CD161 expression between tumor and normal tissues. Analysis based on TCGA and GTEx data showed that CD161 expression was increased in most cancers including ACC, BLCA, CESC, CHOL, COAD, ESCA, GBM, HNSC, KIRC, LAML, LGG, LUSC, OV, PAAD, PRAD, SKCM, STAD, TGCT, THCA, and UCS compared with adjacent normal controls. Mainly expressed on NK cells, CD161 expression level may reflect the abundance of these two immune infiltrates in tumor microenvironment indirectly. And we suppose that CD161 plays a delicate role in tumorigenesis based on the differential expression profiles.
Although new therapies, such as targeted therapy and immunotherapy, have encouraging great success, current management of cancer like glioma cannot reach a favorable remission [29]. Several identified genetic and/or transcriptional indicators including IDH mutation, O-6-methylguanine-DNA methyltransferase (MGMT) promoter methylation, and 1p/19q co-deletion were found to be closely related to glioma prognosis [30]. Much like those indicators, our analyses demonstrated the potential of CD161 in risk stratification and prognostic prediction. And similar to PD-1/PD-L1 axis, CD161/CLEC2D pathway was suggested to mediate immune response in the oncologic context. Moreover, the significant correlation between elevated CD161 expression and worse prognosis in patients with LGG or UVM is similar to that of CD96 [31], another promising immune checkpoint.
Another key finding of this study is that the CD161 expression is highly associated with immune infiltration. CD161 expression is positively correlated with the abundance of immune infiltrates, especially CD8+ T cells, DCs, macrophages, Tregs and Tfh in various cancers. These results were validated using our own samples obtained from Xiangya hospital. But further work will be necessary to establish whether CD161 exerts such functions. CD161 can affect patient prognosis by influencing immune processes, as CD161 was involved in the several immune terms (KEGG and HALLMARK) in LGG and UVM. Notably, CD161 was positively associated with markers of general T cell, DC, and exhausted T cell, suggesting CD161 impacted patient survival in an immunity-depended manner. Although the distinct infiltration landscape in different tumors may influence our results, it is reasonable to speculate that CD161 can influence the path of immune infiltrates in tumor microenvironment, and may alter the distribution and subsequent interplays with malignancies, leading to different survival outcomes in certain cancers.
The study has some limitations. First, there is no experimental validation of the predicted outcomes. Further studies should conduct the experimental validation by different methods, e.g., fluorescence quantitative polymerase chain reaction (qPCR), western blotting and immunocytochemistry. In addition, for diseases with long-term evolution, especially cancers. At least in some stages, transcriptomic profiles do not necessarily reflect the proteomics. Although we compared the differences in CD161 expression between cancer and normal tissues at the mRNA and protein levels, it remains debatable whether the differences in the proteins are necessarily associated with the malignancy of cancers. Moreover, although we conducted validation using our own samples, the correlations obtained in this study may not be applicable in other study cohorts due to the high heterogeneity across different populations. Therefore, experimental and clinical validations of the predicted results are required.
In conclusion, we applied an integrated bioinformatics approach, indicating that CD161 could mediate immune infiltration and influence patient prognosis in pan-cancer. Our findings demonstrate that CD161 has potential as a prognostic biomarker and provide a new orientation for the treatment of these malignancies. We believe that immunotherapy combining CD161 blockade and existing checkpoint inhibitors may be a highly effective and feasible approach against these unpleasing tumors, especially brain gliomas for which CD161 is a unique risk factor.
Abbreviations
NK cell: natural killer cell; OS: overall survival; DC: dendric cell; Tex: exhausted T cell; CTLA-4: cytotoxic T lymphocyte associated protein 4; PD-1: programmed death-1; ICB: immune checkpoint blockade; KLRB1: killer cell lectin-like receptor subfamily B member 1; RNA-seq: RNA sequencing; NSCLC: non-small cell lung cancer; TCGA: The Cancer Genome Atlas; FPKM: fragments per kilobase million; TPM: transcripts per kilobase million; GTEx: genotype-tissue expression; HPA: Human Protein Atlas; HR: hazard ratio; 95%CI: 95% confidence interval; TMB: tumor mutation burden; MSI: microsatellite instability; MMR: mismatch repair; TIMER: Tumor IMmune Estimation Resource; TAM: tumor-associated macrophage; Th: helper T cell; GEPIA: Gene Expression Profiling Interactive Analysis; ANOVA: analysis of variance; BTLA: B- and T-lymphocyte attenuator; ICOS: inducible T cell costimulator; TMIGD2: transmembrane and immunoglobulin domain containing 2; MLH: MutL homolog; MSH: MutS homolog; GSEA: gene set enrichment analysis; MGMT: O-6-methylguanine-DNA methyltransferase; qPCR: quantitative polymerase chain reaction; ACC: adrenocortical carcinoma; BLCA: bladder urothelial carcinoma; BRCA: breast invasive carcinoma; CESC: cervical squamous cell carcinoma; CHOL: cholangiocarcinoma; COAD: colon adenocarcinoma; DLBC: diffuse large B-cell lymphoma; ESCA: esophageal carcinoma; GBM: glioblastoma multiforme; HNSC: head and neck squamous cell carcinoma; KIRC: kidney renal clear cell carcinoma; KIRP: kidney renal papillary cell carcinoma; LAML: acute myeloid leukemia; LGG: brain lower grade glioma; LIHC: liver hepatocellular carcinoma; LUSC: lung squamous cell carcinoma; MESO: mesothelioma; OV: ovarian serous cystadenocarcinoma; PAAD: pancreatic adenocarcinoma; PCPG: pheochromocytoma and paraganglioma; PRAD: prostate adenocarcinoma; READ: rectum adenocarcinoma; SARC: sarcoma; SKCM: skin cutaneous melanoma; STAD: stomach adenocarcinoma; TGCT: testicular germ cell tumor; THCA: thyroid carcinoma; THYM: thymoma; UCEC: uterine corpus endometrial carcinoma; UCS: uterine carcinosarcoma; UVM: uveal melanoma.
Supplementary Material
Supplementary figures and table.
Acknowledgements
The research was funded by the National Natural Science Foundation of China under grant no. 82001223, the National Natural Science Foundation of China under grant no. 81901401, and the Natural Science Foundation for Young Scientist of Hunan Province, China (Grant No. 2019JJ50952).
Competing Interests
The authors have declared that no competing interest exists.
References
1. Tang J, Pearce L, O'Donnell-Tormey J, Hubbard-Lucey VM. Trends in the global immuno-oncology landscape. Nature reviews Drug discovery. 2018;17:783-4
2. Xin Yu J, Hubbard-Lucey VM, Tang J. Immuno-oncology drug development goes global. Nature reviews Drug discovery. 2019;18:899-900
3. Litak J, Mazurek M, Grochowski C, Kamieniak P, Roliński J. PD-L1/PD-1 Axis in Glioblastoma Multiforme. International journal of molecular sciences. 2019;20(21):5347
4. Wessely A, Steeb T, Erdmann M, Heinzerling L, Vera J, Schlaak M. et al. The Role of Immune Checkpoint Blockade in Uveal Melanoma. International journal of molecular sciences. 2020;21(3):879
5. Xin Yu J, Hodge JP, Oliva C, Neftelinov ST, Hubbard-Lucey VM, Tang J. Trends in clinical development for PD-1/PD-L1 inhibitors. Nature reviews Drug discovery. 2020;19:163-4
6. Lanier LL, Chang C, Phillips JH. Human NKR-P1A. A disulfide-linked homodimer of the C-type lectin superfamily expressed by a subset of NK and T lymphocytes. Journal of immunology (Baltimore, Md: 1950). 1994;153:2417-28
7. Fergusson JR, Smith KE, Fleming VM, Rajoriya N, Newell EW, Simmons R. et al. CD161 defines a transcriptional and functional phenotype across distinct human T cell lineages. Cell reports. 2014;9:1075-88
8. Mathewson ND, Ashenberg O, Tirosh I, Gritsch S, Perez EM, Marx S. et al. Inhibitory CD161 receptor identified in glioma-infiltrating T cells by single-cell analysis. Cell. 2021;184:1281-98.e26
9. Jerby-Arnon L, Shah P, Cuoco MS, Rodman C, Su MJ, Melms JC. et al. A Cancer Cell Program Promotes T Cell Exclusion and Resistance to Checkpoint Blockade. Cell. 2018;175:984-97.e24
10. Guo X, Zhang Y, Zheng L, Zheng C, Song J, Zhang Q. et al. Global characterization of T cells in non-small-cell lung cancer by single-cell sequencing. Nature medicine. 2018;24:978-85
11. Zheng C, Zheng L, Yoo JK, Guo H, Zhang Y, Guo X. et al. Landscape of Infiltrating T Cells in Liver Cancer Revealed by Single-Cell Sequencing. Cell. 2017;169:1342-56.e16
12. Zhang L, Yu X, Zheng L, Zhang Y, Li Y, Fang Q. et al. Lineage tracking reveals dynamic relationships of T cells in colorectal cancer. Nature. 2018;564:268-72
13. Goldman MJ, Craft B, Hastie M, Repečka K, McDade F, Kamath A. et al. Visualizing and interpreting cancer genomics data via the Xena platform. Nature biotechnology. 2020;38:675-8
14. Burgess DJ. Reaching completion for GTEx. Nature reviews Genetics. 2020;21:717
15. Uhlen M, Zhang C, Lee S, Sjöstedt E, Fagerberg L, Bidkhori G. et al. A pathology atlas of the human cancer transcriptome. Science (New York, NY). 2017;357(6352):eaan2507
16. Sun BB, Maranville JC, Peters JE, Stacey D, Staley JR, Blackshaw J. et al. Genomic atlas of the human plasma proteome. Nature. 2018;558:73-9
17. Marin-Acevedo JA, Dholaria B, Soyano AE, Knutson KL, Chumsri S, Lou Y. Next generation of immune checkpoint therapy in cancer: new developments and challenges. Journal of hematology & oncology. 2018;11:39
18. Baretti M, Le DT. DNA mismatch repair in cancer. Pharmacology & therapeutics. 2018;189:45-62
19. Zhao P, Li L, Jiang X, Li Q. Mismatch repair deficiency/microsatellite instability-high as a predictor for anti-PD-1/PD-L1 immunotherapy efficacy. Journal of hematology & oncology. 2019;12:54
20. Yarchoan M, Hopkins A, Jaffee EM. Tumor Mutational Burden and Response Rate to PD-1 Inhibition. The New England journal of medicine. 2017;377:2500-1
21. Samstein RM, Lee CH, Shoushtari AN, Hellmann MD, Shen R, Janjigian YY. et al. Tumor mutational load predicts survival after immunotherapy across multiple cancer types. Nature genetics. 2019;51:202-6
22. Catania S, Dumesic PA, Pimentel H, Nasif A, Stoddard CI, Burke JE. et al. Evolutionary Persistence of DNA Methylation for Millions of Years after Ancient Loss of a De Novo Methyltransferase. Cell. 2020;180:263-77.e20
23. Li T, Fan J, Wang B, Traugh N, Chen Q, Liu JS. et al. TIMER: A Web Server for Comprehensive Analysis of Tumor-Infiltrating Immune Cells. Cancer research. 2017;77:e108-e10
24. Li T, Fu J, Zeng Z, Cohen D, Li J, Chen Q. et al. TIMER2.0 for analysis of tumor-infiltrating immune cells. Nucleic acids research. 2020;48:W509-w14
25. Llibre A, López-Macías C, Marafioti T, Mehta H, Partridge A, Kanzig C. et al. LLT1 and CD161 Expression in Human Germinal Centers Promotes B Cell Activation and CXCR4 Downregulation. Journal of immunology (Baltimore, Md: 1950). 2016;196:2085-94
26. El Shikh ME, Pitzalis C. Follicular dendritic cells in health and disease. Frontiers in immunology. 2012;3:292
27. Tang Z, Li C, Kang B, Gao G, Li C, Zhang Z. GEPIA: a web server for cancer and normal gene expression profiling and interactive analyses. Nucleic acids research. 2017;45:W98-w102
28. Tang Z, Kang B, Li C, Chen T, Zhang Z. GEPIA2: an enhanced web server for large-scale expression profiling and interactive analysis. Nucleic acids research. 2019;47:W556-w60
29. Desland FA, Hormigo A. The CNS and the Brain Tumor Microenvironment: Implications for Glioblastoma Immunotherapy. International journal of molecular sciences. 2020;21(19):7358
30. Chen X, Yan Y, Zhou J, Huo L, Qian L, Zeng S. et al. Clinical prognostic value of isocitrate dehydrogenase mutation, O-6-methylguanine-DNA methyltransferase promoter methylation, and 1p19q co-deletion in glioma patients. Annals of translational medicine. 2019;7:541
31. Ye W, Luo C, Liu F, Liu Z, Chen F. CD96 Correlates With Immune Infiltration and Impacts Patient Prognosis: A Pan-Cancer Analysis. Frontiers in oncology. 2021;11:634617
Author contact
![]() Corresponding author: Fangkun Liu M.D. & Ph.D., Department of Neurosurgery, Xiangya Hospital, Central South University. E-mail: liufangkunedu.cn.
Corresponding author: Fangkun Liu M.D. & Ph.D., Department of Neurosurgery, Xiangya Hospital, Central South University. E-mail: liufangkunedu.cn.