Impact Factor ISSN: 1837-9664

 Global reach, higher impact
J Cancer 2021; 12(23):6964-6978. doi:10.7150/jca.63625 This issue Cite
Research Paper
CKS2 Overexpression Correlates with Prognosis and Immune Cell Infiltration in Lung Adenocarcinoma: A Comprehensive Study based on Bioinformatics and Experiments
Zhiping Wang#, Mengyan Zhang#, Yahua Wu, Yilin Yu, Qunhao Zheng, Jiancheng Li ![]()
Fujian Medical University Cancer Hospital, Fujian Cancer Hospital, Fuzhou, Fujian, China.
#These authors contributed equally to this work.
Received 2021-6-7; Accepted 2021-9-22; Published 2021-10-11
Abstract

Objective: Cyclin-dependent kinase regulatory subunit 2 (CKS2) plays a vital role in regulation of the cell cycle and cancer progression. However, the role of CKS2 in lung adenocarcinoma (LUAD) remains unkonwn. Here, we examined the prognostic value and biological functions of CKS2 in LUAD by using omics data of 1,235 LUAD samples from TCGA, GEO, and our own cohort as well as data of in vitro experiments.
Methods: Kaplan-Meier was conducted to evaluate the prognostic value of CKS2 expression. The association between CKS2 expression level and tumor immune infiltration was explored using the single-sample Gene Set Enrichment Analysis (ssGSEA) and TIMER database. Functional enrichment analyses were performed to annotate the biological functions of CKS2 in LUAD. Furthermore, a series of in vitro experiments and immunohistochemistry were performed for validation.
Results: CKS2 overexpression was correlated with the advanced stage, TP53 status, PD-L1 expression, and DNA hypomethylation. Moreover, patients with LUAD and high CKS2 expression exhibited poor overall survival. Functional enrichment analysis indicated that CKS2 was involved in cell division, cell cycle, DNA replication. Experiments in vitro indicated that CKS2 knockdown decreased the invasion and proliferation of LUAD cells and facilitated their apoptosis. ssGSEA and TIMER analysis revealed a negative correlation between CKS2 expression and the immune cell infiltration.
Conclusions: In summary, High CKS2 expression was associated with poor prognosis and low levels of infiltrating immune cells in LUAD as well as with malignant phenotypes. Therefore, CKS2 may be a promising prognostic biomarker and therapeutic target in LUAD.
Keywords: CKS2, lung adenocarcinoma, biomarker, immune infiltration, prognosis, proliferation
Introduction
Lung cancer, the most common human malignancy globally, is the leading cause of cancer-related deaths and a huge threat to human health [1]. Non-small cell lung cancer (NSCLC) is classified into lung adenocarcinoma (LUAD), lung squamous cell carcinoma, and large cell lung carcinoma according to the histological type. Of these types, LUAD accounts for ~40% of the total number of lung cancer cases annually [2]. Because lung cancer initially develops without obvious clinical signs, most patients with NSCLC are not diagnosed until they reach locally advanced or extensive metastatic stages; this complicates treatment, leading to a poor 5-year overall survival (OS) rate of only 18% [3, 4]. Despite remarkable advances in the multimodal treatments, including targeted therapies, chemotherapy, as well as radiation therapy, the prognosis of patients with advanced-stage lung cancer remains far from satisfactory. Therefore, identifying effective biomarkers for accurate prediction of the patient's prognosis and/or response to an individualized therapy is important for reducing the mortality rate of patients with lung cancer.
Numerous studies have recently highlighted the importance of the tumor microenvironment in tumor development. In particular, the tumor immune microenvironment (TIM) is considered to be a crucial factor affecting tumor progression and therapeutic response [5]. Thus, targeted modulation of TIM parameters may relieve clinical symptoms and improve prognosis of patients with LUAD [6]. In addition, recent immunotherapies, such as programmed death-1 receptor (PD-1)/programmed death ligand-1 (PD-L1) pathway blockade, have demonstrated promising effects in various cancers, including NSCLC [7]. However, there are few predictive biomarkers to identify patients who can benefit from immunotherapy. Therefore, in the era of precision medicine, it is necessary to elucidate the association between LUAD and the TIM and to identify novel reliable immune-related biomarkers that can predict the prognosis of lung cancer and serve as targets for immunotherapy.
Cyclin-dependent kinase regulatory subunits 1 (CKS1) and 2 (CKS2) belong to a family of highly conserved small (9 KDa) cyclin-dependent kinase (CDK)-binding proteins that play an important role in regulation of the cell cycle [8, 9]. Previous studies have shown that CKS2 may play a key role in somatic cell division and early embryonic development [10]. Furthermore, multiple lines of evidence suggest that CKS2 is abnormally expressed in several types of tumors, including esophageal cancer, breast cancer, and ovarian cancer, and is involved in tumor progression [11-13]. However, the specific biological role and prognostic value of CKS2 in LUAD remain unknown.
In our study, we sought to investigate the relationship between CKS2 expression and the TIM as well as CKS2 function and prognostic value in LUAD. Therefore, we evaluated the prognostic value of CKS2 expression in LUAD using patient data from The Cancer Genome Atlas (TCGA), Gene Expression Omnibus, and our own cohort. To understand the biological functions of CKS2, we performed Gene Ontology (GO) analysis, Kyoto Encyclopedia of Genes and Genomes (KEGG) analysis, and Gene Set Enrichment Analysis (GSEA). Furthermore, in vitro functional experiments were conducted to verify the results of the bioinformatic analyses. In addition, the relationship between the methylation status and CKS2 expression was analyzed using bioinformatic tools. Finally, the correlation between CKS2 expression and the level of immune cell infiltration was analyzed using the single-sample Gene Set Enrichment Analysis (ssGSEA) and Tumor Immune Estimation Resource (TIMER) database.
Materials and methods
Data sources
RNA-seq fragments per kilobase of transcript per million reads mapped (FPKM) of LUAD samples with clinical data were downloaded from TGCA. RNA-seq samples without clinical data were excluded, and a total of 513 samples were then subjected to further analysis by transforming level 3 HTSeq-FPKM data into transcripts per million (TPM) reads. The GES72094 and GSE31210 databases were downloaded from the National Center for Biotechnology Information (https://www.ncbi.nlm.nih.gov/) for comparison with TCGA dataset. Unavailable or unknown clinical data for individuals were regarded as missing values. The detailed clinical information regarding all samples from TCGA are summarized in Table 1. Our set of 98 LUAD specimens and 82 adjacent normal tissues (Tissue chips: HLugA180Su07) was purchased from Outdo Biotech Ltd (Shanghai, China) and used to further verify CKS2 protein expression and its prognostic value in LUAD. The detailed clinical characteristics of our cohort are shown in Table 3.
Demographic and clinical characteristics of LUAD patients in TCGA
| Characteristics | level | Overall |
|---|---|---|
| n | 513 | |
| T stage (%) | T1 | 168 (32.9%) |
| T2 | 276 (54.1%) | |
| T3 | 47 (9.2%) | |
| T4 | 19 (3.7%) | |
| N stage (%) | N0 | 330 (65.9%) |
| N1 | 95 (19.0%) | |
| N2 | 74 (14.8%) | |
| N3 | 2 (0.4%) | |
| M stage (%) | M0 | 344 (93.2%) |
| M1 | 25 (6.8%) | |
| Pathological stage (%) | Stage I | 274 (54.3%) |
| Stage II | 121 (24.0%) | |
| Stage III | 84 (16.6%) | |
| Stage IV | 26 (5.1%) | |
| Gender (%) | Female | 276 (53.8%) |
| Male | 237 (46.2%) | |
| Race (%) | Asian | 7 (1.6%) |
| Black or African American | 52 (11.7%) | |
| White | 387 (86.8%) | |
| Smoker (%) | No | 74 (14.8%) |
| Yes | 425 (85.2%) | |
| TP53 status (%) | Mut | 241 (47.4%) |
| WT | 267 (52.6%) | |
| Age (%) | ≤65 | 238 (48.2%) |
| >65 | 256 (51.8%) | |
| CKS2 expression | Low | 257 (50.1%) |
| High | 256 (49.9%) |
Demographic and clinical characteristics of LUAD patients in our cohort
| Characteristics | Level | Overall |
|---|---|---|
| n | 98 | |
| T stage (%) | T1 | 20 (20.4%) |
| T2 | 50 (51.0%) | |
| T3 | 21 (21.4%) | |
| T4 | 5 (5.1%) | |
| N stage (%) | N0 | 45 (45.9%) |
| N1 | 18 (18.4%) | |
| N2 | 14 (14.3%) | |
| N3 | 6 (6.1%) | |
| M stage (%) | M0 | 97 (99%) |
| M1 | 1 (1%) | |
| Clinical stage (%) | Stage I | 33 (32.7%) |
| Stage II | 20 (20.4%) | |
| Stage III | 29 (29.6%) | |
| Stage IV | 1 (1%) | |
| Gender (%) | Female | 43 (43.9%) |
| Male | 55 (56.1%) | |
| Age (%) | ≤65 | 70 (71.4%) |
| >65 | 28 (28.6%) | |
| PD-L1 positive | <5% | 32 (32.7%) |
| rate (%) | ≥5% | 52 (53.1%) |
| CD8 positive | <5% | 27 (27.6%) |
| rate (%) | ≥5% | 47 (48%) |
| Staining score of | ≤1 | 46 (46.9%) |
| CKS2 | >1 | 52 (53.1%) |
Analysis of co-expressed and differentially expressed genes
The genes that were co-expressed with CKS2, based on TCGA data, were identified using the R software (v.3.6.2). Spearman correlation was employed to investigate the association between CKS2 and the co-expressed genes. |r| >0.5 and P <0.001 represented a significant correlation between CKS2 and the co-expressed genes. Based on the gene expression count of LUAD samples, the patients were divided into high and low expression groups, with the median as the cut-off value. Differentially expressed genes in the HTSeq-TPM dataset were analyzed using the DESeq2 package [14]. Log fold change (logFC) >1 and corrected P <0.01were set as the threshold of differential genes. The data of the differentially expressed and co-expressed genes were visualized using heat maps and volcano plots.
GO and KEGG enrichment analyses
Metascape (http://metascape.org), an excellent gene list analysis tool for gene annotation and analysis, can be used to perform GO and KEGG enrichment analysis [15]. Genes that were co-expressed with CKS2 (|r| > 0.5, P < 0.001) and differentially expressed between the high and low expression groups (adjusted P value < 0.01, |logFC| >1) simultaneously were regarded as CKS2 related genes, which were uploaded to the Metascape online tool for GO and KEGG enrichment analyses. P <0.01, minimum count >3, and enrichment factor >1.5 were considered significant.
GSEA
To assess the significance of differences in the signaling pathway components between groups with high and low CKS2 expression, GSEA of CKS2 expression data from TCGA was performed using clusterProfiler package (3.8.0) in R software [16]. The enrichment was classified as significant if |NES| > 1 and P value < 0.05.
Immune infiltration analysis using ssGSEA and TIMER
ssGSEA was performed using the GSVA package in R to classify marker gene sets in a single sample with physiological and biological function and chromosomal localization and to predict the level of infiltration of immune cells in tumor samples based on the signature genes of 24 types of immunocytes [17]. The Spearman correlation between CKS2 expression and 24 types of immune cells was evaluated, and the association between the infiltration of immune cells and CKS2 expression was studied. Significant results (P value < 0.01, |r|> 0.1) were displayed using a lollipop plot. Furthermore, the TIMER online tool (https://cistrome.shinyapps.io/timer/) [18] was applied to validate the correlation between CKS2 expression and the level of immune cell infiltration.
Analysis of methylation and copy number variation levels
The methylation and copy number variation (CNV) data for CKS2 were downloaded from the cBioPortal web platform (https://www.cbioportal.org/) [19]. CKS2 expression in different CKS2 CNV groups was compared using the Kruskal-Wallis test. The Spearman correlation test was used to explore the association between the CKS2 methylation level and expression. In addition, the SMART web platform (http://www.bioinfo-zs.com/smartapp/) [20] was used to analyze and compare the methylation level of CKS2 through pan-cancer analysis of TCGA data.
Immunohistochemistry
Immunohistochemistry was conducted to determine CKS2 protein expression and its prognostic value. The tissue chips were stained by immunohistochemistry with anti-human CKS2 (Abcam, United Kingdom), followed by HRP secondary antibody and DAB treatment. Then, the samples were observed under a microscope and photographed for further analysis.
The staining results were scored based on the staining intensity and fraction of positive cells (staining score = staining intensity score × fraction of positive cell score). The staining intensity was scored as 0 (negative), 1 (weak), 2 (medium), or 3 (strong). The fraction of positive cells was scored as 0 (≤10%), 1 (11%-25%), 2 (26%-50%), 3 (51%-80%), or 4 (≥81%). The staining score of each sample was evaluated independently by two experienced pathologists.
Cell lines and transfection
Human lung carcinoma A549 and H1299 cell lines were purchased from the American Type Culture Collection (Manassas, VA, USA). A549 cells were cultured in F12K medium supplemented with 10% fetal bovine serum (FBS), 100 mg/mL streptomycin, and 100 U/mL penicillin at 37 °C in an atmosphere of 95% air and 5% CO2. H1299 cells were cultured in RPMI 1640 medium supplemented with 10% FBS, 100 mg/mL streptomycin, and 100 U/mL penicillin at 37 °C in an atmosphere of 95% air and 5% CO2. For selective knockdown of CKS2, we used three small interfering RNAs (siRNAs si-1, si-2, and si-3) and negative control (NC) siRNA obtained from GenePharma (D010003; Shanghai, China). The siRNA sequences were as follows:
- CKS2 si-1 sense: 5'-CUUGGUGUCCAACAGAGUCUATT-3';
- CKS2 si-1 antisense: 5'-UAGACUCUGUUGGACACCAAGTT-3';
- CKS2 si-2 sense: 5'-GAGUCUAGGCUGGGUUCAUUATT-3';
- CKS2 si-2 antisense: 5'-UAAUGAACCCAGCCUAGACUCTT-3';
- CKS2 si-3 sense: 5'-CCACAUAUUCUUCUCUUUAGATT-3';
- CKS2 si-3 antisense: 5'-UCUAAAGAGAAGAAUAUGUGGTT-3'.
Quantitative real-time polymerase chain reaction (qRT-PCR)
Total RNA was extracted from transfected cells using a Trizol RNA extraction kit (Huamaike, Fangshan, Beijing, China) based on the manufacturer's instructions. Next, a reverse transcription kit (HengFei Biotech, China) was used to reverse-transcribe the RNA into complementary DNA (cDNA). Subsequently, qRT-PCR was performed to measure the expression of CKS2 using SYBR® Premix Ex Taq™ II (TaKaRa, Japan). The calculation of relative gene expression levels was performed using the 2-ΔΔCt method. The primers used were as follows:
CKS2-forward: 5'-TTAGTCTCCGGCGAGTTGTT-3', CKS2-reverse: 5'-CACCAAGTCTCCTCCACTCC-3', GAPDH-forward: 5'-GAAGGTGAAGGTCGGAGTC-3', GAPDH-reverse: 5'-GAAGATGGTGATGGGATTTC-3'.
Western blotting
Total protein was extracted from A549 or H1299 cells using the RIPA extraction reagent (Beyotime, Shanghai, China). To determine protein concentration, the bicinchoninic acid assay (Thermo Fisher Scientific, Waltham, MA, USA) was used. Cell lysate aliquots containing 20 mg of total protein from each experimental condition were resolved by sodium dodecyl sulfate‐polyacrylamide gel electrophoresis in 10% polyacrylamide gels and transferred onto polyvinylidene difluoride membranes (Millipore, Bedford, MA, USA). After blocking in 5% bovine serum albumin (Sigma, USA), the membranes were incubated with an anti-CKS2 antibody (1:500, Abcam, United Kingdom) overnight at 4 °C, washed with Tris-buffered saline + Tween-20, and incubated with a horseradish peroxidase-coupled secondary antibody for 1 hour at room temperature (25 °C). Protein bands were visualized using chemiluminescence.
Cell counting kit-8 (CCK-8) assay
The A549 and H1299 lung carcinoma cells transfected with NC or siRNA against CKS2 were seeded into a 96-well plate at a density of 5,000 cells/well. Cell viability was measured at 0, 12, 24, 36, 48, 72 and 96 hours using the CCK-8 assay kit (MCE, Shanghai, China). Briefly, 10 μL of CCK-8 reagent (MCE, Shanghai, China) was added daily to each well in the 96-well plates and incubated at 37 °C for 1.5 hours. The optical density value was measured at 450 nm using a microplate reader (Infinite® M1000 PRO, TECAN, Switzerland).
Cell apoptosis
To measure the extent of apoptosis, transfected A549 and H1299 cells were seeded in 6-well plates at 3 × 10⁵ cells/well and cultured for 48 hours. The cells were washed with cold phosphate-buffered saline and stained using an Annexin V-FITC apoptosis detection kit according to the manufacturer's instructions (US Everbright R Inc, Suzhou, China). A FACSCalibur flow cytometer (BD Biosciences, Mountain View, CA, USA) was used to assess the effects of CKS2 silencing on LUAD cell apoptosis. All experiments were carried out three times.
Cell invasion assay
Invasion assays were conducted using the 24-well transwell chambers with 8‐μm pores (Costar, Corning, New York, NY, USA). The inserted top side of the chambers was coated with 100 μL of diluted (1:5) Matrigel film (BD Biosciences, Bedford, MA, USA) in a 24-well plate at 37 °C for 4 hours. The process chamber containing 200 μL of the serum-free medium was inoculated with 5×10⁴ cells, whereas 600 μL of the medium with 10% FBS (AusGENEX, Australia) was added to the lower chamber. Following incubation at 37 °C for 48 hours, a cotton swab was used to wipe off the uninvaded cells in the upper chamber, and the cells that invaded to the bottom of the membrane were fixed in 4% paraformaldehyde for 20 minutes and stained with 0.4% crystal violet solution for 15 minutes. Subsequently, the stained cells were studied and photographed under a microscope (Leica, USA) using a 100× magnification. All experiments were repeated three times.
Statistical analysis
All statistical analyses were conducted using R software (v3.6.2) and Prism 8.0 (GraphPad Software Inc., San Diego, CA, USA). The Wilcoxon signed-rank and Wilcoxon rank-sum tests were used to analyze CKS2 expression in paired and non-paired samples, respectively. The correlation between clinical pathological features and CKS2 expression was analyzed using Kruskal-Wallis test, Wilcoxon rank-sum test and Wilcoxon signed-rank test. The survival analysis was performed using the Kaplan-Meier method, and the differences between groups were assessed using the log-rank test. Univariate and multivariate analyses using Cox proportional hazard modeling were performed to estimate the risk of death. Potential confounders included sex, age, clinical stage, and chemotherapy cycles. Student's t-test was carried out for comparisons between each group in experiments in vitro. Effects were considered significant if P < 0.05.
Results
CKS2 expression is upregulated in LUAD based on TCGA database
Statistical analysis of paired tumor and normal adjacent samples as well as of non-paired samples using the Wilcoxon rank-sum and Wilcoxon singed-rank tests, respectively, showed that CKS2 expression was significantly higher in cancer tissues than in normal tissues (Figure 1A, C; P < 0.001). To further evaluate CKS2 expression in human cancers, we examined pan-cancer RNA-seq data from TCGA database. The differential expression of CKS2 between the tumor and adjacent normal tissues is shown in Figure 1B.
CKS2 expression levels in LUAD and other types of human cancers from TCGA data. (A) CKS2 expression levels in different tumor types from TCGA database. (B) CKS2 expression levels in LUAD and normal tissue. (C) The expression of CKS2 in LUAD and its paired adjacent tissues. (D) Association of CKS2 expression with the T stage in LUAD. (E) Association of CKS2 expression with the N stage in LUAD. (F) Association of CKS2 expression with the M stage in LUAD. (G) Association of CKS2 expression with the pathological stage in LUAD. (H) Association of CKS2 expression with the TP53 status in LUAD. (I) Correlation between PD-L1 and CKS2 expression levels in LUAD.
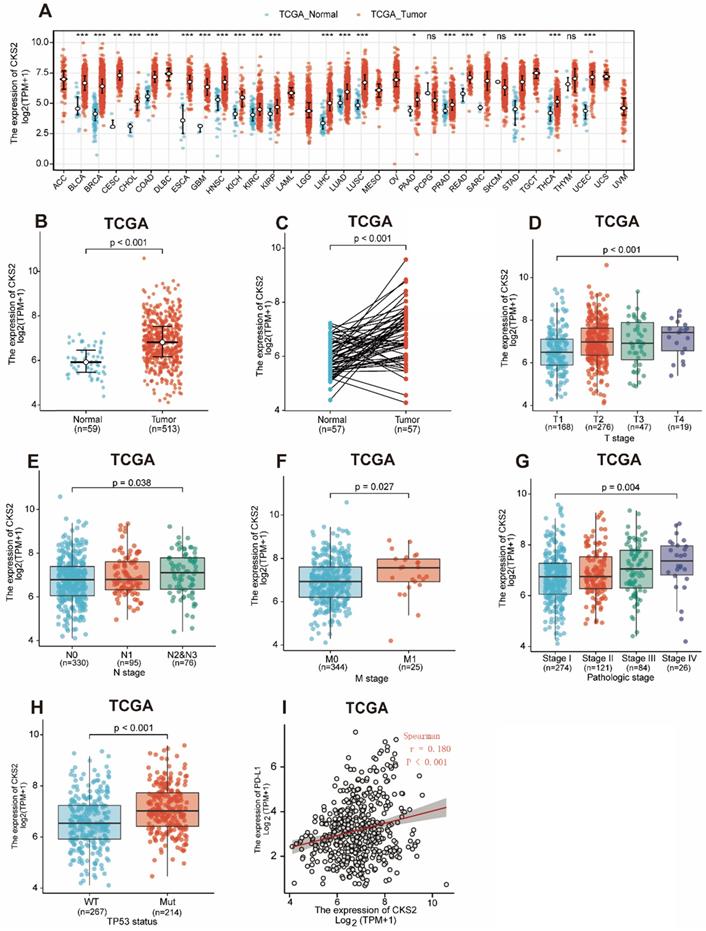
Notably, increased expression of CKS2 was significantly correlated with topographical distribution (Figure 1D, P < 0.001), lymph node metastasis (Figure 1E, P = 0.038), distant metastasis (Figure 1F, P = 0.027), pathological stage (Figure 1G, P = 0.004), TP53 status (Figure 1H, P < 0.001) and PD-L1 expression (Figure 6I, P < 0.001, r = -0.180).
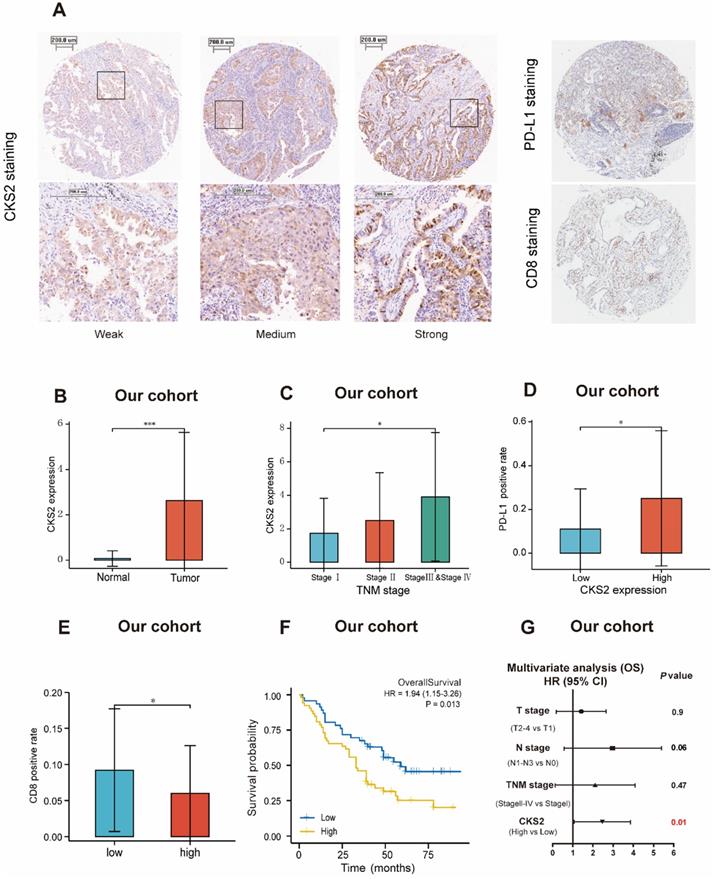
Immunohistochemical validation of CKS2 protein expression. (A) Different intensities of immunohistochemical CKS2 staining, PD-L1 staining and CD8 staining in samples from patients with LUAD. (B) CKS2 expression in LUAD and normal tissues. (C) Association of CKS2 expression with the TNM stage in LUAD. (D) Association of CKS2 expression with the PD-L1 positivity rate in LUAD. (E) Association of CKS2 expression with the CD8 positivity rate in LUAD. (F) Kaplan-Meier curves of OS of patients with high or low CKS2 expression (n = 98). (G) Multivariate Cox regression analysis indicating that high expression of CKS2 is an independent risk factor for OS in LUAD. (*P < 0.05, **P < 0.01, ***P < 0.001).
High CKS2 expression is associated with adverse outcomes in LUAD
A total of 513 eligible samples were obtained from TCGA. The patient characteristics associated with these samples, including TNM stage, pathological stage, gender, race, smoking history, TP53 status and age are listed in Table 1.
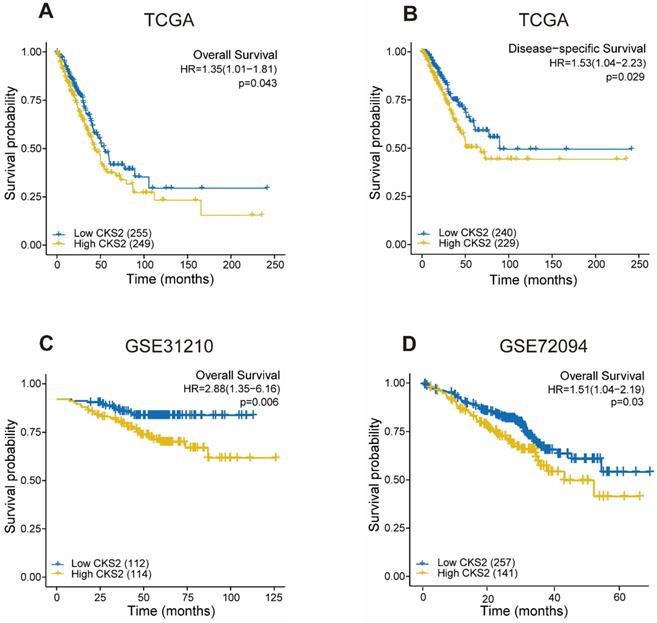
As shown in Figure 2, disease-free survival was significantly poorer in patients with high CKS2 expression than in those with low CKS2 expression (Figure 2B, P = 0.029). A similar result was observed in OS analysis (Figure 2A, P = 0.046). To verify the relationship between CKS2 expression and OS, the GSE72094 and GSE31210 datasets were analyzed. In the GSE72094 dataset, patients with high CKS2 expression had worse prognoses than patients with low CKS2 expression (Figure 2D, P = 0.029). Similar results were observed in the GSE31210 dataset (Figure 2C, P < 0.001).
Prognostic value of CKS2 expression in LUAD. (A) Kaplan-Meier curves of OS of patients with high or low CKS2 expression in TCGA cohort (n = 504). (B) Kaplan-Meier curves of DSS of patients with high or low CKS2 expression in TCGA cohort (n = 469). (C) Kaplan-Meier curves of OS of patients with high or low CKS2 expression in the GSE31210 cohort (n=226). (D) Kaplan-Meier curves of OS of patients with high or low CKS2 expression in the GSE72094 cohort (n =398).
Univariate analysis revealed that high CKS2 expression was associated with poor OS (hazard ratio [HR] = 1.353; 95% confidence interval [CI]: 1.009-1.815, P = 0.043). Other clinicopathological variables that were correlated with poor OS included T stage (P = 0.003), N stage (P < 0.001), and pathological stage (P = 0.002) (Table 2). Upon further multivariate analysis, CKS2 expression remained independently correlated with OS (HR = 1.403; 95% CI: 1.035-1.902, P = 0.029) and pathological stage.
Univariate and multivariate analyses of overall survival according to CKS2 expression, after adjusting for other potential predictors in TCGA
| Characteristics | Total (N) | HR (95%CI) Univariate analysis | P value Univariate analysis | HR (95%CI) Multivariate analysis | P value Multivariate analysis |
|---|---|---|---|---|---|
| T stage (T2-T4 vs. T1) | 501 | 1.668 (1.184-2.349) | 0.003 | 1.161 (0.808-1.670) | 0.419 |
| N stage (N1-3 vs. N0) | 492 | 2.606 (1.939-3.503) | <0.001 | 1.328 (0.823-2.143) | 0.245 |
| Pathological stage (Stage II-IV vs. Stage I) | 496 | 2.975 (2.188-4.045) | <0.001 | 2.257 (1.350-3.773) | 0.002 |
| Gender (Male vs. Female) | 504 | 1.060 (0.792-1.418) | 0.694 | ||
| Age (>65 vs. ≤65) | 494 | 1.228 (0.915-1.649) | 0.171 | ||
| Smoker (Yes vs. No) | 490 | 0.887 (0.587-1.339) | 0.568 | ||
| TP53 status (Mut vs. WT) | 499 | 1.254 (0.936-1.680) | 0.130 | ||
| CKS2 (High vs. Low) | 504 | 1.353 (1.009-1.815) | 0.043 | 1.403 (1.035-1.902) | 0.029 |
Functional analysis of CKS2-related genes
A total of 389 genes were found to be co-expressed with CKS2 (|r| > 0.5, P < 0.001). Among these, 329 genes were positively correlated with CKS2, while 60 genes were negatively with correlated CKS2 expression. The top 10 co-expressed genes were positively correlated with CKS2 (Figure 3A). Besides, a total of 2056 differentially expressed genes meeting the cut-off criteria (adjusted P value < 0.01, |logFC| > 1), including 1177 upregulated genes and 879 downregulated genes, were identified using DESeq2 package in the R software. The differentially expressed genes are illustrated by volcano plot in Figure 3B.
Functional enrichment of CKS2 in LUAD. (A) Heatmap of top 10 genes co-expressed with CKS2. (B) Volcano plot of differentially expressed genes. (C) Venn diagram of 191 CKS2 related genes. (D, E) GO and KEGG enrichment analyses of CKS2 related genes. (F) Enrichment of genes involved in the mTORC1 signaling pathway, as revealed by GSEA. (G) Enrichment of genes involved in the G2M checkpoint, as revealed by GSEA. (H) Enrichment of genes in the E2F targets pathway, as revealed by GSEA.
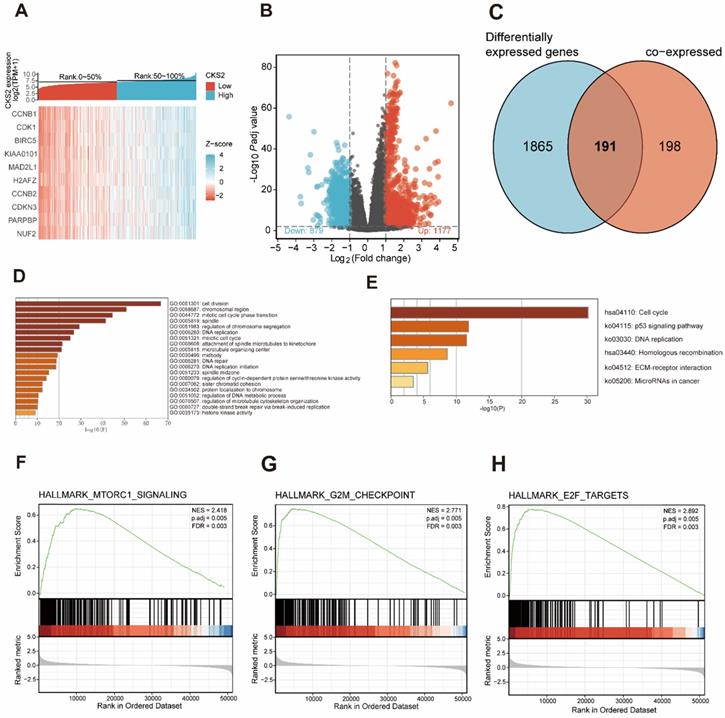
Analysis of co-expressed and differentially expressed genes identified 191 CKS2-related genes (Figure 3C), which were selected for simultaneous GO and KEGG enrichment analyses using the Metascape online tool. The top 20 GO enrichment terms, including three functional groups: biological process group (14 GO terms), molecular function group (5 GO terms), and cellular component (1 GO term), are shown in Figure 3D. We found that the CKS2-related genes were mainly involved in cell division, regulation of cell cycle, DNA replication, and chromosome. KEGG pathway analysis revealed that CKS2-related genes were enriched in the cell cycle, p53 signaling pathway, DNA replication and homologous recombination (Figure 3E). Together, these results suggest that the upregulation of CKS2 potentially regulates LUAD progression via cell division, cell cycle, DNA replication, p53 signaling pathway, and homologous recombination.
Potential CKS2-related multiple pathways identified through GSEA
GSEA of low and high CKS2 expression datasets revealed significant differences (|NES| > 1.5, adjusted P < 0.01, false discovery rate < 0.25) in enrichment in the MSigDB Collection (h.all.v7.0.symbols.gmt). Additionally, GSEA results showed that the G2M checkpoint, MTORC1 signaling, and E2F targets were activated in patients with high CKS2 expression (Figure 3F-H).
Correlation between CKS2 expression and immune cell infiltration
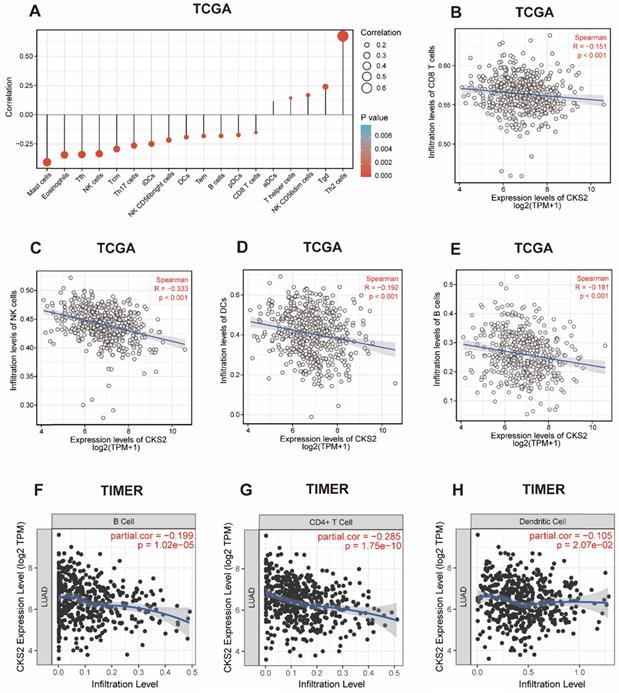
We further applied ssGSEA to analyze the relationship between CKS2 expression and immune cell infiltration levels. As shown in Figure 4A, the numbers of activated dendritic cells (DCs), T helper (Th) cells, natural killer (NK) CD56dim cells, T gamma delta cells, and T helper 2 (Th2) cells were positively correlated with CKS2 expression. The strongest positive correlation was observed between the number of Th2 cells and CKS2 expression (P < 0.001, r = 0.674). In contrast, the numbers of CD8+ T cells (Figure 4B; P < 0.001, r = -0.15), NK cells (Figure 4C; P < 0.001, r = -0.33), DCs (Figure 4D; P < 0.001, r = -0.19), and B cells (Figure 4E; P < 0.001, r = -0.18) were negatively correlated with CKS2 expression. Similar negative correlations between CKS2 expression and cell numbers were noted for other immune cell subsets, including mast cells, eosinophils, T follicular helper cells, T central memory cells, T effector memory cells, plasmacytoid DCs, and T helper 17 cells (all P < 0.05). Furthermore, analyses using the TIMER database revealed that the CKS2 expression level was negatively correlated with the infiltration of B cells (Figure 4F; P < 0.001, r = -0.199), CD4+ T cells (Figure 4G; P < 0.001, r = -0.285), and DCs (Figure 4H; P = 0.02, r = -0.105).
The correlation of CKS2 expression with the level of immune cell infiltration in LUAD. (A) Correlation between the level of immune cell infiltration and CKS2 expression by ssGSEA. (B-E) CKS2 expression shows a significant negative correlation with infiltrating levels of CD8+ T cells (B), NK cells (C), activated DCs (D), and B cells (E) based on ssGSEA. (F-H) CKS2 expression negatively correlates with infiltrating levels of B cells (F), CD4+ T cells (G) and Dendritic cells (J) via TIMER database.
Hypomethylation is correlated with the overexpression of CKS2
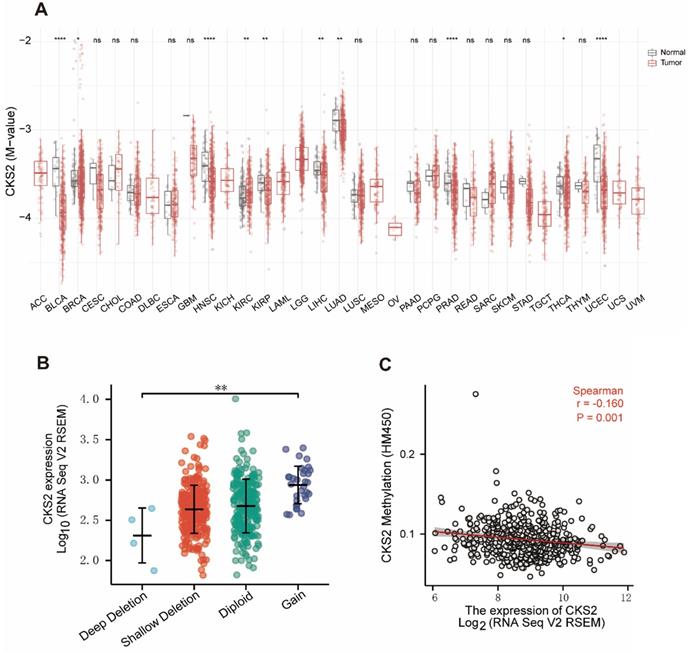
Analysis of the relationship between CKS2 expression and CNV and methylation levels showed that patients who had a high number of CKS2 copies exhibited high CKS2 expression. However, only 6% of the patients exhibited copy number amplification, indicating that CNVs may not be the main driver of high CKS2 expression (Figure 5B). In contrast, CKS2 expression was negatively correlated with CKS2 methylation levels (Figure 5C). Moreover, CKS2 methylation levels in the tumor tissues in LUAD, head and neck squamous cell carcinoma, bladder urothelial carcinoma, kidney renal clear cell carcinoma, kidney renal papillary cell carcinoma, liver hepatocellular carcinoma, prostate adenocarcinoma, and uterine corpus endometrial carcinoma were significantly lower than those in the adjacent normal tissues (Figure 5A).
Copy number variation (CNV) and methylation of CKS2 in LUAD. (A) Methylation levels of CKS2 in pan-cancer and normal tissues according to TCGA data. (B) The expression level in different CNVs of LUAD. (C) Correlation between CKS2 methylation and its expression level.
Immunohistochemical validation of the prognostic value of CKS2
The prognostic value of CKS2 protein expression was verified by immunohistochemistry. Images of different immunohistochemical staining intensities of CKS2 (weak, medium, and strong), PD-L1 staining and CD8 staining are shown in Figure 6A. Compared with that in adjacent normal tissues, the CKS2 staining score in LUAD tissues was significantly higher (Figure 6B, P < 0.001). Furthermore, high CKS2 expression was significantly correlated with the TNM stage (Figure 6C, P < 0.05), high PD-L1 expression (Figure 6D, P < 0.05) and low CD8 positive rate (Figure 6E, P < 0.05), consistent with the result from TCGA data. The Kaplan-Meier analysis revealed that the OS was shorter in LUAD patients with high CKS2 expression than in patients with low CKS2 expression (Figure 6F, P = 0.016). Furthermore, multivariate Cox regression analysis revealed that high CKS2 expression was an independent risk factor of LUAD (Figure 6G, P = 0.01). This finding was similar to the results of TCGA data analysis.
Knockdown of CKS2 in LUAD cell lines
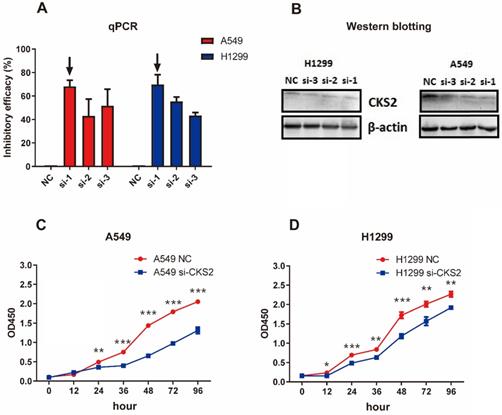
Three siRNAs (si-1, si-2, and si-3) were used to silence CKS2 in pilot experiments; qRT-PCR results revealed that si-1 had the best inhibitory efficacy among the three siRNAs in both A549 and H1299 cell lines (Figure 7A). Furthermore, compared to si-2 and si-3, si-1 induced a stronger decrease in CKS2 protein expression in A549 and H1299 cell lines, according to western blotting results (Figure 7B). These data demonstrated that si-1 was effective in inhibiting CKS2 expression in LUAD cell lines; therefore, si-1 was selected for subsequent experiments.
Silencing CKS2 expression by treatment with an anti-CKS2 siRNA attenuates LUAD cell proliferation. (A) Relative CKS2 mRNA expression levels in A549 and H1299 LUAD cells transfected with si-1, si-2, si-3 siRNAs against CKS2 and NC siRNA, as determined by qRT-PCR. (B) Relative CKS2 protein expression levels in A549 and H1299 cells transfected with si-1, si-2, si-3 siRNAs against CKS2 and NC siRNA, as revealed by western blotting. (C, D) Decreased survival of A549 and H1299 cells transfected with si-1 siRNA against CKS2, as shown by the CCK-8 assay (*P < 0.05, **P < 0.01, ***P < 0.001 vs. cells treated by NC siRNA).
Knockdown of CKS2 inhibits the malignant phenotype of LUAD cells
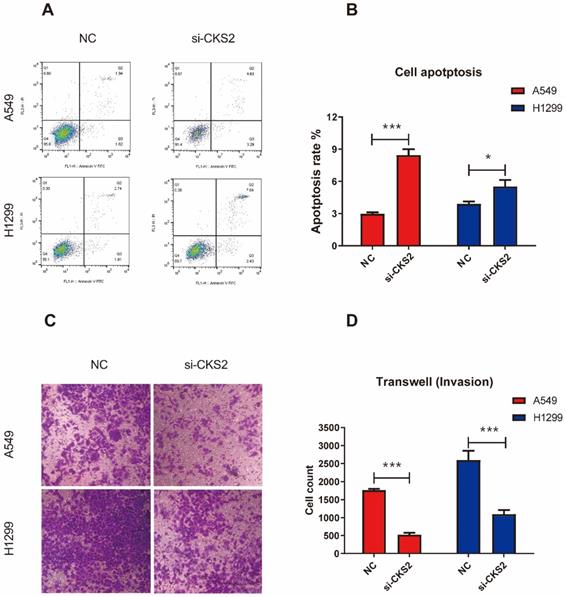
To investigate how the inhibition of CKS2 expression would affect LUAD cells, several in vitro experiments were performed. The CCK-8 assay revealed that repressing CKS2 expression notably decreased the survival of A549 and H1299 cells compared to that in the respective NC groups (Figure 7B, C). Apoptosis measurements using flow cytometry demonstrated that compared to the control, a 48-hour exposure to CKS2 siRNA significantly promoted apoptosis of A549 and H1299 cells (Figure 8A, B; A549: P < 0.001; H1299: P < 0.05). Additionally, the transwell assay revealed that silencing of CKS2 expression significantly decreased the invasion abilities of A549 and H1299 cells (Figure 8C, D; A549: P < 0.001; H1299: P < 0.001). Taken together, these results indicate that CKS2 knockdown remarkably suppressed the malignant phenotypes of LUAD cells.
CKS2 knockdown enhances cell apoptosis and suppressed cell invasion in LUAD cells. (A, B) CKS2 knockdown promoted apoptosis of A549 and H1299 LUAD cells according to flow cytometry analysis. (C, D) Invasion potential of A549 and H1299 cells transfected with si-1 siRNAs against CKS2 and NC siRNAs, as determined by the transwell invasion assay (*P < 0.05, **P < 0.01, ***P < 0.001).
Discussion
Given the poor OS rate of LUAD [21], it is important to accurately determine its prognosis. In this study, we have demonstrated that CKS2 tends to be expressed at a higher level in LUAD tissues than in adjacent normal tissues and that CKS2 expression is negatively correlated with CKS2 methylation levels. Furthermore, we found that high CKS2 expression is correlated with various clinicopathological variables and poor OS in LUAD. In addition, functional enrichment analysis indicated that CKS2 expression is involved in the cell cycle, DNA replication, p53 signaling pathway, MTORC1 signaling pathway, E2F targets, and homologous recombination. Furthermore, high CKS2 expression is correlated with a low infiltration level of CD8+ T cells, CD4+ T cells, NK cells, B cells, and DCs. Overall, our study explored the potential role of CKS2 in tumor pathogenesis and demonstrated its value as a potential LUAD biomarker.
Previous studies have shown that CKS2 is overexpressed in multiple tumors, such as esophageal cancer, breast cancer, and ovarian cancer [11-13]. Consistent with these previous reports, we found that in TCGA data, CKS2 expression levels are higher in LUAD and other tumors than in normal tissues. Moreover, we showed that high CKS2 expression is significantly correlated with CKS2 hypomethylation. DNA methylation is an epigenetic mechanism that plays an important role in regulating gene expression by inhibiting transcription factors that bind to DNA or by recruiting proteins related to gene repression [22]. A large number of evidences revealed that DNA methylation acts to suppress transcription, and it is reasonable to propose that DNA hypomethylation contributes to tumorigenesis through the activation of oncogenes[23]. This suggests that CKS2 hypomethylation may be the potential cause behind the high expression of CKS2.
CKS2 is highly expressed in LUAD and is associated with poor prognosis. We found that in TCGA and Gene Expression Omnibus, patients with high CKS2 expression had worse OS than patients with low CKS2 expression. In fact, CKS2 expression was an independent prognostic factor of OS. This result was also verified by multivariate analysis of the LUAD data in our cohort, which indicated that CKS2 expression is an independent prognostic factor of LUAD. In addition, we found that CKS2 expression was correlated with clinicopathologic variables, including T stage, N stage, M stage, and pathological stage.
CKS2, a member of the CKS protein family, binds to CDK and plays an important role in regulation of the cell cycle [8]. Previous studies have demonstrated that CKS2 binds to the cyclin B1-CDK1 protein kinase, which is essential for mitosis, and that promoting the G2 cell cycle transition induces cells to progress past the G2 phase of the cell cycle [24, 25]. Besides, there is sufficient evidence that high CKS2 expression promotes tumor proliferation and invasion in multiple tumors, including hepatocellular carcinoma and colon cancer [26, 27]. However, the biological functions of CKS2 in LUAD remained unknown. In this study, our functional enrichment analyses revealed that CKS2 was closely involved in proliferation-associated biological processes, including cell cycle, cell division, and DNA replication. To further verify the bioinformatic analysis results, a series of in vitro experiments were conducted in A549 and H1299 LUAD cells. Our experiments indicated that silencing CKS2 expression remarkably suppressed the proliferation and invasion of LUAD cells as well as promoted apoptosis, which is consistent with our bioinformatic prediction. Notably, in TCGA data, CKS2 was highly expressed in patients with TP53 mutations. Furthermore, KEGG analysis suggested that CKS2 was significantly enriched in the p53 signaling pathway. Previous studies have shown that CKS2 transcription is downregulated by p53 [28]. Thus, TP53 mutations may be potential drivers of the high CKS2 expression in LUAD. Given its role in LUAD progression, CKS2 could be a potential target of antitumor therapy against LUAD.
Cancer progression is affected not only by mutations but also by immune cells in the tumor microenvironment [29-31]. Some studies have shown that the expression of tumor genes could impact the type and proportion of immune cells in the tumor microenvironment [32-34]. More and more studies have confirmed the important role of mTOR in the regulation of innate and acquired immunity [35]. Given that the alteration of mTORC1 signaling pathways was identified by GSEA analysis, we further performed ssGSEA to explore the association between CKS2 expression and immune cell infiltration in LUAD. Interestingly, patients with high CKS2 expression displayed low infiltration levels of B cells, CD8+ T cells, CD4+ T cells, NK cells, and DCs, indicating that high CKS2 expression may suppress innate immunity and adaptive immunity in the tumor microenvironment, based on the results from TCGA, TIMER and our cohort. Some reports have suggested that low infiltration levels of B cells, CD8+ T cells, CD4+ T cells, NK cells, and DCs are related to the poor prognosis of LUAD [36-38]. Therefore, we postulate that immunosuppression related to high CKS2 expression is an important determinant of poor prognosis in LUAD. Recently, Immunotherapies of advanced NSCLC with antibodies against PD-1 or PD-L1 has shown significant clinical efficacy [39], but there are few predictive biomarkers to identify patients who can benefit from immune checkpoint inhibitors (ICIs) treatment. For unselected patients, the response rate of immunotherapy ranges from 14% to 20% [40]. More and more evidence showed that patients with high infiltration level of immune cells, in particular CD8+ T cell, indicated better response of ICIs treatment, compared with tumors without lymphocytes infiltration [41]. Given that the negative correlation with low level of immune cells infiltration, CKS2 can serve as a biomarker for providing a reference for the application of immunotherapy in LUAD. Taken together, these results suggest that CKS2 is a potential biomarker for evaluation of the immune microenvironment.
Although this study improves our understanding of the role of CKS2 in LUAD, it has some limitations. While bioinformatic analyses revealed that CKS2 expression is negatively correlated with immune cell infiltration, further studies are needed to investigate the specific role of CKS2 in the tumor microenvironment. In addition, more in vivo and in vitro experiments will be necessary to investigate the specific mechanisms and pathways of action of CKS2 in LUAD.
Conclusion
In conclusion, our study illustrated that high CKS2 expression was related to poor prognosis. Moreover, CKS2 overexpression was correlated with a low level of immune cell infiltration in LUAD. Additionally, in vitro experiments verified the biological roles of CKS2 in LUAD and established that CKS2 likely plays an essential role in the malignant phenotype and may be a promising prognostic biomarker for LUAD.
Abbreviations
CKS2: Cyclin-dependent kinase regulatory subunits; LUAD: lung adenocarcinoma; NSCLC: non-small cell lung cancer; LUSC: lung squamous cell carcinoma; OS: overall survival; TCGA: The Cancer Genome Atlas; GEO: Gene Expression Omnibus; GO: gene ontology; KEGG: Kyoto Encyclopedia of Genes and Genomes; GSEA: gene set enrichment analysis; MSigDB: Molecular Signatures Database; NES: normalized enrichment score; FDR: false discovery rate; ssGSEA: single-sample Gene Set Enrichment Analysis; DEGs: differentially expressed genes; Mut: mutation type; Wt: wild type; HR: hazard ratio; CI: confidence interval; FPR: false positive rate; DCs: dendritic cells; ICIs: immune checkpoint inhibitors.
Acknowledgements
We thank Editage (http://www.fabiao@editage.cn) for editing this manuscript.
Funding
This research was supported by the Innovation of Science and Technology Program of the Fujian Province (Grant number: 2018Y9111) and the Financial Foundation of the Fujian Province (Grant number: (2019)827).
Data Availability Statement
The datasets used and/or analyzed during the current study are available from the corresponding author on reasonable request.
Author Contributions
ZW and JL conceived and designed the study. YW, YY and QZ analyzed clinical data and performed statistical analysis. MZ performed immunohistochemical experiments and analyses. All authors wrote the manuscript. All authors read and approved the final manuscript.
Competing Interests
The authors have declared that no competing interest exists.
References
1. Bray F, Ferlay J, Soerjomataram I, Siegel RL, Torre LA, Jemal A. Global cancer statistics 2018: GLOBOCAN estimates of incidence and mortality worldwide for 36 cancers in 185 countries. CA Cancer J Clin. 2018;68:394-424
2. Testa U, Castelli G, Pelosi E. Lung Cancers: Molecular Characterization, Clonal Heterogeneity and Evolution, and Cancer Stem Cells. Cancers (Basel). 2018;10:248
3. Heuvers ME, Wisnivesky J, Stricker BH, Aerts JG. Generalizability of results from the National Lung Screening Trial. Eur J Epidemiol. 2012;27:669-72
4. Kocher F, Hilbe W, Seeber A, Pircher A, Schmid T, Greil R. et al. Longitudinal analysis of 2293 NSCLC patients: a comprehensive study from the TYROL registry. Lung Cancer. 2015;87:193-200
5. Hirsch FR, Scagliotti GV, Mulshine JL, Kwon R, Curran WJ Jr, Wu YL. et al. Lung cancer: current therapies and new targeted treatments. Lancet. 2017;389:299-311
6. Somasundaram A, Burns TF. The next generation of immunotherapy: keeping lung cancer in check. J Hematol Oncol. 2017;10:87
7. Hellmann MD, Nathanson T, Rizvi H, Creelan BC, Sanchez-Vega F, Ahuja A. et al. Genomic Features of Response to Combination Immunotherapy in Patients with Advanced Non-Small-Cell Lung Cancer. Cancer Cell. 2018;33:843-52 e4
8. Pines J. Cell cycle: reaching for a role for the Cks proteins. Curr Biol. 1996;6:1399-402
9. Reynard GJ, Reynolds W, Verma R, Deshaies RJ. Cks1 is required for G(1) cyclin-cyclin-dependent kinase activity in budding yeast. Mol Cell Biol. 2000;20:5858-64
10. Martinsson-Ahlzen HS, Liberal V, Grunenfelder B, Chaves SR, Spruck CH, Reed SI. Cyclin-dependent kinase-associated proteins Cks1 and Cks2 are essential during early embryogenesis and for cell cycle progression in somatic cells. Mol Cell Biol. 2008;28:5698-709
11. Kita Y, Nishizono Y, Okumura H, Uchikado Y, Sasaki K, Matsumoto M. et al. Clinical and biological impact of cyclin-dependent kinase subunit 2 in esophageal squamous cell carcinoma. Oncol Rep. 2014;31:1986-92
12. Huang N, Wu Z, Hong H, Wang X, Yang F, Li H. Overexpression of CKS2 is associated with a poor prognosis and promotes cell proliferation and invasion in breast cancer. Mol Med Rep. 2019;19:4761-9
13. Xu JH, Wang Y, Xu D. CKS2 promotes tumor progression and metastasis and is an independent predictor of poor prognosis in epithelial ovarian cancer. Eur Rev Med Pharmacol Sci. 2019;23:3225-34
14. Love MI, Huber W, Anders S. Moderated estimation of fold change and dispersion for RNA-seq data with DESeq2. Genome Biol. 2014;15:550
15. Zhou Y, Zhou B, Pache L, Chang M, Khodabakhshi AH, Tanaseichuk O. et al. Metascape provides a biologist-oriented resource for the analysis of systems-level datasets. Nat Commun. 2019;10:1523
16. Yu G, Wang LG, Han Y, He QY. clusterProfiler: an R package for comparing biological themes among gene clusters. OMICS. 2012;16:284-7
17. Bindea G, Mlecnik B, Tosolini M, Kirilovsky A, Waldner M, Obenauf AC. et al. Spatiotemporal dynamics of intratumoral immune cells reveal the immune landscape in human cancer. Immunity. 2013;39:782-95
18. Li T, Fan J, Wang B, Traugh N, Chen Q, Liu JS. et al. TIMER: A Web Server for Comprehensive Analysis of Tumor-Infiltrating Immune Cells. Cancer Res. 2017;77:e108-e10
19. Cerami E, Gao J, Dogrusoz U, Gross BE, Sumer SO, Aksoy BA. et al. The cBio cancer genomics portal: an open platform for exploring multidimensional cancer genomics data. Cancer Discov. 2012;2:401-4
20. Li Y, Ge D, Lu C. The SMART App: an interactive web application for comprehensive DNA methylation analysis and visualization. Epigenetics Chromatin. 2019;12:71
21. Ni M, Shi XL, Qu ZG, Jiang H, Chen ZQ, Hu J. Epithelial mesenchymal transition of non-small-cell lung cancer cells A549 induced by SPHK1. Asian Pac J Trop Med. 2015;8:142-6
22. Moore LD, Le T, Fan G. DNA methylation and its basic function. Neuropsychopharmacology. 2013;38:23-38
23. Van Tongelen A, Loriot A, De Smet C. Oncogenic roles of DNA hypomethylation through the activation of cancer-germline genes. Cancer Lett. 2017;396:130-7
24. Doree M, Hunt T. From Cdc2 to Cdk1: when did the cell cycle kinase join its cyclin partner? J Cell Sci. 2002;115:2461-4
25. Vassilev LT, Tovar C, Chen S, Knezevic D, Zhao X, Sun H. et al. Selective small-molecule inhibitor reveals critical mitotic functions of human CDK1. Proc Natl Acad Sci U S A. 2006;103:10660-5
26. Zhang J, Song Q, Liu J, Lu L, Xu Y, Zheng W. Cyclin-Dependent Kinase Regulatory Subunit 2 Indicated Poor Prognosis and Facilitated Aggressive Phenotype of Hepatocellular Carcinoma. Dis Markers. 2019;2019:8964015
27. Yu MH, Luo Y, Qin SL, Wang ZS, Mu YF, Zhong M. Up-regulated CKS2 promotes tumor progression and predicts a poor prognosis in human colorectal cancer. Am J Cancer Res. 2015;5:2708-18
28. Rother K, Dengl M, Lorenz J, Tschop K, Kirschner R, Mossner J. et al. Gene expression of cyclin-dependent kinase subunit Cks2 is repressed by the tumor suppressor p53 but not by the related proteins p63 or p73. FEBS Lett. 2007;581:1166-72
29. Forde PM, Kelly RJ, Brahmer JR. New strategies in lung cancer: translating immunotherapy into clinical practice. Clin Cancer Res. 2014;20:1067-73
30. Hui L, Chen Y. Tumor microenvironment: Sanctuary of the devil. Cancer Lett. 2015;368:7-13
31. Kim J, Bae JS. Tumor-Associated Macrophages and Neutrophils in Tumor Microenvironment. Mediators Inflamm. 2016;2016:6058147
32. Yuan Y, Jiang YC, Sun CK, Chen QM. Role of the tumor microenvironment in tumor progression and the clinical applications (Review). Oncol Rep. 2016;35:2499-515
33. Petitprez F, Vano YA, Becht E, Giraldo NA, de Reynies A, Sautes-Fridman C. et al. Transcriptomic analysis of the tumor microenvironment to guide prognosis and immunotherapies. Cancer Immunol Immunother. 2018;67:981-8
34. Taube JM, Galon J, Sholl LM, Rodig SJ, Cottrell TR, Giraldo NA. et al. Implications of the tumor immune microenvironment for staging and therapeutics. Mod Pathol. 2018;31:214-34
35. Conciatori F, Bazzichetto C, Falcone I, Pilotto S, Bria E, Cognetti F. et al. Role of mTOR Signaling in Tumor Microenvironment: An Overview. Int J Mol Sci. 2018;19:2453
36. Remark R, Becker C, Gomez JE, Damotte D, Dieu-Nosjean MC, Sautes-Fridman C. et al. The non-small cell lung cancer immune contexture. A major determinant of tumor characteristics and patient outcome. Am J Respir Crit Care Med. 2015;191:377-90
37. Aktas ON, Ozturk AB, Erman B, Erus S, Tanju S, Dilege S. Role of natural killer cells in lung cancer. J Cancer Res Clin Oncol. 2018;144:997-1003
38. Wang SS, Liu W, Ly D, Xu H, Qu L, Zhang L. Tumor-infiltrating B cells: their role and application in anti-tumor immunity in lung cancer. Cell Mol Immunol. 2019;16:6-18
39. Liu B, Song Y, Liu D. Recent development in clinical applications of PD-1 and PD-L1 antibodies for cancer immunotherapy. J Hematol Oncol. 2017;10:174
40. Xia L, Liu Y, Wang Y. PD-1/PD-L1 Blockade Therapy in Advanced Non-Small-Cell Lung Cancer: Current Status and Future Directions. Oncologist. 2019;24:S31-S41
41. Zhang Y, Zhang Z. The history and advances in cancer immunotherapy: understanding the characteristics of tumor-infiltrating immune cells and their therapeutic implications. Cell Mol Immunol. 2020;17:807-21
Author contact
![]() Corresponding author: Jiancheng Li, E-mail: jianchengli_jackedu.cn.
Corresponding author: Jiancheng Li, E-mail: jianchengli_jackedu.cn.