Impact Factor ISSN: 1837-9664

 Global reach, higher impact
J Cancer 2022; 13(4):1356-1362. doi:10.7150/jca.57457 This issue Cite
Research Paper
Can the Gene Expression Profile of Patients with Acute Myeloid Leukemia Predict Complete Remission Following Induction Therapy?
Santiago Sánchez-Sosa1,2#, Carlos Rodríguez-Medina1#, Ruth Stuckey1, Yanira Florido1, Guillermo Santana1, Jesús María González Martín3, Naylén Cruz-Cruz1, Melissa Torres-Ochando1, Rosa Fernández4, Nuria Sánchez-Farías1, Antonia Cionfrini1, Teresa Molero Labarta1,2, María Teresa Gomez-Casares1,2, Cristina Bilbao-Sieyro1,5 ![]()
1. Hematology Department, Hospital Universitario de Gran Canaria Dr. Negrín, Las Palmas de Gran Canaria, Spain.
2. Medical Science Department, Universidad de Las Palmas de Gran Canaria, Las Palmas de Gran Canaria, Spain.
3. Unidad de Investigación, Hospital Universitario de Gran Canaria Dr. Negrín, Las Palmas de Gran Canaria, Spain.
4. Hematology Department, Complejo Hospitalario Universitario Insular Materno Infantil, Las Palmas de Gran Canaria, Spain.
5. Morphology Department, Universidad de Las Palmas de Gran Canaria, Las Palmas de Gran Canaria, Spain.
#These authors have contributed equally to this work.
Received 2020-12-22; Accepted 2022-1-14; Published 2022-2-14
Abstract

Recent advances in sequencing technologies and genomics have led to the development of several targeted therapies such as BCL2 and Bromodomain and extra-terminal (BET) protein inhibitors for a more personalized treatment of patients with acute myeloid leukemia (AML), yet the majority of patients still receive standard induction chemotherapy. The molecular profiles of patients who are likely to respond to induction therapy and novel directed therapies remain to be determined. The expression of AML-related genes that are targeted by novel therapies such as BCL2 and BRD4, as well as functionally related genes and associated epigenetic modulators (TET2, EZH2, ASXL1, MYC) were analyzed in a series of 176 consecutive AML patients at multiple points during the disease course - diagnosis (Dx), post-induction (PI), complete remission (CR) and relapse (RL) - and their relationship with clinical variables and outcome investigated. Higher TET2 expression was observed PI and at CR compared to Dx, with significantly superior TET2 expression after induction therapy in the group of patients who reached CR compared to those who did not. Thus, the upregulation of TET2 at PI may be a marker of CR in AML patients. On the other hand, cells with high levels of MYC and BCL2 may be vulnerable to BRD4 inhibition.
Keywords: acute myeloid leukemia, biomarkers, patient outcome, induction therapy, molecular diagnostics
Introduction
Acute myeloid leukemia (AML) is one of the most common leukemias, accounting for 30% of adult cases, with a median age of presentation of 68 years [1]. Although AML is a highly heterogenous disease, the vast majority of patients still receive standard induction chemotherapy (anthracycline + cytarabine, “7+3”). However, approximately 65%-70% of patients aged 60 and under [2] and just 30%-60% of the over-60s obtain complete remission (CR) [3, 4], with failure to achieve CR associated with a very poor outcome [5]. As a result, current outcomes for AML patients remain unsatisfactory: those aged 60 years and under have a long-term disease-free survival (DFS) of only 40%, whereas the DFS of older patients is 10% or less, with a median overall survival of less than one year, regardless of therapeutic approach [6, 7].
Recent progress in the use of massive sequencing technologies has led to a greater understanding of the disease pathology. This knowledge has in turn fueled the development of targeted therapies, such as those developed against FLT3 and IDH1/2 mutations [8]. BCL2 inhibitors (venetoclax was approved by the FDA on November 21, 2018, in combination with azacitidine or decitabine or low-dose cytarabine for the treatment of newly-diagnosed AML in adults aged 75 years or older [9]) and Bromodomain and extra-terminal (BET) protein inhibitors (showing promising results in recent clinical trials [10]), both of which induce apoptosis, are also offering hope for AML patients.
Nevertheless, the molecular profiles of patients who are likely to respond to these novel targeted therapies remain to be determined. Moreover, algorithms to predict which patients are unlikely to respond well to the standard induction regime, and thus could benefit from an alternative therapy, do not exist and represent an unmet clinical need. Therefore, there is still much work to be done in personalizing the risk stratification and treatment regimes of AML patients in the clinic.
In this study, we determined the expression of AML-related genes that are targeted by novel therapies in AML such as BCL2 and BRD4, as well as functionally related genes and associated epigenetic modulators (TET2, EZH2, ASXL1, MYC) in a series of patients with AML at diagnosis and at different points during follow-up and evaluated whether their expression was predictive of complete remission after induction and/or patient outcome.
Materials & Methods
In this study, approved by our center's IRB (Comité Ético de Investigación Clínica, CEI_HUGCDN_565/150024), we analyzed 176 consecutive AML patients diagnosed at the Hospital Universitario de Gran Canaria Dr. Negrín and the Complejo Hospitalario Universitario Materno Infantil, Las Palmas, Spain, from January 2014 to July 2017.
Bone marrow (BM) and peripheral blood (PB) samples were collected at diagnosis (Dx), post-induction (PI, which corresponded to the BM evaluation at day 21 after induction therapy), complete remission (CR, defined as <5% blasts in bone marrow, absence of extramedullary disease, neutrophils ≥1.0 × 10⁹/L and platelets ≥100 × 109/L, according to the 2017 ELN recommendations [11]) and at relapse (RL).
RNA was extracted from bone marrow cell pellets using the Qiacube automatic extractor (Qiagen) and cDNA synthesized with random hexamers (Roche) and M-MLV Reverse Transcriptase (Promega). Real-time quantitative PCR (RT-qPCR) was conducted with Perfecta SYBR Green FastMix (Quanta Bioscience) on the LightCycler 480 platform (Roche), with ABL1 as reference gene.
Gene expression was determined by the 2-∆∆Ct method normalized to ABL1 and relative to a cDNA pool from 10 healthy donors as internal calibrator; MYC expression was normalized to RPS14. Primer sequences are available upon request. Expression of targets genes was analyzed separately in the healthy donors with no significant variation observed.
Pearson correlation coefficients were used to calculate correlations between two continuous variables. For the comparison between continuous variables, paired Student's t-test for parametric data or Wilcoxon signed-rank test for non-parametric variables was used. Univariate and multivariate survival analyses were carried out using the Cox proportional hazard model only for patients who received first-line intensive treatment (anthracycline + cytarabine, 7 + 3 schedule). Progression-free survival was defined as the time from diagnosis to disease progression or death from any cause (PFS). All statistical analyses were two-sided, with statistical significance was set at a p-value < 0.05. Analyses were carried out using the R Core Team 2019 (version 3.6.1).
Informed consent was provided by all patients and donors. The datasets from this study are available from the corresponding author on reasonable request.
Results
Patient characteristics
Median patient age was 59 years (min-max: 16-82 years, see Supplementary Table 1 for patient characteristics). A de novo AML was diagnosed in 150 patients, while 26 were secondary AML (therapy-related or with an antecedent hematologic disorder). The majority of patients (94.3%) received standard induction chemotherapy (anthracycline + cytarabine, “7+3”), and 38.6% of patients received hematopoietic stem cell transplantation in consolidation. Of the patients who received induction chemotherapy, 89 (50.6%) reached CR.
Gene expression correlation
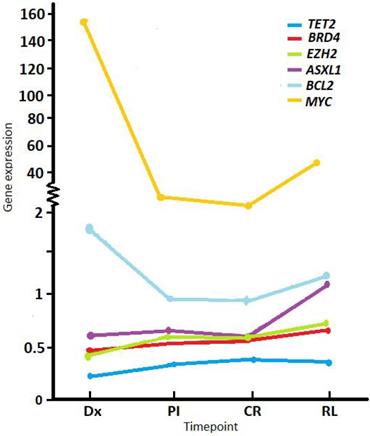
RT-qPCR was performed on RNA extracted from whole BM for patients with a sample available that was suitable for RNA expression analysis (e.g., not degraded). Mean gene expression levels at diagnosis (normalized to ABL1 and relative to a pool of healthy donor controls) were below the values of controls for TET2 (mean 0.22, SD ± 0.15, min-max 0-0.91, n = 153), EZH2 (mean 0.43, SD ± 0.29, min-max 0.04-1.73, n = 155), BRD4 (mean 0.47, SD ± 0.37, min-max 0.05-2.59, n = 158), and ASXL1 (mean 0.66, SD ± 0.44, min-max 0.08-2.85, n = 155); and were higher compared to controls for BCL2 (mean 1.61, SD ± 1.16, min-max 0.02-6.97, n = 156) and MYC (mean 151.27, SD ± 346.23, min-max 0.1-1929, n = 157) (Figure 1).
Average expression levels of study genes at different timepoints during follow up. Normalized expression shown at diagnosis (Dx), post-induction (PI), complete remission (CR) and relapse (RL). Values were normalized to the ABL1 reference gene and relative to a pool of healthy donors.
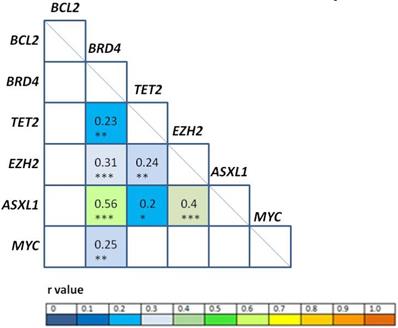
Correlation analyses among gene expression levels at diagnosis (Figure 2) revealed positive correlation between BRD4/ASXL1 (r = 0.56, p < 0.001), EZH2/ASXL1 (r = 0.4, p < 0.001); BRD4/EZH2 (r = 0.31, p < 0.001), BRD4/MYC (r = 0.25, p = 0.01), TET2/EZH2 (r = 0.24, p = 0.01), BRD4/TET2 (r = 0.23, p = 0.01), and TET2/ASXL1 (r = 0.2; p = 0.03). High correlation (Pearson correlation coefficient r ≥ 0.8) was also observed between EZH2/ASXL1 at PI (r = 0.82, p < 0.001), CR (r = 0.92, p < 0.001); and at relapse (r = 0.85, p < 0.001).
Correlation analysis of gene expression levels. The r values (Pearson correlation coefficient) of statistically significant correlations are represented according to the color heat map; white squares were not significant. *p<0.05, **p<0.01, ***p<0.001.
Expression levels during follow-up
Comparing expression levels at Dx with PI, TET2 showed a significant increase (mean Dx 0.22 vs. PI 0.33, p < 0.001), while BCL2 (mean Dx 1.64 vs. PI 1.18, p < 0.001) and MYC (mean Dx 151.27 vs. PI 2.82, p < 0.001) a marked descent PI. We observed the same behavior between Dx and CR (Table 1). Between Dx and RL, MYC levels were significantly lower at RL (mean Dx 67.22 vs. RL 49.13, p = 0.01).
Comparison of average gene expression levels at different timepoints during follow up. Values were normalized to the ABL1 reference gene and relative to a pool of healthy donors (expression level set as 1 for each gene)
| Nº | Dx | PI | CR | RL | p-value | |
|---|---|---|---|---|---|---|
| TET2 | 82 | 0.22 | 0.33 | <0.001 | ||
| BRD4 | 86 | 0.47 | 0.54 | 0.204 | ||
| EZH2 | 85 | 0.45 | 0.6 | 0.16 | ||
| ASXL1 | 84 | 0.63 | 0.66 | 0.69 | ||
| BCL2 | 86 | 1.64 | 0.97 | <0.001 | ||
| MYC | 83 | 151.27 | 2.82 | <0.001 | ||
| TET2 | 60 | 0.22 | 0.38 | <0.001 | ||
| BRD4 | 64 | 0.48 | 0.58 | 0.18 | ||
| EZH2 | 63 | 0.46 | 0.61 | 0.25 | ||
| ASXL1 | 63 | 0.65 | 0.62 | 0.72 | ||
| BCL2 | 64 | 1.57 | 0.95 | <0.001 | ||
| MYC | 61 | 135.5 | 2.4 | 0.002 | ||
| TET2 | 27 | 0.25 | 0.36 | 0.26 | ||
| BRD4 | 27 | 0.52 | 0.67 | 0.39 | ||
| EZH2 | 27 | 0.54 | 0.73 | 0.87 | ||
| ASXL1 | 27 | 0.71 | 1.09 | 0.1 | ||
| BCL2 | 28 | 1.65 | 1.19 | 0.77 | ||
| MYC | 27 | 67.22 | 49.13 | 0.01 | ||
| TET2 | 65 | 0.36 | 0.38 | 0.1 | ||
| BRD4 | 66 | 0.56 | 0.58 | 0.28 | ||
| EZH2 | 66 | 0.65 | 0.61 | 0.07 | ||
| ASXL1 | 66 | 0.65 | 0.63 | 0.26 | ||
| BCL2 | 66 | 0.99 | 0.97 | 0.74 | ||
| MYC | 64 | 3.02 | 2.34 | 0.25 | ||
| TET2 | 21 | 0.34 | 0.35 | 0.24 | ||
| BRD4 | 22 | 0.64 | 0.73 | 0.78 | ||
| EZH2 | 22 | 0.81 | 0.79 | 0.94 | ||
| ASXL1 | 22 | 0.77 | 1.19 | 0.07 | ||
| BCL2 | 23 | 1.07 | 2.17 | 0.05 | ||
| MYC | 21 | 1.98 | 56.62 | 0.22 | ||
| TET2 | 18 | 0.39 | 0.36 | 0.18 | ||
| BRD4 | 19 | 0.72 | 0.77 | 0.31 | ||
| EZH2 | 19 | 0.88 | 0.86 | 0.78 | ||
| ASXL1 | 19 | 0.81 | 1.27 | 0.2 | ||
| BCL2 | 20 | 0.96 | 2.27 | 0.03 | ||
| MYC | 18 | 2.43 | 65.79 | 0.71 |
Significant differences are shown in bold.
Nº: number of observations considered in each analysis; Dx: diagnosis; PI: post-induction; CR: complete remission; RL: relapse.
When expression at either PI or CR was compared with RL, the only gene with significantly modified expression values was BCL2, which showed a significant increment at RL (mean PI 1.07 and CR 0.96 vs. RL 2.17, p = 0.05 and p = 0.03, respectively) [12].
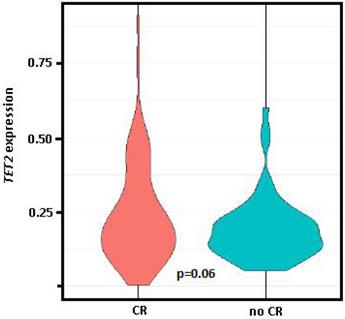
Comparing the gene expression levels of patients at PI who had obtained CR in response to induction therapy (n = 89, 50.6%) vs. those who had persistence and/or exitus (n = 77, 43.8%), only TET2 had significantly different expression levels between the two groups (0.37 vs. 0.26, p = 0.03), while differences between these groups for TET2 expression levels at diagnosis was of marginal significance (0.24 vs. 0.19, p = 0.06, Figure 3).
Violin plot of TET2 expression at diagnosis. Comparison of the group who achieved complete remission (CR) after induction therapy vs. those with persistence and/or exitus (no CR). Student t test (parametric) used for distinct distributions, p=0.06.
Clinical variables
In terms of clinical variables, no association was found between expression of the genes analyzed at diagnosis with patient age, or leukocyte, hemoglobin, creatinine or lactate dehydrogenase (LDH) levels. However, a significant inverse correlation was observed between blasts in PB and expression of BRD4 (r = -0.26, p= 0.01), EZH2 (r = -0.27, p = 0.01) and ASXL1 (r = -0.2, p = 0.04) at diagnosis (Supplementary Table 2).
When included in a predictive model, a 1-fold increase in EZH2 and BRD4 expression caused a 21.05-fold (p = 0.04) and 13.36-fold (p = 0.1) decrease in blasts in PB, respectively; whereas a 1-fold increase in EZH2 and ASXL1 expression caused a 13.81-fold decrease (p = 0.1) and a 11.27-fold increase (p = 0.05) in blasts in BM (Supplementary Figure 1).
Overall and progression-free survival
Median survival in our series was 14.8 months, with 57.4% of patients alive after 12 months. As expected, age at diagnosis was predictive of overall survival (OS) for the whole series (p < 0.001, Table 2) [13], but also for patients aged 70 years and under with intermediate cytogenetic risk (p = 0.037).
Univariate and multivariate analysis for overall survival for the whole series. Average expression levels for the group of survivors and non-survivors are included for genes whose expression at certain timepoints was significant (or of borderline significance)
| Variables | Nº | HR | p-value | Average expr. | |
|---|---|---|---|---|---|
| Survivors | Non-survivors | ||||
| Univariate | |||||
| Male gender | 176 | 1.03 | 0.87 | ||
| Age at diagnosis (continuous) | 176 | 1.04 | <0.001 | ||
| ELN risk group* | 160 | ||||
| 2 | 1.53 | 0.12 | |||
| 3 | 2.10 | 0.008 | |||
| Cytogenetic risk group* | 173 | ||||
| 2 | 1.30 | 0.48 | |||
| 3 | 2.07 | 0.07 | |||
| Leucocytes (log) at diagnosis | 173 | 1.13 | 0.05 | ||
| At diagnosis | 153 | ||||
| TET2 expr. | 0.47 | 0.26 | |||
| BRD4 expr. | 0.72 | 0.19 | |||
| EZH2 expr | 0.73 | 0.37 | |||
| ASXL1 expr. | 0.87 | 0.54 | |||
| BCL2 expr. | 1.08 | 0.37 | |||
| MYC expr. | 1 | 0.88 | |||
| Post-induction | 90 | ||||
| TET2 expr. | 0.39 | 0.15 | |||
| BRD4 expr. | 1.25 | 0.5 | |||
| EZH2 expr. | 1.26 | 0.089 | |||
| ASXL1 expr. | 1.63 | 0.034 | 0.57 | 0.72 | |
| BCL2 expr. | 1.45 | 0.046 | 0.81 | 1.07 | |
| MYC expr. | 1.03 | 0.062 | 1.26 | 4.26 | |
| Complete remission | 67 | ||||
| TET2 expr. | 0.95 | 0.94 | |||
| BRD4 expr | 1.94 | 0.062 | 0.48 | 0.66 | |
| EZH2 expr. | 1.45 | <0.001 | 0.45 | 0.76 | |
| ASXL1 expr. | 1.98 | <0.001 | 0.52 | 0.72 | |
| BCL2 expr. | 1.83 | 0.012 | 0.81 | 1.10 | |
| MYC expr | 1.08 | 0.041 | 1.31 | 3.27 | |
| At relapse | 29 | ||||
| TET2 expr. | 0.33 | 0.12 | |||
| BRD4 expr. | 1.05 | 0.87 | |||
| EZH2 expr. | 0.99 | 0.96 | |||
| ASXL1 expr. | 1.06 | 0.65 | |||
| BCL2 expr. | 1.11 | 0.12 | |||
| MYC expr. | 1 | 0.23 | |||
| Multivariate | |||||
| Age at diagnosis | 158 | 1.04 | <0.001 | ||
| ELN risk group* | 158 | ||||
| 2 | 1.40 | 0.233 | |||
| 3 | 1.76 | 0.044 | |||
| Leucocytes (log) at diagnosis | 158 | 1.24 | 0.003 | ||
| BCL2 expr. PI | 82 | 1.58 | 0.014 | 0.81 | 1.07 |
| BCL2 expr. CR | 60 | 1.96 | 0.008 | 0.81 | 1.10 |
Significant differences are shown in bold. Nº: number of observations considered in each analysis; PI: post-induction; CR: complete remission; RL: relapse; ELN: European LeukemiaNet.
* Risk group 1 taken as reference.
Univariate analysis for OS revealed no association between gene expression levels at diagnosis or at relapse (Table 2). Moreover, Cox regression analysis revealed no association between gene expression at diagnosis and the time between diagnosis and exitus.
At PI, the expression levels of ASXL1 (p = 0.034) and BCL2 (p = 0.046) were associated with OS, with MYC expression of marginal significance (p = 0.062); while the levels of ASXL1 (p < 0.001), BCL2 (p = 0.012), MYC (p = 0.041) and EZH2 (p < 0.001) were associated with OS at CR, with BRD4 expression of marginal significance (0.48 in group of survivors vs. 0.66 in exitus group, p = 0.062). In the multivariate analysis, age and leukocyte count at diagnosis, ELN risk group 3, and BCL2 expression at both PI and CR retained significance [12].
Median PFS in our series was 12.5 months. Univariate analysis revealed no association between gene expression levels at diagnosis or at relapse. However, the gene expression levels of ASXL1 and BCL2 at PI (albeit of marginal significance, p = 0.073 and 0.06, respectively) and of ASXL1, BCL2 and EZH2 at CR (p = 0.016, 0.022, 0.019, respectively) were associated with PFS (Table 3).
Univariate analysis for progression-free survival for the whole series. Significant differences are shown in bold
| Variables | HR | p-value |
|---|---|---|
| Male gender | 1.07 | 0.74 |
| Age at diagnosis (continuous) | 1.02 | <0.001 |
| ELN risk group* | ||
| 2 | 1.20 | 0.50 |
| 3 | 1.71 | 0.04 |
| At diagnosis | ||
| TET2 expr. | 0.62 | 0.45 |
| BRD4 expr. | 0.67 | 0.1 |
| EZH2 expr. | 1.12 | 0.73 |
| ASXL1 expr. | 0.72 | 0.16 |
| BCL2 expr. | 1.09 | 0.3 |
| MYC expr. | 1 | 0.84 |
| Post-induction | ||
| TET2 expr. | 0.38 | 0.11 |
| BRD4 expr. | 1.08 | 0.8 |
| EZH2 expr. | 1.23 | 0.13 |
| ASXL1 expr. | 1.52 | 0.073 |
| BCL2 expr. | 1.39 | 0.06 |
| MYC expr. | 1.02 | 0.19 |
| Complete remission | ||
| TET2 expr. | 0.83 | 0.77 |
| BRD4 expr. | 1.57 | 0.18 |
| EZH2 expr. | 1.37 | 0.019 |
| ASXL1 expr. | 1.8 | 0.016 |
| BCL2 expr. | 1.63 | 0.022 |
| MYC expr. | 1.05 | 0.15 |
| At relapse | ||
| TET2 expr. | 0.88 | 0.83 |
| BRD4 expr. | 1.02 | 0.95 |
| EZH2 expr. | 1.1 | 0.63 |
| ASXL1 expr. | 1.02 | 0.86 |
| BCL2 expr. | 1.08 | 0.24 |
| MYC expr. | 1 | 0.39 |
*Risk group 1 taken as reference. ELN: European LeukemiaNet.
Discussion
In accordance with a previous report, we observed significantly higher TET2 expression after induction and at complete remission compared to diagnosis, although we did not observe a reduction in TET2 expression at relapse [14]. Importantly, TET2 expression was lower at PI in those patients who achieved CR in response to induction therapy compared to those who did not. Meanwhile, BCL2 and MYC levels were significantly lower after induction and at CR compared to diagnosis.
In this expression study, BCL2 was the only gene to show a significant increase in expression at relapse compared to PI and CR [12]. Early studies showed that overexpression of BCL2 is a common event in AML and that high levels are associated with chemoresistance and low complete remission rate [15-17]. Further papers demonstrated that it is the readiness for apoptosis of myeloblasts, known as “priming”, rather than the monogenic expression of a single apoptosis-related gene at diagnosis (i.e. BAX, BLC2), that determines a successful response to chemotherapy [18, 19].
Relapsed AML cases have a particularly poor prognosis due to limited treatment options for refractory cases. As the sensitivity to the selective BCL-2 inhibitor ABT-199 seems to correlate with BCL2 levels [20], it is possible that BCL2 expression at PI, at CR and even at relapse, may determine candidates for venetoclax as an alternative treatment.
Our study is the first to analyze BRD4 expression in a series of patients with AML at different timepoints during patient follow up, namely, after induction therapy, when the patients reached CR, and at relapse. No significant associations were observed for BRD4 expression during patient follow up, although expression levels at CR were marginally associated with OS. This result is in accordance with previous results associating high BRD4 expression with poor OS in response to chemotherapy [21].
Although no association was observed between gene expression levels at diagnosis and OS or PFS, expression levels of ASXL1 and BCL2 at PI and of EZH2, ASXL1, BCL2 and MYC at CR were associated with OS, while EZH2, ASXL1 and BCL2 levels at CR were associated with PFS. Assessment of post-treatment remission is currently primarily based on cytomorphology, with CR defined as <5% blasts in the bone marrow [11], but this does not mean that the patient is free of disease. In fact, the consensus among experts is to evaluate for the presence of measurable residual disease (MRD), defined as post-therapy persistence of leukemic cells at levels below morphologic detection, since it is a strong, independent prognostic marker of increased risk of relapse and shorter survival [22]. Our results suggest that gene expression at PI/CR has a significant influence on patient outcome. Therefore, expression analysis of a set of just six genes could help refine the risk stratification of patients who achieve CR in response to standard induction therapy to better predict patient survival and identify patients likely to require an alternative treatment approach. Unlike other multi-gene prediction scores (such as the 17- or 29-gene scores [23, 24]), our RT-qPCR strategy is simple, cost-efficient and easily applicable in most hematology laboratories.
As expected, we observed that the expression levels at diagnosis of genes with a tumor suppressor function in AML (TET2, EZH2 and ASXL1) were low compared to normal bone marrow, whereas levels at diagnosis of genes with an oncogenic role (BCL2 and MYC) were higher in a series of 176 AML patients. TET2 levels were the lowest with regard to normal bone marrow, in agreement with what has already been described in AML [14].
We observed a very positive correlation between ASXL1 and EZH2 expression at diagnosis, PI and relapse, which may correspond to their cooperative functions in relation to the H3K27me3 epigenetic mark [25]. In addition, there was a correlation between EZH2/ASXL1 and TET2 levels at diagnosis that could be explained by the described collaborative role of the malfunction of ASXL1 and TET2 in promoting the commitment of hematopoietic cells to the myeloid lineage in myeloid pathogenesis [26]. The association found between BRD4 and MYC agrees with the biological activating function of BRD4 over MYC expression [27]. Finally, BRD4 expression also correlated with EZH2/ASXL1/TET2; accordingly, it has been published that BRD4 regulates EZH2 transcription through the upregulation of MYC [27] and binds directly to enhancer sites in the EZH2, MYC and BCL2 genes [28]. Therefore, there is biological concordance with our results of observed mRNA expression levels at diagnosis. These correlations may also be important to take into account when considering combination therapies.
Moreover, although significant associations were observed between BRD4 and MYC levels but not between BRD4 and BCL2 levels, the expression of BCL2 and MYC, both downstream targets of BRD4 [28, 29], were significantly lower after induction and at CR compared to diagnosis. Interestingly, studies have shown that the treatment of AML cells with the selective small-molecule bromodomain inhibitor JQ1 caused the rapid downregulation of BCL2 and MYC transcription, followed by genome-wide downregulation of Myc-dependent target genes [27, 29]. Therefore, cells with high levels of MYC and BCL2 may be vulnerable to BRD4 inhibition. Moreover, combination treatment with BET inhibitors and venetoclax has recently been reported to be more effective in inducing lethal effects against AML blasts, without inducing toxicity, in AML engrafted mice [30].
In conclusion, gene expression at PI/CR has a significant influence on patient outcome. Our findings support the upregulation of TET2 and the downregulation of BCL2 and MYC at post-induction as potential follow-up targetable markers in AML. However, further analyses in a larger AML series are needed to confirm that expression analysis of a set of just six genes could help refine the risk stratification of patients who achieve complete remission in response to standard induction therapy and to establish which patients are likely to benefit from therapy with BCL2 and/or BRD4 inhibitors.
Supplementary Material
Supplementary figure and tables.
Acknowledgements
This work was supported by the Fundación DISA (OA 15/005), and the Ministry of Economy and Competitiveness ISCIII‐FIS (PI14/02220).
Data Availability
The raw data will be made available upon reasonable request.
Competing Interests
The authors have declared that no competing interest exists.
References
1. Song X, Peng Y, Wang X. et al. Incidence, Survival, and Risk Factors for Adults with Acute Myeloid Leukemia Not Otherwise Specified and Acute Myeloid Leukemia with Recurrent Genetic Abnormalities: Analysis of the Surveillance, Epidemiology, and End Results (SEER) Database, 2001-2013. Acta Haematol. 2018;139:115-27
2. Fernandez HF, Sun Z, Yao X. et al. Anthracycline dose intensification in acute myeloid leukemia. N Engl J Med. 2009;361:1249-59
3. Baudard M, Beauchamp-Nicoud A, Delmer A. et al. Has the prognosis of adult patients with acute myeloid leukemia improved over years? A single institution experience of 784 consecutive patients over a 16-year period. Leukemia. 1999;13:1481-90
4. Löwenberg B, Ossenkoppele GJ, van Putten W. et al. High-dose daunorubicin in older patients with acute myeloid leukemia [published correction appears in N Engl J Med. 2010; 362: 1155.
5. Ravandi F, Cortes J, Faderl S. et al. Characteristics and outcome of patients with acute myeloid leukemia refractory to 1 cycle of high-dose cytarabine-based induction chemotherapy. Blood. 2010;116:5818-6153
6. Appelbaum FR, Gundacker H, Head DR. et al. Age and acute myeloid leukemia. Blood. 2006;107:3481-5
7. Rowe JM. Progress and predictions: AML in 2018. Best Pract Res Clin Haematol. 2018;31:337-40
8. Shah A, Andersson TM, Rachet B, Bjorkholm M, Lambert PC. Survival and cure of acute myeloid leukaemia in England, 1971-2006: a population-based study. Br J Haematol. 2013;162:509-16
9. DiNardo CD, Pratz K, Pullarkat V. et al. Venetoclax combined with decitabine or azacitidine in treatment-naive, elderly patients with acute myeloid leukemia. Blood. 2019;133:7-17
10. Berthon C, Raffoux E, Thomas X. et al. Bromodomain inhibitor OTX015 in patients with acute leukaemia: a dose-escalation, phase 1 study. Lancet Haematol. 2016;3:e186-95
11. Döhner H, Estey E, Grimwade D. et al. Diagnosis and management of AML in adults: 2017 ELN recommendations from an international expert panel. Blood. 2017;129:424-7
12. Bilbao-Sieyro C, Rodriguez-Medina C, Florido Y. et al. BCL2 expression at post-induction and complete remission impact the outcome in acute myeloid leukemia. Diagnostics. 2020;10:1048
13. Büchner T, Krug U Gale RP. et al. Age, not therapy intensity, determines outcomes of adults with acute myeloid leukemia. Leukemia. 2016;30:1781-84
14. Zhang TJ, Zhou JD. TET2 expression is a potential prognostic and predictive biomarker in cytogenetically normal acute myeloid leukemia. J Cel Physiol. 2018;233:5838-46
15. Klampfer L, Zhang J, Zelenetz AO, Uchida H, Nimer SD. The AML1/ETO fusion protein activates transcription of BCL-2. Proc Natl Acad Sci USA. 1996;93:14059-64
16. Russell NH, Hunter AE, Bradbury D, Zhu YM, Keith F. Biological features of leukaemic cells associated with autonomous growth and reduced survival in acute myeloblastic leukaemia. Leukemia Lymphoma. 1995;16:223-9
17. Campos L, Rouault JP, Sabido O. et al. High expression of bcl-2 protein in acute myeloid leukemia cells is associated with poor response to chemotherapy. Blood. 1993;81:3091-6
18. Vo TT, Ryan J, Carrasco R. et al. Relative mitochondrial priming of myeloblasts and normal HSCs determines chemotherapeutic success in AML. Cell. 2012;151:344-55
19. Ni Chonghaile T, Sarosiek KA, Vo TT. et al. Pretreatment mitochondrial priming correlates with clinical response to cytotoxic chemotherapy. Science. 2011;334:1129-33
20. Pan R, Hogdal LJ, Benito JM. et al. Selective BCL-2 inhibition by ABT-199 causes on-target cell death in acute myeloid leukemia. Cancer Discov. 2014;4:362-75
21. Chen C, Xu L, Gao R. et al. Transcriptome-Based Co-Expression of BRD4 and PD-1/PD-L1 Predicts Poor Overall Survival in Patients with Acute Myeloid Leukemia. Front. Pharmacol. 2021;11:582955
22. Schuurhuis GJ, Heuser M, Freeman S. et al. Minimal/measurable residual disease in AML: a consensus document from the European LeukemiaNet MRD Working Party. Blood. 2018;131:1275-91
23. Ng SW, Mitchell A, Kennedy JA. et al. A 17-gene stemness score for rapid determination of risk in acute leukaemia. Nature. 2016;540:433-7
24. Herold T, Jurinovic V, Batcha AMN. et al. A 29-gene and cytogenetic score for the prediction of resistance to induction treatment in acute myeloid leukemia. Haematologica. 2018;103:456-65
25. Abdel-Wahab O, Adli M, LaFave LM, Gao J, Hricik T, Shih AH. ASXL1 mutations promote myeloid transformation through loss of PRC2-mediated gene repression. Cancer Cell. 2012;22:180-93
26. Balasubramani A, Larjo A, Bassein JA. et al. Cancer-associated ASXL1 mutations may act as gain-of-function mutations of the ASXL1-BAP1 complex. Nature Comm. 2015;6:7307
27. Wu X, Liu D, Tao D. et al. BRD4 Regulates EZH2 Transcription through Upregulation of C-MYC and Represents a Novel Therapeutic Target in Bladder Cancer. Mol Cancer Ther. 2016;15:1029-42
28. Tzelepis K, De Braekeleer E, Aspris D. et al. SRPK1 maintains acute myeloid leukemia through effects on isoform usage of epigenetic regulators including BRD4. Nature Comm. 2018;9:5378
29. Fiskus W, Sharma S, Qi J. et al. Highly active combination of BRD4 antagonist and histone deacetylase inhibitor against human acute myelogenous leukemia cells. Mol Cancer Ther. 2014;13:1142-54
30. Fiskus W, Cai T, DiNardo CD, Kornblau SM, Borthakur G, Kadia TM. Superior efficacy of cotreatment with BET protein inhibitor and BCL2 or MCL1 inhibitor against AML blast progenitor cells. Blood Cancer J. 2019;9:4
Author contact
![]() Corresponding author: Dr. Cristina Bilbao-Sieyro, Molecular Biology Group, Hematology Department, Hospital Universitario de Gran Canaria Dr. Negrín, Barranco de La Ballena S/N, Las Palmas de Gran Canaria, 35010, Spain. Tel: 0034 928 449420; Fax: 0034 928 449827; Email: bilbaocristinacom.
Corresponding author: Dr. Cristina Bilbao-Sieyro, Molecular Biology Group, Hematology Department, Hospital Universitario de Gran Canaria Dr. Negrín, Barranco de La Ballena S/N, Las Palmas de Gran Canaria, 35010, Spain. Tel: 0034 928 449420; Fax: 0034 928 449827; Email: bilbaocristinacom.