Impact Factor ISSN: 1837-9664

 Global reach, higher impact
J Cancer 2022; 13(13):3452-3462. doi:10.7150/jca.77768 This issue Cite
Research Paper
Risk factors of secondary cancer in nasopharyngeal carcinoma patients after radiotherapy
Wen-Jie Wang1*, Miao Li1*, Xin-Bin Pan2 ![]()
1. Department of Oncology, The Central Hospital of Wuhan, Tongji Medical College, Huazhong University of Science and Technology, Wuhan, Hubei 430014, P.R. China.
2. Department of Radiation Oncology, Guangxi Medical University Cancer Hospital, Nanning, Guangxi 530021, P.R. China.
* Wen-Jie Wang and Miao Li contributed equally to this work.
Received 2022-8-4; Accepted 2022-9-29; Published 2022-10-9
Abstract

Purpose: To identify risk factors of secondary cancer in nasopharyngeal carcinoma (NPC) patients after radiotherapy.
Materials and methods: The data of NPC patients with secondary cancer were extracted from the Surveillance, Epidemiology, and End Results database from 2004 to 2016. Univariate and multivariate logistic regression analysis was performed to identify risk factors of secondary cancer. Risk factors selected from the multivariable logistic regression analysis were used to build a predicting model.
Results: A total of 3931 patients were included: 329 (8.37%) patients developed secondary cancers and 3602 (91.63%) patients did not have secondary cancers. Univariate logistic regression analysis revealed that age, race, and the American Joint Committee on Cancer (AJCC) stage were risk factors of secondary cancer. Multivariable analysis demonstrated that age [Odds ratio (OR) = 1.03, P < 0.001], race (OR = 1.17, P = 0.010), AJCC stage (OR = 0.82, P = 0.002), and chemotherapy (OR = 1.55, P = 0.028) were independent risk factors of secondary cancer. Age, race, AJCC stage, and chemotherapy were entered into a nomogram for predicting secondary cancer. The area under the ROC curve of the nomogram was 0.645 [95% confidence interval (CI): 0.617-0.673]. The decision curve showed that if the threshold probability is between 4% and 25%, using the nomogram added more benefit than either the treat-all-patients scheme or the treat-none scheme.
Conclusion: Age, race, AJCC stage, and chemotherapy were independent risk factors of secondary cancer in nasopharyngeal carcinoma patients after radiotherapy.
Keywords: nasopharyngeal carcinoma, secondary cancer, risk factor, nomogram
Introduction
Nasopharyngeal carcinoma (NPC) is a highly epidemiologic and radiosensitive cancer [1, 2]. Radiotherapy is the primary treatment for NPC [3, 4]. With the improvement in diagnosis and treatment, long-term survival of NPC patients are increasing. As a result, secondary cancer after radiotherapy becomes a serious complication among these long-term survivors [5, 6]. Although the secondary cancer is rare [7-10], it can decrease patients' survivals [11]. The low frequency of secondary cancer makes it difficult to identify the potential predictive factors. This retrospective study was conducted to identify risk factors of secondary cancer in NPC patients after radiotherapy using the data of the Surveillance, Epidemiology, and End Results (SEER) database.
Materials and Methods
Data source and patients
This retrospective study searched the SEER database to extract data of NPC patients from 2004 to 2016. The inclusion criteria were as follows. (1) Pathologically confirmed NPC. (2) definite TNM stages of the American Joint Committee on Cancer (AJCC), (3) NPC was the first cancer, (4) not stage M1, and (5) received radiotherapy. Patients' characteristics of age, sex, race, tumor grade, World Health Organization (WHO) classification, AJCC stage, chemotherapy, and secondary cancer were extracted.
Identifying risk factors
Univariate logistic regression analysis was performed to identify potential risk factors of secondary cancer. All the patients' characteristics of age, sex, race, tumor grade, WHO classification, AJCC stage, and chemotherapy were included in the univariate logistic regression analysis. All the factors were also included in the multivariate logistic regression analysis to identify independent risk factors. Factors with a P < 0.05 in the multivariable logistic regression analysis were considered as the independent risk factors of secondary cancer. The results of logistic regression analysis were reported as Odds ratios (ORs) with 95% confidence intervals (CIs).
Nomogram development
The independent risk factors of secondary cancer identified from the multivariable logistic regression analysis were used to develop a predictive nomogram. Receiver operating characteristic (ROC) curve analysis was used to assess the nomogram discrimination capacity. The area under the ROC curve (AUC) was calculated for quantification. The performance of the nomogram was assessed by a calibration plot for internal calibration. The decision curve analysis (DCA) was adopted to evaluate the clinical efficacy of the nomogram and analyze the net benefit under different risk thresholds.
Statistical analysis
The continuous variable of age was compared using Wilcoxon rank sum test between secondary cancer group and non-secondary cancer group. Categorical variables, including sex, race, tumor grade, WHO classification, AJCC stage, and chemotherapy, were analyzed using the χ2 test or Fisher's exact test. Overall survival between the secondary cancer group and non-secondary cancer group were calculated using the Kaplan-Meier analysis with log-rank test statistics. Multivariable proportional hazards models adjusted for age, sex, race, tumor grade, WHO classification, AJCC stage, and chemotherapy were implemented to assess independent prognostic factors.
Statistical analyses were performed using SPSS Statistics Version 26.0 software (IBM Co., Armonk, NY, USA) and R software (version 4.0.2). Two-tailed P values < 0.05 were considered statistically significant.
Results
Patient characteristics
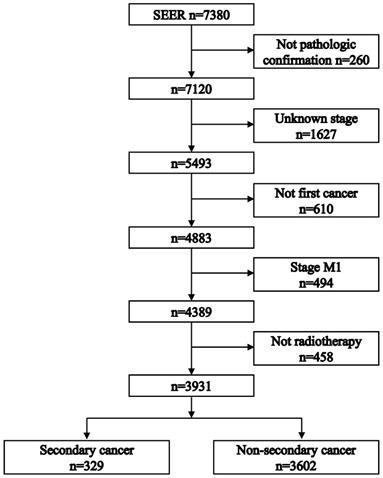
Figure 1 shows the process of patient selection. A total of 3931 patients were included. The secondary cancer group included 329 (8.37%) patients. The non-secondary cancer group included 3602 (91.63%) patients. Table 1 summarizes the patient characteristics. The median follow-up times were 46 [interquartile range (IQR): 20-85] months in the non-secondary cancer group and 69 (IQR: 39-102) months in the secondary cancer group, respectively.
Flowchart depicting patient selection.
Patient characteristics.
| Non-secondary cancer (n=3602) | Secondary cancer (n=329) | P | |
|---|---|---|---|
| Age (year) | <0.001 | ||
| median | 59 | 53 | |
| IQR | 52-65 | 43-63 | |
| Race | 0.008 | ||
| asian | 1486 (41.3%) | 106 (32.1%) | |
| black | 422 (11.7%) | 39 (11.9%) | |
| white | 1614 (44.8%) | 173 (52.6%) | |
| other | 80 (2.22%) | 11 (3.34%) | |
| Sex | 0.164 | ||
| female | 1102 (30.6%) | 88 (26.7%) | |
| male | 2500 (69.4%) | 241 (73.3%) | |
| Grade | 0.174 | ||
| I | 56 (1.5%) | 9 (2.8%) | |
| II | 280 (7.7%) | 35 (10.6%) | |
| III | 1119 (31.1%) | 101 (30.7%) | |
| IV | 1133 (31.5%) | 96 (29.2%) | |
| unknown | 1014 (28.2%) | 88 (26.7%) | |
| Pathology | 0.192 | ||
| WHO I | 1124 (31.2%) | 121 (36.8%) | |
| WHO II | 881 (24.5%) | 70 (21.3%) | |
| WHO III | 709 (19.7%) | 59 (17.9%) | |
| other | 888 (24.6%) | 79 (24.0%) | |
| T stage | 0.096 | ||
| 1 | 1148 (31.9%) | 121 (36.8%) | |
| 2 | 927 (25.7%) | 91 (27.7%) | |
| 3 | 739 (20.5%) | 60 (18.2%) | |
| 4 | 788 (21.9%) | 57 (17.3%) | |
| N stage | 0.042 | ||
| 0 | 867 (24.1%) | 101 (30.7%) | |
| 1 | 1218 (33.8%) | 109 (33.1%) | |
| 2 | 1078 (29.9%) | 87 (26.4%) | |
| 3 | 439 (12.2%) | 32 (9.8%) | |
| AJCC | 0.007 | ||
| I | 296 (8.3%) | 42 (12.8%) | |
| II | 916 (25.4%) | 95 (28.9%) | |
| III | 1230 (34.1%) | 104 (31.6%) | |
| IV | 1160 (32.2%) | 88 (26.7%) | |
| Chemotherapy | 0.897 | ||
| no | 445 (12.4%) | 42 (12.8%) | |
| yes | 3157 (87.6%) | 287 (87.2%) |
IQR: interquartile range. WHO: World Health Organization. AJCC: American Joint Committee on Cancer.
Survival between the secondary cancer and non-secondary cancer groups
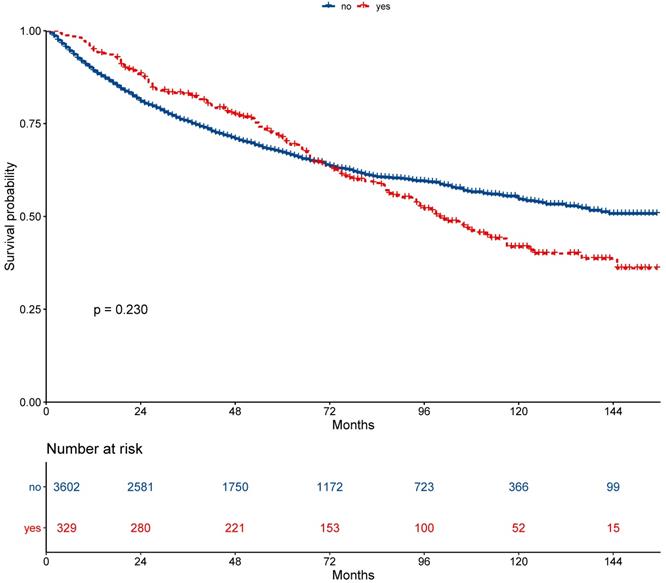
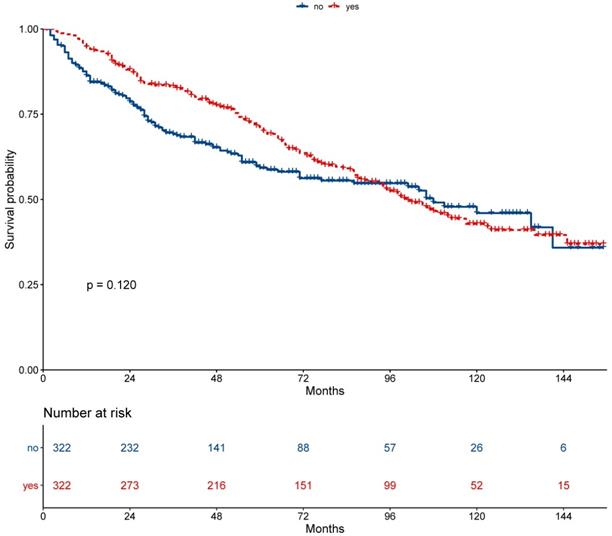
The 5-year overall survival did not differ between the secondary cancer and non-secondary cancer groups (71.2% vs. 67.2%; P = 0.230, Figure 2). The 7-year overall survival of the secondary cancer and non-secondary cancer groups was 63.4% and 63.6%. Overall survival of the secondary cancer group was worse than that of the non-secondary cancer group in 7th year after radiotherapy. Patient characteristics after propensity score matching were showed in Table 2. After propensity score matching, the 5-year overall survival was similar between the secondary cancer and non-secondary cancer groups (59.3% vs. 71.1%; P = 0.120, Figure 3).
Survival between patients with secondary cancer and without secondary cancer.
Patient characteristics after propensity score matching.
| Non-secondary cancer (n=322) | Secondary cancer (n=322) | P | |
|---|---|---|---|
| Age (year) | 0.672 | ||
| median | 59 | 58 | |
| IQR | 51-67 | 52-65 | |
| Race | 0.751 | ||
| asian | 116 (36.0%) | 106 (32.9%) | |
| black | 30 (9.3%) | 37 (11.5%) | |
| white | 10 (3.1%) | 10 (3.1%) | |
| other | 166 (51.6%) | 169 (52.5%) | |
| Sex | 0.860 | ||
| female | 90 (28.0%) | 87 (27.0%) | |
| male | 232 (72.0%) | 235 (73.0%) | |
| Grade | 0.741 | ||
| I | 7 (2.2%) | 8 (2.4%) | |
| II | 32 (10.0%) | 34 (10.6%) | |
| III | 96 (29.8%) | 100 (31.1%) | |
| IV | 108 (33.5%) | 92 (28.6%) | |
| unknown | 79 (24.5%) | 88 (27.3%) | |
| Pathology | 0.345 | ||
| WHO I | 65 (20.2%) | 74 (23.0%) | |
| WHO II | 108 (33.5%) | 119 (37.0%) | |
| WHO III | 73 (22.7%) | 70 (21.7%) | |
| other | 76 (23.6%) | 59 (18.3%) | |
| T stage | 0.991 | ||
| 1 | 114 (35.4%) | 114 (35.4%) | |
| 2 | 89 (27.6%) | 91 (28.3%) | |
| 3 | 59 (18.4%) | 60 (18.6%) | |
| 4 | 60 (18.6%) | 57 (17.7%) | |
| N stage | 0.489 | ||
| 0 | 85 (26.4%) | 94 (29.2%) | |
| 1 | 128 (39.8%) | 109 (33.9%) | |
| 2 | 79 (24.5%) | 87 (27.0%) | |
| 3 | 30 (9.3%) | 32 (9.9%) | |
| AJCC | 0.326 | ||
| I | 23 (7.1%) | 35 (10.9%) | |
| II | 109 (33.9%) | 95 (29.5%) | |
| III | 102 (31.7%) | 104 (32.3%) | |
| IV | 88 (27.3%) | 88 (27.3%) | |
| Chemotherapy | 0.091 | ||
| no | 26 (8.1%) | 40 (12.4%) | |
| yes | 296 (91.9%) | 282 (87.6%) |
IQR: interquartile range. WHO: World Health Organization. AJCC: American Joint Committee on Cancer.
Survival between patients with secondary cancer and without secondary cancer after propensity score matching.
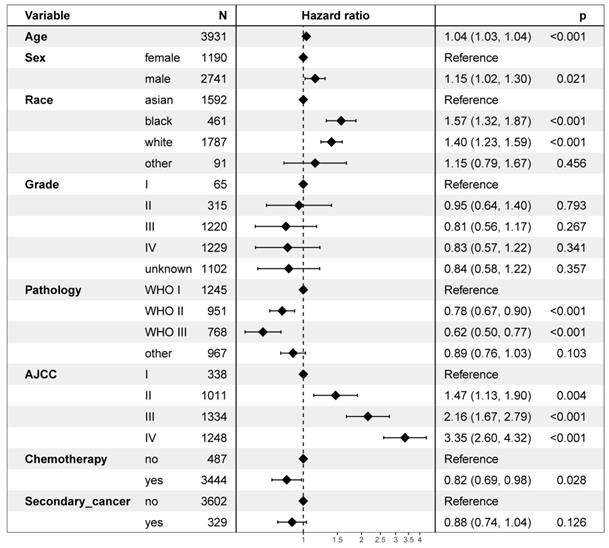
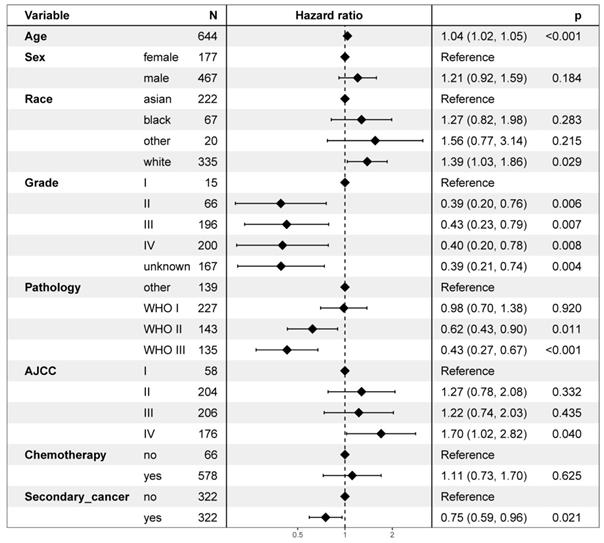
On multivariable proportional hazards model, factors of age, sex, race, WHO classification, AJCC stage, and chemotherapy were independent prognostic factors for OS. However, secondary cancer was not an independent prognostic factor for OS (hazard ratio = 0.88, 95% CI: 0.74-1.04; P = 0.126, Figure 4). After propensity score matching, secondary cancer was an independent prognostic factor for OS (hazard ratio = 0.75, 95% CI: 0.59-0.96; P = 0.021, Figure 5).
Multivariate regression analysis of prognostic factors.
Multivariate regression analysis of prognostic factors after propensity score matching.
Independent risk factors of secondary cancer
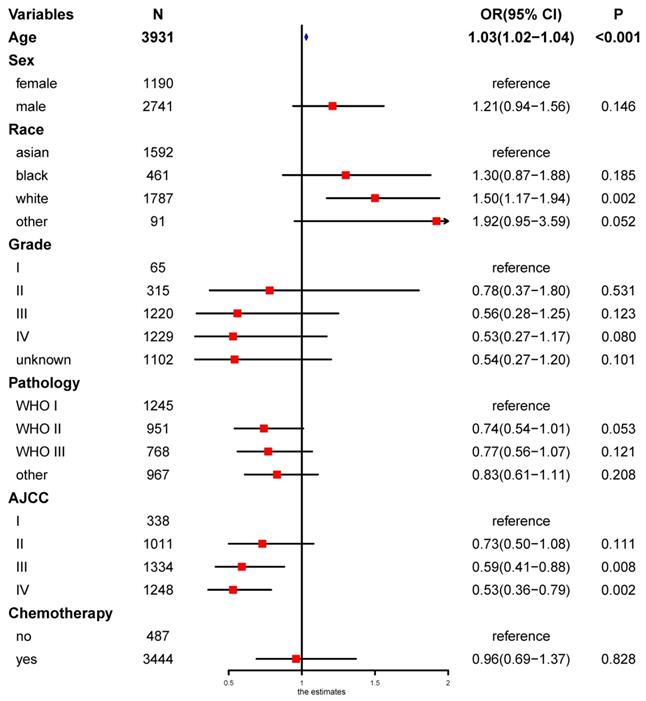
Univariate logistic regression analysis revealed that age, race, and the AJCC stage were risk factors of secondary cancer (Figure 6). Multivariable logistic regression analysis demonstrated that age (OR = 1.03, P < 0.001), race (OR = 1.17, P = 0.010), AJCC stage (OR = 0.82, P = 0.002), and chemotherapy (OR = 1.55, P = 0.028) were independent risk factors of secondary cancer (Figure 7). Chemotherapy was not a risk factor of secondary cancer in the univariate logistic regression analysis. However, it was an independent risk factor of secondary cancer in the multivariable logistic regression analysis.
Univariate logistic regression analysis for risk factors of secondary cancer.
Multivariable logistic regression analysis for independent risk factors of secondary cancer.
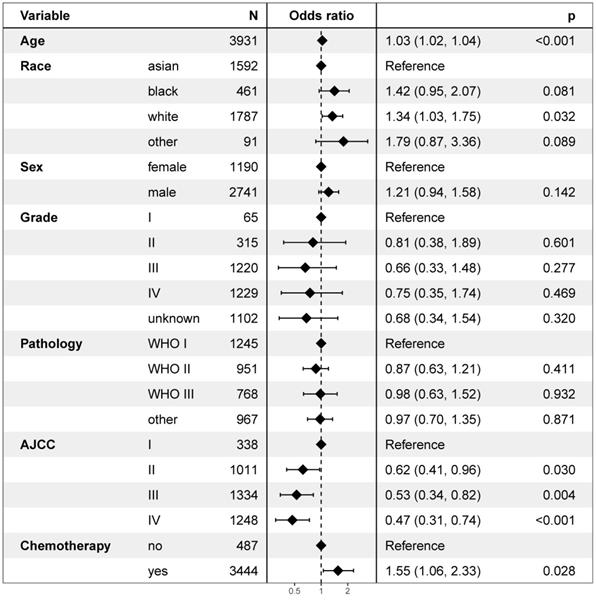
White patients were more likely to develop secondary cancer (OR = 1.34, 95% CI: 1.03-1.75; P = 0.032) setting Asian patients as reference. Patients with stage IV (OR = 0.47, 95% CI: 0.31-0.74; P < 0.001), III (OR = 0.53, 95% CI: 0.34-0.82; P = 0.004), and II (OR = 0.62, 95% CI: 0.41-0.96; P = 0.030) were less likely to have secondary cancer. Patients receiving chemotherapy were more likely to develop secondary cancer (OR = 1.55, P = 0.028).
Development of a prediction nomogram
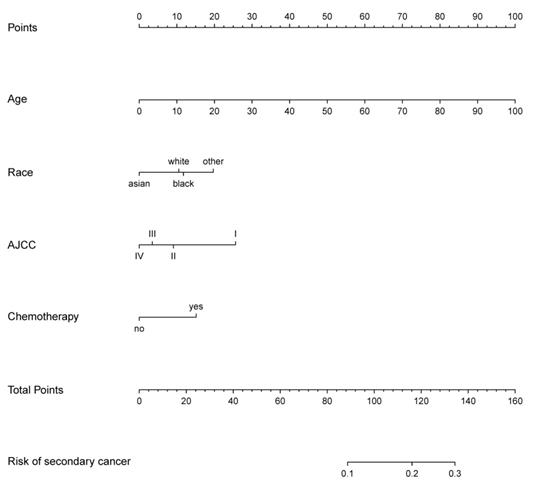
The prediction nomogram that incorporated the factors selected in the multivariable logistic regression analysis was developed (Figure 8). The score for each independent risk factor was determined by drawing a line from the factor to the points axis. The sum of the points was located on the total points axis. The probability of development of secondary cancer was located on the points drawing straight down to the risk of secondary cancer axis.
Nomogram of secondary cancer. The nomogram was developed based on the result of the multivariable logistic regression analysis.
Prediction of nomogram performance
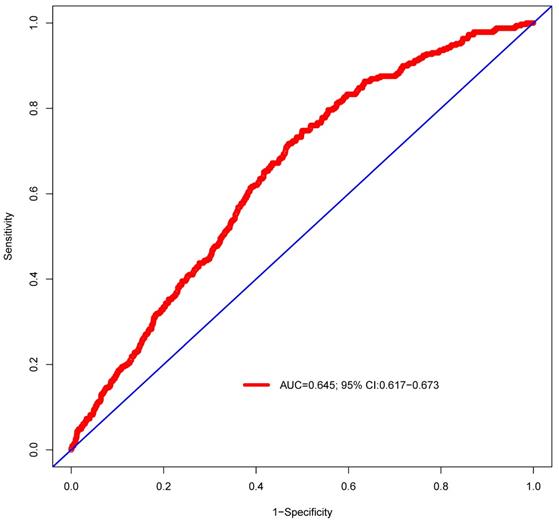
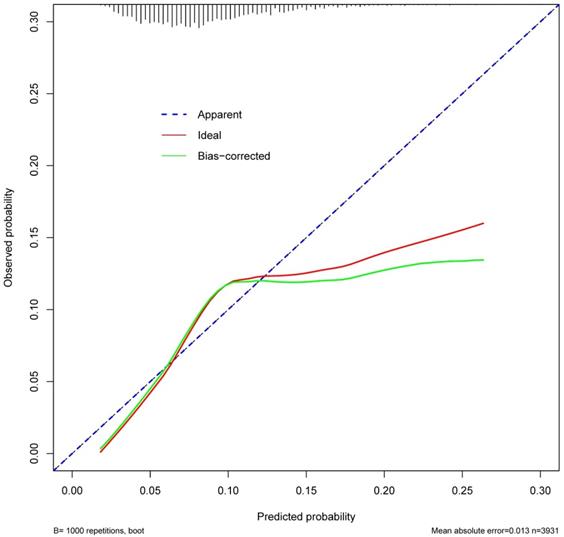
ROC curve was established to assess the accuracy of the nomogram (Figure 9). The AUC of the nomogram was 0.645 with a 95% CI ranging from 0.617 to 0.673. The nomogram was internally validated by computing the bootstrap-corrected Harrell index and by the calibration plot (Figure 10). The calibration plot showed that the probability of secondary cancer predicted by the nomogram was relatively matched.
Predictive performance of the nomogram. The AUC is 0.645 (95% CI 0.617-0.673).
The Calibration curve of the nomogram for predicting secondary cancer. The y-axis represents the actual secondary cancer rate. The x-axis represents the predicted secondary cancer risk. The blue line represents a perfect prediction by an ideal model. The red line represents the performance of the nomogram. The green line represents the performance of the nomogram with bias corrected.
Clinical Use
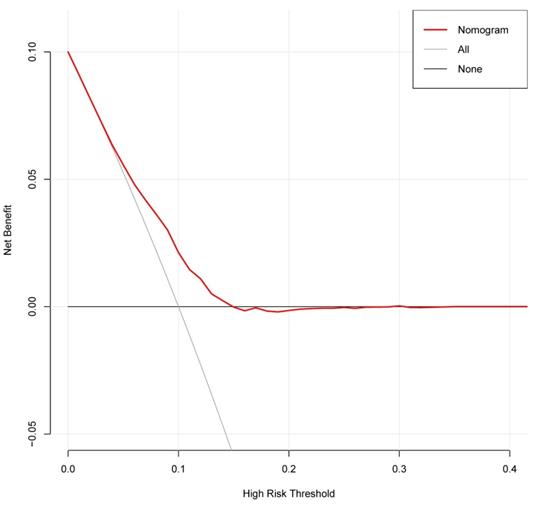
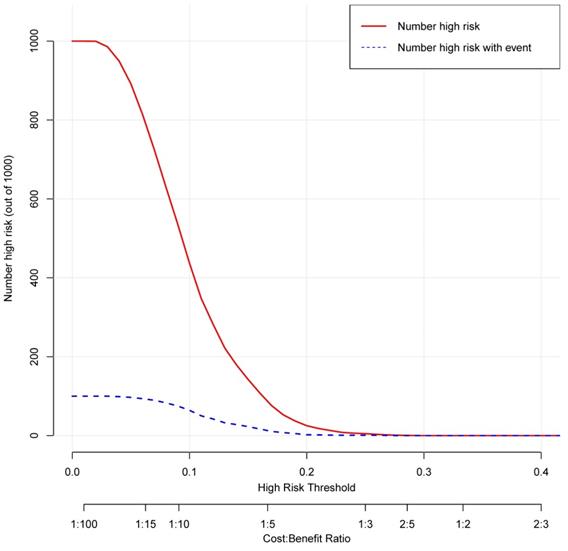
The decision curve analysis for the nomogram was presented in Figure 11. The decision curve showed that if the threshold probability is between 4% and 25%, using the nomogram added more benefit than either the treat-all-patients scheme or the treat-none scheme. The clinical impact curve for the nomogram was showed in Figure 12.
Decision curve analysis for the nomogram. The y-axis measures the net benefit. The grey line represents the assumption that all patients have secondary cancer. The black solid line represents the assumption that no patients have secondary cancer. The red line represents the nomogram.
Clinical impact curve for the nomogram. The red curve indicates the number of people who are classified as positive (high risk) by the nomogram at each threshold probability. The blue curve is the number of true positives at each threshold probability.
Discussion
This retrospective study identified several independent risk factors associated with secondary cancer of NPC after radiotherapy. Although some studies had investigated the risk factor of secondary cancer. Risk factors needs to be further assessed due to the low incidence of secondary cancer [12, 13]. The current study investigated the potential risk factors based on a large sample size. Moreover, we established and internally validated a nomogram based on age, race, AJCC, and chemotherapy for predicting secondary cancer. This predictive nomogram could provide personalized estimates of secondary cancer development to guide follow-up strategy for NPC patients. Patients might benefit from this nomogram.
The mechanism of secondary cancer after radiotherapy was not yet clear. Previous studies had showed that the risk factors for secondary cancer included hereditary susceptibility, age of initiative irradiation, the type of primary tumor, the toleration of the irradiated tissues, the dose and area of irradiation, and combination of chemotherapy [14, 15]. Our study revealed similar results. White patients were more likely to develop secondary cancer (OR = 1.34, 95% CI: 1.03-1.75; P = 0.032) setting Asian patients as reference. Moreover, older age was more likely to develop secondary cancer (OR = 1.03, 95% CI: 1.02-1.04; P < 0.001).
The multivariable logistic regression analysis revealed that patients with stage IV (OR = 0.47, 95% CI: 0.31-0.74; P < 0.001), III (OR = 0.53, 95% CI: 0.34-0.82; P = 0.004), and II (OR = 0.62, 95% CI: 0.41-0.96; P = 0.030) were less likely to have secondary cancer. This was an unexpected finding. In clinical practice, patients with locoregionally advanced diseases would receive more chemotherapy compared to early-stage diseases. Based on the multivariable logistic regression of our study, patients with locoregionally advanced diseases were more likely to develop secondary cancers. The possible explanation was that locoregionally advanced diseases had worse survival compared with early-stage diseases. The survival time might be insufficient to develop secondary cancers.
Our study suggested that chemotherapy was not a risk factor of secondary cancer in the univariate logistic regression analysis. However, chemotherapy was an independent risk factors of secondary cancer in the multivariable logistic regression analysis. This was another unexpected finding. It was reported that chemotherapy could increase the incidence of secondary cancer and reduce the latency between radiotherapy and secondary cancer occurrence [13, 16]. However, a recently published study revealed that chemotherapy was not an independent risk factor of secondary cancer [17, 18]. Until now, the effect of chemotherapy on secondary cancer was still unclear due to the limited studies. Our study with a large sample size found that chemotherapy was associated with the incidence of secondary cancer. The result needed to be verified in prospective studies with longer follow-up time.
Until now, latency of secondary cancer is unclear. It was reported that the latency period for development of secondary cancer was between 3 and 36 years (median: 8.5 years) after radiotherapy [17]. On the other hand, the latency of secondary cancer was shorter for patients who received intensity-modulated radiotherapy than that for patients who received conventional radiotherapy (median years: 4.0 vs. 11.0, P = 0.013) [11]. Due to the limitations of SEER database, the latency of secondary cancer after radiotherapy could not be extracted. Thus, the latency period for development of secondary cancer could not be calculated. However, the overall survival of secondary cancer group was worse than that of non-secondary cancer group in 7th year after radiotherapy. This result might indicate that the latency of secondary cancer was less than 7 years.
This nomogram revealed that the AUC was 0.645 (95% CI: 0.617 to 0.673). The result suggested that the discriminatory capacity of the nomograms was relatively weak. Moreover, calibration curves, used to quantify how close predictions were to the actual outcome, showed that prediction was also not well calibrated. The possible explanations were as following: (1) Secondary cancer of NPC after radiotherapy was rare. The frequency of secondary cancer was very low. Several studies reported that the incidence of secondary cancer ranged from 0.8% to 5.6% [7-10]. Although our study reported a percent of 8.37% for secondary cancer after radiotherapy, the sample size of patients with secondary cancer was still small. The small sample size might have been insufficient for establishing a nomogram for prediction of secondary cancer in NPC patients after radiotherapy. (2) Only 4 risk factors of secondary cancer were identified in the multivariable logistic regression analysis. The nomogram was established based on the risk factors of age, race, AJCC, and chemotherapy. Important factors of radiation therapy technique, radiation dose and its distribution were not included due to the limitation of SEER database [19-21]. Thus, the nomogram could not provide well-discriminating ability. This nomogram should be modified with more independent risk factors to improve its efficacy.
Limitations of this study should be considered. First, considering the low incidence of secondary cancer, the nomogram was only internally validated by computing the bootstrap-corrected Harrell index and by the calibration plot. The nomogram was not externally verified in a validation cohort. Its clinical utility should be treated with caution. Second, the locations of secondary cancer were not provided in the SEER database. It was unclear whether the secondary cancer was more likely to occur in the fields of radiotherapy.
In conclusion, age, race, AJCC stage, and chemotherapy were independent risk factors of secondary cancer in nasopharyngeal carcinoma patients after radiotherapy. Multicenter studies with large sample sizes and longer follow-up time are needed to verify the nomogram of this study.
Acknowledgements
This study was supported by the grant of Department of Education of Guangxi Zhuang Autonomous Region (no. KY2016LX029), the grant of Guangxi Medical University (no. GXMUYSF201521), and the Research and Development Project of Guangxi (no. 1598012-22 and no. AB18221007).
Competing Interests
The authors have declared that no competing interest exists.
References
1. Sung H, Ferlay J, Siegel RL, Laversanne M, Soerjomataram I, Jemal A. et al. Global Cancer Statistics 2020: GLOBOCAN Estimates of Incidence and Mortality Worldwide for 36 Cancers in 185 Countries. CA Cancer J Clin. 2021;71:209-49
2. Siegel RL, Miller KD, Jemal A. Cancer statistics, 2018. CA Cancer J Clin. 2018;68:7-30
3. Lee AW, Ma BB, Ng WT, Chan AT. Management of Nasopharyngeal Carcinoma: Current Practice and Future Perspective. Journal of clinical oncology: official journal of the American Society of Clinical Oncology. 2015;33:3356-64
4. Li YQ, Tian YM, Tan SH, Liu MZ, Kusumawidjaja G, Ong EHW. et al. Prognostic Model for Stratification of Radioresistant Nasopharynx Carcinoma to Curative Salvage Radiotherapy. Journal of clinical oncology: official journal of the American Society of Clinical Oncology. 2018;36:891-9
5. Chen YP, Chan ATC, Le QT, Blanchard P, Sun Y, Ma J. Nasopharyngeal carcinoma. Lancet. 2019;394:64-80
6. Fu X, Chen S, Chen W, Yang Z, Song M, Li H. et al. Clinical analysis of second primary gingival squamous cell carcinoma after radiotherapy. Oral oncology. 2018;84:20-4
7. Mark RJ, Poen J, Tran LM, Fu YS, Selch MT, Parker RG. Postirradiation sarcomas. A single-institution study and review of the literature. Cancer. 1994;73:2653-62
8. Giannini L, Incandela F, Fiore M, Gronchi A, Stacchiotti S, Sangalli C. et al. Radiation-Induced Sarcoma of the Head and Neck: A Review of the Literature. Front Oncol. 2018;8:449
9. Lin C, Lin SW, Weng SF, Lin YS. Risk of second primary malignancies after nasopharyngeal carcinoma: a population-based cohort study in Taiwan. Head & neck. 2014;36:209-14
10. Wei Z, Xie Y, Xu J, Luo Y, Chen F, Yang Y. et al. Radiation-induced sarcoma of head and neck: 50 years of experience at a single institution in an endemic area of nasopharyngeal carcinoma in China. Med Oncol. 2012;29:670-6
11. Liu C, Liao L, Wu G, Yan H, Chen X, Wang C. et al. Radiation-induced second primary squamous cell carcinoma of the oral cavity after radiotherapy for nasopharyngeal carcinoma. Oral oncology. 2020;109:104863
12. Wang CC, Chen ML, Hsu KH, Lee SP, Chen TC, Chang YS. et al. Second malignant tumors in patients with nasopharyngeal carcinoma and their association with Epstein-Barr virus. Int J Cancer. 2000;87:228-31
13. Wang X, Li Y, Gao Y, Ouyang D, Guo Z. Second primary squamous cell carcinoma in patients with nasopharyngeal carcinoma after radiotherapy-Predictors and prognostic factors. Head & neck. 2018;40:1434-42
14. Thariat J, Italiano A, Collin F, Iannessi A, Marcy PY, Lacout A. et al. Not all sarcomas developed in irradiated tissue are necessarily radiation-induced-spectrum of disease and treatment characteristics. Crit Rev Oncol Hematol. 2012;83:393-406
15. Yang Q, Mo Y, Zhao Q, Ban X, He M, Cai P. et al. Radiation-induced sarcomas of the head and neck in post-radiation nasopharyngeal carcinoma. Radiol Med. 2017;122:53-60
16. Zhang AY, Judson I, Benson C, Wunder JS, Ray-Coquard I, Grimer RJ. et al. Chemotherapy with radiotherapy influences time-to-development of radiation-induced sarcomas: a multicenter study. Br J Cancer. 2017;117:326-31
17. Lou J, Jiang L, Dai X, Wang H, Yang J, Guo L. et al. Radiation-Induced Sarcoma of the Head and Neck Following Radiotherapy for Nasopharyngeal Carcinoma: A Single Institutional Experience and Literature Review. Front Oncol. 2020;10:526360
18. Zhao W, Lei H, Zhu X, Li L, Qu S, Liang X. et al. The clinical characteristics of secondary primary tumors in patients with nasopharyngeal carcinoma after intensity-modulated radiotherapy: A retrospective analysis. Medicine. 2016;95:e5364
19. Haciislamoglu E, Cinar Y, Eren M, Canyilmaz E, Gurcan F, Serdar L. et al. Comparison of Radiation-Induced Secondary Malignancy Risk Between Sequential and Simultaneous Integrated Boost for the Treatment of Nasopharyngeal Carcinoma: Intensity-Modulated Radiotherapy versus Volumetric-Modulated Arc Therapy. Cancer Manag Res. 2020;12:2513-21
20. Lee HF, Lan JH, Chao PJ, Ting HM, Chen HC, Hsu HC. et al. Radiation-induced secondary malignancies for nasopharyngeal carcinoma: a pilot study of patients treated via IMRT or VMAT. Cancer Manag Res. 2018;10:131-41
21. Sherif RS, Attalla EM, Elshemey WM, Madian NG. The risk of secondary cancer in nasopharyngeal carcinoma paediatric patients due to intensity modulated radiotherapy and mega-voltage cone beam computed tomography. J Med Imaging Radiat Oncol. 2017;61:402-9
Author contact
![]() Corresponding author: Xin-Bin Pan. Address: No. 71 Hedi Road, Qingxiu District, Nanning, Guangxi 530021, P.R. China; Email: panxinbinedu.cn; Telephone: [+8613471171468]; Fax: [0771-5312000]
Corresponding author: Xin-Bin Pan. Address: No. 71 Hedi Road, Qingxiu District, Nanning, Guangxi 530021, P.R. China; Email: panxinbinedu.cn; Telephone: [+8613471171468]; Fax: [0771-5312000]