Impact Factor ISSN: 1837-9664

 Global reach, higher impact
J Cancer 2022; 13(13):3477-3484. doi:10.7150/jca.78407 This issue Cite
Research Paper
Prognostic Impact of Ectopic Fat Deposition within Psoas Muscle in Stage IV Gastric Cancer Patients Undergoing Systemic Chemotherapy
Takako Ikegami1,2, Hiroki Nishikawa1,3 ![]() , Masahiro Goto2, Fukutaro Shimamoto2, Tetsuji Terazawa2, Toshifumi Yamaguchi2, Eiki Yamasaki1, Ken Asaishi2, Shiro Nakamura1, Kazuhide Higuchi1
, Masahiro Goto2, Fukutaro Shimamoto2, Tetsuji Terazawa2, Toshifumi Yamaguchi2, Eiki Yamasaki1, Ken Asaishi2, Shiro Nakamura1, Kazuhide Higuchi1
1. The Second Department of Internal Medicine, Osaka Medical and Pharmaceutical University, Takatsuki, Osaka, 569-8686, Japan.
2. Cancer Chemotherapy Center, Osaka Medical and Pharmaceutical University, Takatsuki, Osaka, 569-8686, Japan.
3. The Premier Departmental Research of Medicine, Osaka Medical and Pharmaceutical University, Takatsuki, Osaka, 569-8686, Japan.
Received 2022-8-27; Accepted 2022-9-29; Published 2022-10-17
Abstract

Aims: In this study, we focused on the fat ratio within psoas muscle (FRPM) and sought to clarify the impact of FRPM on overall survival (OS) in stage IV gastric cancer (GC) patients undergoing systemic chemotherapy (n = 79, median age = 69 years, 59 males).
Methods: The median FRPM was 1.67 %. Forty patients with FRPM ≥1.67 % were defined as the FRPM-high group, and the remaining 39 patients was defined as the FRPM-low group. The median PMI in male and female patients was 4.35 cm2/m2 and 2.88 cm2/m2. Thirty male patients with PMI ≥4.35 cm2/m2 and 10 female patients with PMI ≥2.88 cm2/m2 was defined as the PMI-high group, and the remaining 39 patients was defined as the PMI-low group.
Results: The 1-, 2- and 3- year cumulative OS rate for all cases was 70.8%, 24.3% and 14.6%. The proportion of ECOG-PS 2 or 3 in patients with FRPM-high and FRPM-low was 17.5% (7/40) and 2.6% (1/39). The 1-, 2- and 3- year cumulative OS rate in patients with FRPM-high and FRPM-low was 67.3%, 14.3% and 7.6% in the FRPM-high group and 74.8%, 40.5% and 32.4% in the FRPM-low group (P = 0.0341). The 1-, 2- and 3- year cumulative OS rate in patients with PMI-high and PMI-low was 86.7%, 40.4% and 30.0% in the PMI-high group and 55.8%, 12.8% and 6.4% in the PMI-low group (P < 0.0001). In the multivariate analysis of factors associated with OS, PMI (P = 0.0047) and FRPM (P = 0.0019) were independent predictors for the OS.
Conclusion: Higher FRPM can be associated with decreased physical activity, and not only skeletal muscle mass but also skeletal muscle function can be an essential prognostic factor in stage IV GC patients undergoing systemic chemotherapy.
Keywords: Advanced gastric cancer, Systemic chemotherapy, Ectopic fat deposition, Muscle quality, Prognosis
Introduction
Systemic chemotherapy for unresectable advanced or recurrent gastric cancer (GC) has been highly effective in reducing tumor size due to recent therapeutic advances [1-3]. However, radical cure by systemic chemotherapy for advanced GC is difficult at present. Based on the results of Japanese or international clinical trials, the median survival time (MST) for unresectable advanced or recurrent GC is roughly 15 months [1, 4]. In the treatment of advanced GC, the therapeutic goals are to improve clinical symptoms associated with cancer progression, to delay the onset of clinical symptoms, to delay tumor progression, and to prolong survival. Patients with advanced malignancy are prone to muscle protein loss due to muscle proteolysis-inducible substances and inflammatory cytokines released by the tumor cells [5, 6]. Advanced GC is no exception and is associated with a high rate of sarcopenia, defined by a loss of quantity and quality of skeletal muscle [7]. Sarcopenia in patients with advanced GC is also correlated with poor prognosis [8].
In addition to subcutaneous and visceral fat, the third type of fat that accumulates in the body is ectopic fat [9]. Ectopic fat is deposited in tissues where excessive accumulation of fat is not originally desired, such as skeletal muscle, liver, and vessel walls, and affects insulin sensitivity and lipid metabolism [9-11]. In Asians, including Japanese, ectopic fat tend to accumulate at a higher rate than in Westerners, even if they are not so overweight [12]. Ectopic fat infiltration into skeletal muscle is also known as myosteatosis [13, 14]. Ectopic fat is considered more dangerous than visceral fat because the accumulation of ectopic fat in organs is thought to worsen organ function itself. Ectopic accumulation of fat within skeletal muscle not only contributes to muscle weakness, but also interferes with the supply of nutrients to myofibers and can be associated with disease progression [15, 16]. A recent study reported that ectopic fat in skeletal muscle and liver can be linked to poorer survival in patients with colorectal liver metastases [17].
The impact of ectopic fat deposition in skeletal muscle (i.e., changes in muscle quality) on clinical outcomes in GC patients has been reported in several studies [18-24]. As far as we are aware, however, the data regarding muscle quality on survival in patients with stage IV GC undergoing systemic chemotherapy are currently scarce. Intramuscular adipose tissue is associated with CT density of muscle [19-24]. Previous studies have mainly focused on CT density of muscle [19-24]. In this study, we focused on the fat ratio within psoas muscle (FRPM) considering CT density for fat within psoas muscle, and sought to clarify these clinical research questions.
Patients and methods
Patients and our study
Between February 2017 and March 2021, a total of 79 patients with histologically confirmed stage IV GC receiving at least one systemic chemotherapy in our hospital can be found in our medical record, which were subject to our current analysis. Our primary endpoint was overall survival (OS). In our hospital, treatment strategy and chemotherapeutic regimen were carefully selected through discussion with surgeons and oncologists based on the current guidelines for GC. Factors relevant to the OS were retrospectively analyzed by univariate and multivariate analysis. Ascites was graded (none, mild, moderate and severe) by the CT images. The ethics committee of Osaka Medical and Pharmaceutical University hospital provided ethical approval (approval number, 2021-014).
Psoas muscle index (PMI) and our proposed FRPM
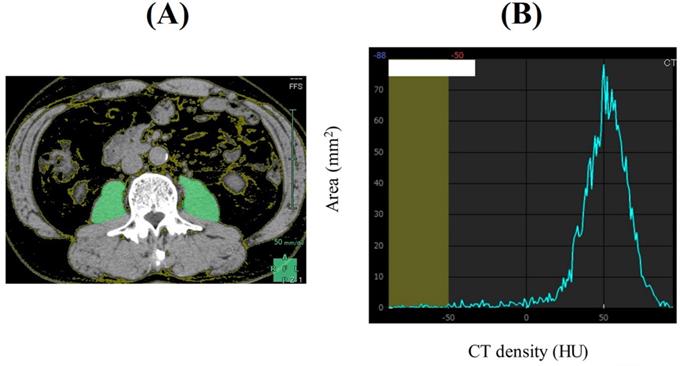
PMI was defined as sum of bilateral psoas muscle mass calculated by Vincent® (SYNAPSE VINCENT, Fuji Film medical corporation, Tokyo, Japan) at the lumbar three (L3) level on the CT images (at the time of initial chemotherapy) divided by height squared (cm2/m2). Our proposed FRPM at the L3 level (at the time of initial chemotherapy) was calculated as follows: fat mass within bilateral psoas muscle at the L3 level calculated by Vincent® (the sum of the areas within the left and right psoas muscles corresponding to fat (cm2)) divided by bilateral psoas muscle mass calculated by Vincent® (cm2) × 100 (%) (Figure 1). CT density for fat is defined as -200 Hounsfield Units (HU) to -50 HU. To minimize measurement bias, a single trained researcher (T. I.) identified and measured psoas muscle mass and fat within psoas muscle.
A representative CT image at the lumbar three level (Figure 1A). The sum of the areas within the left and right psoas muscles corresponding to fat (cm2, CT density: -200 HU to -50 HU) was calculated by Vincent®. In this case, area under the curve corresponding to CT density less than -50 HU is 13.71 mm2. The whole area under the curve is 2207.15 mm2. Thus, FRPM is calculated as 0.67% (Figure 1B).
Statistics
For analyzing continuous variables, the appropriate statistical method among Student's t test, Mann-Whitney U test and Spearman's rank correlation coefficient (rs) was chosen in order to compare 2 groups. For analyzing categorical variables, Pearson χ2 test was applied in order to evaluate between-group difference. For analyzing the significance of prognostic parameters, continuous parameters were divided into 2 groups at the median, and transformed into nominal variables. For the estimation of cumulative OS rate, we used the Kaplan-Meier method and tested by the log-rank test. A Cox proportional hazard model was applied for the multivariate analysis of parameters with a P value <0.05 in the univariate analysis. The observation period was defined as the time interval between the date of initial chemotherapy and the date of death or the last date of confirmed survival. In the data presentation, n (%) or median (interquartile range (IQR)) was used. Statistical software was JMP ver. 15 (SAS Institute Inc., Cary, NC), with a P value = 0.05 as the significance level.
Results
Patient baseline features
Baseline features for all study subjects (n = 79, 59 men and 20 women, median (IQR) age = 69 (59-74) years) are summarized in Table 1. All patients were histologically confirmed GC patients. The median (IQR) body mass index (BMI) was 21.5 (19.7-23.2) kg/m2. Eastern Cooperative Oncology Group Performance Status (ECOG-PS) 0 was found in 38 cases (48.1%), 1 in 33 (41.8%), 2 in 7 (8.9%), and 3 in 1 (1.3%). In terms of Human epidermal growth factor receptor 2 (HER2) status, 10 patients (12.7%) had HER2-positive GC, 59 (74.7%) had HER2-negative GC and the remaining 10 patients (12.7%) had unknown HER2 status. In terms of ascites, 45 patients (57.0%) had no ascites, 19 (24.1%) had mild ascites, 9 (11.4%) had moderate ascites and 6 (7.6%) had severe ascites. The median (IQR) FRPM was 1.67 (0.64-3.14) %. Forty patients with FRPM ≥1.67% were defined as the FRPM-high group, and the remaining 39 patients was defined as the FRPM-low group. The median (IQR) PMI in male and female patients was 4.35 (3.83-5.85) cm2/m2 and 2.88 (2.26-4.34) cm2/m2. Thirty male patients with PMI ≥4.35 cm2/m2 and 10 female patients with PMI ≥2.88 cm2/m2 was defined as the PMI-high group, and the remaining 39 patients was defined as the PMI-low group.
Baseline characteristics (n = 79)
| n or median (IQR) | |
|---|---|
| Age (years) | 69 (59-74) |
| Sex, male/female | 59/20 |
| ECOG-PS, 0/1/2/3/4 | 38/33/7/1/0 |
| HER2 status, positive/negative/unknown | 10/59/10 |
| Body mass index (kg/m2) | 21.5 (19.7-23.2) |
| Ascites, none/mild/moderate/severe | 45/19/9/6 |
| Alanine aminotransferase (IU/l) | 18 (12-28) |
| C reactive protein (mg/dl) | 0.5 (0.11-3.32) |
| eGFR (ml/min/1.73m2) | 69 (56-84) |
| Serum albumin (g/dl) | 3.6 (3.1-3.9) |
| Neutrophil count (/μl) | 4810 (3407-6464) |
| Total lymphocyte count (/μl) | 1327 (963-1739) |
| Neutrophil to lymphocyte ratio | 3.73 (2.27-5.72) |
| Fat ratio within psoas muscle at the L3 level (%) | 1.67 (0.64-3.14) |
| PMI at the L3 level (male, cm2/m2) | 4.35 (3.83-5.85) |
| PMI at the L3 level (female, cm2/m2) | 2.88 (2.26-4.34) |
IQR; interquartile range, ECOG-PS; Eastern Cooperative Oncology Group Performance Status, HER2; Human epidermal growth factor receptor 2, eGFR; estimated glomerular filtration rate; PMI; psoas muscle index.
Initial systemic chemotherapeutic regimen
In terms of initial chemotherapeutic regimen, S-1 monotherapy was performed in 3 cases, paclitaxel monotherapy in 1, S-1 plus trastuzumab therapy in 1, oxaliplatin plus capecitabine (XELOX) in 2, capecitabine plus cisplatin (XP) in 1, S-1 plus oxaliplatin (SOX) therapy in 27, SOX plus trastuzumab therapy in 6, SOX plus nivolumab therapy in 2, oxaliplatin plus leucovorin plus 5-fluorouracil therapy (FOLFOX) in 26, XP plus pembrolizumab therapy in 1, docetaxel plus oxaliplatin plus S-1 (DOS) in 3, and S-1 plus irinotecan plus oxaliplatin (TIROX) in 2. The remaining patients participated in double-blinded randomized clinical trials regarding immune checkpoint inhibitors such as nivolumab and pembrolizumab.
The cumulative OS rate according to the FRPM
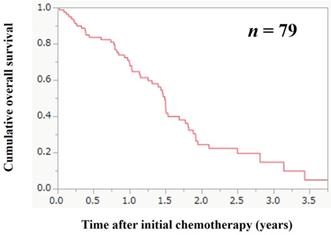
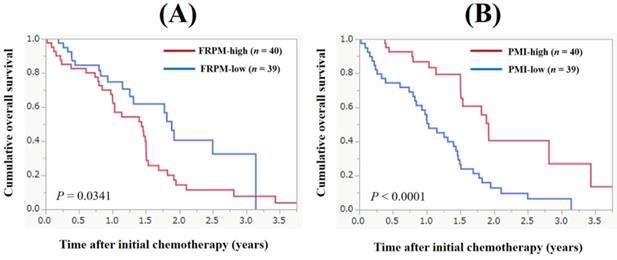
The median follow-up period in this study was 1.11 years. During the follow-up period, 53 patients (67.1%) died. All deaths were GC-related deaths. The 1-, 2- and 3- year cumulative OS rate for all cases was 70.8%, 24.3% and 14.6%. The MST for all cases was 1.47 years (Figure 2). The 1-, 2- and 3- year cumulative OS rate in patients with FRPM-high and FRPM-low was 67.3%, 14.3% and 7.6% in the FRPM-high group and 74.8%, 40.5% and 32.4% in the FRPM-low group (P = 0.0341, Figure 3A).
Cumulative overall survival (OS) for all cases (n = 79). The 1-, 2- and 3- year cumulative OS rate for all cases was 70.8%, 24.3% and 14.6%. The median survival time for all cases was 1.47 years.
Cumulative overall survival according to the fat ratio within psoas muscle (FRPM, Figure 3A) and psoas muscle index (PMI, Figure 3B).
The cumulative OS rate according to the PMI
The 1-, 2- and 3- year cumulative OS rate in patients with PMI-high and PMI-low was 86.7%, 40.4% and 30.0% in the PMI-high group and 55.8%, 12.8% and 6.4% in the PMI-low group (P < 0.0001, Figure 3B).
Survival according to the FRPM and the PMI in male and female
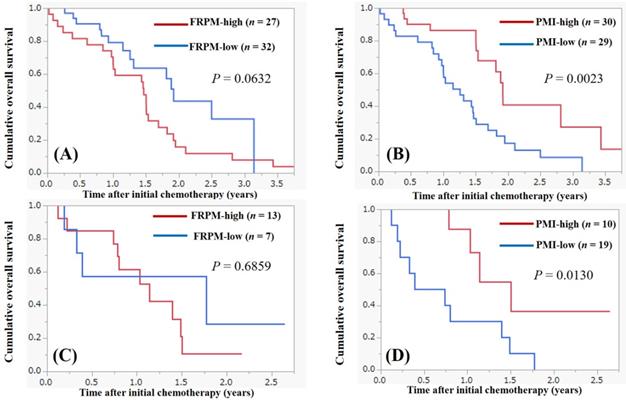
Survival analysis according to the FRPM and the PMI in male is shown in Figure 4A and 4B. In male, patients with FRPM-high had tendency for poorer survival compared with those with FRPM-low (P = 0.0632, Figure 4A). Patients with PMI-high had significantly better survival compared with those with PMI-low (P = 0.0023, Figure 4B). In female, the difference of survival between FRPM-high and low did not reach significance (P = 0.6859, Figure 4C), while patients with PMI-high had significantly better survival compared with those with PMI-low (P = 0.0130, Figure 4D).
Survival according to the FRPM and the PMI in male and female. (A) Survival according to the FRPM in male. (B) Survival according to the PMI in male. (C) Survival according to the FRPM in female. (D) Survival according to the PMI in female.
Uni- and multivariate analysis of variables for the OS
In the univariate analysis of variables for the OS for all cases, ECOG-PS 0 (P = 0.0059), presence of ascites (P = 0.0106), C reactive protein (CRP) ≥0.5 mg/dl (P = 0.0121), PMI-high (P < 0.0001), and FRPM-high (P = 0.0341) were significant factors (Table 2). In the multivariate Cox regression analysis for the OS, PMI-high (P = 0.0047), and FRPM-high (P = 0.0019) were independent predictors for the OS.
Univariate and multivariate analysis of factors associated with survival for all cases
| Variables | Univariate | Multivariate | |||
|---|---|---|---|---|---|
| n | P value | HR | 95% CI | P value | |
| Age ≥69 years, yes/no | 40/39 | 0.7706 | |||
| Sex, male/female | 59/20 | 0.0811 | |||
| ECOG-PS 0, yes/no | 38/41 | 0.0059 | 1.531 | 0.617-3.799 | 0.3578 |
| Presence of ascites, yes/no | 34/45 | 0.0106 | 0.864 | 0.342-2.187 | 0.7582 |
| BMI ≥21.5 kg/m2, yes/no | 39/40 | 0.1207 | |||
| Serum albumin ≥3.6 g/dl, yes/no | 43/36 | 0.0920 | |||
| CRP ≥0.5 mg/dl, yes/no | 40/39 | 0.0121 | 0.819 | 0.326-2.060 | 0.6719 |
| NLR ≥3.73, yes/no | 40/39 | 0.0817 | |||
| eGFR ≥69 ml/min/1.73m2, yes/no | 40/39 | 0.8701 | |||
| PMI-High, yes/no | 40/39 | <0.0001 | 6.399 | 1.767-23.175 | 0.0047 |
| FRPM-High, yes/no | 40/39 | 0.0341 | 0.170 | 0.056-0.521 | 0.0019 |
HR; hazard ratio, CI; confidence interval, ECOG-PS; Eastern Cooperative Oncology Group Performance Status, BMI; body mass index, CRP; C reactive protein, NLR; neutrophil to lymphocyte ratio, eGFR; estimated glomerular filtration rate, PMI; psoas muscle index, FRPM; fat ratio within psoas muscle.
Comparison of baseline data in patients with FRPM-high and FRPM-low
In comparison of baseline data in patients with FRPM-high and FRPM-low, the distribution of ECOG-PS was significantly different between the two groups (P = 0.0297). The proportion of ECOG-PS 0 in patients with FRPM-high and FRPM-low was 40% (16/40) and 56.4% (22/39). The proportion of ECOG-PS 2 or 3 in patients with FRPM-high and FRPM-low was 17.5% (7/40) and 2.6% (1/39). Age in the FRPM-high group tended to be significantly higher than that in the FRPM-low group (P = 0.0794). Estimated glomerular filtration rate (eGFR) in the FRPM-high group was significantly lower than that in the FRPM-low group (P = 0.0365) (Table 3).
Comparison of baseline data in patients with FRPM-high and FRPM-low
| Variables | FRPM-high (n = 40) | FRPM-low (n = 39) | P value |
|---|---|---|---|
| Age (years) | 71 (64-76) | 66 (58-71) | 0.0794 |
| Sex, male/female | 27/13 | 32 / 7 | 0.1370 |
| BMI (kg/m2) | 22.4 (20.1-23.7) | 20.8 (19.6-22.1) | 0.2132 |
| EOCG-PS, 0/1/2/3 | 16/17/7/0 | 22/16/0/1 | 0.0297 |
| Ascites, none/mild/moderate/severe | 24/7/4/5 | 21/12/5/1 | 0.2326 |
| Serum albumin | 3.6 (3.1-3.9) | 3.6 (3.1-3.9) | 0.9871 |
| CRP (mg/dl) | 0.58 (0.2-3.1) | 0.37 (0.07-3.32) | 0.5813 |
| NLR | 4.14 (2.22-6.53) | 3.49 (2.44-4.87) | 0.3244 |
| ALT (IU/l) | 17 (10-24) | 19 (13-37) | 0.1066 |
| eGFR (ml/min/1.73m2) | 65 (54-76) | 78 (56-89) | 0.0365 |
Data are presented as number or median (interquartile range). FRPM; fat ration within psoas muscle, BMI; body mass index, ECOS-PS; Eastern Cooperative Oncology Group Performance Status, CRP; C reactive protein, NLR; neutrophil to lymphocyte ratio, ALT; alanine aminotransferase, eGFR; estimated glomerular filtration rate.
Comparison of baseline data in patients with PMI-high and PMI-low
In comparison of baseline data in patients with PMI-high and PMI-low, significant difference was not found in any clinical parameter, but BMI in the PMI-high group tended to be significantly higher than that in the PMI-low group (P = 0.0812) (Table 4).
Comparison of baseline data in patients with PMI-high and PMI-low
| Variables | PMI-high (n = 40) | PMI-low (n = 39) | P value |
|---|---|---|---|
| Age (years) | 67 (58-73) | 70 (62-75) | 0.2158 |
| Sex, male/female | 30/10 | 29/10 | 1.000 |
| BMI (kg/m2) | 21.6 (20.3-22.9) | 21.0 (18.1-23.4) | 0.0812 |
| EOCG-PS, 0/1/2/3 | 22/16/2/0 | 16/17/5/1 | 0.3545 |
| Ascites, none/mild/moderate/severe | 24/10/4/2 | 21/9/5/4 | 0.7969 |
| Serum albumin (g/dl) | 3.6 (3.2-3.9) | 3.6 (3.1-3.9) | 0.3930 |
| CRP (mg/dl) | 0.60 (0.11-3.29) | 0.49 (0.11-3.32) | 0.8260 |
| NLR | 3.61 (2.47-4.73) | 4.0 (2.21-6.06) | 0.5192 |
| ALT (IU/l) | 18 (12-27) | 18 (12-31) | 0.9688 |
| eGFR (ml/min/1.73m2) | 72 (56-84) | 67 (54-85) | 0.8151 |
Data are presented as number or median (interquartile range). PMI; psoas muscle index, BMI; body mass index, ECOG-PS; Eastern Cooperative Oncology Group Performance Status, CRP; C reactive protein, NLR; neutrophil to lymphocyte ratio, ALT; alanine aminotransferase, eGFR; estimated glomerular filtration rate.
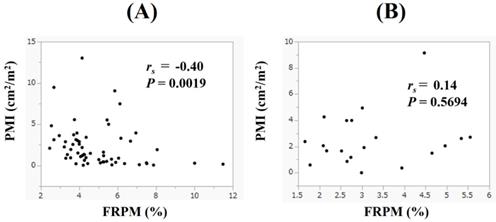
Correlation between PMI and FRPM in male and female patients
In male, PMI had the significant negative correlation with FRPM (rs = -0.40, P = 0.0019), while in female, such tendency was not found (rs = 0.14, P = 0.5694) (Figure 5A and 5B).
Discussion
Research on skeletal muscle has developed rapidly in recent years. Ectopic fat accumulation in skeletal muscle interferes with muscle function [9]. Thus, the degree of ectopic fat accumulation may reflect skeletal muscle function and severity of sarcopenia [9]. One of the mechanisms of insulin resistance in skeletal muscle is impaired insulin signaling, which is thought to be caused by ectopic fat accumulation [25, 26]. In this study, we focused on the FRPM and investigated its clinical significance in patients with stage IV GC undergoing systemic chemotherapy. As far as we know, there are few data regarding the impact of the severity of fat deposition within psoas muscle on OS in stage IV GC patients receiving systemic chemotherapy. Previous studies have mainly focused on CT density of muscle itself (i.e., intramuscular adipose tissue content) [19-24]. In this regard, we would like to emphasize the novelty of our proposed FRPM. As stated earlier, myosteatosis is ectopic adipose tissue infiltration into skeletal muscle [13, 14], while we primarily focused on adipose tissue itself within psoas muscle. The MST in our data was 1.47 years, which is in line with the previous data [1, 4].
In our multivariate analysis, PMI and FRPM were independent predictors for OS. These results imply that not only muscle mass but also muscle quality is an essential predictive marker in patients with advanced GC undergoing systemic chemotherapy. Exercise intervention for improving muscle function can be recommended for patients with decreased PMI and/or higher FRPM [27-29]. In our data, the proportion of ECOG-PS 0 in patients with FRPM-high and FRPM-low was 40% (16/40) and 56.4% (22/39), and the proportion of ECOG-PS 2 or 3 in patients with FRPM-high and FRPM-low was 17.5% (7/40) and 2.6% (1/39), which are largely different between the two groups. Our proposed FRPM can reflect physical activity. Patients with FRPM-high tended to be significantly older than those with FRPM-low. Aging-related increase in ectopic fat deposition can be closely associated with worse health conditions [30]. Patients with FRPM-high had significantly lower eGFR level than those with FRPM-low. Ectopic fat accumulation in the skeletal muscle may be linked to ectopic fat accumulation in the kidney, causing lower eGFR [31]. Older age in patients with FRPM-high can cause lower eGFR.
The average minus 2 standard deviation value of PMI calculated by CT images in healthy Japanese subjects is reported to be 6.36 cm2/m2 for male and 3.92 cm2/m2 for female [32]. In the present study, the median PMI in male and female was 4.35 cm2/m2 and 2.88 cm2/m2, which was significantly lower than those reported in healthy Japanese subjects. Presence of advanced GC may be associated with the current results. On the other hand, in male, PMI had the significant negative correlation with FRPM, whereas in female such tendency was not found. Gender differences in ectopic fat accumulation in skeletal muscle may be an important finding. Inflammatory markers such as CRP and neutrophil to lymphocyte ratio are reported to be prognostic markers in patients with GC [33], but in our analysis such markers were not independent factors linked to OS. This may be partly due to the fact that the subjects in this study were limited to stage IV GC patients.
In our previous study, we have reported the prognostic significance of PMI in patients with hepatocellular carcinoma undergoing radiofrequency thermal ablation and pancreatic cancer undergoing systemic chemotherapy [34, 35]. PMI well predicts prognosis in patients with colorectal cancer [36]. PMI can be helpful for predicting postoperative outcomes in patients with esophageal cancer undergoing surgery [37]. A decreased PMI is associated with poorer prognosis in patients with metastatic hormone-naïve prostate cancer [38]. A decreased PMI predicts cancer recurrence in patients with upper urinary tract urothelial carcinoma [39]. The prognostic impact of PMI was also shown in this study. Indeed, measurement of PMI is clinically useful in various malignancies. Psoas muscle mass at the L3 level correlates well with total body skeletal muscle mass, and can be easily measured in a short time [40]. On the other hand, psoas muscle is not symmetrical in shape, and it can take various forms [41]. Clinicians should be fully aware of these.
Several limitations must be pointed out in the present analysis. First, the current study was an observational study at a single hospital with a retrospective nature. Second, the number of patients in our cohort was relatively small, but the number of deaths was 53, which can be tolerable for the multivariate analysis of OS. Third, chemotherapeutic regimens at the initial systemic chemotherapy and chemotherapeutic dose intensity were highly heterogeneous, also creating bias. Fourth, changes in body composition during systemic chemotherapy was not analyzed in this study. Fifth, we only measured the visible fat using CT scan and dedicated software, and did not take into consideration the density of the psoas muscle itself. Sixth, the readings of CT findings were done by a single radiologist. Sixth, histological factors were not entered into analysis. Finally, data for grip strength, which well reflects muscle function, were not available in this study. Thus, care should be taken in interpreting the results. However, our study results suggested that FRPM can be a useful marker as well as muscle mass for predicting prognosis in advanced GC patients receiving systemic chemotherapy.
In conclusion, we would like to emphasize that not only skeletal muscle mass but also skeletal muscle quality can be an essential prognostic factor in patients with stage IV GC undergoing systemic chemotherapy.
Abbreviations
GC: gastric cancer; MST: median survival time; FRPM: fat ratio within psoas muscle; OS: overall survival; PMI: psoas muscle index; HU: Hounsfield Unit; IQR: interquartile range; ECOG-PS: Eastern Cooperative Oncology Group Performance Status; BMI: body mass index; HER2: Human epidermal growth factor receptor 2; XP: capecitabine plus cisplatin; SOX: S-1 plus oxaliplatin; CRP: C reactive protein; eGFR: estimated glomerular filtration rate.
Acknowledgements
The authors gratefully thank all medical staff in our cancer center for their help with data collection.
Author Contributions
Data curation, Takako Ikegami, Hiroki Nishikawa, Fukutaro Shimamoto, Tetsuji Terazawa, Toshifumi Yamaguchi, Eiki Yamasaki and Ken Asaishi; Formal analysis, Takako Ikegami and Hiroki Nishikawa; Supervision, Masahiro Goto, Shiro Nakamura and Kazuhide Higuchi; Writing - original draft, Takako Ikegami and Hiroki Nishikawa; Writing - review & editing, Shiro Nakamura.
Competing Interests
The authors have declared that no competing interest exists.
References
1. Smyth EC, Nilsson M, Grabsch HI. et al. Gastric cancer. Lancet. 2020;396(10251):635-648
2. Takei S, Kawazoe A, Shitara K. The New Era of Immunotherapy in Gastric Cancer. Cancers (Basel). 2022;14(4):1054
3. Kono K, Nakajima S, Mimura K. Current status of immune checkpoint inhibitors for gastric cancer. Gastric Cancer. 2020;23(4):565-578
4. Dubois M, Liscia N, Brunetti O. et al. The role of immune checkpoint inhibitors in the treatment sequence of advanced gastric or gastro-esophageal junction cancer: A systematic review and meta-analysis of randomized trials. Crit Rev Oncol Hematol. 2022;173:103674
5. Nishikawa H, Goto M, Fukunishi S. et al. Cancer Cachexia: Its Mechanism and Clinical Significance. Int J Mol Sci. 2021;22(16):8491
6. Deng HY, Chen ZJ, Qiu XM. et al. Sarcopenia and prognosis of advanced cancer patients receiving immune checkpoint inhibitors: A comprehensive systematic review and meta-analysis. Nutrition. 2021;90:111345
7. Aoyama T, Nakazono M, Nagasawa S. et al. Clinical Impact of a Perioperative Exercise Program for Sarcopenia and Overweight/Obesity Gastric Cancer. In vivo. 2021;35(2):707-712
8. Kuwada K, Kuroda S, Kikuchi S. et al. Clinical Impact of Sarcopenia on Gastric Cancer. Anticancer Res. 2019;39(5):2241-2249
9. Shulman GI. Ectopic fat in insulin resistance, dyslipidemia, and cardiometabolic disease. N Engl J Med. 2014;371(12):1131-1141
10. Neeland IJ, Ross R, Després JP. et al. International Atherosclerosis Society; International Chair on Cardiometabolic Risk Working Group on Visceral Obesity. Visceral and ectopic fat, atherosclerosis, and cardiometabolic disease: a position statement. Lancet Diabetes Endocrinol. 2019;7(9):715-725
11. Modesto AE, Ko J, Stuart CE. et al. Reduced Skeletal Muscle Volume and Increased Skeletal Muscle Fat Deposition Characterize Diabetes in Individuals after Pancreatitis: A Magnetic Resonance Imaging Study. Diseases. 2020;8(3):25
12. Tamura Y. Ectopic fat, insulin resistance and metabolic disease in non-obese Asians: investigating metabolic gradation. Endocr J. 2019;66(1):1-9
13. Miljkovic I, Vella CA, Allison M. Computed Tomography-Derived Myosteatosis and Metabolic Disorders. Diabetes Metab J. 2021;45(4):482-491
14. Aleixo GFP, Shachar SS, Nyrop KA. et al. Myosteatosis and prognosis in cancer: System atic review and meta-analysis. Crit Rev Oncol Hematol. 2020;145:102839
15. Sciorati C, Clementi E, Manfredi AA. Fat deposition and accumulation in the damaged and inflamed skeletal muscle: cellular and molecular players. Cell Mol Life Sci. 2015;72(11):2135-2156
16. Bello O, Ladwa M, Hakim O. et al. Differences in the link between insulin sensitivity and ectopic fat in men of Black African and White European ethnicity. Eur J Endocrinol. 2020;182(1):91-101
17. van Dijk DPJ, Zhao J, Kemter K. et al. Ectopic fat in liver and skeletal muscle is associated with shorter overall survival in patients with colorectal liver metastases. J Cachexia Sarcopenia Muscle. 2021;12(4):983-992
18. Seto Y. Sarcopenia, muscle quality, and gastric cancer surgery. Ann Gastroenterol Surg. 2021;5(4):402-403
19. Murnane LC, Forsyth AK, Koukounaras J. et al. Myosteatosis predicts higher complications and reduced overall survival following radical oesophageal and gastric cancer surgery. Eur J Surg Oncol. 2021;47(9):2295-2303
20. Watanabe J, Osaki T, Ueyama T. et al. The Combination of Preoperative Skeletal Muscle Quantity and Quality is an Important Indicator of Survival in Elderly Patients Undergoing Curative Gastrectomy for Gastric Cancer. World J Surg. 2021;45(9):2868-2877
21. Waki Y, Irino T, Makuuchi R. et al. Impact of Preoperative Skeletal Muscle Quality Measurement on Long-Term Survival After Curative Gastrectomy for Locally Advanced Gastric Cancer. World J Surg. 2019;43(12):3083-3093
22. Matsui R, Inaki N, Tsuji T. Impact of preoperative muscle quality on postoperative severe complications after radical gastrectomy for gastric cancer patients. Ann Gastroenterol Surg. 2021;5(4):510-518
23. Uchida T, Sekine R, Matsuo K. et al. Association between low preoperative skeletal muscle quality and infectious complications following gastrectomy for gastric cancer. Surg Today. 2021;51(7):1135-1143
24. Kusunoki Y, Okugawa Y, Toiyama Y. et al. Modified intramuscular adipose tissue content as a feasible surrogate marker for malnutrition in gastrointestinal cancer. Clin Nutr. 2021;40(5):2640-2653
25. Li T, Ruan DG, Gao JJ. et al. Role of skeletal muscle fat ectopic deposition in insulin resistance induced by high-fat diet. Sheng Li Xue Bao. 2018;70(4):433-444
26. Lara-Castro C, Garvey WT. Intracellular lipid accumulation in liver and muscle and the insulin resistance syndrome. Endocrinol Metab Clin North Am. 2008;37(4):841-856
27. Suzuki K. Chronic Inflammation as an Immunological Abnormality and. Effectiveness of Exercise. Biomolecules. 2019;9(6):223
28. Hollingworth TW, Oke SM, Patel H. et al. Getting to grips with sarcopenia: recent advances and practical management for the gastroenterologist. Frontline Gastroenterol. 2020;12(1):53-61
29. Reginster JY, Beaudart C, Al-Daghri N. et al. Update on the ESCEO recommendation for the conduct of clinical trials for drugs aiming at the treatment of sarcopenia in older adults. Aging Clin Exp Res. 2021;33(1):3-17
30. Zamboni M, Rossi AP, Fantin F. et al. Adipose tissue, diet and aging. Mech Ageing Dev. 2014;136-137:129-137
31. Mende C, Einhorn D. Fatty kidney disease: The importance of ectopic fat deposition and the potential value of imaging. J Diabetes. 2021;14(1):73-78
32. Nishikawa H, Shiraki M, Hiramatsu A. et al. Japan Society of Hepatology guidelines for sarcopenia in liver disease (1st edition): Recommendation from the working group for creation of sarcopenia assessment criteria. Hepatol Res. 2016;46(10):951-963
33. Chang WJ, Du Y, Zhao X. et al. Inflammation-related factors predicting prognosis of gastric cancer. World J Gastroenterol. 2014;20(16):4586-4596
34. Yuri Y, Nishikawa H, Enomoto H. et al. Implication of Psoas Muscle Index on Survival for Hepatocellular Carcinoma Undergoing Radiofrequency Ablation Therapy. J Cancer. 2017;8(9):1507-1516
35. Ishii N, Iwata Y, Nishikawa H. et al. Effect of pretreatment psoas muscle mass on survival for patients with unresectable pancreatic cancer undergoing systemic chemotherapy. Oncol Lett. 2017;14(5):6059-6065
36. Shan L, Li T, Gu W. et al. Application of Prognostic Models Based on Psoas Muscle Index, Stage, Pathological Grade, and Preoperative Carcinoembryonic Antigen Level in Stage II-III Colorectal Cancer Patients Undergoing Adjuvant Chemotherapy. J Oncol. 2022;2022:6851900
37. Uemura S, Shichinohe T, Kurashima Y. et al. Effects of preoperative psoas muscle index and body mass index on postoperative outcomes after video-assisted esophagectomy for esophageal cancer. Asian J Endosc Surg. 2021;14(4):739-747
38. Iwamoto G, Kawahara T, Miyai T. et al. A lower psoas muscle index predicts a poorer prognosis in metastatic hormone-naïve prostate cancer. BJUI Compass. 2020;2(1):39-45
39. Tsutsumi S, Kawahara T, Teranishi JI. et al. A low psoas muscle volume predicts longer hospitalization and cancer recurrence in upper urinary tract urothelial carcinoma. Mol Clin Oncol. 2018;8(2):320-322
40. Wu CH, Liang PC, Hsu CH. et al. Total skeletal, psoas and rectus abdominis muscle mass as prognostic factors for patients with advanced hepatocellular carcinoma. J Formos Med Assoc. 2021;120(1 Pt 2):559-566
41. Baracos VE. Psoas as a sentinel muscle for sarcopenia: a flawed premise. J Cachexia Sarcopenia Muscle. 2017;8(4):527-528
Author contact
![]() Corresponding author: nishikawa_6392_0207co.jp; Tel.: +81-726-83-1221.
Corresponding author: nishikawa_6392_0207co.jp; Tel.: +81-726-83-1221.