Impact Factor ISSN: 1837-9664

 Global reach, higher impact
J Cancer 2023; 14(2):250-261. doi:10.7150/jca.79967 This issue Cite
Research Paper
Identification of a CircRNA-miRNA-mRNA Network and Integrated Analysis of Immune Infiltration in Oral Squamous Cell Carcinoma
Dehua Hu1#, Yufeng Cai1#, Lan He2, Hao Jiang1 ![]()
1. Department of Biomedical Informatics, School of Life Sciences, Central South University, Changsha, Hunan 410078, China.
2. College of Biology, Hunan University, Changsha, Hunan 410078, China.
#Dehua Hu and Yufeng Cai contributed equally to this article and share first authorship.
Received 2022-10-17; Accepted 2022-12-12; Published 2023-1-1
Abstract

Oral squamous cell carcinoma (OSCC) is a highly invasive type of head and neck cancer. Circular RNA (circRNA) acts as a competing endogenous RNA (ceRNA) and involves in pathogenesis of many diseases. However, the circRNA-miRNA-mRNA network and relationship between ceRNA and immune infiltration in OSCC remain unknown. In this study, we established a ceRNA network, including 89 circRNAs, 43 miRNAs and 223 mRNAs, and found that 233 genes are mainly related to malignant signalling pathways (including "Integrin family cell surface interactions" and "Epithelial-to-mesenchymal transition" pathways) and five potential biomarkers (SLC20A1, PITX2, hsa-mir-135b, hsa-mir-377 and hsa-let-7c). Meanwhile, we established a prognostic model based on clinical risk, and revealed the relationship between immune infiltrating cells and biomarkers in OSCC. Taken together, our study is helpful to reveal the pathogenesis of oral squamous cell carcinoma.
Keywords: Oral squamous cell carcinoma, circRNA, ceRNA, immune infiltration, bioinformatics
1. Introduction
Oral squamous cell carcinoma (OSCC) is a common and highly invasive type of head and neck cancer that accounts for more than 90% of oral cancers [1, 2]. According to GLOBOCAN statistics, there were an estimated 377,713 new cases of cancers of the lip and oral cavity and 177,757 associated deaths worldwide in 2020 [3]. The incidence of OSCC is increasing year by year; this is attributed to risk factors, including smoking, drinking, and human papillomavirus infection [1]. OSCC is prone to metastasis and local recurrence, and the efficacy of conventional treatment with surgery, radiotherapy, and chemotherapy is unsatisfactory [4]. Targeted therapies aimed at sites including programmed cell death protein-1 (PD-1) and EGFR have shown good potential in clinical practice [5]. The choice of treatment for OSCC depends on the stage of the tumour. However, the commonly used TNM staging system is insufficient to evaluate the prognosis of OSCC patients [6]. Previous bioinformatics analyses have explored the long noncoding RNA (lncRNA)-related ceRNA network in OSCC [7-9]. A potential role of lncRNAs as biomarkers in head and neck squamous cell carcinoma has also been reported [10]. However, no circRNA-related ceRNA network has been established, although this may provide more stable biomarkers. The relationship between the ceRNA network and immune infiltration in OSCC has not yet been reported. Exploring the internal mechanism of OSCC and the role of immune infiltration is critical to the further development of such immunotherapies. Circular RNAs (circRNAs), which are closed-ring molecules formed by reverse splicing and covalent association between their 3' and 5' ends [11], represent a recently rediscovered class of covalently closed transcripts [12]. MicroRNAs (miRNAs) are noncoding RNAs with lengths <22 nucleotides that complementally bind to mRNA to inhibit gene expression [13]. Although circRNAs can also interact with proteins, translate themselves, or act on other ribonucleic acids, their most widely studied function is their ability to act as competing endogenous RNAs (ceRNAs), serving as miRNA "sponges" to regulate gene expression through a circRNA-miRNA-mRNA network [14].
CircRNAs participate in cell proliferation, invasion, migration, and immunity in tumours [15]. Studies have revealed various roles of circRNAs in OSCC. For example, circRNA_100290 antagonizes miR-378a-induced GLUT1 inhibition, thereby promoting glycolysis and cell proliferation in OSCC [16]. Hsa_circ_0001162 blocks miR-149 to improve the stability of MMP9 mRNA, thereby promoting the metastasis of OSCC [17]. Hsa_circ_0055538 acts on the p53/Bcl-2/caspase signalling pathway to inhibit tumour formation, playing a protective role in OSCC [18]. CircRNAs are ideal diagnostic and prognostic biomarkers owing to their stability and tumour specificity [10]. However, there has been no systematic analysis of the ceRNA network in OSCC. Immune cell infiltration in the tumour microenvironment may affect the occurrence, development, invasion, and prognosis of tumours [19], yet the relationship between the ceRNA network and immune infiltration in OSCC has not yet been reported.
In this study, we screened differentially expressed circRNAs (DEcircRNAs), differentially expressed miRNAs (DEmiRNAs), and differentially expressed mRNAs (DEmRNAs) between OSCC and normal tissues by bioinformatics methods, constructed a circRNA-miRNA-mRNA-related ceRNA network in OSCC, and evaluated the biological pathways associated with the mRNAs. We screened five biomarkers and established a prognostic model. In addition, we evaluated immune infiltration in OSCC and comprehensively analysed the correlations between immune cells and biomarkers. We constructed a systemic ceRNA network for OSCC and further discussed its relationship with immune infiltration. These results are expected to provide biomarkers of prognosis and indicate potential novel strategies for the treatment of OSCC.
2. Materials and methods
2.1 Differential expression and network analyses of raw data
The National Center for Biotechnology Information (https://www.ncbi.nlm.nih.gov/) GEO (Gene Expression Omnibus, https://www.ncbi.nlm.nih.gov/geo/) database is a completely international open resource containing large numbers of research chips and expression function sequencing data, as well as related experimental design data. We analysed the GSE118750 dataset using the hash function in Perl and the "limma" [20] R package to obtain the DEcircRNAs between OSCC and normal tissues (log fold change was set to 1.2). We then used the National Cancer Institute's Genomic Data Commons Data Portal to screen and download the "squamous cell neoplasms" that occurred in "other and unspecified parts of tongue, floor of mouth, other and unspecified parts of mouth, tonsil, base of tongue, Gum, oropharynx, palate, lip;” the results were used as our research data for OSCC. The original dataset contained 311 tumour cancer samples and 19 normal samples. Similarly, we used the “limma” package to analyse and obtain the DEmiRNAs and DEmRNAs (log fold change was set to 1.2). We drew heatmaps and volcano plots to visualize the differential expression of circRNAs, miRNAs, and mRNAs.
Using the Circ2Traits (http://gyanxet-beta.com/circdb/) database [21], we predicted the target miRNAs of the DEcircRNAs and obtained the intersection of these DEmiRNAs. We used FunRich (http://www.funrich.org/) [22] to predict the target mRNAs of the intersecting miRNAs and then obtained the intersection of these with the DEmRNAs in OSCC. We then constructed a ceRNA regulatory network map based on the target relationships among circRNAs, miRNAs, and mRNAs.
2.2 Biological pathway analysis
Using FunRich, we performed Kyoto Encyclopedia of Genes and Genomes [23] enrichment analysis on the 223 intersecting mRNAs. Using the STRING (https://string-db.org/) [24] database and Cytoscape [25], the interactions between the expression products of these mRNAs were plotted as a protein-protein interaction (PPI) network. Using the MCODE plug-in in Cytoscape (degree cut-off: 2; node score cut-off: 0.2; K-core: 2; max. depth: 100), two key submodules were found. We then used FunRich to obtain path enrichment results for these submodules.
2.3 Cox proportional hazard analysis and establishment of prognostic model
We selected 305 sequencing samples for which both mRNA and miRNA data were available from the 311 OSCC tumour samples obtained from TCGA; their information is shown in Table 1. Clinical samples with TNM stage information were included in the risk analysis. Samples with no specific clinical information were used for the analysis of bioinformatics data only. Using univariate Cox proportional hazard regression analysis, we screened and retained significant survival-related miRNAs and mRNAs (risk ratio: 95%; P<0.05). Using log-lambda in the Lasso algorithm as a penalty coefficient for regression analysis, we obtained the minimum value of the partial likelihood deviance. In the multivariate Cox proportional hazard regression analysis, the forest map of the risk assessment model was filtered according to the value of the Akaike information criterion. Finally, we identified the required mRNAs and miRNAs to establish a risk assessment prognosis model. We used receiver operating characteristic (ROC) curves to evaluate the selected biomarkers.
Baseline characteristics of 305 OSCC samples
| Characteristic | Number of cases (%) |
|---|---|
| Age (years) | |
| ≥60 | 149 (48.9) |
| <60 | 156 (51.1) |
| Total | 305 |
| Gender | |
| Male | 220 (72.1) |
| Female | 85 (27.9) |
| Total | 305 |
| Clinical stage | |
| Ⅰ | 15 (5.1) |
| Ⅱ | 62 (21.0) |
| Ⅲ | 57 (19.3) |
| Ⅳ | 161 (54.6) |
| Total | 305 |
| T classification | |
| T1 | 28 (9.2) |
| T2 | 97 (31.8) |
| T3 | 79 (25.9) |
| T4 | 90 (29.5) |
| Unknown | 11 (3.6) |
| Total | 305 |
| N classification | |
| N0 | 136 (44.6) |
| N1 | 48 (15.7) |
| N2 | 104 (34.1) |
| N3 | 3 (1.0) |
| Unknown | 14 (4.6) |
| Total | 305 |
| Metastasis | |
| No | 283 (92.8) |
| Yes | 3 (1.0) |
| Unknown | 19 (6.2) |
| Total | 305 |
2.4 Analysis of immune infiltration
ESTIMATE is a tool for predicting the relationships between tumours and immune infiltration using an algorithm based on enrichment analysis of the sample gene set [26]. We divided our 305 samples into two groups according to the risk score and performed ESTIMATE analysis to explore the relationship between the model and immune infiltration.
CIBERSORT (https://cibersort.stanford.edu/) [27] is an online tool for convoluting the expression matrix of human immune cell subtypes based on the principle of linear support vector regression. It provides a gene expression set of 22 human immune cell subtypes, which can be used to analyse cell abundance and gene expression in tissue samples. Using the R language to call the original dataset and the operation function of CIBERSORT, we obtained the proportions of 22 human immune cell subtypes in the target samples.
Tumour Immune Dysfunction and Exclusion (TIDE) was used to predict potential responses to immune checkpoint blockade (ICB) therapy based on the simulating tumour immune evasion mechanism [28]. TIDE was used to predict the effects of ICB therapy in the high-risk and low-risk groups.
3. Results
3.1 Identification of differentially expressed circRNAs, miRNAs, and mRNAs
A total of 482 DEcircRNAs were identified from the GSE118750 dataset, comprising 475 high-expressed circRNAs and seven low-expressed circRNAs. From the OSCC TCGA data, we identified 92 DEmiRNAs (51 low-expressed miRNAs and 41 high-expressed miRNAs) and 961 DEmRNAs (421 low-expressed mRNAs and 540 high-expressed mRNAs). The corresponding heatmaps and volcano plots are shown in Fig. S1.
3.2 Construction of a ceRNA network in OSCC
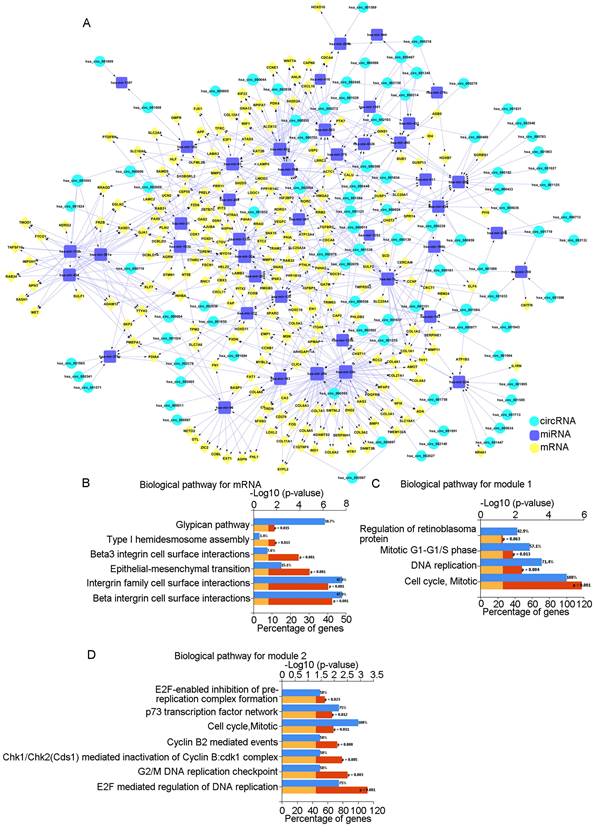
To further clarify the relationships among DEcircRNAs, DEmiRNAs, and DEmRNAs, we constructed a circRNA-miRNA-mRNA-related ceRNA network for OSCC. Using the Circ2Traits database, we identified 89 miRNAs that were targeted by DEcircRNAs and intersected these with the previously identified 92 DEmiRNAs to obtain 43 miRNAs. Then, we used FunRich to obtain mRNAs targeted by these 43 miRNAs and intersected these with the previously identified 961 DEmRNAs to obtain 223 mRNAs. We determined the associations between DEcircRNAs and DEmiRNAs and between DEmiRNAs and DEmRNAs (Supplement Table 1) and finally constructed a ceRNA network comprising 89 circRNAs, 43 miRNAs, and 223 mRNAs (Fig. 1A).
ceRNA network and analysis of key modules. A: The circRNA-miRNA-mRNA network in OSCC. Red represents circRNAs, green represents miRNAs, and yellow represents mRNAs. B: Biological pathways of mRNAs in the ceRNA network. C: Biological pathways of the first module. D: Biological pathways of the second module.
3.3 Biological pathway analysis
Biological pathway analysis of the 223 mRNAs showed that the pathways were mainly enriched in "beta1 integrin cell surface interactions," "integrin family cell surface interactions," and "epithelial-to-mesenchymal transition" (Fig. 1B). Using the STRING database and Cytoscape, we constructed a PPI network diagram. Using the MCODE plugin of Cytoscape, we selected two key modules. Pathway analysis showed that they were related to "Cell Cycle, Mitotic" and "E2F mediated regulation of DNA replication," among others (Fig. 1C, D).
3.4 Construction of the prognostic model
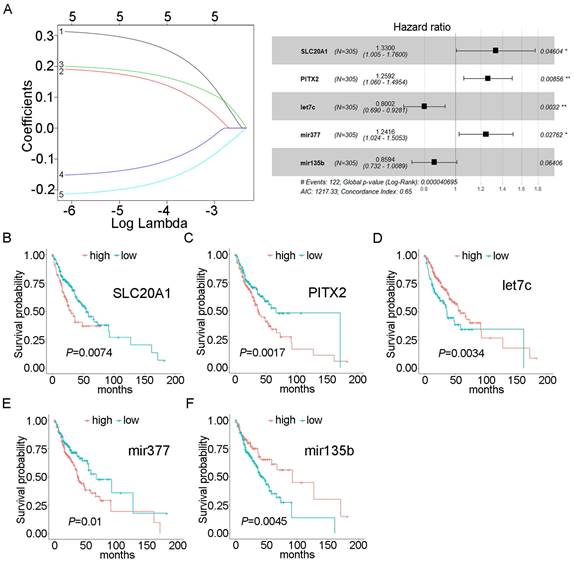
Using univariate Cox proportional hazards regression analysis, we obtained 43 mRNAs and 6 miRNAs that were closely related to the survival of OSCC (P<0.05). After multivariate Cox proportional hazard regression analysis, two mRNAs and three miRNAs were retained and used to construct the prognostic model: SLC20A1, PITX2, hsa-mir-135b, hsa-mir-377, and hsa-let-7c (expression status is shown in Table 2). The risk score was calculated as follows: risk score = (0.28516×SLC20A1)+(0.23052×PITX2)+(-0.22286×hsa-let-7c)+(0.21641×hsa-mir-377)+(-0.15154×hsa-mir-135b). The concordance index for this model was 0.65 (Fig. 2A). The survival curves of the five biomarkers were consistent with the positive and negative coefficients in the formula (Fig. 2B-F). Survival curves were constructed using the Kaplan-Meier method and the log-rank test (Fig. S2A).
Expression status of biomarkers
| Biomarker | logFC | P value | Change direction |
|---|---|---|---|
| SLC20A1 | 1.236585 | 7.36E-16 | Up |
| PITX2 | -1.26913 | 9.53E-08 | Down |
| hsa-mir-135b | 1.766621 | 7.49E-09 | Up |
| hsa-mir-377 | -1.51776 | 3.16E-10 | Down |
| hsa-let-7c | -2.16479 | 1.85E-10 | Down |
Forest plot and survival analysis of biomarkers. A: Cox proportional hazards model based on biomarkers. B: Survival analysis of SLC20A1 in OSCC (P=0.0074). C: Survival analysis of PITX2 in OSCC (P=0.0017). D: Survival analysis of hsa-let-7c in OSCC (P=0.0034). E: Survival analysis of hsa-miR-377 in OSCC (P=0.01). F: Survival analysis of hsa-miR-135b in OSCC (P= 0.0045).
We validated the prognostic model using an external validation dataset from TCGA, selecting mRNA sequencing (mRNA-seq) and miRNA-seq data for OSCC (including laryngeal and hypopharyngeal cancers) and screening the matrix data for SLC20A1, PITX2, hsa-mir-135b, hsa-mir-377, and hsa-let-7c. A combined external dataset for OSCC containing 120 samples was obtained by analysing the information of clinical samples, and the risk score was calculated by substituting the score into the risk prognostic model (divided into high-risk and low-risk groups). Our results demonstrated that the prognostic model was suitable for use in OSCC (P<0.01) (Fig. S2B). The laryngeal cancer data were statistically significant (P<0.01) (Fig. S2C), while the hypopharyngeal cancer data were not statistically significant (P=0.11) (Fig. S2D).
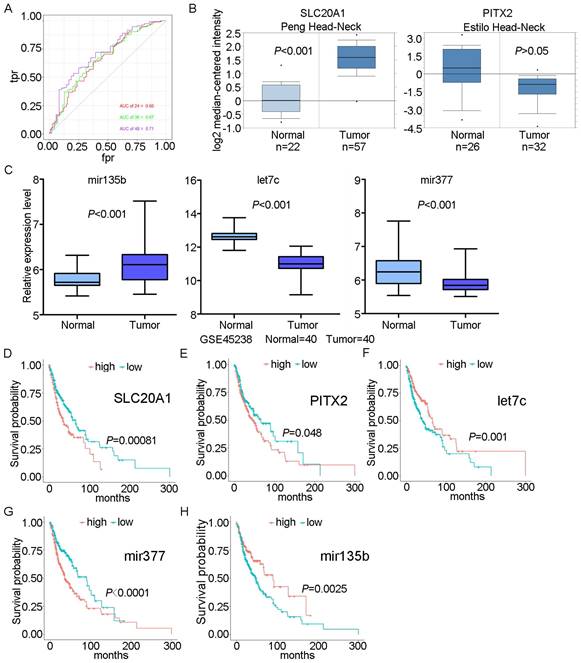
3.5 Risk score and ROC curve analysis
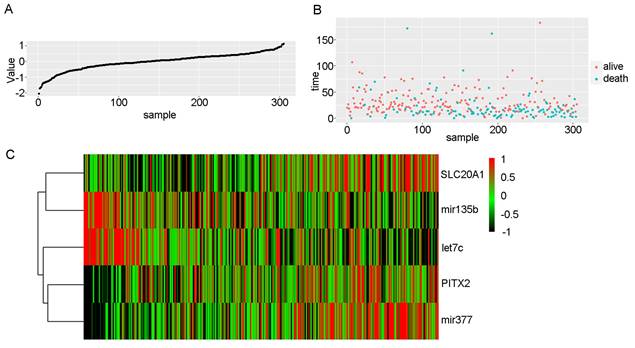
We scored patients according to the prognostic model and arranged them in order from low to high risk. Fig. 3 shows the distribution of the patient risk score and the corresponding survival data, as well as the expression of the five biomarkers included in the prognostic model. Patients with high scores tended to have higher mortality. We also constructed a time-dependent ROC curve to evaluate these five biomarkers. The area under the ROC curve (AUC) values for the 2-, 3-, and 4-year survival rates were 0.66, 0.67, and 0.71, respectively (Fig. 4A). We also verified the expression levels of these five biomarkers in the Oncomine database (Fig. 4B) and in the GSE45238 dataset (Fig. 4C); except for PITX2 (for which no statistical significance was found, but the expression trend was consistent), the expression levels were consistent with those of the OSCC TCGA data (P<0.001). Then, we analysed the prognosis of these five biomarkers in head and neck squamous cell carcinoma data from TCGA and found that the prognosis was consistent with that found with the OSCC data (Fig. 4D-H). We also verified the random forest map, ROC curve, and risk assessment of this model in HNSC (head and neck squamous cell carcinoma) (Fig. S3).
Risk scores in OSCC. A: Risk scores of OSCC patients in ascending order. B: Survival time and status of OSCC patients in order of increasing risk score. Red dots represent survival, and blue dots represent death. C: Heatmap showing the expression of these five biomarkers in OSCC in increasing order of risk score.
ROC curve and survival analyses for biomarkers. A: ROC curves for 2-, 3-, and 4-year survival with AUC values. B: Expression of SLC20A1 and PITX2 in the Oncomine database. C: Expression of hsa-let-7c, hsa-mir-377, and hsa-mir-135b in GSE45238. D: Survival analysis of SLC20A1 in head and neck squamous cell carcinoma (P= 0.00081). E: Survival analysis of PITX2 in head and neck squamous cell carcinoma (P= 0.048). F: Survival analysis of hsa-let-7c in head and neck squamous cell carcinoma (P= 0.001). G: Survival analysis of hsa-miR-377 in head and neck squamous cell carcinoma (P<0.0001). H: Survival analysis of hsa-miR-135b in head and neck squamous cell carcinoma (P= 0.0025).
To identify the differences in somatic mutations between the low-risk group and high-risk group, mutation data were visualized using the “maftools” R package [29]. In the high-risk group, 79% (n = 105) of patients harboured a TP53 mutation, compared with 57% (n = 90) in the low-risk group (Fig. S4A). Moreover, PIK3CA, CDKN2A, FBXW7, and HRAS were found to be driver genes in the high-risk group; these genes may be closely related to the prognosis of patients (Fig. S4B, C).
3.6 Immune infiltration analysis in OSCC
Using the ESTIMATE algorithm, we evaluated the samples in the high-risk and low-risk groups and found that the low-risk samples had higher immune scores and lower stromal scores; the differences were statistically significant in both cases (Fig. S5), suggesting that the model may be related to immune infiltration.
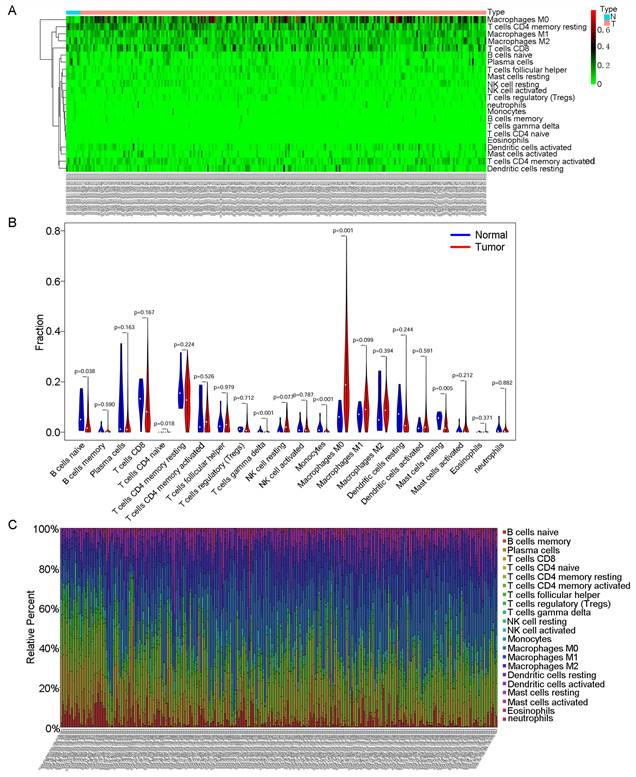
Then, we used CIBERSORT to further explore the relationship between our model and immune infiltration in OSCC samples. As shown in the heatmap in Fig. 5A, more M0 macrophages were found in OSCC samples than in normal tissue samples. Tumour samples contained more macrophages and fewer B and T cells (Fig. 5B). We ranked the samples in order of risk from low to high and found that tumour samples classified as low risk tended to contain more B and T cells (Fig. 5C). In the survival analysis for the 22 immune cell types, we found that patients with higher levels of regulatory T cells (Tregs) and mast cells had a better prognosis (Fig. 6C).
CIBERSORT analyses in OSCC. A: Heatmap of immune cell infiltration in OSCC samples and normal samples. Red represents OSCC samples, and blue represents normal tissue samples. B: Violin chart comparing the immune cells in OSCC samples and normal tissue samples. C: Bar chart with different colours representing different cell types arranged in ascending order according to the risk scores of the samples.
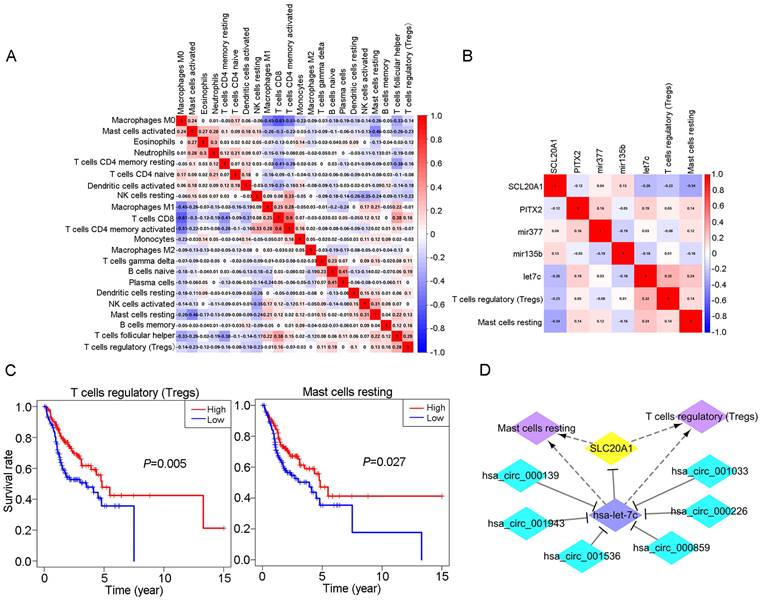
Relationship between immune cells and biomarkers. A: Correlation analysis of different immune cell types. B: Correlation analysis between different immune cell types and biomarkers. C: Survival analysis for Tregs and resting mast cells in OSCC (P<0.05). D: The ceRNA-immune cell network in OSCC.
TIDE was used to evaluate the therapeutic efficacy of immune checkpoint suppression in the low-risk and high-risk groups. The risk scores for CD8 and CTL (cytotoxic T lymphocytes) were higher in the low-risk group, indicating better prognosis (Fig. S6A, B). The scores for myeloid-derived suppressor cells (MDSCs) and cancer-associated fibroblasts (CAFs) were higher in the high-risk group, indicating less immune infiltration and poorer prognosis (Fig. S6C, D).
3.7 Comprehensive analysis of immune cells and biomarkers
We obtained coexpression relationships among various immune cells through correlation analysis (Fig. 6A) and then further analysed the correlations between immune cells and biomarkers (Fig. 6B). As shown in the figures, SLC20A1 expression levels were negatively correlated with the numbers of Tregs (R=-0.23, P<0.001) and resting mast cells (R=-0.34, P<0.001) (Fig. S7A), and hsa-let-7c expression was positively correlated with the numbers of Tregs (R=0.32, P<0.001) and resting mast cells (R=0.24, P<0.001) (Fig. S7B).
According to our ceRNA network, SLC20A1 was identified as a target gene of hsa-let-7c. SLC20A1 was highly expressed in tumour samples, whereas hsa-let-7c had low expression. Furthermore, in the ceRNA network, the six circRNAs (hsa_circ_000139, hsa_circ_001943, hsa_circ_001536, hsa_circ_000859, hsa_circ_000226, and hsa_circ_001033) targeting hsa-let-7c were all highly expressed in tumour samples, in good agreement with the endogenous competitive RNA hypothesis. Therefore, we constructed a ceRNA-immune cell network diagram (Fig. 6D). Using circBase (http://www.circbase.org/), we obtained proven target genes (YAF2, CLASP2, PDIA4, ETFA, POLR2A, and C1orf27) of these six circRNAs. Using GEPIA (http://gepia.cancer-pku.cn/index.html) website tools, we found that these six genes also had good positive correlations with SLC20A1 in head and neck squamous cell carcinoma (Fig. S8).
In summary, we established a circRNA-miRNA-mRNA network in OSCC through bioinformatics analysis. We identified SLC20A1, PITX2, hsa-mir-135b, hsa-mir-377, and hsa-let-7c as potential biomarkers for evaluating the prognosis of OSCC patients and established a prognostic model. Immune infiltration showed that the levels of M0, M1, and M2 macrophages were increased in OSCC samples, whereas the numbers of Tregs and resting mast cells were related to prognosis and had good correlations with specific biomarkers. It has been well established that the M1-to-M2 transition plays a part in tumour progression. Our results implied that increased numbers of M1 macrophages might be converted into M2 macrophages as reserve cells during OSCC progression [30]. Thus, our research helps to elucidate the mechanism underlying OSCC and could indicate new strategies for immunotherapy.
4. Discussion
In this study, we first screened differentially expressed molecules between OSCC and normal samples by microarray analysis and constructed a ceRNA network comprising 89 circRNAs, 43 miRNAs, and 223 mRNAs to explore the mechanisms involving circRNAs in OSCC. Then, we analysed the biological pathways of the 223 mRNAs to explore the functions of circRNAs through their target mRNAs. Next, we identified two mRNAs (SLC20A1 and PITX2) and three miRNAs (hsa-mir-135b, hsa-mir-377, and hsa-let-7c) and used them to establish a prognostic model. Risk score and ROC curve analyses supported the reliability of the five biomarkers and the prognostic model. Finally, we carried out immune infiltration analysis and comprehensive analysis of immune cells and biomarkers in OSCC. We found that OSCC had a unique immune microenvironment, with good correlations between immune cells and biomarkers. Our study thus elucidates the pathogenesis of OSCC based on the ceRNA network, proposes potential biomarkers and prognostic models, and provides new ideas for immunotherapy for OSCC patients.
Our functional enrichment analysis showed that the 233 genes were mainly related to the "Beta1 integrin cell surface interactions," "Integrin family cell surface interactions," "Epithelial-to-mesenchymal transition," and "Beta3 integrin cell surface interactions Beta3" pathways. We clustered our large PPI network graph to obtain functional modules and found that there were two key modules: "Cell Cycle, Mitotic cell cycle, mitosis" and "E2F mediated regulation of DNA replication." Integrin is a transmembrane receptor on the cell surface that mediates cell adhesion to other cells or the extracellular matrix and participates in multiple signalling pathways. Specific changes in integrin are common in tumours, promoting tumour migration and survival in different environments [31]. A specific integrin, αvβ6, has been found to promote the development of OSCC [32]. Many studies have emphasized the importance of epithelial-mesenchymal transformation (EMT) in tumour invasion and metastasis. Our results suggest that integrin and EMT may be key factors in the high invasiveness and metastasis of OSCC and that circRNAs may participate in the occurrence and development of OSCC through multiple pathways.
Hsa-mir-135b has been widely studied in many tumour types and is highly expressed in colon and gastric cancer tissues. The Wnt and PI3K/AKT signalling pathways promote the transcriptional activation of hsa-mir-135b, whereas hsa-mir-135b can in turn affect the activity of the Wnt pathway to promote the proliferation and invasion of tumour cells [33, 34]. Hsa-mir-135b also promotes the growth of blood vessels in tumour tissue by inhibiting the expression of FOXO1 protein [35]. Previous bioinformatics studies have found that hsa-mir-135b is highly expressed in OSCC [36, 37], and our study further confirmed this conclusion. However, we also found that higher expression of hsa-mir-135b in tumour tissue was associated with better prognosis. Further verification using UCSC Xena (https://xenabrowser.net/) showed that pancancer patients with high expression of hsa-miR-135b had a better prognosis (Fig. S9A) (P<0.05). This finding indicates a protective effect of hsa-mir-135b. Our results thus provide a new perspective on the role of hsa-miR-135b in tumours, which needs to be further explored. Hsa-miR-377 has an inhibitory role in the development and invasion of multiple cancers. Hsa-mir-377 targets ETS1 to inhibit human clear cell renal cell carcinoma [38], targets E2F3 to inhibit non-small cell lung cancer [39], and targets BRD4 to inhibit colon cancer [40]. Our results showed low expression of hsa-mir-377 in OSCC. Interestingly, we found that higher expression of hsa-miR-377 corresponded to a worse prognosis; this was verified on a pancancer basis (P<0.01) (Fig. S9B). Hsa-miR-377 thus seemed to be conducive to tumour development, indicating a new perspective on its role in tumours.
Hsa-let-7c acts as a tumour suppressor by targeting N-RAS, C-MYC, MMP1, PBX2, PBX3, and other factors [41]. Hsa-let-7c also targets IGF-1R through the MAPK pathway to inhibit the directional differentiation of dental pulp mesenchymal stem cells [42]. Our study found low expression of hsa-let-7c in OSCC; the higher the expression of hsa-let-7c in tumour tissue, the better the prognosis. SLC20A1 encodes sodium-dependent phosphate transporter 1 (PiT1). PiT1 is responsible for the activation of NF-κB, an important tumour-promoting pathway, and PiT-1 is directly related to cell proliferation [43]. SLC20A1 activates the Wnt/β-catenin signalling pathway and promotes the growth, invasion, and recurrence of growth hormone adenomas [44]. We found that SLC20A1 was highly expressed in OSCC and associated with worse prognosis. The coding product of the paired-like homeodomain transcription Factor 2 (PITX2) gene acts as a transcription factor. In addition to being physiologically involved in the development of the anterior structure, PITX2 promotes the development of multiple tumours and improves their drug resistance [45]. Our study showed low expression of PITX2 in OSCC, with its content in tumour tissue negatively correlated with prognosis.
The immune infiltration analysis showed significant increases in the numbers of M0, M1, and M2 macrophages in OSCC compared with normal tissues. Macrophages are important components of the tumour microenvironment. M1-like macrophages appear in the initial stage of tumour development and secrete proinflammatory cytokines, whereas M2-like macrophages are predominant in the metastasis stage and secrete anti-inflammatory factors. The M1-to-M2 transition plays a part in tumour progression [25]; thus, increased numbers of M1 macrophages may transform to M2 macrophages to promote OSCC progression. Therefore, the polarization of macrophages has a vital role in tumours [46].
In recent years, the relationship between PD-1/PD-L1 and macrophages has attracted increasing attention. PD-1 is an inhibitory receptor expressed on B cells, dendritic cells, macrophages, and T cells, and its expression on macrophages increases with the progression of disease. PD-L1 is a ligand of PD-1 that is widely expressed in many cell types. It is well known that PD-1 and PD-L1 mediate immune suppression in tumours by inhibiting T-cell activation. Recent studies have shown that PD-1 also inhibits phagocytosis in macrophages and may induce M2 polarization. Macrophage polarization is a potential tumour inhibition mechanism induced by anti-PD-1 therapy, and macrophages may also be responsible for nonresponse or drug resistance in patients treated with anti-PD-1 therapy [47]. Our results provide a further theoretical basis for the mechanism of anti-PD-1 targeted therapy in OSCC. A combination of PD-1/PD-L1 blockade and macrophage-targeting therapy may have a better antitumour effect. Our results also show that the higher the proportions of Tregs and resting mast cells in tumour tissues are, the better the prognosis of the patient.
Mast cells are secretory cells residing in tissues; they have important roles in innate and adaptive immunity and participate in chronic inflammation and tumour development. Activated mast cells secrete inflammatory cytokines, mainly to promote tumour growth, whereas a higher proportion of resting mast cells may correspond to a reduced inflammatory response, indicating a better prognosis [48]. It is generally believed that Treg cells promote tumour development by inhibiting antitumour immunity. However, in cancers characterized by significant chronic inflammation, such as colon, breast, bladder, or head and neck cancer [49], higher Treg infiltration levels within the tumour seem to correspond to better prognosis. This could be explained by a gene expression signature [50] or its capability to inhibit tumour-promoting inflammation [51]. Our results enrich the current view of Tregs and provide evidence for Tregs as "good citizens" in tumours. The correlation analysis between immune cells and biomarkers showed that SLC20A1 and hsa-let-7c had good correlations with Tregs and resting mast cells, respectively. Our results suggest the regulatory potential of a circRNA network in immune cells.
Our research had some limitations. First, the size of the sample we obtained from public databases was limited, which may have caused random errors. Second, the heterogeneity of the immune microenvironment at different sites of tumour invasion was not taken into consideration. In addition, further experiments are needed to verify the interactions among circRNAs, miRNAs, and mRNAs and to further clarify their mechanisms.
In summary, we established a circRNA-miRNA-mRNA network in OSCC through bioinformatics analysis. We identified SLC20A1, PITX2, hsa-mir-135b, hsa-mir-377, and hsa-let-7c as potential biomarkers for evaluating the prognosis of OSCC patients and established a prognostic model. Immune infiltration analysis showed that M0, M1, and M2 macrophage levels were increased in OSCC, whereas those of Tregs and resting mast cells were related to prognosis and had good correlations with specific biomarkers. Our results help to elucidate the mechanisms underlying OSCC and indicate potential new strategies for immunotherapy.
Abbreviations
Abbreviations and Full Names of all concepts in this manuscript can be found in the Supplementary Material (Supplement Table 2).
Supplementary Material
Supplementary figures and tables.
Acknowledgements
This work was supported by the National Natural Science Foundation of China (Grant No. 82103184), Key international cooperation projects of Hunan Province of China (Grant No. 2021WK2003), Natural Science Foundation of Hunan Province of China (Grant No. 2021JJ40720), The science and technology innovation Program of Hunan Province (2022RC1165) and the Open Sharing Fund for the Large-scale Instruments and Equipments of Central South University, Changsha, China.
Author contributions
Conception: Dehua Hu and Hao Jiang; Interpretation or analysis of data: Dehua Hu, Yufeng Cai and Lan He; Preparation of the manuscript: Yufeng Cai and Hao Jiang; Revision for important intellectual content: Dehua Hu and Hao Jiang; Supervision: Hao Jiang.
Availability of data and materials
The datasets used and/or analyzed during the current study are available from the corresponding author on reasonable request. The original data were obtained from GSE118750 and TCGA.
Competing Interests
The authors have declared that no competing interest exists.
References
1. Chi AC, Day TA, Neville BW. Oral cavity and oropharyngeal squamous cell carcinoma-an update, CA: a cancer journal for clinicians. 2015; 65: 401-21.
2. Cramer JD, Burtness B, Le QT. et al. The changing therapeutic landscape of head and neck cancer, Nature reviews Clinical oncology. 2019; 16: 669-683.
3. Sung H, Ferlay J, Siegel RL. et al. Global Cancer Statistics 2020: GLOBOCAN Estimates of Incidence and Mortality Worldwide for 36 Cancers in 185 Countries. CA Cancer J Clin. 2021;71:209-249
4. Scher ED, Romesser PB, Chen C. et al. Definitive chemoradiation for primary oral cavity carcinoma: A single institution experience. Oral Oncol. 2015;51:709-715
5. Liu L, Chen J, Cai X. et al. Progress in targeted therapeutic drugs for oral squamous cell carcinoma. Surgical oncology. 2019;31:90-97
6. Panarese I, Aquino G, Ronchi A. et al. Oral and Oropharyngeal squamous cell carcinoma: prognostic and predictive parameters in the etiopathogenetic route. Expert review of anticancer therapy. 2019;2:105-119
7. Zhang W, Xu S, Shi L. et al. Construction and analysis of a competing endogenous RNA network to reveal potential prognostic biomarkers for Oral Floor Squamous Cell Carcinoma. PloS one. 2020;9:e0238420
8. Huang GZ, Wu QQ, Zheng ZN. et al. Identification of Candidate Biomarkers and Analysis of Prognostic Values in Oral Squamous Cell Carcinoma. Frontiers in oncology. 2019;9:1054
9. Song Y, Pan Y, Liu J. Functional analysis of lncRNAs based on competitive endogenous RNA in tongue squamous cell carcinoma. PeerJ. 2019;7:e6991
10. Cao W, Liu JN, Liu Z. et al. A three-lncRNA signature derived from the Atlas of ncRNA in cancer (TANRIC) database predicts the survival of patients with head and neck squamous cell carcinoma. Oral oncology. 2017;65:94-101
11. Kristensen LS, Andersen MS, Stagsted LVW. et al. The biogenesis, biology and characterization of circular RNAs. Nat Rev Genet. 2019;11:675-691
12. George AK, Master K, Majumder A. et al. Circular RNAs constitute an inherent gene regulatory axis in the mammalian eye and brain 1. Can J Physiol Pharmacol. 2019;97:463-472
13. Gebert LFR, MacRae IJ. Regulation of microRNA function in animals. Nature reviews. Molecular cell biology. 2019;20:21-37
14. Thomson DW, Dinger ME. Endogenous microRNA sponges: evidence and controversy. Nature reviews. Genetics. 2016;5:272-83
15. Zhong Y, Du Y, Yang X. et al. Circular RNAs function as ceRNAs to regulate and control human cancer progression. Molecular cancer. 2018;1:79
16. Chen X, Yu J, Tian H. et al. Circle RNA hsa_circRNA_100290 serves as a ceRNA for miR-378a to regulate oral squamous cell carcinoma cells growth via Glucose transporter-1 (GLUT1) and glycolysis. Journal of cellular physiology. 2019;11:19130-19140
17. Xia B, Hong T, He X. et al. A circular RNA derived from MMP9 facilitates oral squamous cell carcinoma metastasis through regulation of MMP9 mRNA stability. Cell transplantation. 2019;12:1614-1623
18. Su W, Sun S, Wang F. et al. Circular RNA hsa_circ_0055538 regulates the malignant biological behavior of oral squamous cell carcinoma through the p53/Bcl-2/caspase signaling pathway. Journal of translational medicine. 2019;1:76
19. Zhao X, Ding L, Lu Z. et al. Diminished CD68 Cancer-Associated Fibroblast Subset Induces Regulatory T-Cell (Treg) Infiltration and Predicts Poor Prognosis of Oral Squamous Cell Carcinoma Patients. The American journal of pathology. 2020;4:886-899
20. Ritchie ME, Phipson B, Wu D. et al. limma powers differential expression analyses for RNA-sequencing and microarray studies. Nucleic acids research. 2015;7:e47
21. Ghosal S, Das S, Sen R. et al. Circ2Traits: a comprehensive database for circular RNA potentially associated with disease and traits. Frontiers in genetics. 2013;4:283
22. Pathan M, Keerthikumar S, Ang CS. et al. FunRich: An open access standalone functional enrichment and interaction network analysis tool. Proteomics. 2015;15:2597-601
23. Kanehisa M, Furumichi M, Tanabe M. et al. KEGG: new perspectives on genomes, pathways, diseases and drugs. Nucleic acids research. 2017;45:D353-D361
24. Szklarczyk D, Morris JH, Cook H. et al. The STRING database in 2017: quality-controlled protein-protein association networks, made broadly accessible. Nucleic acids research. 2017;45:D362-D368
25. Shannon P, Markiel A, Ozier O. et al. Cytoscape: a software environment for integrated models of biomolecular interaction networks. Genome research. 2003: 11: 2498-504.
26. Yoshihara K, Shahmoradgoli M, Martínez E. et al. Inferring tumour purity and stromal and immune cell admixture from expression data. Nature communications. 2013;4:2612
27. Newman AM, Liu CL, Green MR. et al. Robust enumeration of cell subsets from tissue expression profiles. Nature methods. 2015;5:453-7
28. Jiang P, Gu S, Pan D. et al. Signatures of T cell dysfunction and exclusion predict cancer immunotherapy response. Nature medicine. 2018;10:1550-1558
29. Mayakonda A, Lin DC, Assenov Y. et al. Maftools: efficient and comprehensive analysis of somatic variants in cancer. Genome research. 2018;11:1747-1756
30. Joshi S, Singh AR, Zulcic M. et al. Rac2 controls tumor growth, metastasis and M1-M2 macrophage differentiation in vivo. PLoS One. 2014;9:e95893
31. Hamidi H, Pietilä M, Ivaska J. The complexity of integrins in cancer and new scopes for therapeutic targeting. British journal of cancer. 2016;9:1017-1023
32. Thomas GJ, Nyström ML, Marshall JF. Alphavbeta6 integrin in wound healing and cancer of the oral cavity. Journal of oral pathology & medicine: official publication of the International Association of Oral Pathologists and the American Academy of Oral Pathology. 2006;1:1-10
33. Nagel R, le Sage C, Diosdado B. et al. Regulation of the adenomatous polyposis coli gene by the miR-135 family in colorectal cancer. Cancer research. 2008;14:5795-802
34. Wu Y, Hu G, Wu R. et al. High expression of miR-135b predicts malignant transformation and poor prognosis of gastric cancer. Life sciences. 2020;257:118133
35. Bai M, Li J, Yang H. et al. RETRACTED: miR-135b Delivered by Gastric Tumor Exosomes Inhibits FOXO1 Expression in Endothelial Cells and Promotes Angiogenesis. Molecular therapy: the journal of the American Society of Gene Therapy. 2019;10:1772-1783
36. Li S, Chen X, Liu X. et al. Complex integrated analysis of lncRNAs-miRNAs-mRNAs in oral squamous cell carcinoma. Oral oncology. 2017;73:1-9
37. Lopes CB, Magalhães LL, Teófilo CR. et al. Differential expression of hsa-miR-221, hsa-miR-21, hsa-miR-135b, and hsa-miR-29c suggests a field effect in oral cancer. BMC cancer. 2018;1:721
38. Wang R, Ma Y, Yu D. et al. miR-377 functions as a tumor suppressor in human clear cell renal cell carcinoma by targeting ETS1. Biomedicine & pharmacotherapy = Biomedecine & pharmacotherapie. 2015;70:64-71
39. Zhang J, Li Y, Dong M. et al. Long non-coding RNA NEAT1 regulates E2F3 expression by competitively binding to miR-377 in non-small cell lung cancer. Oncology letters. 2017;4:4983-4988
40. Xu G, Zhu H, Xu J. et al. Long non-coding RNA POU6F2-AS2 promotes cell proliferation and drug resistance in colon cancer by regulating miR-377/BRD4. Journal of cellular and molecular medicine. 2020;7:4136-4149
41. Mortazavi D, Sharifi M. Antiproliferative effect of upregulation of hsa-let-7c-5p in human acute erythroleukemia cells. Cytotechnology. 2018;6:1509-1518
42. Liu GX, Ma S, Li Y. et al. Hsa-let-7c controls the committed differentiation of IGF-1-treated mesenchymal stem cells derived from dental pulps by targeting IGF-1R via the MAPK pathways. Experimental & molecular medicine. 2018;4:25
43. Lacerda-Abreu MA, Russo-Abrahão T, Monteiro RQ. et al. Inorganic phosphate transporters in cancer: Functions, molecular mechanisms and possible clinical applications. Biochimica et biophysica acta. Reviews on cancer. 2018;2:291-298
44. El Husseini D, Boulanger MC, Fournier D. et al. High expression of the Pi-transporter SLC20A1/Pit1 in calcific aortic valve disease promotes mineralization through regulation of Akt-1. PloS one. 2013;1:e53393
45. Xu YY, Yu HR, Sun JY. et al. Upregulation of PITX2 Promotes Letrozole Resistance Via Transcriptional Activation of IFITM1 Signaling in Breast Cancer Cells. Cancer research and treatment: official journal of Korean Cancer Association. 2019;2:576-592
46. Lu D, Ni Z, Liu X. et al. Beyond T Cells: Understanding the Role of PD-1/PD-L1 in Tumor-Associated Macrophages. Journal of immunology research. 2019;2019:1919082
47. Cai J, Qi Q, Qian X. et al. The role of PD-1/PD-L1 axis and macrophage in the progression and treatment of cancer. Journal of cancer research and clinical oncology. 2019;6:1377-1385
48. Merluzzi S, Betto E, Ceccaroni AA. et al. Mast cells, basophils and B cell connection network. Molecular immunology. 2015;1:94-103
49. Badoual C, Hans S, Rodriguez J. et al. Prognostic value of tumor-infiltrating CD4+ T-cell subpopulations in head and neck cancers. Clinical cancer research: an official journal of the American Association for Cancer Research. 2006;2:465-72
50. Givechian KB, Wnuk K, Garner C. et al. Identification of an immune gene expression signature associated with favorable clinical features in Treg-enriched patient tumor samples. NPJ genomic medicine. 2018;3:14
51. Whiteside TL. FOXP3+ Treg as a therapeutic target for promoting anti-tumor immunity. Expert opinion on therapeutic targets. 2018;4:353-363
Author contact
![]() Corresponding author: Hao Jiang, 172# Tongzipo Road, School of Life Sciences, Central South University, Changsha, Hunan 410011, People's Republic of China. Tel: +86-13671769729. Email: jianghao1209edu.cn.
Corresponding author: Hao Jiang, 172# Tongzipo Road, School of Life Sciences, Central South University, Changsha, Hunan 410011, People's Republic of China. Tel: +86-13671769729. Email: jianghao1209edu.cn.