Impact Factor ISSN: 1837-9664

 Global reach, higher impact
J Cancer 2024; 15(10):3154-3172. doi:10.7150/jca.90197 This issue Cite
Research Paper
Prognostic value and therapeutic potential of NEK family in stomach adenocarcinoma
Xunjian Zhou1, Hui Nie2*, Chunrong Wang2, Xiaoqian Yu2, Xuejie Yang2, Xiaoyun He3, Chunlin Ou2,4 ![]() *
*
1. Department of Pathology, The First Hospital of Changsha (The Affiliated Changsha Hospital of Xiangya School of Medicine, Central South University), Changsha 410013, Hunan, China.
2. Department of Pathology, Xiangya Hospital, Central South University, Changsha 410008, Hunan, China.
3. Departments of Ultrasound Imaging, Xiangya Hospital, Central South University, Changsha 410008, Hunan, China.
4. National Clinical Research Center for Geriatric Disorders, Xiangya Hospital, Central South University, Changsha 410008, Hunan, China.
* These authors jointly supervised this work.
Received 2023-9-15; Accepted 2024-3-27; Published 2024-4-15
Abstract

Never in mitosis gene A-related kinase (NEK) is an 11-membered family of serine/threonine kinases (NEK1-NEK11), which are known to play important roles in the formation and development of cancer. However, few studies have examined the roles of these kinases in the development of stomach adenocarcinoma (STAD). In this study, we conducted a comprehensive analysis of the relationships between the NEKs family members and STAD. The differential expression of the NEK genes in STAD was validated using The Cancer Genome Atlas (TCGA) and Tumor Immune Estimation Resource (TIMER) databases, and their prognostic and diagnostic values of NEKs in STAD were assessed using the Kaplan-Meier plotter and TCGA data. The effect of NEK expression on immune cell infiltration in STAD was analysed using the TIMER and TISIDB databases. The expression levels of the majority of the NEK family members were consistently upregulated in STAD, whereas that of NEK10 was downregulated. The upregulation of NEK2/3/4/5/6/8 was closely associated with clinicopathological parameters of patients, and the overexpressed levels of these proteins had good diagnostic value for the disease. NEK1/8/9/10/11 expression correlated with poor overall survival and post-progressive survival, whereas a higher NEK1/6/9/11 level implied worse first progressive survival. Gene Ontology and Kyoto Encyclopedia of Genes and Genomes enrichment analyses revealed that the NEKs may be related to immunological responses. Additionally, our study confirmed that these kinases correlated with immune cell infiltration and different immune infiltration subtypes in STAD. Our results suggest that NEK9 in particular has the potential to be used as a diagnostic and prognostic biomarker of STAD development and progression and an immune target for treatment of the disease. These findings expand our understanding of the biological functions of the NEK family members in STAD.
Keywords: GATA family, stomach adenocarcinoma, prognosis, methylation, immune cells, biomarkers
Introduction
Stomach adenocarcinoma (STAD) is a malignant disease that occurs in the cells of the stomach glands, and accounts for 95% of gastric cancers [1]. Compared with other cancers, this disease has one of the highest morbidity and mortality rates [2, 3]. The limited clinical features of early STAD render its timely diagnosis difficult, increasing the risk of progression to advanced gastric cancer [4]. Although the popularisation of endoscopic technology, has resulted in breakthrough progress being made in the detection and treatment of early STAD, the long-term survival rate of patients with advanced disease is still low. To improve the prognosis of patients, current research should focus on identifying STAD-associated genes that can be used for the early detection of the disease or as therapeutic targets.
Never in mitosis gene A-related kinase (NEK) is a family of serine/threonine kinases made up of 11 members: NEK1-NEK11 [5]. These kinases contain serine/threonine residues at the activation modification sites within the activation loop [6]. Most members of the NEK family play indispensable roles in eukaryotic mitosis and cell-cycle regulation [7]. Consistent with the fact that the occurrence and development of cancer are inseparable from dysregulation of the cell cycle, an increasing number of studies have revealed a potential relationship between the NEK family and various cancer types [8, 9]. For example, the level of NEK1 expression has been found to be abnormally elevated in human prostate cancer, making the protein a potential therapeutic target [10]. Moreover, the expression of NEK2 is highly linked to cancer occurrence, development, and drug resistance [11]. Additionally, NEK4 has been shown to play a key role in lung and colorectal cancers [12, 13]. However, the roles of the different NEK family members in STAD have not been elucidated.
Currently, databases for tumor analysis include the Tumor Immune Estimation Resource (TIMER), the Cancer Genome Atlas (TCGA), Gene Expression Omnibus (GEO), Connectivity map (CMAP) [14, 16], Cancer Cell Line Encyclopedia (CCLE) [17, 19], etc. In this study, the potential role of NEK family members in STAD was explored through the analysis of some database data and experimental verification. To achieve this, data on the differential expression of the NEK genes in gastric cancer were obtained from various public databases and the correlations of the expression levels with clinicopathological characteristics, prognosis, signalling pathways, and immune infiltration were analysed.
Materials and Methods
The Cancer Genome Atlas (TCGA) HCC samples
TCGA, the most comprehensive cancer genome database available, contains clinical data from more than 11,000 patients across 33 cancer types [20]. We retrieved the clinical data of patients with STAD from this database and analysed the expression of the NEKs in the disease. The results were visualised using the online tool of the Xiantao Academic Network (https://www.xiantao.love/products).
Exclusion and inclusion criteria
Exclusion and inclusion criteria Eligible patients included in this article are in accordance with the following inclusion criteria: (1) pathological confirmation of the diagnosis; (2) prior to resection, none of the patients had received any type of therapy, including chemotherapy, radiation, or immunotherapy; (3) complete clinicopathological data. The detailed clinic parameters of enrolled patients were presented in Supplementary Table 1. Exclusion criteria included the following: (1) other treatments were used after the operation; (2) vital organ dysfunction; (3) other organ tumors.
Differential expression analysis of the NEK genes in STAD
TIMER database is a comprehensive web resource that provides users with quick and intuitive access to data for intuitively analysing the relationship between different types of cancer and immune infiltration (https://cistrome.shinyapps.io/timer/) [21]. By entering different modules, the correlation between gene expression, mutant genes, and immune infiltration levels can be retrieved. The differential expression of genes between different tumours and normal tissues can also be determined intuitively. Additionally, the site facilitates analysis of the correlations between genes [22].
Analysis of the association between NEK expression and STAD clinicopathological characteristics
UALCAN (http://ualcan.path.uab.edu/index.html) provides users with a convenient way to analyse the relationship between gene expression and characteristics using TCGA data [23]. Additionally, it can be used to analyse differential gene expression and methylation.
Analysis of the prognostic value of NEKs in STAD
Kaplan-Meier plotter (http://kmplot.com) data were obtained from various data platforms, including Gene Expression Omnibus (GEO), European Genome-phenome Archive (EGA), and TCGA. Kaplan-Meier survival analysis was used to analyse the human survival data for 31 types of cancer, including those of the breast, stomach, liver, and lung cancers [24].
Analysis of NEK gene alterations in STAD
The cBioPortal for Cancer Genomics (http://cbioportal.org) database integrates information on at least 30 cancer types, providing researchers with more intuitive access to epigenetic, gene expression, and proteomics data [25]. We used this database to explore NEK gene alterations in STAD. MethSurv is a visual analysis tool for exploring methylation biomarkers associated with cancer patient survival (https://biit.cs.ut.ee/methsurv) [26-28]. Gene Set Cancer Analysis (GSCA; https://guolab.wchscu.cn/GSCA/#/) data were used to analyse the relationship of promoter methylation levels in the NEK genes to patient survival differences in STAD [29]. These data were also used to predict drug sensitivity.
Analysis of NEK gene co-expression and enrichment in signalling pathways in STAD
Gene Expression Profiling Interactive Analysis (GEPIA), which integrates tumour and normal tissue samples from the Genotype-Tissue Expression (GTEx) and TCGA databases, is a platform for gene differential expression, survival, and correlation analyses (http://gepia2.cancer-pku.cn/) [30]. STRING is the most comprehensive database for predicting and analysing protein interactions (https://string-db.org/) [31]. Metascape is a robust functional annotation database for acquiring Gene Ontology (GO) and Kyoto Encyclopedia of Genes and Genomes (KEGG) enrichment pathway information on genes (https://metascape.org) [32].
Analysis of the association of NEK expression with immune infiltration in STAD
TIMER, one of the most common online tools used to analyse immune cell infiltration in tumour tissue, mainly analyses the infiltration of six types of immune cells, (viz.B cells, CD4+ T cells, CD8+ T cells, neutrophils, macrophages, and dendritic cells) in tumours. The TISIDB website provides information on the interaction between tumours and immune cells (http://cis.hku.hk/TISIDB) [33]. Using these databases, we fully explored the relationships between the NEKs, STAD, and immune cells to predict the influence of the kinases on disease occurrence and development and identify if any of them can be immunotherapeutic targets.
Patients' tissue samples
In total, 22 pairs of matched adjacent normal tissue samples and paraffin-embedded archival STAD specimens were collected from Xiangya Hospital (Changsha, P. R. China). These clinical specimens were collected with the approval of the Research Ethics Committee of the Xiangya Hospital of the Central South University.
Patients from whom the tumour specimens were collected met the following inclusion criteria: (1) confirmed diagnosis by pathology; (2) no prior treatment, including chemotherapy, radiotherapy, or immunotherapy before resection; and (3) complete clinicopathological data. The exclusion criteria were patients who received other treatments after surgery, had vital organ dysfunction, and had tumours in other organs.
Isolation of RNA from formalin-fixed paraffin-embedded samples
The formalin-fixed paraffin-embedded (FFPE) colon cancer or normal tissue samples were first deparaffinised with xylene. Then, total RNA was extracted from the cells using the Total RNA AmoyDx® FFPE RNA Extraction Kit (Cat. # 8.02.0019; AmoyDx, Xiamen, P. R. China).
Quantitative real-time polymerase chain reaction
The RNAs isolated from the various tissue samples were amplified and subsequently evaluated using the quantitative real-time polymerase chain reaction (qRT-PCR). Table 1 displays the qRT-PCR primer sequences.
Primer sequences used for the qRT-PCR.
| Gene | Primer (Forward) | Primer (Reverse) |
|---|---|---|
| NEK9 | GTGGAAGGAAGTCGATTTGACC | GCAGTGCCAGAATAACAATCTCA |
| ITGAX | GGGATGCCGCCAAAATTCTC | ATTGCATAGCGGATGATGCCT |
| U6 | CTCGCTTCGGCAGCACA | AACGCTTCACGAATTTGCGT |
Statistical analysis
The T test was used for the differential expression analysis, whereas the Chi-squared test was used for the analysis of clinicopathological characteristics. Differences with a P value of < 0.05 were considered statistically significant. The selection conditions for gene co-expression were |Log2FC| > 1 and P < 0.05.
Results
Expression of the NEK genes in STAD and normal gastric tissues
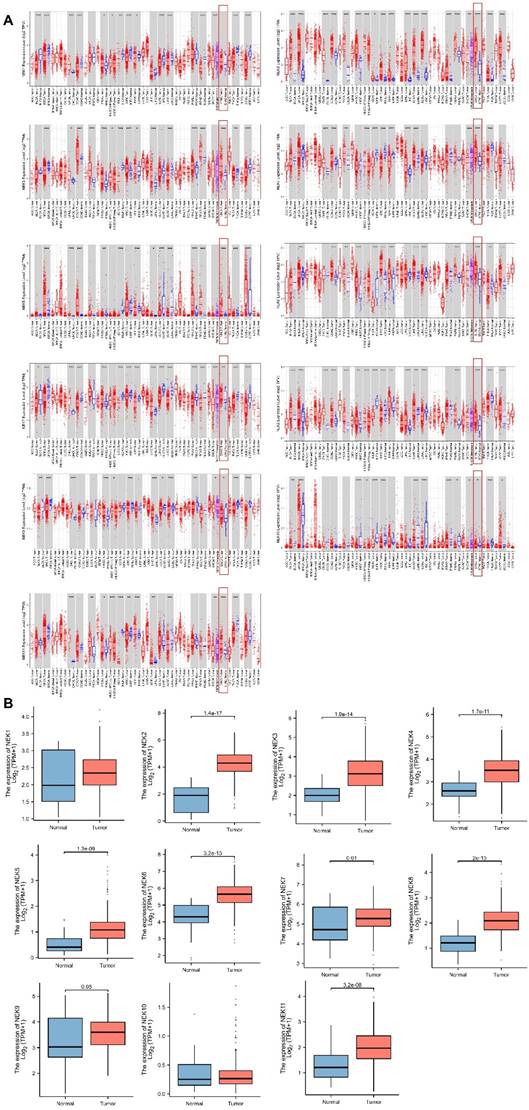
First, we conducted correlation studies on the expression of the NEK genes in STAD using the TIMER database. The results revealed that, except for NEK10, the expression levels of the other NEK genes were upregulated in the STAD tissues relative to the levels in the adjacent normal tissues (Figure 1A). Next, we verified the expression of these genes in STAD using TCGA data from the Xiantao Academic Network. As illustrated in Figure 1B, NEK2, NEK3, NEK4, NEK5, NEK6, NEK7, NEK8, NEK9, and NEK11 were overexpressed in the STAD tissue, and the difference in expression levels between the two groups of tissue was statistically significant (P < 0.05). However, the NEK1 and NEK10 expression levels were not notably different between the STAD and normal gastric tissue samples.
NEK family members are differentially expressed in STAD. (A) Expression levels of the NEK genes in different cancers compared with those in normal tissues (TIMER);.*P < 0.05, **P < 0.01, ***P < 0.01. (B) NEK gene expression levels in patients with STAD.
Association of NEK expression with clinicopathological characteristics
TCGA gastric cancer data from the Xiantao Academic Network were used to explore the diagnostic value of the NEK family members for STAD. As illustrated in Figure 2A, NEK2 (AUC = 0.955; 95% CI: 0.933-0.967) had excellent diagnostic capability, whereas NEK3 (AUC = 0.862; 95% CI: 0.811-0.914), NEK4 (AUC = 0.838; 95% CI: 0.780-0.897), NEK5 (AUC = 0.823; 95% CI: 0.736-0.911), NEK6 (AUC = 0.888; 95% CI: 0.842-0.933), and NEK8 (AUC = 0.891; 95% CI: 0.836-0.947) had moderate capabilities in this regard. By contrast, NEK1 (AUC = 0.603; 95% CI: 0.471-0.735), NEK7 (AUC = 0.648; 95% CI: 0.518-0.778), NEK9 (AUC = 0.627; 95% CI: 0.492-0.762), and NEK10 (AUC = 0.512; 95% CI: 0.392-0.632) had relatively poor diagnostic abilities. Overall, based on the results above, we conclude that the NEK family has relatively satisfactory potential for diagnosing STAD.
Association of NEK expression with STAD. (A) Diagnostic value of the NEK genes for STAD. (B) Correlations between the NEK expression levels and STAD stage. (C) Correlations between the NEK expression levels and STAD grade.
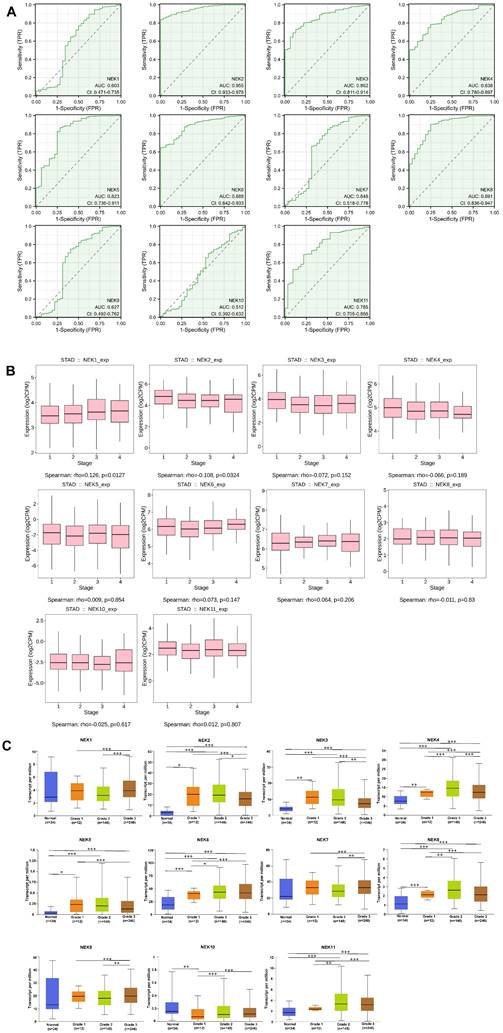
To gain better insight into the roles of the NEK family members in STAD development and progression, the TIDBS and UALCAN databases were used to further analyse the relationship between the gene expression levels and the clinicopathological characteristics of patients with the disease. As illustrated in Figure 2B, NEK1 and NEK2 expression was associated with the STAD stage (P < 0.05). However, there was no significant correlation between the expression of the other NEK genes and the cancer stage. Additionally, according to the UALCAN database, the mRNA expression levels of NEK2, NEK3, NEK4, NEK5, NEK6, and NEK8 were significantly positively correlated with the tumour grade (Figure 2C), whereas that of NEK10 was inversely associated with this factor. By contrast, NEK1, NEK7, and NEK9 expression showed no obvious trend with the tumour grade.
Next, using TCGA data, we comprehensively analysed the correlation between NEK expression and clinicopathological parameters (Table 2A, B). The NEK2 and NEK4 expression levels were notably associated with the patient sex, whereas NEK1 expression correlated strongly with T staging. Similarly, the NEK11 expression level correlated highly with the N and M stages of patients. In contrast to the UALCAN database results, the NEK6 and NEK7 expression levels significantly correlated with the patient grade, whereas NEK1 expression correlated with the clinical stage.
Clinicopathologic parameters and the expressions of NEK family members in STAD.
| Characteristics | N | NEK1 | NEK2 | NEK3 | NEK4 | NEK5 | NEK6 | ||||||||||||
|---|---|---|---|---|---|---|---|---|---|---|---|---|---|---|---|---|---|---|---|
| High | Low | P | High | Low | P | High | Low | P | High | Low | P | High | Low | P | High | Low | P | ||
| Gender | 0.775 | 0.001 | 0.512 | 0.002 | 0.650 | 0.625 | |||||||||||||
| Male | 221 | 86 | 135 | 77 | 144 | 73 | 148 | 75 | 146 | 79 | 142 | 94 | 127 | ||||||
| Female | 126 | 51 | 75 | 66 | 60 | 46 | 80 | 64 | 62 | 42 | 84 | 59 | 69 | ||||||
| Age | 0.545 | 0.432 | 0.916 | 0.804 | 0.918 | 0.363 | |||||||||||||
| ≤60 | 115 | 48 | 67 | 44 | 71 | 39 | 76 | 45 | 70 | 40 | 75 | 54 | 61 | ||||||
| >60 | 232 | 89 | 143 | 99 | 133 | 80 | 152 | 94 | 138 | 81 | 151 | 97 | 135 | ||||||
| T Stage | 0.028 | 0.980 | 0.819 | 0.906 | 0.620 | 0.233 | |||||||||||||
| T1+T2+T3 | 250 | 88 | 162 | 103 | 147 | 88 | 162 | 101 | 149 | 85 | 165 | 111 | 139 | ||||||
| T4 | 97 | 49 | 48 | 40 | 57 | 31 | 66 | 38 | 59 | 36 | 61 | 40 | 57 | ||||||
| N Stage | 0.075 | 0.653 | 0.715 | 0.096 | 0.976 | 0.858 | |||||||||||||
| Nx+N0+N1+N2 | 275 | 102 | 173 | 115 | 160 | 182 | 93 | 104 | 171 | 96 | 179 | 119 | 156 | ||||||
| N3 | 72 | 35 | 37 | 28 | 44 | 26 | 46 | 35 | 37 | 25 | 47 | 32 | 40 | ||||||
| Stage | 0.002 | 0.639 | 0.251 | 0.361 | 0.341 | 0.352 | |||||||||||||
| StageⅠ+Ⅱ | 162 | 53 | 109 | 69 | 93 | 50 | 112 | 67 | 95 | 50 | 112 | 65 | 97 | ||||||
| Stage Ⅲ | 148 | 71 | 77 | 58 | 90 | 58 | 90 | 54 | 94 | 57 | 91 | 71 | 77 | ||||||
| Stage Ⅳ | 37 | 13 | 24 | 16 | 21 | 11 | 26 | 18 | 19 | 14 | 23 | 15 | 22 | ||||||
| Grade | 1.000 | 1.000 | 0.315 | 0.090 | 0.424 | 0.039 | |||||||||||||
| G1 | 8 | 3 | 5 | 3 | 5 | 4 | 4 | 6 | 2 | 2 | 6 | 7 | 1 | ||||||
| G2+G3 | 331 | 131 | 200 | 137 | 194 | 114 | 217 | 200 | 131 | 118 | 213 | 140 | 191 | ||||||
| Gx | 8 | 3 | 5 | 3 | 5 | 1 | 7 | 2 | 6 | 1 | 7 | 4 | 4 | ||||||
| M Stage | 0.784 | 0.961 | 0.918 | 0.110 | 0.779 | 0.812 | |||||||||||||
| M0+ Mx | 323 | 130 | 193 | 131 | 192 | 111 | 212 | 126 | 197 | 112 | 211 | 140 | 183 | ||||||
| M1 | 24 | 7 | 17 | 12 | 12 | 8 | 16 | 13 | 11 | 9 | 15 | 11 | 13 | ||||||
Prognostic value of the NEK family members for patients with STAD
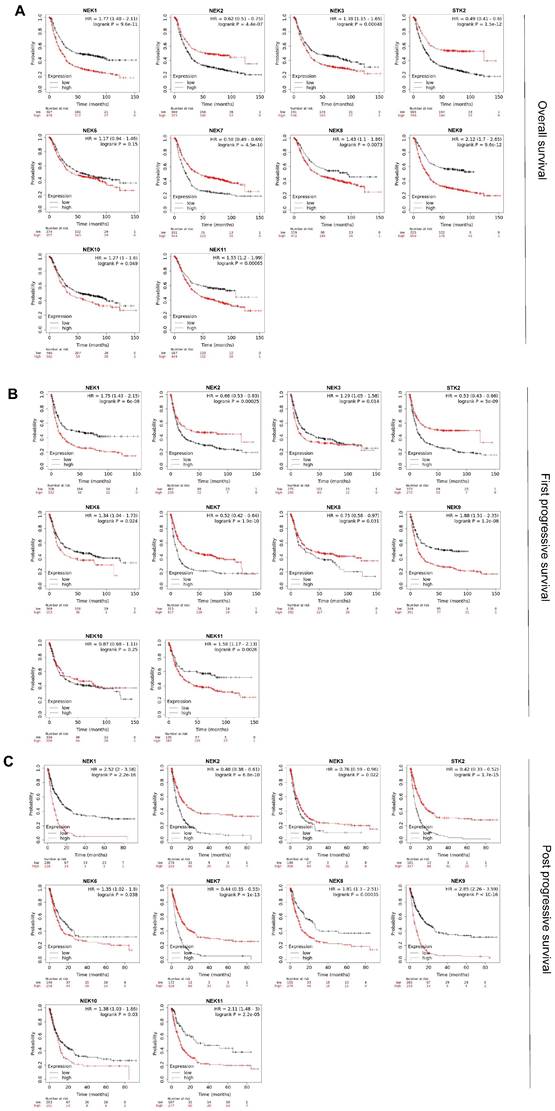
Kaplan-Meier analysis was used to investigate the prognostic value of the NEK family members for patients with STAD. Figure 3A illustrates the overall survival (OS) curve for the patients. In total 881 STAD samples in the Kaplan-Meier plotter were divided into high- and low-expression groups according to the mean values. Specifically, high expression of NEK1, NEK3, NEK4, NEK8, NEK9, NEK10, and NEK11 correlated notably with poor OS. Conversely, high expression of NEK2, NEK4, and NEK7 was notably associated with better OS, which is with the previous results showing their high differential expression in STAD. Subsequently, we explored the relationship between the NEKs and first progressive survival (FP) and post -progressive survival (PPS) of the patients. The results suggested that patients with higher levels of NEK1, NEK3, NEK6, NEK9, and NEK11 had shorter FP, whereas those with higher levels of NEK2, NEK4, NEK7, and NEK8 were associated with better FP (Figure 3B). Additionally, the upregulation of NEK1, NEK6, NEK8, NEK9, NEK10, and NEK11 expression was related to poor PPS, whereas the overexpression of NEK2, NEK3, NEK4, and NEK7 was linked to favourable PPS (Figure 3C). Taken together, these results indicate that the upregulation of NEK1/3/9/11 and downregulation of NEK2/4/7 expression are significantly associated with worse clinical outcomes in patients with STAD.
Prognostic value of the NEKs for patients with STAD. (A) Effects of the NEKs on the overall survival (OS) of the patients. (B) Effects of the NEKs on the first progressive survival (FP) of the patients. (C) Effects of the NEKs on the post-progressive survival (PPS) of the patients.
NEK gene alterations in STAD
Subsequently, we examined the genetic alterations in the NEK family in STAD using the cBioPortal database. In total, 233 (57%) of the 407 STAD samples showed genetic alterations, including missense mutations, amplifications, deep deletions, in-frame mutations, truncations, splice mutations, mRNA overexpression, and mRNA underexpression. mRNA overexpression was the dominant type of alteration in all STAD samples (Figure 4A and B). NEK3, NEK2, NEK11, NEK9, and NEK8 were ranked as the top five genes with alterations, accounting for 19%, 12%, 11%, 9%, and 8% of the STAD samples, respectively (Figure 4C).
NEK gene alterations in STAD (cBioPortal). (A) NEK gene alterations in different gastric adenocarcinomas. (B) Genetic variations of the NEK family (NEK1-NEK11). (C) Summary of NEK gene alterations in STAD. (D) Correlation between NEK expression and methylation in STAD. (E) Survival differences between hypermethylated and hypomethylated patient groups.
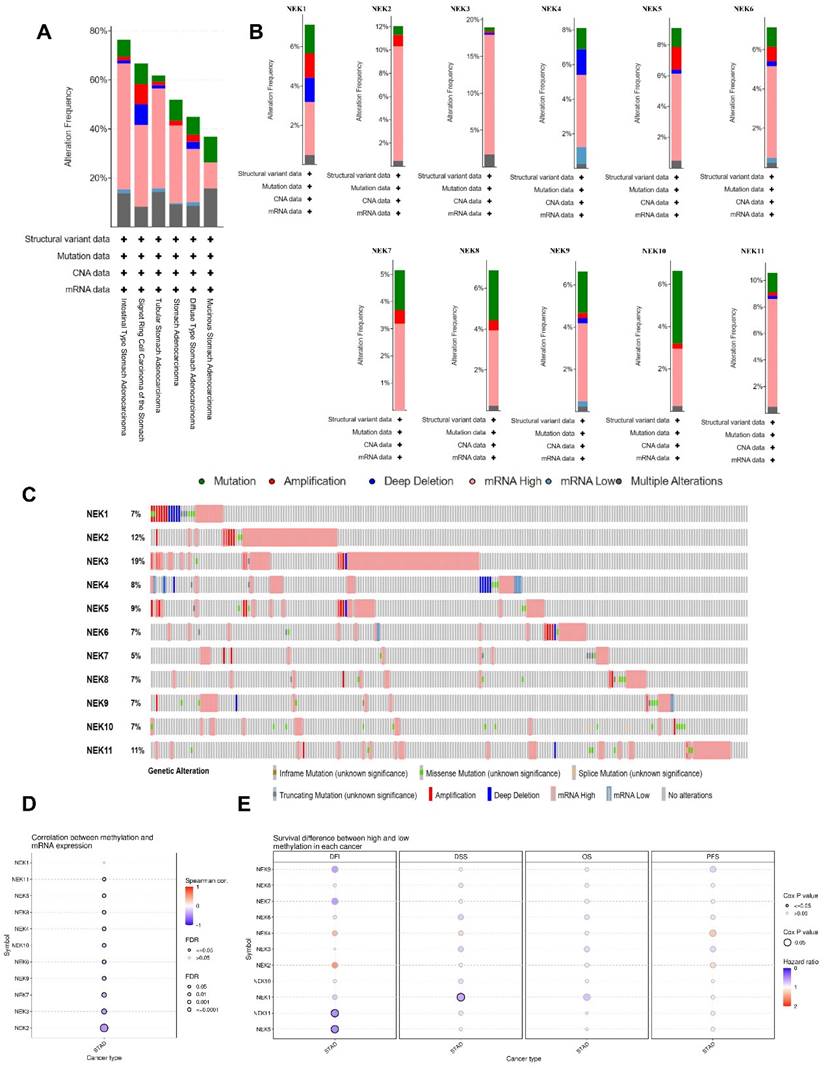
DNA methylation is an epigenetic mechanism which is closely related to the occurrence and development of tumours. We explored the NEK methylation levels in STAD using the GSCA database and found that the promoter methylation levels of all NEK family members, except NEK1, were decreased (Figure 4D). The NEK2, NEK3, and NEK7 expression levels were moderately correlated with promoter methylation (r = -0.45, FDR = 0.00e+0; r = -0.40, FDR = 6.04e-16; r = -0.34, FDR = 3.73e-11, respectively). We also investigated the relationship between methylation expression and differences in patient survival, including disease-free interval (DFI), disease-specific survival (DSS), OS, and progression-free survival (PFS) (Figure 4E). Hypomethylation of NEK5 and NEK11 was significantly associated with worse DFI (Cox P = 0.035 and Cox P = 0.032, respectively), whereas hypomethylation of NEK1 was associated with poor DSS (Cox P = 0.024). One single CpG was shown to be prognostic for STAD (Table 3).
Clinicopathologic parameters and the expressions of NEK family members in STAD (continued).
| Characteristics | N | NEK7 | NEK8 | NEK9 | NEK10 | NEK11 | ||||||||||
|---|---|---|---|---|---|---|---|---|---|---|---|---|---|---|---|---|
| High | Low | P | High | Low | P | High | Low | P | High | Low | P | High | Low | P | ||
| Gender | 0.542 | 0.380 | 0.116 | 0.513 | 0.199 | |||||||||||
| Male | 221 | 88 | 133 | 91 | 130 | 107 | 114 | 76 | 145 | 81 | 140 | |||||
| Female | 126 | 46 | 80 | 58 | 68 | 76 | 50 | 39 | 87 | 55 | 71 | |||||
| Age | 0.400 | 0.215 | 0.363 | 0.319 | 0.166 | |||||||||||
| ≤60 | 115 | 48 | 67 | 44 | 71 | 59 | 56 | 34 | 81 | 51 | 64 | |||||
| >60 | 232 | 86 | 146 | 105 | 127 | 131 | 101 | 81 | 151 | 85 | 147 | |||||
| T Stage | 0.646 | 0.676 | 0.314 | 0.672 | 0.112 | |||||||||||
| T1+T2+T3 | 250 | 93 | 157 | 110 | 140 | 119 | 131 | 80 | 170 | 91 | 159 | |||||
| T4 | 97 | 41 | 56 | 39 | 58 | 38 | 59 | 35 | 62 | 45 | 52 | |||||
| N Stage | 0.745 | 0.435 | 0.675 | 0.809 | 0.106 | |||||||||||
| Nx+N0+N1+N2 | 275 | 105 | 170 | 121 | 154 | 126 | 149 | 92 | 183 | 175 | 100 | |||||
| N3 | 72 | 29 | 43 | 28 | 44 | 31 | 41 | 23 | 49 | 36 | 36 | |||||
| Stage | 0.458 | 0.338 | 0.865 | 0.561 | 0.137 | |||||||||||
| StageⅠ+Ⅱ | 162 | 57 | 105 | 74 | 88 | 74 | 88 | 49 | 113 | 59 | 103 | |||||
| Stage Ⅲ | 148 | 61 | 87 | 57 | 91 | 65 | 83 | 53 | 95 | 57 | 91 | |||||
| Stage Ⅳ | 37 | 16 | 21 | 18 | 19 | 18 | 19 | 13 | 24 | 20 | 17 | |||||
| Grade | 0.006 | 0.927 | 0.043 | 0.071 | 0.790 | |||||||||||
| G1 | 8 | 6 | 2 | 4 | 4 | 6 | 2 | 4 | 4 | 3 | 5 | |||||
| G2+G3 | 331 | 128 | 203 | 142 | 189 | 150 | 181 | 111 | 220 | 131 | 200 | |||||
| Gx | 8 | 0 | 8 | 3 | 5 | 1 | 7 | 0 | 8 | 2 | 6 | |||||
| M Stage | 0.750 | 0.249 | 0.952 | 0.983 | 0.044 | |||||||||||
| M0+ Mx | 323 | 124 | 199 | 132 | 187 | 146 | 177 | 107 | 216 | 122 | 201 | |||||
| M1 | 24 | 10 | 14 | 13 | 11 | 11 | 13 | 8 | 16 | 14 | 10 | |||||
The prognostic values of CpG sites in the NEKs by MethSurv.
| CpG site | Gene symbol | Group | CpG Island | HR | CI | P value |
|---|---|---|---|---|---|---|
| cg02998883 | NEK1 | Body | Open_Sea | 0.649 | 0.45-0.935 | 0.017 |
| cg05110629 | NEK1 | Body | Open_Sea | 0.664 | 0.452-0.974 | 0.03 |
| cg26722769 | NEK1 | Body | Open_Sea | 0.651 | 0.434-0.977 | 0.031 |
| cg11225435 | NEK2 | TSS200 | Island | 0.668 | 0.481-0.928 | 0.018 |
| cg15731669 | NEK3 | 5'UTR;TSS200;Body | Island | 0.701 | 0.498-0.986 | 0.046 |
| cg22900224 | NEK4 | 5'UTR;1stExon | Island | 0.688 | 0.491-0.964 | 0.027 |
| cg14049380 | NEK4 | TSS200 | Island | 0.68 | 0.491-0.942 | 0.019 |
| cg03143060 | NEK4 | TSS1500 | S_Shore | 0.498 | 0.36-0.688 | 2.20E-05 |
| cg08090396 | NEK4 | TSS1500 | S_Shore | 0.699 | 0.487-1.002 | 0.046 |
| cg00883505 | NEK5 | TSS200 | Island | 0.708 | 0.512-0.979 | 0.036 |
| cg18057513 | NEK5 | TSS1500 | S_Shore | 0.54 | 0.373-0.781 | 0.00061 |
| cg20559216 | NEK5 | TSS1500 | S_Shore | 0.643 | 0.447-0.924 | 0.014 |
| cg08287471 | NEK6 | 5'UTR;Body | Island | 0.645 | 0.467-0.892 | 0.0088 |
| cg14196208 | NEK6 | TS200;TSS1500;Body | N_Shore | 0.707 | 0.512-0.977 | 0.035 |
| cg13582060 | NEK6 | 5'UTR;Body | Open_Sea | 0.711 | 0.511-0.988 | 0.04 |
| cg14036069 | NEK6 | 5'UTR;Body | Open_Sea | 0.711 | 0.516-0.98 | 0.037 |
| cg08528000 | NEK7 | Body | Open_Sea | 0.536 | 0.379-0.76 | 0.00029 |
| cg12750917 | NEK7 | Body | Open_Sea | 0.702 | 0.51-0.968 | 0.031 |
| cg14557909 | NEK8 | TSS1500 | Island | 0.568 | 0.361-0.895 | 0.0093 |
| cg05343811 | NEK9 | Body | S_Shore | 1.74 | 1.186-2.551 | 0.003 |
| cg17147885 | NEK10 | 5'UTR | Open_Sea | 0.521 | 0.343-0.791 | 0.0011 |
| cg09642369 | NEK10 | TSS1500 | S_Shore | 0.572 | 0.412-0.795 | 0.0011 |
| cg17918906 | NEK10 | TSS1500 | S_Shore | 0.558 | 0.398-0.782 | 0.0011 |
| cg20886017 | NEK11 | Body | Open_Sea | 1.468 | 1.064-2.025 | 0.02 |
Co-expression and functional analyses of the NEK genes in STAD
Using the GEPIA database, we analysed the relationships between the different NEK genes (Figure 5A). In the STAD group, a strong association was observed between NEK1 and NEK7/10 (r = 0.57, P < 0.001; r = 0.65, P < 0.001, respectively) as well as between NEK7 and NEK9 (r = 0.62, P < 0.001). NEK3 was moderately related to NEK2/5 (r = 0.25, P = 2.1e-07; r = 0.38, P = 3.6e-15, respectively). NEK6 had a relatively moderate relationship with NEK8 (r = 0.23, P = 81.7e-06). NEK7 was moderately associated with NEK10 (r = 0.23, P = 3.8e-06). Next, we downloaded NEK-related genes (Supplementary Table 2) from the TCGA-STAD dataset of the cBioPortal database (cut-off: |Log2FC| > 1, P < 0.05) for co-expression and functional analyses. The protein-protein interaction network was plotted using the tools on the STRING and Cytoscape databases. Figure 5B illustrates the relationships between the different NEK proteins. As displayed in Figure 5C, B-cell antigen receptor complex-associated protein alpha chain isoform 1 (CD79a), mucin 4 subunit A1 (MUC4A1), mucin 6 (MUC6), and complement receptor type 2 (CR2) were the main molecules associated with the functional regulation of NEK family members in STAD.
Interaction and functional analyses of NEKs in STAD. (A) Interaction analysis of the NEK family members (GEPIA). (B) Protein-protein interaction network of the NEK family in STAD (STRING). (C) Co-expression network of NEK family members in STAD. (D) Gene Ontology (GO) analysis of NEK-related biological processes (BP) in STAD. (E) GO analysis of NEK-related molecular functions (MF) in STAD. (F) GO analysis of NEK-related cellular components (CC) in STAD. (G) Kyoto Encyclopedia of Genes and Genomes (KEGG) analyses of NEK-related pathways in STAD. (H) Correlation between NEK expression and sensitivity to Cancer Therapeutics Response Portal (CTRP) drugs (top 30).
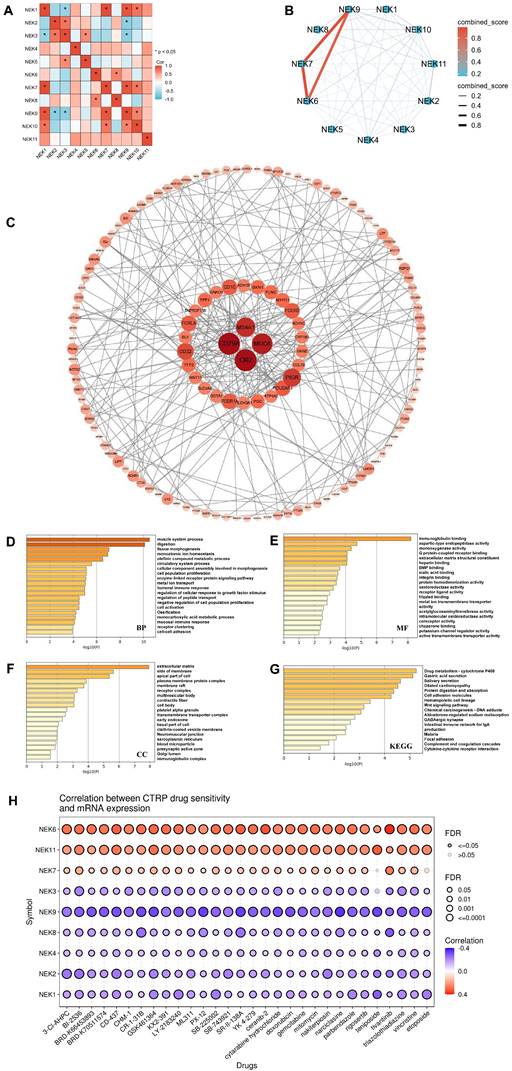
To fully understand the downstream pathways of the NEKs in STAD, we used Metascape software to perform GO and KEGG enrichment analyses on 186 selected co-expressed genes to explore the potential biological functions of these kinases. As displayed in Figure 5D, the top-ranked biological processes related to the NEK genes were muscle system processes, digestion, tissue morphogenesis, monoatomic ion homeostasis, and olefinic component assembly involved in morphogenesis. Additionally, we found that humoral and mucosal immune responses were also important biological processes. With regard to cellular components, the extracellular matrix, side of the membrane, apical part of the cell, plasma membrane protein complex, membrane raft, and immunoglobulin complex were related to the NEK genes (Figure 5E). The most notable NEK gene-related molecular functions were immunoglobulin binding, aspartic-type endopeptidase activity, monooxygenase activity, G-protein-coupled receptor binding, and extracellular matrix structural constituents (Figure 5F). KEGG analysis indicated that the genes were enriched in pathways related to drug metabolism-cytochrome P450, gastric acid secretion, dilated cardiomyopathy, protein digestion and absorption, intestinal immune network for IgA production, and cytokine-cytokine receptor interactions (Figure 5G).
Given that the KEGG results had indicated a close association between the NEK family and drug metabolism in STAD, we used the Cancer Therapeutics Response Portal (CTRP) dataset from the GSCA database to predict the relationship between NEK expression and drug sensitivity. As displayed in Figure 5H, NEK6 expression was positively correlated with sensitivity to BRD-K30748066 (r = 0.42, FDR = 0.008) and GSK-J4 (r = 0.40, FDR = 0.005). NEK11 expression was positively correlated with sensitivity to BRD-K30748066 (r = 0.31, FDR = 0.056) and teniposide (r = 0.32, FDR = 2.54e-10). The expression of NEK9 was negatively correlated with sensitivity to narciclasine (r =-0.35, FDR =1.15e-21), SR-II-138A (r =-0.33, FDR = 8.76e-21), tipifarnib-P2 (r =-0.32, FDR = 2.55e-10), teniposide (r =-0.32, FDR = 2.34e-10), and TG101348 (r = -0.32, FDR = 2.35e-17).
Association between NEK gene expression and immune infiltration in STAD
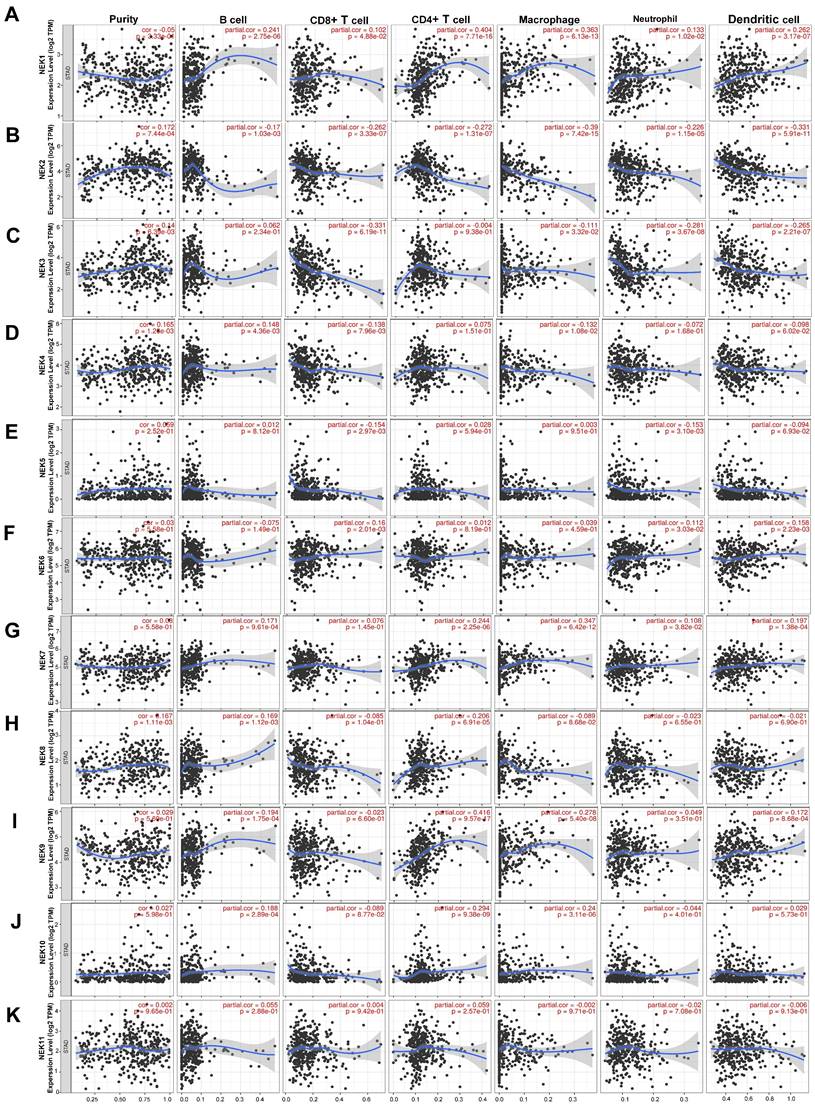
In recent years, the immune microenvironment and immunotherapies have become relatively popular topics in cancer research [34, 35]. Infiltrating immune cells constitute a significant portion of the tumour immune microenvironment, affecting the occurrence and development of tumours. Because NEK2 plays a pivotal role in the immune response of pancreatic cancer, NEK2 inhibitors can alleviate the immune resistance of this cancer type [36]. Therefore, we first identified the relationship between each NEK family member and immune cell infiltration using resources on the TIMER database. As illustrated in Figure 6, NEK1 expression was positively correlated with the infiltration of B cells, CD4+ T cells, CD8+ T cells, neutrophils, macrophages, and dendritic cells (DCs) (P < 0.05). By contrast, the NEK2 expression level correlated negatively with the infiltration of these six types of immune cells (P < 0.05). NEK3 expression was negatively associated with the infiltration of CD4+ T cells, CD8+ T cells, neutrophils, macrophages, and DCs (P < 0.05). NEK4 expression correlated positively with B-cell infiltration but negatively with CD8+ T cells and macrophages (P < 0.05). NEK5 expression correlated negatively with CD8+ T cells and neutrophil infiltration (P < 0.05). NEK6 was positively associated with CD8+ T cells, neutrophils, and DCs (P < 0.05). The NEK7 expression level correlated positively with the infiltration of all of the immune cells (P < 0.05), except for CD8+ T cells. NEK8 expression was positively correlated with the infiltration of B and CD4+ T cells (P < 0.05). The NEK9 expression level was positively correlated with the infiltration of all of the immune cells (P < 0.05), except for CD8+ T cells and neutrophils. NEK10 expression was positively correlated with the infiltration of B cells, CD4+ T cells, and macrophages but negatively correlated with that of CD8+ T cells (P < 0.05). By contrast, there was no significant correlation between NEK11 and any of the six types of immune cells (P > 0.05).
Association of NEK gene expression with immune infiltration in STAD. (A-K) Correlations of NEK1-NEK11 expression levels with tumour immune infiltration (B cells, CD4+ T cells, CD8+ T cells, macrophages, neutrophils, and dendritic cells) in STAD.
Association between NEK gene expression and immune cell markers
After analysing the associations of the NEK family members with tumour-infiltrating immune cells, we explored their correlations with immune cell markers. The results are summarised in Table 4A and Table 4B. The expression of NEK1 was significantly correlated with most of the gene markers of B cells, T cells with different functions (CD8+ T, T-helper 1 (Th1), Th17, Th2, etc.), monocytes, DCs, neutrophils, and natural killer cells. NEK2 expression correlated with markers of B cells, T cells, M2 macrophages, neutrophils, Th1 cells, monocytes, and DCs. NEK3 expression was associated with B cell, CD8+ T cell, T cell, M2 macrophage, neutrophil, monocyte, and DC markers. NEK4 was associated with Th17 cell and Treg markers. NEK5 expression was associated only with markers of B cells. NEK6 expression was correlated with markers of M2 macrophages, neutrophils, monocytes, Th17 cells, Tregs, and DCs. NEK7 expression was associated with markers of T cells with different functions, M2 macrophages, neutrophils, and monocytes. NEK8 expression was associated with Treg markers. NEK9 expression was associated with markers of B cells, T cells with different functions, M2 macrophages, neutrophils, monocytes, and DCs. NEK10 expression correlated with neutrophil markers. NEK11 expression was associated with Tfh and Treg markers. These findings are all consistent with the results presented in Figure 6K.
The correlations between the expression of NEK family members and the markers of immune cells.
| NEK1 | NEK2 | NEK3 | NEK4 | NEK5 | NEK6 | ||||||||
|---|---|---|---|---|---|---|---|---|---|---|---|---|---|
| Cor | P | Cor | P | Cor | P | Cor | P | Cor | P | Cor | P | ||
| CD8+ Tcell | CD8A | 0.315 | *** | -0.191 | *** | -0.285 | *** | 0.049 | 0.320 | -0.111 | * | 0.123 | * |
| CD8B | 0.179 | *** | -0.053 | 0.278 | -0.101 | * | 0.072 | 0.141 | -0.074 | 0.130 | 0.037 | 0.449 | |
| GZMA | 0.225 | *** | -0.081 | 0.099 | -0.216 | *** | 0.032 | 0.518 | -0.116 | * | 0.085 | 0.083 | |
| B cell | CD19 | 0.276 | *** | -0.224 | *** | -0.190 | *** | 0.002 | 0.968 | -0.112 | ** | 0.064 | 0.195 |
| CD79A | 0.180 | *** | -0.337 | *** | -0.281 | *** | -0.100 | * | -0.164 | * | 0.082 | 0.094 | |
| MS4A1 | 0.324 | *** | -0.366 | *** | -0.219 | *** | -0.056 | 0.257 | -0.105 | * | 0.072 | 0.146 | |
| T cell | CD3D | 0.218 | *** | -0.222 | *** | -0.261 | *** | -0.054 | 0.272 | -0.163 | ** | 0.114 | * |
| CD3E | 0.239 | *** | -0.249 | *** | -0.251 | *** | -0.033 | 0.502 | -0.130 | ** | 0.135 | ** | |
| CD2 | 0.303 | *** | -0.193 | *** | -0.201 | *** | 0.031 | 0.535 | -0.088 | 0.073 | 0.136 | ** | |
| M2 | MS4A4A | 0.390 | *** | -0.248 | *** | -0.179 | *** | 0.018 | 0.716 | 0.020 | 0.682 | 0.187 | *** |
| CD163 | 0.426 | *** | -0.122 | * | -0.130 | ** | 0.168 | ** | 0.086 | 0.082 | 0.290 | *** | |
| VSIG4 | 0.312 | *** | -0.195 | *** | -0.179 | *** | 0.016 | 0.746 | 0.027 | 0.579 | 0.173 | *** | |
| Neutrophils | ITGAM | 0.379 | *** | -0.193 | *** | -0.184 | *** | 0.069 | 0.160 | 0.018 | 0.709 | 0.308 | *** |
| CCR7 | 0.335 | *** | -0.343 | *** | -0.226 | *** | -0.032 | 0.516 | -0.059 | 0.227 | 0.205 | *** | |
| SIGLEC5 | 0.378 | *** | -0.197 | *** | -0.112 | * | 0.100 | * | 0.040 | 0.413 | 0.173 | *** | |
| DC | ITGAX | 0.334 | *** | -0.152 | ** | -0.102 | * | 0.160 | ** | 0.031 | 0.528 | 0.295 | *** |
| CD1C | 0.324 | *** | -0.440 | *** | -0.209 | *** | -0.116 | ** | -0.085 | 0.085 | 0.101 | * | |
| NRP1 | 0.460 | *** | -0.235 | *** | -0.113 | * | 0.077 | 0.116 | 0.068 | 0.169 | 0.282 | *** | |
| NK cell | KIR3DL3 | 0.023 | 0.644 | 0.089 | 0.070 | -0.047 | 0.342 | 0.086 | 0.080 | 0.049 | 0.324 | 0.036 | 0.469 |
| KIR2DS4 | 0.158 | ** | -0.037 | 0.458 | -0.108 | * | 0.044 | 0.368 | 0.000 | 0.994 | -0.034 | 0.488 | |
| Th1 | TBX21 | 0.297 | *** | -0.159 | ** | -0.246 | *** | 0.077 | 0.119 | -0.077 | 0.115 | 0.197 | *** |
| STAT1 | 0.270 | *** | 0.267 | *** | 0.004 | 0.936 | 0.364 | *** | 0.123 | * | 0.184 | *** | |
| STAT4 | 0.439 | *** | -0.202 | *** | -0.105 | * | 0.100 | * | 0.009 | 0.850 | 0.157 | ** | |
| IFNG | 0.171 | *** | 0.117 | * | -0.077 | 0.119 | 0.151 | ** | -0.035 | 0.478 | 0.096 | 0.052 | |
| Th2 | STAT6 | 0.269 | *** | -0.043 | 0.378 | 0.047 | 0.335 | 0.180 | *** | 0.156 | ** | 0.303 | *** |
| GATA3 | 0.257 | *** | -0.252 | *** | -0.304 | *** | -0.073 | 0.139 | -0.105 | * | 0.077 | 0.117 | |
| STAT5A | 0.476 | *** | -0.093 | 0.059 | -0.047 | 0.337 | 0.232 | *** | 0.108 | * | 0.279 | *** | |
| Tfh | BCL6 | 0.481 | *** | -0.327 | 0.000 | -0.230 | *** | 0.133 | ** | 0.048 | 0.334 | 0.209 | *** |
| IL21 | 0.209 | *** | 0.063 | 0.200 | -0.069 | 0.158 | 0.095 | 0.053 | 0.056 | 0.253 | 0.074 | 0.134 | |
| Th17 | STAT3 | 0.502 | *** | -0.053 | 0.282 | -0.069 | 0.158 | 0.384 | *** | 0.199 | *** | 0.401 | *** |
| IL17A | -0.102 | * | 0.165 | 0.001 | 0.096 | 0.051 | 0.137 | ** | 0.004 | 0.937 | 0.152 | ** | |
| Treg | FOXP3 | 0.254 | *** | -0.045 | 0.356 | -0.095 | 0.054 | 0.136 | ** | -0.031 | 0.530 | 0.217 | *** |
| STAT5B | 0.614 | *** | -0.107 | 0.029 | 0.090 | 0.066 | 0.306 | *** | 0.213 | *** | 0.286 | *** | |
| CCR8 | 0.343 | *** | -0.035 | 0.473 | -0.076 | 0.122 | 0.196 | *** | 0.047 | 0.340 | 0.223 | *** | |
| T exhaustion-cell | PDCD1 | 0.229 | *** | -0.052 | 0.293 | -0.209 | *** | 0.069 | 0.163 | -0.086 | 0.081 | 0.184 | *** |
| CTLA4 | 0.277 | *** | 0.046 | 0.354 | -0.021 | 0.671 | 0.208 | *** | 0.023 | 0.645 | 0.134 | ** | |
| HAVCR2 | 0.321 | *** | -0.107 | 0.029 | -0.167 | ** | 0.091 | 0.063 | 0.018 | 0.716 | 0.228 | *** | |
| LAG3 | 0.188 | *** | -0.029 | 0.553 | -0.260 | *** | 0.050 | 0.310 | -0.121 | * | 0.094 | 0.057 | |
| Monocyte | CD86 | 0.292 | *** | -0.156 | 0.001 | -0.174 | *** | 0.039 | 0.422 | 0.000 | 0.998 | 0.174 | *** |
| C3AR1 | 0.368 | *** | -0.180 | 0.000 | -0.148 | ** | 0.061 | 0.216 | 0.053 | 0.277 | 0.227 | *** | |
| CSF1R | 0.395 | *** | -0.239 | 0.000 | -0.202 | *** | 0.077 | 0.119 | 0.024 | 0.625 | 0.258 | *** | |
The correlations between the expression of NEK family members and the markers of immune cells (continued).
| NEK7 | NEK8 | NEK9 | NEK10 | NEK11 | |||||||||
|---|---|---|---|---|---|---|---|---|---|---|---|---|---|
| Cor | P | Cor | P | Cor | P | Cor | P | Cor | P | ||||
| CD8+ Tcell | CD8A | 0.187 | *** | -0.018 | 0.716 | 0.183 | *** | -0.014 | 0.782 | 0.086 | 0.082 | ||
| CD8B | 0.099 | * | 0.028 | 0.569 | 0.066 | 0.183 | 0.054 | 0.272 | 0.040 | 0.418 | |||
| GZMA | 0.119 | * | -0.115 | * | 0.104 | * | -0.099 | * | 0.058 | 0.234 | |||
| B cell | CD19 | 0.078 | 0.114 | 0.122 | * | 0.222 | *** | 0.061 | 0.218 | -0.008 | 0.877 | ||
| CD79A | 0.038 | 0.446 | 0.037 | 0.458 | 0.097 | * | 0.018 | 0.709 | -0.074 | 0.132 | |||
| MS4A1 | 0.149 | ** | 0.034 | 0.485 | 0.233 | *** | 0.076 | 0.124 | -0.049 | 0.324 | |||
| T cell | CD3D | 0.090 | 0.067 | -0.064 | 0.195 | 0.107 | * | -0.054 | 0.274 | -0.011 | 0.828 | ||
| CD3E | 0.084 | 0.087 | 0.003 | 0.945 | 0.141 | ** | 0.003 | 0.957 | 0.049 | 0.319 | |||
| CD2 | 0.169 | ** | -0.020 | 0.682 | 0.199 | *** | 0.024 | 0.621 | 0.067 | 0.174 | |||
| M2 | MS4A4A | 0.327 | *** | -0.075 | 0.126 | 0.281 | *** | 0.114 | * | 0.057 | 0.251 | ||
| CD163 | 0.374 | *** | 0.028 | 0.574 | 0.368 | *** | 0.158 | ** | 0.165 | ** | |||
| VSIG4 | 0.265 | *** | -0.107 | * | 0.227 | *** | 0.059 | 0.227 | 0.069 | 0.158 | |||
| Neutrophils | ITGAM | 0.322 | *** | 0.142 | ** | 0.323 | *** | 0.169 | ** | 0.153 | ** | ||
| CCR7 | 0.184 | *** | 0.084 | 0.088 | 0.262 | *** | 0.127 | * | 0.010 | 0.842 | |||
| SIGLEC5 | 0.280 | *** | 0.025 | 0.613 | 0.308 | *** | 0.121 | * | 0.030 | 0.549 | |||
| DC | ITGAX | 0.277 | *** | 0.149 | ** | 0.305 | *** | 0.121 | * | 0.110 | * | ||
| CD1C | 0.202 | *** | 0.061 | 0.218 | 0.241 | *** | 0.178 | *** | -0.026 | 0.590 | |||
| NRP1 | 0.428 | *** | -0.001 | 0.986 | 0.439 | *** | 0.269 | *** | 0.148 | ** | |||
| NK cell | KIR3DL3 | 0.014 | 0.777 | 0.028 | 0.571 | -0.037 | 0.450 | 0.008 | 0.869 | 0.075 | 0.127 | ||
| KIR2DS4 | 0.094 | 0.056 | -0.058 | 0.237 | 0.084 | 0.087 | -0.010 | 0.837 | 0.053 | 0.285 | |||
| Th1 | TBX21 | 0.131 | ** | 0.046 | 0.346 | 0.210 | *** | -0.012 | 0.811 | 0.088 | 0.074 | ||
| STAT1 | 0.300 | *** | 0.163 | ** | 0.264 | *** | 0.066 | 0.178 | 0.359 | *** | |||
| STAT4 | 0.320 | *** | 0.068 | 0.167 | 0.352 | *** | 0.175 | *** | 0.144 | ** | |||
| IFNG | 0.116 | * | -0.024 | 0.628 | 0.063 | 0.200 | -0.051 | 0.298 | 0.132 | ** | |||
| Th2 | STAT6 | 0.350 | *** | 0.317 | *** | 0.428 | *** | 0.192 | *** | 0.289 | *** | ||
| GATA3 | 0.175 | *** | 0.059 | 0.232 | 0.173 | *** | 0.027 | 0.577 | 0.051 | 0.298 | |||
| STAT5A | 0.404 | *** | 0.207 | *** | 0.458 | *** | 0.173 | *** | 0.238 | *** | |||
| Tfh | BCL6 | 0.345 | *** | 0.088 | 0.072 | 0.393 | *** | 0.269 | *** | 0.167 | ** | ||
| IL21 | 0.143 | ** | 0.035 | 0.471 | 0.106 | * | 0.044 | 0.371 | 0.115 | * | |||
| Th17 | STAT3 | 0.414 | *** | 0.308 | *** | 0.531 | *** | 0.318 | *** | 0.390 | *** | ||
| IL17A | -0.193 | *** | 0.014 | 0.781 | -0.119 | * | 0.046 | 0.346 | 0.019 | 0.700 | |||
| Treg | FOXP3 | 0.098 | * | 0.190 | *** | 0.186 | *** | 0.060 | 0.219 | 0.159 | ** | ||
| STAT5B | 0.530 | *** | 0.318 | *** | 0.693 | *** | 0.389 | *** | 0.234 | *** | |||
| CCR8 | 0.266 | *** | 0.151 | ** | 0.299 | *** | 0.178 | *** | 0.224 | *** | |||
| T exhaustion-cell | PDCD1 | 0.085 | 0.082 | 0.113 | * | 0.183 | *** | -0.064 | 0.194 | 0.087 | 0.077 | ||
| CTLA4 | 0.132 | 0.007 | 0.081 | 0.100 | 0.190 | *** | 0.062 | 0.207 | 0.168 | ** | |||
| HAVCR2 | 0.263 | *** | -0.008 | 0.864 | 0.235 | *** | 0.023 | 0.643 | 0.119 | * | |||
| Monocyte | CD86 | 0.241 | *** | -0.051 | 0.304 | 0.189 | *** | 0.046 | 0.347 | 0.066 | 0.181 | ||
| C3AR1 | 0.319 | *** | -0.039 | 0.423 | 0.298 | *** | 0.093 | 0.058 | 0.063 | 0.198 | |||
| CSF1R | 0.295 | *** | 0.065 | 0.186 | 0.338 | *** | 0.152 | ** | 0.081 | 0.101 | |||
* p < 0.05; ** p < 0.01; *** p < 0.001
Relationship between NEK expression in STAD and tumour immune subtypes and immunotherapy
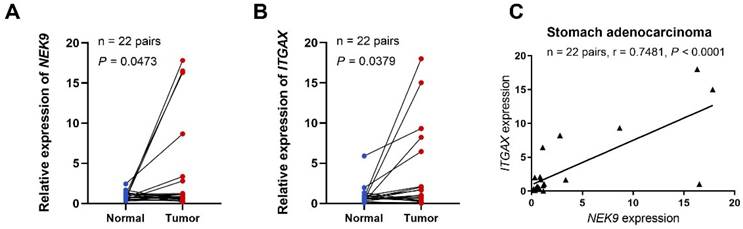
To further investigate the role of NEK9 in STAD, we performed preliminary experiments to verify the differential expression of the gene in the tumour tissue and its correlation with immune cell markers. qRT-PCR analysis of NEK9 expression in 22 STAD tissue samples revealed that the relative expression levels were significantly higher than those in adjacent non-tumour tissues (P = 0.0473; Figure 7A). We also demonstrated an association between NEK9 and integrin, alpha X (ITGAX), a marker gene for DCs [37]. According to the qRT-PCR results, the relative expression levels of ITGAX in the 22 STAD samples were significantly higher than those in the matched normal samples taken from the vicinity of the cancerous tissue (P = 0.0379; Figure 7B). Finally, we found a positive correlation between the expression of NEK9 and ITGAX in the 22 STAD samples (r = 0.7481, P < 0.001; Figure 7C).
NEK9 and ITGAX mRNA expression levels, and functional enrichment analysis of NEK9 in STAD. (A) NEK9 mRNA expression in STAD. (B) ITGAX mRNA expression in STAD. (C) Relationship between the mRNA expression levels of NEK9 and ITGAX in STAD.
To further elucidate the roles of NEKs in STAD pathogenesis, we investigated whether their expression differed amongst different immune subtypes of the disease (Figure 8A). The results indicated that the expression levels of NEK1/2/3/4/7/9/10/11 differed significantly amongst the five immune subtypes (C1, C2, C3, C4, and C6). These findings further indicate that NEKs play a vital role in immune infiltration in STAD.
Association of NEKs with chemokines, chemokine receptors, and immune subtypes in STAD. (A) Relationships between the NEKs and immune subtypes in STAD (TISIDB). (B) Prognostic value of NEK expression levels after anti-PD1/PDL1 treatment (BEST).
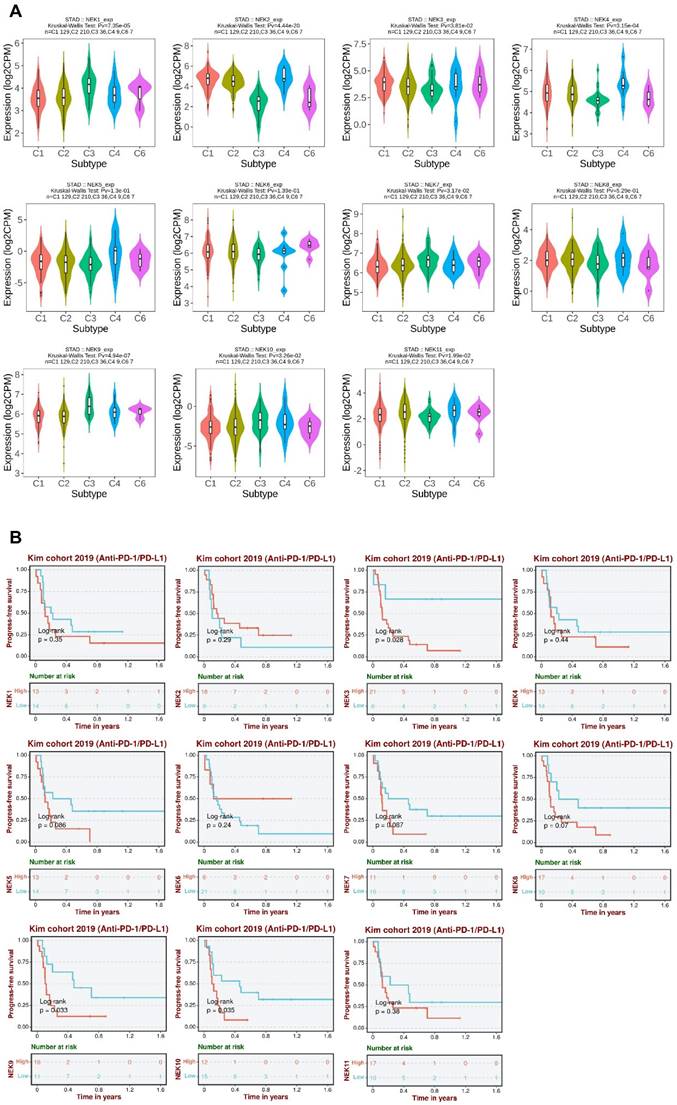
Next, we analysed the relationship between NEK expression and prognosis after anti-programmed death 1/programmed death ligand 1 (PD1/PDL1) treatment in patients with STAD. We found that high levels of NEK3, NEK9, and NEK10 expression were associated with poor PFS after anti-PD1/PDL1 treatment (Figure 8B). These results suggest that members of the NEK family may be involved in resistance to STAD immunotherapy.
Discussion
The NEK family consists of 11 protein kinases (NEK1-NEK11), which are primarily involved in checkpoint regulation, primary cilia function, mRNA splicing, and the cell cycle [38, 39]. Because NEKs play an essential role in regulating the cell cycle and centrosome separation, their abnormal expression leads to chromosomal instability in tumour cells [40]. Most NEK family members are differentially expressed in various types of cancer, such as those of the breast, lung, prostate, and colon-rectum [41-43]. However, the carcinogenicity and association of NEKs with STAD have not been fully elucidated. Therefore, it is necessary to comprehensively investigate the expression profiles of the NEKs in STAD and their association with immune cell infiltration as well as their prognostic value.
Previous studies have revealed the abnormal expression of NEK family members in a variety of tumours. Their expression levels correlate with the clinical characteristics and prognosis of cancer patients and can be used as diagnostic and prognostic markers. Zhu et al. [44] demonstrated that NEK1 expression was elevated in glioma tissues and cells compared with the level in normal brain tissues, and its high level was associated with expression of the tumour cell proliferation marker Ki-67, the tumour grade, and poor survival. NEK2 is upregulated in hepatocellular carcinoma (HCC) and is associated with adverse outcomes in patients with this disease [45]. In STAD, NEK2 has been shown to play a cancer-promoting role by activating the AKT-mediated signaling pathway [46]. Fang et al. showed that MBM-5 can effectively inhibit the kinase activity of NEK2, which has potential application value in the anti-gastric cancer and colorectal cancer [47].
NEK3 overexpression is significantly correlated with the TNM stage, lymph node metastasis, and poor prognosis of patients with gastric cancer and can be used as an independent prognostic factor of patient survival [48]. According to Ding et al. [12], NEK4 overexpression promotes the migration and invasion of lung cancer cells and is a promising diagnostic marker of lung cancer metastasis. NEK6 is an adverse prognostic factor in HCC, and its expression correlates with the histological grade, Ki-67 expression, and alpha-foetal protein level [49]. A study on NEK7 evidenced that its expression was upregulated and associated with a poor prognosis in STAD [50]. In gastric cancer, NEK8 has been confirmed to indirectly affect the survival rate of gastric cancer patients through its direct interaction with von-Hippel-Lindau tumor suppressor protein (pVHL) [51]. In our study, the NEK1/2/3/4/5/6/7/8/9/11 expression levels were substantially higher in patients with STAD. This result is consistent with those of other studies on the expression of NEKs, such as NEK3 and NEK7 in this disease. Furthermore, our study found that high NEK1/6/7/9/11 expression was closely associated with clinicopathological parameters such as the TMN stages and clinical grade of patients with STAD. In terms of diagnosis and prognosis, NEK2/3/4/5/6/8 overexpression has good diagnostic value in STAD. High NEK1/8/9/10/11 expression was correlated with poor OS and PPS, whereas high NEK1/6/9/11 expression was associated with poor FP. These results highlight the potential use of the NEK family members as diagnostic and prognostic markers for STAD.
We also investigated NEK gene alterations in STAD tissue specimens from patients at the Xiangya Hospital. Of the 407 STAD samples examined, 233 (57%) showed genetic alterations, including missense mutations, amplifications, deep deletions, in-frame mutations, truncations, splicing mutations, mRNA overexpression, and mRNA underexpression. NEK3, NEK2, NEK11, NEK9, and NEK8 were the five genes with the most alterations, accounting for 19%, 12%, 11%, 9%, and 8% of the STAD samples, respectively. DNA methylation is an epigenetic mechanism that is closely associated with the occurrence and development of tumours. Using the GSCA database, we found that the promoter methylation levels of all the NEK genes, except NEK1, were downregulated in STAD. We also investigated the relationship between methylation status and patient survival and found that the low methylation of NEK5 and NEK11 was significantly associated with poor DFI, and the low methylation of NEK1 was associated with poor DSS.
According to the GO and KEGG enrichment analyses, the NEKs are closely associated with immune function, being involved in the humoral and mucosal immune responses, immunoglobulin complex, immunoglobulin binding, intestinal immune network for IgA production, and cytokine-cytokine receptor interactions. Recent studies have evidenced that immune cell infiltration and the tumour microenvironment are involved in the progression and immune escape of STAD [52-55]. In this study, the correlation between the NEKs and immune infiltration was analysed using the TIMER and TISIDB databases. The results revealed that the NEKs were highly associated with the activity and expression of numerous immune cells, immunoregulators and their receptors, and immune subtypes. Specifically, the expression of NEK2/3/4/5/6 was highly correlated with CD8+ T cell infiltration, whereas that of NEK1/2/3/6/9 was associated with DCs. Moreover, the NEK1/4/6/7/8/9/11 expression levels were associated with Treg infiltration. CD8+ T cells, natural killer cells, and DCs play extremely important roles in anti-tumour immunotherapy, whereas Tregs play a cancer-promoting role in the tumour immune microenvironment [56]. Therefore, we hypothesise that NEK1/4/6/7/8/9/11 may play a cancer-promoting role in STAD via Tregs. Moreover, as the most effective antigen-presenting cells, activated DCs can stimulate the anti-tumour immune response of T and NK cells [57]. However, there are no published reports on the association of NEK9 with DCs in STAD. Therefore, using 22 pairs of FFPE archival STAD tissue and matched adjacent normal tissue samples, we further confirmed the differential expression of NEK9 in STAD and its correlation with immune cells and verified that the gene expression level was markedly upregulated in the cancerous tissue. NEK9 also evidenced a positive correlation with ITGAX, which is a marker gene of DCs. These results suggest that NEK9 may have anti-STAD effects through its interaction with DCs. CXCR4, a representative G-protein-coupled receptor, plays an important role in mediating tumour-directed migration, invasion, and metastasis. These findings suggest that the impact of the NEKs on the prognosis of patients with STAD may be partly explained by their regulation of the tumour immune microenvironment. This hypothesis warrants further research. Additionally, our study suggests that NEK9 plays a major role in tumour immunity and is therefore a potential biomarker for predicting both the disease prognosis and the efficacy of immunotherapy in patients with STAD.
As a limitation of this study, the relationships between the NEK family members and STAD were explored through bioinformatic analysis and lacked experimental clinical validation. Hence, more studies will be conducted to analyse and confirm the specific mechanisms of action of these NEKs in order to support their clinical application as prognostic biomarkers or immunotherapeutic targets for STAD.
In conclusion, we investigated the roles of NEKs in the pathogenesis of STAD by analysing their differential expression, gene mutations, functional enrichment, and associations with immune infiltration and patient prognosis. Our findings suggest promising new directions for the research and development of STAD treatments.
Supplementary Material
Supplementary table 1.
Supplementary table 2.
Acknowledgements
Funding
This study was supported by the Outstanding Youth Foundation of Hunan Provincial Natural Science Foundation of China (2022JJ20098), the Natural Science Foundation of Hunan Province (2022JJ40784), and the Central South University Innovation-Driven Research Programme (2023CXQD075).
Data availability statement
The original contributions presented in the study are included in the article/SupplementaryMaterial, further inquiries can be directed to the corresponding authors.
Author contributions
Hui Nie and Chunlin Ou conducted experimental operations, sample processing, data analysis, and performed the experiments. All authors participated in writing the paper. Xunjian Zhou conceived and designed the experiments. All authors read and approved the final manuscript.
Competing Interests
The authors declare that the research was conducted in the absence of any commercial or financial relationships that could be construed as a potential conflict of interest.
References
1. Machlowska J, Baj J, Sitarz M. et al. Gastric Cancer: Epidemiology, Risk Factors, Classification, Genomic Characteristics and Treatment Strategies. Int J Mol Sci. 2020;21(11):4012
2. Siegel RL, Miller KD, Fuchs HE. et al. Cancer statistics, 2022. CA Cancer J Clin. 2022;72(1):7-33
3. Nie H, Liao Z, Wang Y. et al. Exosomal long non-coding RNAs: Emerging players in cancer metastasis and potential diagnostic biomarkers for personalized oncology. Genes Dis. 2021;8(6):769-780
4. Smyth EC, Nilsson M, Grabsch HI. et al. Gastric cancer. Lancet. 2020;396(10251):635-648
5. Panchal NK, Evan Prince S. The NEK family of serine/threonine kinases as a biomarker for cancer. Clin Exp Med. 2023;23(1):17-30
6. Bertran MT, Sdelci S, Regué L. et al. Nek9 is a Plk1-activated kinase that controls early centrosome separation through Nek6/7 and Eg5. Embo j. 2011;30(13):2634-2647
7. O'Connell MJ, Norbury C, Nurse P. Premature chromatin condensation upon accumulation of NIMA. Embo j. 1994;13(20):4926-4937
8. Moniz L, Dutt P, Haider N. et al. Nek family of kinases in cell cycle, checkpoint control and cancer. Cell Div. 2011;6:18
9. Melo-Hanchuk TD, Martins MB, Cunha LL. et al. Expression of the NEK family in normal and cancer tissue: an immunohistochemical study. BMC Cancer. 2020;20(1):23
10. Singh V, Jaiswal PK, Ghosh I. et al. The TLK1-Nek1 axis promotes prostate cancer progression. Cancer Lett. 2019;453:131-141
11. Fang Y, Zhang X. Targeting NEK2 as a promising therapeutic approach for cancer treatment. Cell Cycle. 2016;15(7):895-907
12. Ding NH, Zhang L, Xiao Z. et al. NEK4 kinase regulates EMT to promote lung cancer metastasis. J Cell Mol Med. 2018;22(12):5877-5887
13. Huo T, Canepa R, Sura A. et al. Colorectal cancer stages transcriptome analysis. PLoS One. 2017;12(11):e0188697
14. Lamb J, Crawford ED, Peck D. et al. The Connectivity Map: using gene-expression signatures to connect small molecules, genes, and disease. Science. 2006;313(5795):1929-1935
15. Subramanian A, Narayan R, Corsello SM. et al. A Next Generation Connectivity Map: L1000 Platform and the First 1,000,000 Profiles. Cell. 2017;171(6):1437-1452.e17
16. Wang CY, Chiao CC, Phan NN. et al. Gene signatures and potential therapeutic targets of amino acid metabolism in estrogen receptor-positive breast cancer. Am J Cancer Res. 2020;10(1):95-113
17. Barretina J, Caponigro G, Stransky N. et al. The Cancer Cell Line Encyclopedia enables predictive modelling of anticancer drug sensitivity [published correction appears in Nature. 2012 Dec 13;492(7428):290.
18. Kao TJ, Wu CC, Phan NN. et al. Prognoses and genomic analyses of proteasome 26S subunit, ATPase (PSMC) family genes in clinical breast cancer. Aging (Albany NY). 2021;13(14):17970
19. Lazaro-Camp VJ, Salari K, Meng X, Yang S. SETDB1 in cancer: overexpression and its therapeutic implications. Am J Cancer Res. 2021;11(5):1803-1827
20. Blum A, Wang P, Zenklusen JC. SnapShot: TCGA-Analyzed Tumors. Cell. 2018;173(2):530
21. Li T, Fan J, Wang B. et al. TIMER: A Web Server for Comprehensive Analysis of Tumor-Infiltrating Immune Cells. Cancer Res. 2017;77(21):e108-e110
22. Nie H, Wang Y, Yang X. et al. Clinical Significance and Integrative Analysis of the SMC Family in Hepatocellular Carcinoma. Front Med (Lausanne). 2021;8:727965
23. Chandrashekar DS, Bashel B, Balasubramanya SAH. et al. UALCAN: A Portal for Facilitating Tumor Subgroup Gene Expression and Survival Analyses. Neoplasia. 2017;19(8):649-658
24. Wang Y, Nie H, Liao Z. et al. Expression and Clinical Significance of Lactate Dehydrogenase A in Colon Adenocarcinoma. Front Oncol. 2021;11:700795
25. Gao J, Aksoy BA, Dogrusoz U. et al. Integrative analysis of complex cancer genomics and clinical profiles using the cBioPortal. Sci Signal. 2013;6(269):pl1
26. Modhukur V, Iljasenko T, Metsalu T, Lokk K, Laisk-Podar T, Vilo J. MethSurv: a web tool to perform multivariable survival analysis using DNA methylation data. Epigenomics. 2018;10(3):277-288
27. Anuraga G, Wang WJ, Phan NN. et al. Potential Prognostic Biomarkers of NIMA (Never in Mitosis, Gene A)-Related Kinase (NEK) Family Members in Breast Cancer. J Pers Med. 2021;11(11):1089
28. Xing C, Wang Z, Zhu Y. et al. Integrate analysis of the promote function of Cell division cycle-associated protein family to pancreatic adenocarcinoma. Int J Med Sci. 2021;18(3):672-684
29. Liu CJ, Hu FF, Xie GY. et al. GSCA: an integrated platform for gene set cancer analysis at genomic, pharmacogenomic and immunogenomic levels. Brief Bioinform. 2023;24(1):bbac558
30. Tang Z, Kang B, Li C. et al. GEPIA2: an enhanced web server for large-scale expression profiling and interactive analysis. Nucleic Acids Res. 2019;47(W1):W556-w560
31. Szklarczyk D, Franceschini A, Wyder S. et al. STRING v10: protein-protein interaction networks, integrated over the tree of life. Nucleic Acids Res. 2015;43(Database issue):D447-452
32. Zhou Y, Zhou B, Pache L. et al. Metascape provides a biologist-oriented resource for the analysis of systems-level datasets. Nat Commun. 2019;10(1):1523
33. Ru B, Wong CN, Tong Y. et al. TISIDB: an integrated repository portal for tumor-immune system interactions. Bioinformatics. 2019;35(20):4200-4202
34. Fujii SI, Shimizu K. Immune Networks and Therapeutic Targeting of iNKT Cells in Cancer. Trends Immunol. 2019;40(11):984-997
35. Miao Y, Yang H, Levorse J. et al. Adaptive Immune Resistance Emerges from Tumor-Initiating Stem Cells. Cell. 2019;177(5):1172-1186.e1114
36. Zhang X, Huang X, Xu J. et al. NEK2 inhibition triggers anti-pancreatic cancer immunity by targeting PD-L1. Nat Commun. 2021;12(1):4536
37. Li J, Jie HB, Lei Y. et al. PD-1/SHP-2 inhibits Tc1/Th1 phenotypic responses and the activation of T cells in the tumor microenvironment. Cancer Res. 2015;75(3):508-518
38. Fry AM, Bayliss R, Roig J. Mitotic Regulation by NEK Kinase Networks. Front Cell Dev Biol. 2017;5:102
39. Fry AM, O'Regan L, Sabir SR. et al. Cell cycle regulation by the NEK family of protein kinases. J Cell Sci. 2012;125(Pt 19):4423-4433
40. Sdelci S, Bertran MT, Roig J. Nek9, Nek6, Nek7 and the separation of centrosomes. Cell Cycle. 2011;10(22):3816-3817
41. Nuncia-Cantarero M, Martinez-Canales S, Andrés-Pretel F. et al. Functional transcriptomic annotation and protein-protein interaction network analysis identify NEK2, BIRC5, and TOP2A as potential targets in obese patients with luminal A breast cancer. Breast Cancer Res Treat. 2018;168(3):613-623
42. Shi YX, Yin JY, Shen Y. et al. Genome-scale analysis identifies NEK2, DLGAP5 and ECT2 as promising diagnostic and prognostic biomarkers in human lung cancer. Sci Rep. 2017;7(1):8072
43. Pavan ICB, Basei FL, Severino MB. et al. NEK6 Regulates Redox Balance and DNA Damage Response in DU-145 Prostate Cancer Cells. Cells. 2023;12(2):256
44. Zhu J, Cai Y, Liu P. et al. Frequent Nek1 overexpression in human gliomas. Biochem Biophys Res Commun. 2016;476(4):522-527
45. Lin S, Zhou S, Jiang S. et al. NEK2 regulates stem-like properties and predicts poor prognosis in hepatocellular carcinoma. Oncol Rep. 2016;36(2):853-862
46. Wan H, Xu L, Zhang H, Wu F, Zeng W, Li T. High expression of NEK2 promotes gastric cancer progression via activating AKT signaling. J Physiol Biochem. 2021;77(1):25-34
47. Fang Y, Kong Y, Xi J. et al. Preclinical activity of MBM-5 in gastrointestinal cancer by inhibiting NEK2 kinase activity. Oncotarget. 2016;7(48):79327-79341
48. Cao Y, Song J, Chen J. et al. Overexpression of NEK3 is associated with poor prognosis in patients with gastric cancer. Medicine (Baltimore). 2018;97(3):e9630
49. Cao X, Xia Y, Yang J. et al. Clinical and biological significance of never in mitosis gene A-related kinase 6 (NEK6) expression in hepatic cell cancer. Pathol Oncol Res. 2012;18(2):201-207
50. Li YK, Zhu XR, Zhan Y. et al. NEK7 promotes gastric cancer progression as a cell proliferation regulator. Cancer Cell Int. 2021;21(1):438
51. Ding XF, Chen J, Zhou J, Chen G, Wu YL. Never-in-mitosis A-related kinase 8, a novel target of von-Hippel-Lindau tumor suppressor protein, promotes gastric cancer cell proliferation. Oncol Lett. 2018;16(5):5900-5906
52. Shao W, Yang Z, Fu Y. et al. The Pyroptosis-Related Signature Predicts Prognosis and Indicates Immune Microenvironment Infiltration in Gastric Cancer. Front Cell Dev Biol. 2021;9:676485
53. Zeng D, Wu J, Luo H. et al. Tumor microenvironment evaluation promotes precise checkpoint immunotherapy of advanced gastric cancer. J Immunother Cancer. 2021;9(8):e002467
54. Wang D, Han Y, Peng L. et al. Crosstalk between N6-methyladenosine (m6A) modification and noncoding RNA in tumor microenvironment. Int J Biol Sci. 2023;19(7):2198-2219
55. Han Y, Wang D, Peng L. et al. Single-cell sequencing: a promising approach for uncovering the mechanisms of tumor metastasis. J Hematol Oncol. 2022;15(1):59
56. Lei X, Lei Y, Li JK. et al. Immune cells within the tumor microenvironment: Biological functions and roles in cancer immunotherapy. Cancer Lett. 2020;470:126-133
57. Wculek SK, Cueto FJ, Mujal AM. et al. Dendritic cells in cancer immunology and immunotherapy. Nat Rev Immunol. 2020;20(1):7-24
Author contact
![]() Corresponding authors: Chunlin Ou. Department of Pathology, Xiangya Hospital, Central South University, Changsha 410008, Hunan, China. Email: ouchunlinedu.cn; Hui Nie. Department of Pathology, Xiangya Hospital, Central South University, Changsha 410008, Hunan, China. Email: 198112363edu.cn.
Corresponding authors: Chunlin Ou. Department of Pathology, Xiangya Hospital, Central South University, Changsha 410008, Hunan, China. Email: ouchunlinedu.cn; Hui Nie. Department of Pathology, Xiangya Hospital, Central South University, Changsha 410008, Hunan, China. Email: 198112363edu.cn.