Impact Factor ISSN: 1837-9664

 Global reach, higher impact
J Cancer 2024; 15(16):5376-5395. doi:10.7150/jca.98723 This issue Cite
Research Paper
Bioinformatic Analyses and Integrated Machine Learning to Predict prognosis and therapeutic response Based on E3 Ligase-Related Genes in colon cancer
Lunxi Liang1,4, Xiao Liang2, Xueke Yu1 ![]() , Wanting Xiang3
, Wanting Xiang3 ![]()
1. Department of Gastroenterology, The Affiliated Changsha Central Hospital, Hengyang Medical School, University of South China, Changsha, China.
2. School of Clinical Medicine, Changsha Medical University, Changsha, China.
3. Department of Pathology, The Affiliated Changsha Central Hospital, Hengyang Medical School, University of South China, Changsha, China.
4. Department of Gastroenterology, The Third Xiangya Hospital, Central South University, Changsha, China.
Received 2024-5-21; Accepted 2024-8-9; Published 2024-8-19
Abstract

Purpose: Colorectal cancer is the third most common cause of cancer death worldwide. We probed the correlations between E3 ubiquitin ligase (E3)-related genes (ERGs) and colon cancer prognosis and immune responses.
Methods: Gene expression profiles and clinical data of patients with colon cancer were acquired from the TCGA, GTEx, GSE17537 and GSE29621 databases. ERGs were identified by coexpression analysis. WGCNA and differential expression analysis were subsequently conducted. Consensus clustering identified two molecular clusters. Differential analysis of the two clusters and Cox regression were then conducted. A prognostic model was constructed based on 10 machine learning algorithms and 92 algorithm combinations. The CIBERSORT, ssGSEA and TIMER algorithms were used to estimate immune infiltration. The OncoPredict algorithm and The Cancer Immunome Atlas (TCIA) predicted susceptibility to chemotherapeutic and targeted drugs and immunotherapy sensitivity. CCK-8, scratch-wound and RT‒PCR assays were subsequently conducted.
Results: Two ERG-associated clusters were identified. The prognosis and immune function of patients in cluster A were superior to those of patients in cluster B. We constructed a prognostic model with perfect predictive capability and validated it in internal and external colon cancer datasets. We discovered significant discrepancies in immune infiltration and immune checkpoints between different risk groups. The group with high-risk had a reduced half-maximal inhibitory concentration (IC50) for some routine antitumor drugs and reduced susceptibility to immunotherapy. In vitro experiments demonstrated that the ectopic expression of PRELP inhibited the migration and proliferation of CRC cells.
Conclusions: In summary, we identified novel molecular subtypes and developed a prognostic model, which will help a lot in the advancement of better forecasting and therapeutic approaches.
Keywords: Colon cancer, Machine learning algorithm, E3 ubiquitin ligase, Immune response.
Introduction
Colorectal cancer (CRC) is the third most frequent cause of cancer death in both females and males in the United States [1]. With the rapid development of advances in early detection, targeted therapy and surgery in recent decades, progress in the treatment of tumors has accelerated, and there is a decreasing trend in the mortality of patients with colon cancer. However, early symptoms are not common in patients with colon cancer, and the disease is often confirmed at a very late stage, which leads to a low long-term survival rate because of limited treatment options [2]. Consequently, given that colon cancer is a highly heterogeneous tumor [3], there is an urgent need for new strategies to predict the prognosis of colon cancer more credibly and guide individual treatment strategies. Importantly, recent studies indicate that risk models based on multigene expression are a viable option [4-6].
In colon cancer, the regulation of ubiquitination is an indispensable process that influences oncogene and tumor suppressor expression. Ubiquitination of the target protein is considered a three-step enzyme-linked reaction mediated by E1, E2, and E3 ubiquitin ligases. E3s are strongly responsible for substrate specificity [7]. Not surprisingly, the activation of oncogenes and inactivation of oncosuppressors regulated by E3s have been implicated in the development of colon cancer. Proteasome-mediated degradation is important for the ubiquitylation involved in tumor development. For example, morn3 has been shown to accelerate the degradation of p53 by recruiting the E3 ligase MDM2 to promote the proliferation of colon cancer cells [8]. Another famous tumor suppressor gene closely related to E3s is PTEN, which can be directly degraded by the E3 ligase WWP1 in colon adenocarcinoma [9]. However, nonproteolytic ubiquitylation does not involve ubiquitin-dependent proteolysis but rather involves immunological signal transduction, protein-protein interactions, membrane trafficking, and chromatin regulation during carcinogenesis [10, 11]. Wang and collegues [12] found that the ubiquitination of Sestrin2 by the E3 ligase RNF167 could influence its interaction with GATOR2 and further disturb mTORC1 signaling in colon cancer. Therefore, E3-related genes (ERGs) are considered promising targets. Furthermore, E3-based prognostic models have been proposed for bladder cancer [13], glioma [14], and hepatocellular carcinoma [15]. Nonetheless, the value of ERGs in colon cancer classification and prognosis remains unknown.
Cancer progression is strongly influenced by the tumor microenvironment (TME), which facilitates patient prognosis and the identification of potential targets for tumor therapy [16]. Ubiquitination is closely connected with the TME [17]. Recently, T-cell-mediated cytotoxicity, which is most important in killing cancer cells, has been regarded as a possible way to avoid an immune response [18]. PD-1 is a critical immune checkpoint on activated T cells and can promote immunosuppression. Ubiquitin-mediated modulation of the PD-1/PD-L1 pathway by E3s has obvious implications for immune responses in colon cancer [19]. For example, the E3 ligase SPOP has been shown to be disrupted by aldehyde dehydrogenase 2 (ALDH2), thereby preventing the proteasome-dependent degradation of PD-L1, which consequently inhibits T-cell tumor infiltration in CRC [20]. Nonetheless, the relationship between ERGs and the TME in colon cancer is not clear.
In the present study, for the first time, we focused on 240 E3s, conducted a holistic analysis of ERGs, identified ERG-associated molecular subtypes, identified a new prognostic model for colon cancer based on the integration of multiple machine learning algorithms, and elucidated the connections between the risk model and immune response as well as sensitivity to antitumor drugs. Finally, to reveal the role of PRELP, we conducted in vitro experiments and found that PRELP may function as a tumor suppressor in CRC. Our research provides novel perspectives on the underlying mechanisms and E3-associated targets involved in colon cancer and may also provide a foundation for individualized therapy.
Materials and Methods
Data collection
The transcriptomic and clinical information of normal colon samples and tumor samples was obtained from the Genotype-Tissue Expression (GTEx) database (https://www.gtexportal.org/) and The Cancer Genome Atlas (TCGA) database (https://portal.gdc.cancer.gov/). Additionally, we retrieved datasets for colon cancer from the GEO database, including the GSE17537 (n=54) and GSE29621 (n=65) datasets. The FPKM values of the RNA-seq datasets were log2 transformed. Ultimately, data from 430 tumor samples with survival information and 349 normal samples were combined for further study. All the data were extracted and annotated with Strawberry Perl and R software (version 4.4.0).
Screening of E3 ubiquitin ligase (E3)-related genes (ERGs)
We retrieved 240 E3s from previously published literature. A list of those 240 E3s is provided in Table S1. Furthermore, the expression information of 240 E3s was integrated from the public database. On the basis of the expression information in the public database, coexpression analysis was performed using the "limma"package of R (version 4.3.1) in order to identify ERGs. Genes with p<0.001 and |R2| >0.4 were regarded as ERGs, which was refered to the previous literature [21].
Analysis of differentially expressed ERGs between normal and cancerous tissues in the colon
By comparing the transcription profiles of samples in the GTEx and TCGA datasets with the “limma” R package, differentially expressed ERGs were identified (|log2-fold change (FC)| > 1, false discovery rate (FDR) < 0.01). Next, 1,493 ERGs with differential expression were analyzed for enrichment in GO (Gene Ontology) and KEGG (Kyoto Encyclopedia of Genes and Genomes) to investigate their biological functions and pathways (p < 0.05). Bubble, histogram, and circle plots were used for annotation analysis with the R packages “enrichplot”, “GOplot”, and “ggplot2” [22], respectively.
Functional enrichment analysis by gene set enrichment analysis (GSEA)
The c2.cp.kegg.v7.5.1.symbols.gmt subclass was obtained from the Molecular Signatures Database (http://www.gsea-msigdb.org/gsea/downl-oads.jsp) for analyzing important pathways and molecular functions using specific gene expression profiles. To conduct the GSEA, we used the total transcriptome of tumor samples and considered gene sets with P < 0.001 and FDR, q < 0.001 as statistically significant.
Weighted gene coexpression network analysis (WGCNA)
WGCNA [23], a freely accessible R software package, establishes a coexpression network by converting coexpression correlations into connection weights. Based on this background, ERGs were applied to establish a weighted gene coexpression network. The parameter β is a threshold parameter that emphasizes strong relationships and attenuates weak relationships between different genes. The weighted adjacency matrix was transformed into a topological overlap matrix (TOM) for assessing network connectivity, with hierarchical clustering used to create the clustering tree structure of the TOM. The genes were separated into different modules depending on different similarity measures based on the TOM. In this study, we set the mergeCutHeight, minModuleSize and deepSplit as 0.25, 60 and 2, respectively. Finally, we identified 11 coexpression modules. The eigengene dendrogram confirmed that in terms of the correlation coefficient, turquoise had the highest value of 0.93. A total of 788 hub genes in the turquoise module with module membership (MM) > 0.8 and gene significance (GS) > 0.5 were identified.
Identification of ERG‑associated subtypes
409 potential ERGs were discovered by combining differentially expressed ERGs with hub genes from the turquoise module of WGCNA. Then, a Venn plot was used to display the intersection genes. Consensus clustering was applied to identify distinct E3-associated classifications by the k-means algorithm based on the 409 ERGs by using the “ConsensusClusterPlus” R package [24]. The Kaplan-Meier method was used to evaluate overall survival (OS) between the two clusters. Furthermore, immune genes, immune cells and immune functions were compared. Finally, a total of 800 DEGs (|logFC|>1, p<0.05) between the two ERG‑associated clusters were identified using the R package “limma” [25].
Risk model constructed based on integrated machine learning approaches
A high-accuracy risk model was constructed using ten machine learning algorithms and 92 algorithm combinations. The 10 algorithms used for integration included Lasso, Ridge, random survival forest (RSF), stepwise Cox, generalized boosted regression modeling (GBM), CoxBoost, supervised principal component (SuperPC), survival support vector machine (survival-SVM), elastic network (Enet), and partial least squares regression for Cox (plsRcox). The specific steps are described by Liu [26].
Validation of the risk model
Randomly, patients were segmented into training and testing datasets at a 1:1 ratio by employing the “caret” R package. Using the "survminer" package, an optimal cutoff point was calculated. Then, the training and validation datasets were segmented into high- and low-risk patients. The risk model's ability to predict was shown through survival analysis, risk plots, and receiver operating characteristic (ROC) curves in the TCGA training dataset. R package “timeROC” was used to predict overall survival. Furthermore, the prognostic model was validated in a validation dataset (TCGA testing dataset, TCGA entire dataset, GSE17537 and GSE29621). Afterward, different risk subcategories and clinical characteristics, such as age, gender, TNM stage, tumor size, metastasis status, and lymph node involvement, were examined within the entire TCGA database. In addition, we employed univariate and multivariate Cox regressions to confirm these autonomous prognostic indicators. Finally, a prognostic nomogram was developed, followed by the utilization of the “rms” R package to create a calibration plot using the coefficients.
Comparison of immune infiltration and immune characteristics among different risk subgroups
We applied different algorithms, including ESTIMATE, CIBERSORT and single-sample gene set enrichment analysis (ssGSEA), to evaluate immune cell abundance and immune function in different risk groups of patients with colon cancer. The R package “ESTIMATE” [27] was applied to estimate the three immunoscores between different risk groups: the stromal, immune, and ESTIMATE scores. Moreover, we used the CIBERSORT [28] method with the expression profiles of patients with colon cancer to evaluate the infiltration of 22 types of immune cells in the high- and low-risk subclasses. Furthermore, ssGSEA [29] was applied to explore the enrichment of immune functions, and the correlations between these functions and risk scores were subsequently determined by Pearson correlation analysis Which was finished by using “GSVA” package of R software [30]. Additionally, we explored the connections between immune checkpoints and different risk groups as well as the 12 risk genes.
Comparison of immune checkpoints and sensitivity to routine chemotherapy drugs in the two risk subgroups
Initially, we predicted the effectiveness of immunotherapy by applying the Tumor Immune Dysfunction and Exclusion (TIDE) algorithm [31]. Drug resistance is an obstacle to cancer treatment. Thus, to explore the sensitivity of routine chemotherapy drugs in the two subgroups, we computed and compared the half maximal inhibitory concentration (IC50) values of different antitumor drugs by employing the Wilcoxon signed-rank test with the R packages “ggplot2” and “oncoPredict” [32].
Mutation characteristics of the two risk subgroups
To elucidate the correlations between gene mutations and the two risk subgroups, we downloaded mutation information associated with colon cancer from the TCGA database. Then, the somatic variants in the two risk subgroups were comprehensively explored using the “Maftools” R package [33].
Cell culture, plasmid transfection and antibodies
RPMI 1640 medium containing 10% fetal bovine serum was used to culture the Hct-116 and Lovo colorectal cell lines at 37 °C in a humidified environment with 5% CO2. The PRELP-FLAG gene was produced by GENECHEM (Shanghai, China) and transferred to colorectal cells by Lipofectamine 3000 (Thermo Fisher Scientific, #L3000150). Standard procedures were followed to maintain stable infection. FLAG-tag antibodies (Cell Signaling Technology, #8146) were used to detection the expresson of PRELP in this study.
Quantitative real-time PCR (qRT‒PCR)
The mRNAs were isolated using TRIzol Up (TransGen Biotech, #ET111-01-V2) and reverse-transcribed into single-strand cDNA using a reverse transcription kit (TransGen Biotech, #AT341-01). For RT‒PCR, PerfectStart® Green qPCR SuperMix (TransGen Biotech, #AQ601-01-V2) and PCR primers (PRELP: forward, 5'-GAACCAGCAGAGCCAACAGACC-3', and reverse, 5'-CAGGTTGCGGCTATCACAGTAGAG-3') were used in a LightCycler®96 Real-Time PCR machine (Roche). The instructions provided with the reagents were used to perform the test.
Western blotting
Proteins were lysed using RIPA lysis buffer (Beyotime Biotechnology, #P0013B). Protein levels were quantified using the BCA protein assay kit (Thermo Fisher Scientific, #23225). After boiled with 5× protein loading buffer and separated using 10% SDS-PAGE, the denatured protein was then transferred onto a PVDF membrane. 5% skimmed milk was used to block non-specific binding sites for 1.5 h at room temperature. We put the protein bands into box and make it react with the primary antibody overnight at 4 °C. Following three washes with TBST for 10 min, the protein bands was exposed to second HRP-conjugated antibodies for 1 h at room temperature. The membrane was subjected to blotting using a chemiluminescence system (BIO-RAD, USA).
Cell Counting Kit-8 (CCK8) and scratch-wound assays
A CCK8 assay (Beyotime Biotechnology, #C0037) was conducted to determine cell viability. Briefly, 100 µl of culture medium containing 3.0×10^3 cells was added to 96-well plates to determine cell viability. Then, 10 µl of CCK8 solution was added to each well at the indicated time points, and the absorbance at 450 nm was measured. For the scratch-wound assays, 1×10^6 colorectal cancer cells were inoculated in 6-well plates containing culture medium. A 200 µl pipette tip was used to create scratches after the cells reached 90% confluency. The cells were washed and then cultivated in serum-free RPMI 1640 medium, after which the medium was discarded. After wounding, the cells were photographed 0 and 48 hours later. We calculated the wound closure area as follows: migration area (%) = (M0 - Mn)/M0×100. In this case, A0 is the initial wound area, and An is the remaining wound area at the metering point.
Statistical analysis
We used R version 4.4.0 to analyze the clinical and expression profile information. Survival analysis was implemented using Kaplan-Meier curves and the Wilcoxon log-rank test. Two independent samples were compared using either the Mann-Whitney U test or t test. Categorical data were analyzed with Fisher's exact probability method or the χ2 test. A P value less than 0.05 was deemed statistically significant, with ns representing not significant, * representing P less than 0.05, ** representing P less than 0.01, and *** representing P less than 0.001.
Results
Identification of ERGs
An overview of this research can be found in Figure S1. Initially, 240 E3s were identified from previous literature (Table S1). After acquiring the data from the TCGA-COAD and GTEx datasets, we integrated the expression information of 240 E3s. To identify ERGs, we used coexpression analysis. Then, based on these E3s, we applied Spearman correlation analysis to identify ERGs in colon cancer samples. Finally, a total of 6,268 ERGs were selected (|R2|>0.4 and p < 0.001).
ERGs that were expressed differently in colon cancer and normal tissues
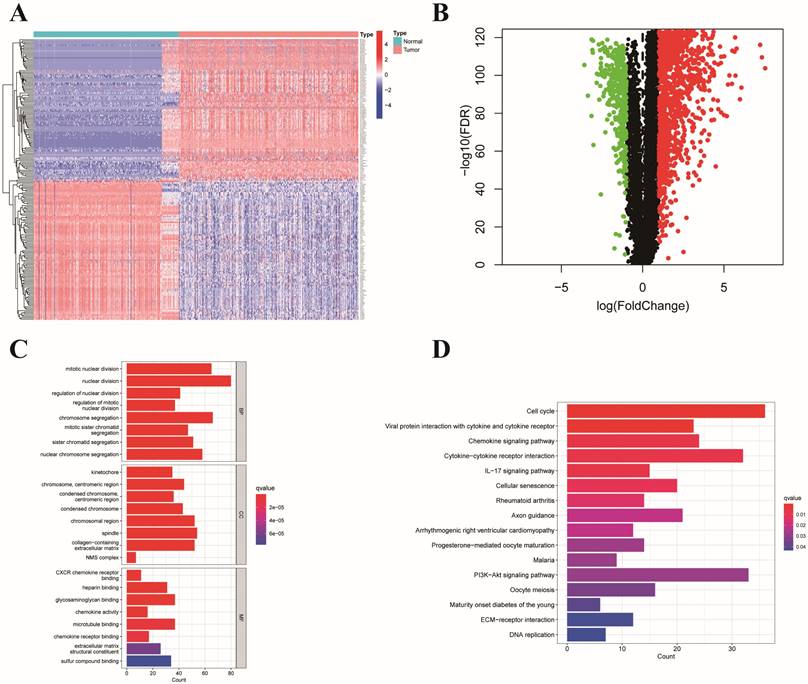
We identified 1,493 differentially expressed ERGs in colon cancer samples compared to normal samples from the TCGA and GTEx datasets. Among these genes, 1,117 were upregulated, and 376 were downregulated. A heatmap depicting 50 genes, including upregulated and downregulated genes, is shown in Figure 1A. In addition, a volcano plot of the differentially expressed ERGs is presented in Figure 1B. GO analysis revealed that the differentially expressed genes were related to mitotic nuclear division, nuclear division, and chromosome segregation in the biological process (BP) category. Regarding the molecular function (MF) category, differentially expressed genes were associated with CXCR chemokine receptor binding, microtubule binding, and glycosaminoglycan binding. Moreover, they were principally enriched in collagen-containing extracellular matrix, chromosomal region, and spindle in the cellular component (CC) category (Figure 1C). According to the KEGG analysis, genes related to cytokine-cytokine receptor interactions, the cell cycle, and the IL-17 signaling pathway were enriched (Figure 1D).
Presentation and functional annotation of differentially expressed ERGs. (A) Heatmap showing fifty differentially expressed ERGs, with red dots indicating significantly upregulated genes and blue dots indicating significantly downregulated genes; (B) Volcano map of differentially expressed ERGs between colon tissues and normal tissues; Histogram depiction (C) in the aspects of the BP, CC, MF categories; Histogram depiction (D) of the top 16 enriched pathways.
Identification of hub genes and critical modules with WGCNA
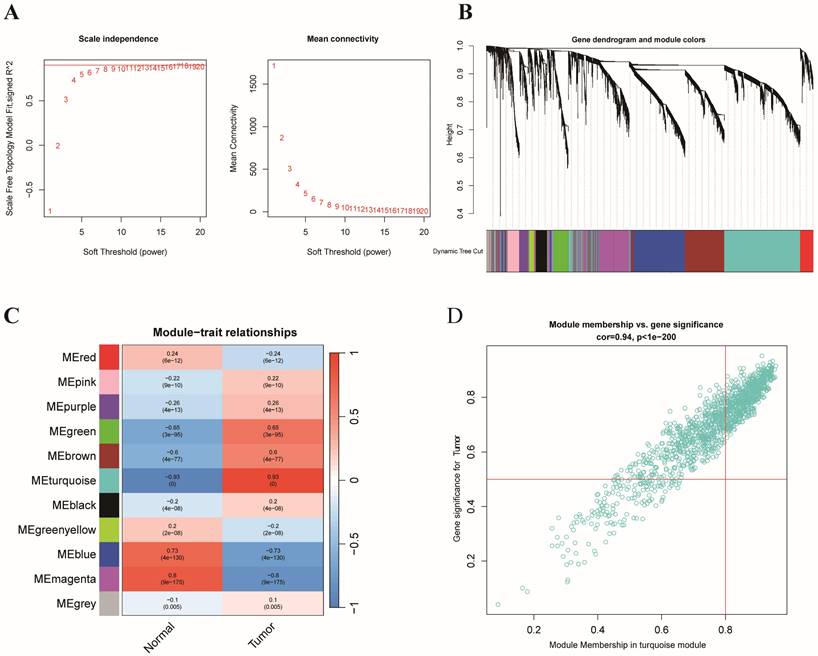
On the basis of the expression matrix of 6,268 ERGs, we established a weighted gene coexpression network. Samples from the TCGA and GTEx datasets were separated into tumor samples (430 samples) and normal samples (349 samples). In Figure 2A, the horizontal axis represents the threshold, and the vertical axis represents the evaluation parameters of the scale-free networks. As the network's evaluation parameters increase, they become more consistent with the characteristics of a scale-free network. The horizontal line in the graph indicates a threshold value of 0.90. To create a scale-free network (Figure 2A), we established a soft threshold power β of 8 based on the connection between the soft threshold and mean connectivity. The ERGs with analogous expression types converged into the same modules with a cutting height difference of less than 0.25, which ultimately produced 11 coexpression modules (Figure 2B). The results revealed that 788 genes in the turquoise module (cor=0.93, p=0.000) were strongly associated with colon cancer (Figure 2C-D). In brief, the findings illustrated that the turquoise module was closely associated with colon cancer. Therefore, 788 hub genes of the turquoise module were subjected to further investigation.
WGCNA of ERGs and identification of E3-related hub genes. (A) Analysis of the scale-free index and mean connectivity for the confirmation of soft-thresholding powers; (B) Hierarchical clustering dendrogram of ERGs in a variety of modules; (C) Correlation analysis between different tissues and the module eigengenes; (D) Scatter plots of GS score and MM for ERGs in the turquoise module.
Identification of prognostic clusters based on ERGs in patients with colon cancer
By identifying the overlapping genes among the hub genes of the turquoise module with WGCNA and the differentially expressed ERGs, we identified 409 overlapping genes (Figure 3A). Among the 409 overlapping ERGs evaluated, we identified distinct prognostic subtypes by using consensus clustering, which revealed that the best number of clusters was two. Specifically, the delta area of the cumulative distribution function (CDF) showed that two was the most suitable number of clusters (Figure 3B-D). In addition, clusters A and B were distinct according to a principal component analysis (PCA) plot (Figure 3E). Based on the findings from Kaplan-Meier survival analysis (Figure 3F), samples in cluster B had a worse prognosis than those in cluster A. According to GSVA, cluster A was enriched in pathways associated with DNA repair (base excision repair, nucleotide excision repair) and the cell cycle, while cluster B was related to ECM-receptor interaction, basal cell carcinoma, and focal adhesion (Figure 3G).
Consensus clustering. (A) Venn diagram analysis showing the overlapping ERGs of the differentially expressed ERGs and hub genes from WGCNA; (B) The relative change in the area under the CDF curve from k = 2 to 9;(C) Empirical CDF plots from 2 to 9; (D) Consensus matrix heatmap for K = 2; (E) PCA analysis based on the two clusters; (F) Kaplan-Meier curves of OS in the two clusters in colon cancer; (G) GSVA representing the different biological pathways between the two clusters;(H) Correlation between two clusters and the tumor microenvironment;(I)Comparison of immune-related cells between cluster A and B;(J) Comparison of immune checkpoints between cluster A and B;(K) Comparison of immune functions between cluster A and B.
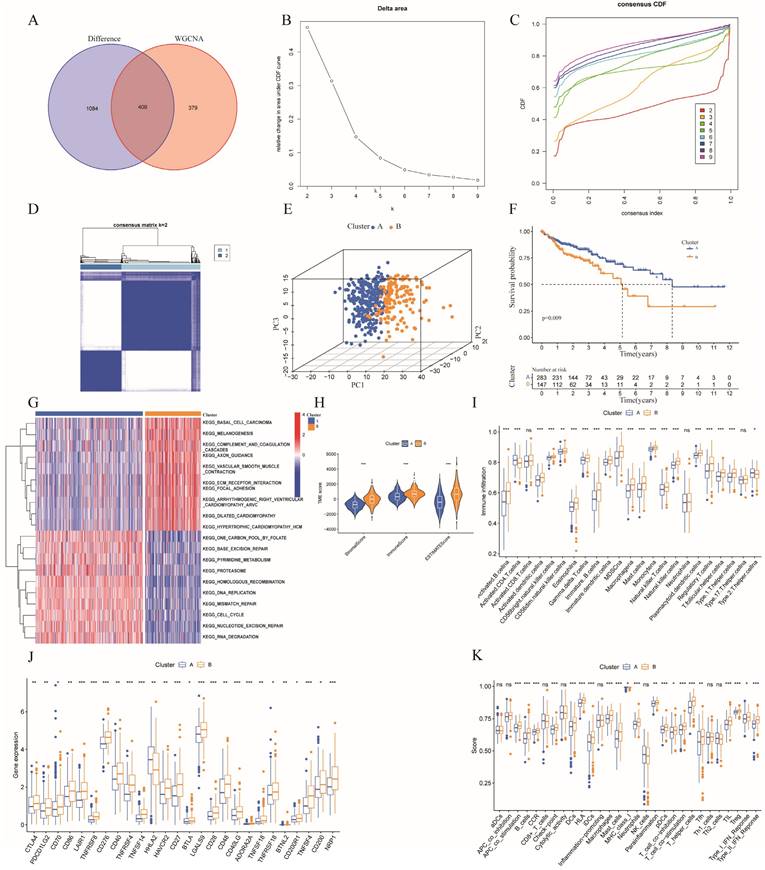
To further understand the correlation between the two clusters and immunity, the "ESTIMATE" package was used to evaluate the TME scores (immune score, stromal score, and ESTIMATE score) of the two clusters. Regarding the TME score, higher immune scores or stromal scores indicate greater relative abundances of immunocytes or stromal cells in the TME, and the ESTIMATE score represents the aggregation of immune scores and stromal cells in the TME. The results revealed higher TME scores in patients in cluster B (Figure 3H). In addition, the numbers of immune cells in these two clusters are compared in Figure 3I, which illustrates a significant discrepancy in the immune response between the two clusters. Moreover, comparisons of immune scores revealed that patients in cluster B possessed stronger immune functions than patients in cluster A, while the tumor purity was greater than that of patients in cluster A (Figure 3K). Furthermore, we compared the expression levels of immune checkpoints in the two clusters and demonstrated that most checkpoints, such as CTAL4, were more strongly expressed in cluster B (Figure 3J). Additionally, combining with the results of GSVA, cluster B had significantly more pathways promoting tumor development than did cluster A. Collectively, the findings provide a basis for supporting the greater degree of malignancy of cluster B. Immune infiltration analysis revealed that cluster B had higher immune scores than did cluster A, which may be partially explained by intra- and intertumor heterogeneity and the presence of many exhausted immune cells in the TME [34].
Construction of an ERGs signature associated with prognosis
To further study the potential mechanisms of these two tumor clusters, we obtained 800 DEGs between clusters A and B. Moreover, we screened 62 genes connected with OS in patients with colon cancer by univariate Cox regression analysis (Table S2). Then, we randomly divided the colon cancer samples into training and testing datasets at a 1:1 ratio. Afterward, a prognostic model was constructed based on 10 machine learning algorithms and 92 algorithm combinations.
In the TCGA training dataset, 92 kinds of forecasting models were fitted through the LOOCV framework. Additionally, C-indexes were calculated for each model, including the TCGA testing dataset and the GSE17537 and GSE29621 datasets (Table S3). Ultimately, the two best risk models for all the validation datasets with the highest average C-index (0.656) were identified (Figure 4A). The first one was a combination of stepwise Cox (direction = both) and Ridge consisting of 24 genes, while the other was a combination of Cox (direction = both) and Enet (alpha=0.1) consisting of 12 genes (Table S3). Notably, the 12 genes comprising the latter model were included in former model. Therefore, we chose the latter model constructed by the combination of Cox (direction = both) and Enet (alpha=0.1) for further study. The 12 genes in the optimal risk model were DEPDC1, CDC25C, PRELP, CDCA2, HEYL, GPX3, TIMP1, SERPINE1, FSTL3, ELFN1-AS1, CXCL2, and C2CD4A.
A prognostic model was constructed and validated based on 10 machine learning algorithms and 92 algorithm combinations. (A) A total of 92 kinds of prognostic models though LOOCV framework and the C-index of each model in all validation datasets; (B) Differential expression of the 12 risk genes between high- and low- risk subgroup; (C,E,G,I,K)Kaplan-Meier survival curves revealed that patients in the high-risk group had a worse prognosis compared with those in low-risk group in the training and validation dataset. (D,F,H,J,L) ROC curves validated the prognostic capability of the risk model based on risk genes in the training and validation dataset.
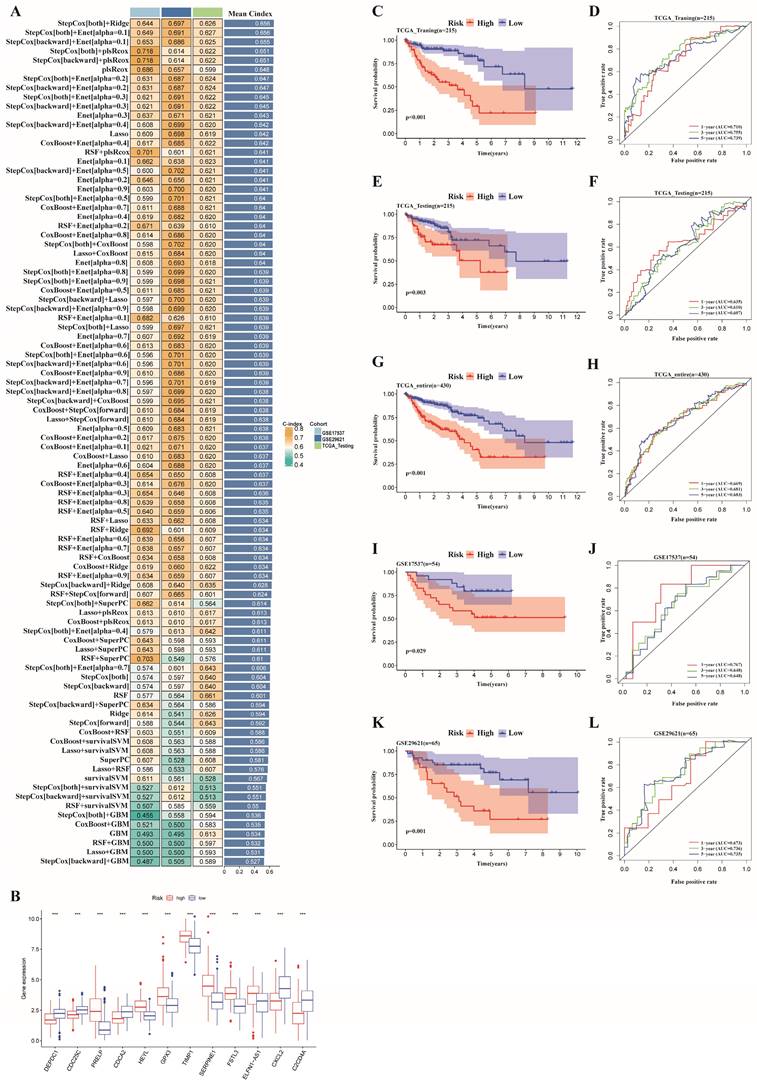
The expression levels of the 12 risk genes above significantly differed between the two risk groups (Figure 4B). Furthermore, we applied the risk scores of the optimal model obtained from machine learning algorithms to classify all the individuals as high- or low-risk on the basis of optimal cutoff point value of training dataset. Furthermore, patients in the low-risk subgroup had obviously better overall survival (OS) in the TCGA training dataset (p < 0.001) (Figure 4C). Additionally, an ROC curve was created to confirm the precision of the training data, showing AUC values of 0.710, 0.755, and 0.739 for 1-, 3-, and 5-year OS, respectively (Figure 4D). The expression of the risk genes in different risk subgroups of patients with colon cancer, as well as the increased risk scores accompanied by increasing patient mortality, are revealed in the heatmap in Figure S2A-B.
Evaluation of the ERGs-related risk model
On the basis of the optimal cutoff point of the risk score, the patients in the validation dataset were divided into low- and high-risk subgroups. We further explored the TCGA testing dataset and the entire dataset as well as two GEO datasets (GSE17537 and GSE29621) as validation datasets to verify the reliability and accuracy of prognosis prediction. The validation set showed that patients in the low-risk group had a higher OS rate compared to patients in the high-risk group according to Kaplan-Meier survival analysis (Figure 4E, 4G, 4I, 4K). The AUCs for 1-, 3-, and 5-year OS in the TCGA testing dataset, the entire TCGA dataset, GSE17537, and GSE29621 were 0.635, 0.610, and 0.607; 0.669, 0.681, and 0.683; 0.768, 0.648, and 0.648; and 0.673, 0.736, and 0.735, respectively (Figure 4F, 4H, 4J, 4L). In addition, the risk score, risk plot, and risk gene expression in the validation dataset (Figure S2C-J) corresponded to those in the training dataset.
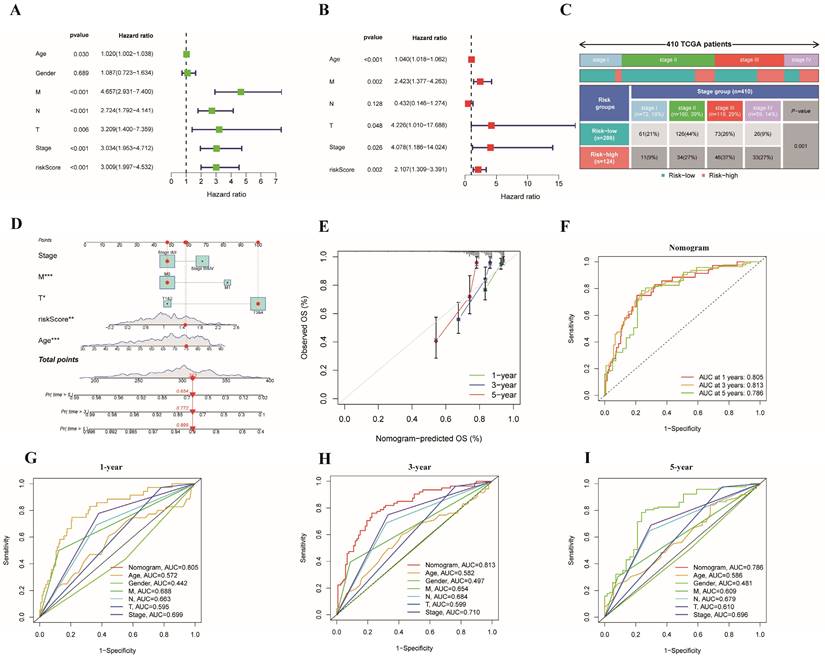
As the prognostic risk model was verified well in the validation set, we used the whole TCGA dataset for further study. In addition, we considered clinical characteristics (such as age, sex, tumor stage, T stage, M stage, and N stage) to identify whether the risk model could be applied as the best predictive factor for OS. Then, univariate and multivariate Cox regression analyses were conducted to determine whether the ERG-related risk score could be considered an independent predictor. Univariate Cox analysis revealed that age (p=0.030), tumor stage (p< 0.001), T stage (p= 0.006), M stage (p< 0.001), N stage (p< 0.001) and risk score (p < 0.001) were associated with prognosis (Figure 5A), while multivariate Cox regression analysis revealed that age (p< 0.001), tumor stage (p < 0.05), T stage (p= 0.048), M stage (p=0.026) and risk score (p < 0.001) may be independent prognostic markers for colon cancer (Figure 5B). In addition, stage II was the main constitution in the low-risk group, whereas stage III accounted for a large proportion of the high-risk group (Figure 5C). Tumor stage exhibited notably discrepancy between the two risk subgroups. Finally, considering the clinical features and gene expression, we integrated the risk model based on 12 risk genes, age, T stage, M stage and tumor stage into a prognostic nomogram, which could be applied to forecast the OS of patients with colon cancer in terms of 1-, 3-, and 5-year OS (Figure 5D). Moreover, a calibration plot for 1-, 3- and 5-year OS probabilities revealed reasonable consistency between the nomogram predictions and the actual observations (Figure 5E). In addition, we explored the AUC values for 1-, 3-, and 5-year prognosis in the entire cohort and found that the prognostic nomogram model had the optimum AUC values among those factors (Figure 5F-I).
Cox regression analyses of OS and the establishment of a nomogram model. (A) Forest plot of univariate regression analyses; (B) Forest plot of multivariate Cox regression to identify the independent prognostic factors; (C) Distribution of tumor stage in the high- and low-risk groups in the TCGA cohort (p=0.001);(D) A nomogram model integrating the risk score and clinical features for the prediction of OS in colon cancer patients in the whole TCGA dataset; (E) Calibration plots of 1-, 3- and 5-year OS probabilities of the nomogram model; (F-I) AUC curves of 1-, 3-, and 5-year OS verified the potential prediction value of the prognostic indicators.
Clinical correlation and stratified analyses of different risk groups
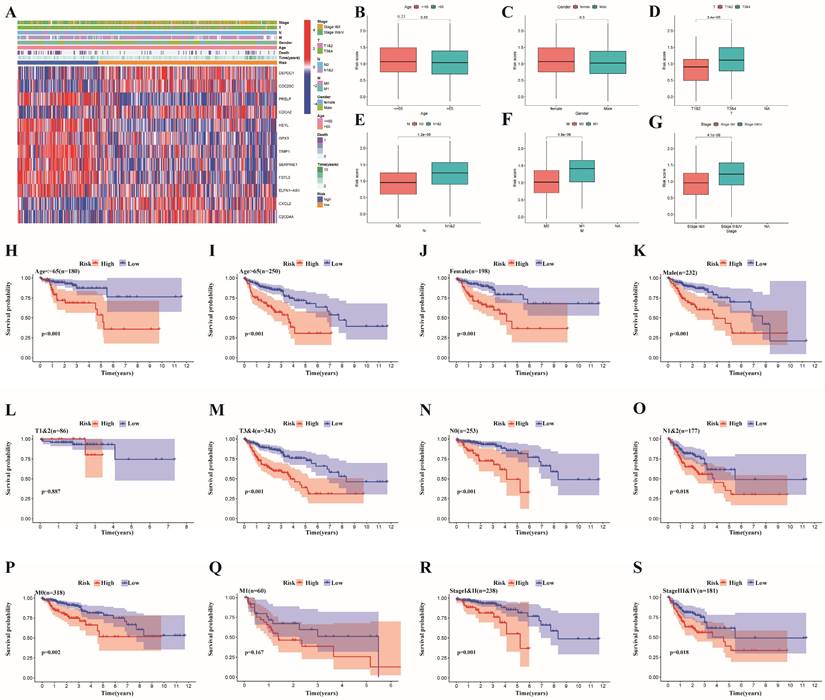
We divided some clinical features into 2 subgroups, and the correlations between clinical features and risk subgroups, as well as risk genes, are shown in the heatmap in Figure 6A. Specifically, we found that age, TNM stage, T stage, N stage and M stage were obviously different between the two risk groups (Figure 6B-G, Table S4). Furthermore, a stratified analysis of the two subgroups was performed. The risk score could be used to markedly stratify colon cancer patients into low- and high-risk groups on the basis of different clinical characteristics (such as age >65 years, age ≤65 years, male and female sex, stages I&II, stages III&IV, T3&4, N0, N1&2 and M0), illustrating the model's excellent predictive ability based on a variety of clinical features (Figure 6H-K, 6M-P, 6R-S). According to the findings from the K-M analysis, the risk model had obviously different risk stratification properties in patients with colon cancer, suggesting that patients with low-risk colon cancer had an obviously better prognosis. However, this conclusion was not reached for the T1-2 (Figure 6L) or M1 (Figure 6Q) subgroups.
Clinical correlation analysis and stratified analysis of the high- and low-risk subgroups. (A) A heatmap of the correlations between clinical features and risk subgroups, as well as risk genes;(B-G) A strip chart revealed the difference of clinicopathological features between different risk subgroups(***p < 0.001; **p < 0.01;*p < 0.05); Kaplan-Meier curves showing the prognostic value of different risk subgroups for the patients separated by each clinicopathological feature. (H,I) Age; (J,K) Gender; (L,M) T Stage; (N,O) N stage; (P,Q) M stage; and (R,S) stage.
Discrepancies in immune infiltration, levels of immune checkpoints and somatic mutation characteristics between the two risk subgroups
The whole TCGA dataset was used to determine the associations between the prognostic risk model and immune cell abundance, immune checkpoint molecule levels, and therapeutic effects. The advancement of colon cancer is impacted by immune cells infiltrating the tumor microenvironment. Initially, we found that there was a close relationship between risk score and immune cell abundance based on different software programs (Figure 7A). In addition, the proportions of immune cells in the two risk groups are shown in Figure 7B, which illustrates a significant discrepancy in the immune response between the two risk subgroups. Additionally, we evaluated the TME scores of the two risk subgroups. The TME scores of patients were greater in the high-risk group than in the low-risk group (Figure 7C). In the high-risk subgroup, we revealed that M0 and M2 macrophages were more common, while in the low-risk subgroup, plasma cells, eosinophils and CD4 memory resting T cells were more abundant (Figure 7E). Furthermore, we investigated the correlation between the risk score and the infiltration of 6 types of immune cells and demonstrated that the risk score had the strongest correlation with macrophages (p<0.001, cor>0.4) (Figure 7F-K). The M1 and M2 subgroups are derived from M0 macrophages. It has been widely reported that M2 macrophages can facilitate tumor development [35]. Previous study has demonstrated that the invasion of resting CD4+ memory T cells could be used to predict good prognosis [36]. Additionally, comparisons of immune scores revealed that high-risk patients possessed stronger immune functions than low-risk patients did (Figure 7D). Given the indispensable role of immune checkpoint blockade (ICB) in colon cancer therapy, we explored the discrepancy in the expression profiles of immune checkpoints between the two risk groups. Furthermore, the correlations between immune checkpoints and risk scores as well as risk genes are shown in Figure 7L.
Relationships between the risk signature and immune infiltration, immune checkpoint genes and somatic mutation features. (A) Correlation between risk scores and immune cell abundance based on different software programs;(B) The proportion of 22 immune cells between the high- and low-risk subgroups;(C) The discrepancy of tumor microenvironment between high- and low-risk subgroups; (D) Comparison of immune functions between the different risk groups; (E) Comparison of immune cell between the different risk groups;(F-K) Pearson correlation analysis between the risk score and infiltration of six types of immune cells; (L) Correlations between immune checkpoints and risk scores as well as risk genes; (M,N) Waterfall plot of somatic mutation characteristics in the high- and low-risk subgroups; (O,P) The relationships between the TMB and risk signatures; (Q) Correlation analysis between risk scores and the mutated gene(TP53). ***p < 0.001; **p < 0.01; *p < 0.05.
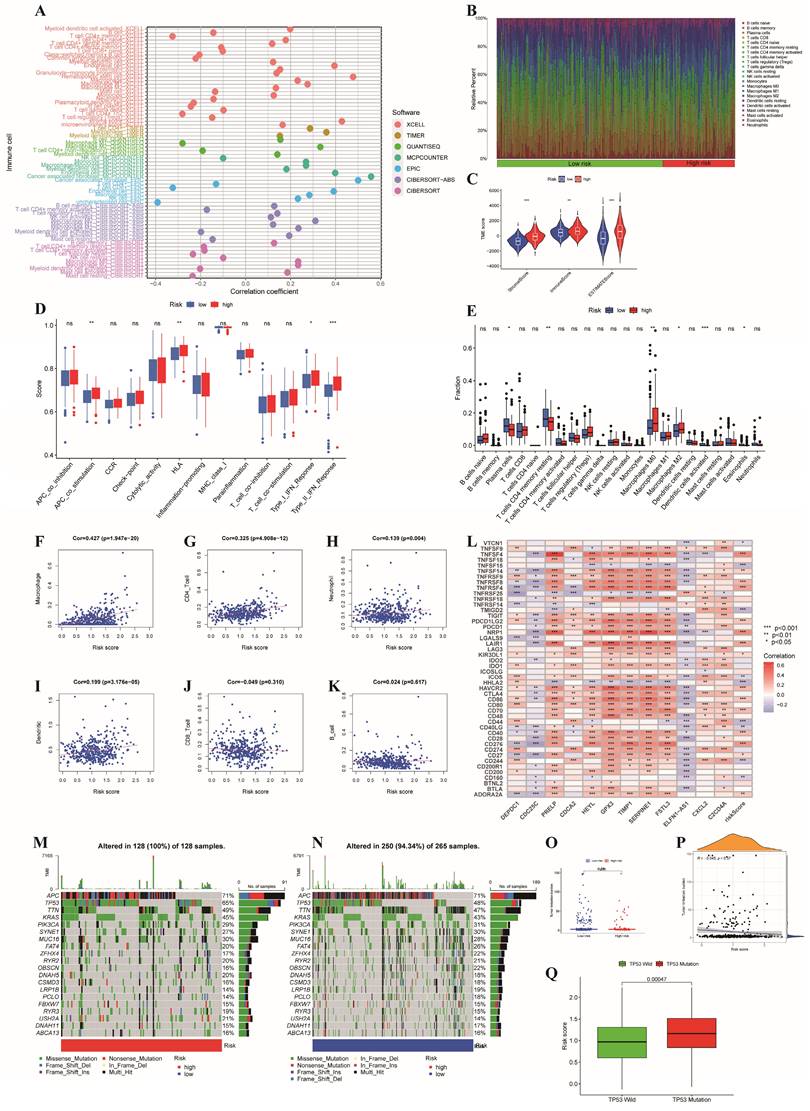
Finally, we delved into the connections between gene mutations and different risk categories in order to gain a deeper understanding of the fundamental biological factors. First, we found that the proportion of mutations in the high-risk subgroup was greater than that in the low-risk subgroup. Moreover, we confirmed the top 20 mutated genes in different risk subgroups (Figure 7M-N). The mutation rates of APC, TP53, TTN, KRAS, PIK3CA, SYNE1, MUC16, FAT4 and RAY2 in different risk subgroups were greater than 20%. In addition, compared to patients with TP53 mutations, patients who carried wild-type TP53 had markedly lower risk scores (p<0.001, Figure 7Q), which could partly explain the high malignancy of patients in the high-risk group. Moreover, the tumor mutational burden (TMB) did not differ significantly between the two risk subgroups (Figure 7O), and the correlations between the two subgroups and the TMB were not significant (Figure 7P).
Discrepancies in drug sensitivity, GSEA and GSVA between the two risk subgroups
For patients with unresectable CRC, the primary treatment is systemic therapy, including cytotoxic chemotherapy, targeted therapy, immunotherapy, biologic therapy, and their combinations, which may improve patient prognosis [37]. First, we explored the associations between the risk subgroups and the effectiveness of chemotherapy and targeted therapies in patients with colon cancer based on the GDSC database with a total of 198 drugs using the OncoPredict algorithm. As shown in Figure 8A-N, we found that the low-risk subgroup had lower IC50 values for chemotherapy drugs (5-fluorouracil, docetaxel, cyclophosphamide, oxaliplatin, vinblastine and cytarabine) and targeted drugs (osimertinib, sapitinib, erlotinib, gefitinib, sorafenib, dabrafenib, tamoxifen and fulvestrant) (all p<0.001), which indicated that the sensitivities to commonly used therapeutic agents obviously differed between the two risk groups. Conversely, dabrafenib was more appropriate for the high-risk subgroup because of its lower IC50 value (p < 0.001, Figure 8O). Furthermore, to evaluate the status of immune escape in patients with colon cancer, we calculated the TIDE score to forecast the clinical efficacy of immunotherapy. Higher TIDE scores represent a greater potential for immune escape, illustrating that patients are unlikely to benefit from ICB [31]. The high-risk subgroup had higher TIDE scores (Figure 8P). We further used TCIA to predict susceptibility to immunotherapy and revealed that the immunophenoscore (IPS) was significantly lower in the high-risk group compared to the low-risk group (all p<0.05, Figure 8Q-T). This finding illustrated that patients with high-risk characteristics may experience reduced effectiveness from immunotherapy.
Comparison of the two risk groups in routine drug sensitivity, molecular typing of immune escape and pathways. (A-O) Correlations between the two risk subgroups and sensitivity to routine antitumor drugs. (P)The high-risk group had higher TIDE scores than the low-risk group; (Q-T) Comparison of immunophenoscore (IPS) between different risk subgroups; (U,V,W) GSEA and GSVA representing the different biological pathways between the high- and low-risk subgroups. P values are presented as follows: ***p < 0.001; **p < 0.01; *p < 0.05; ns: not significant;
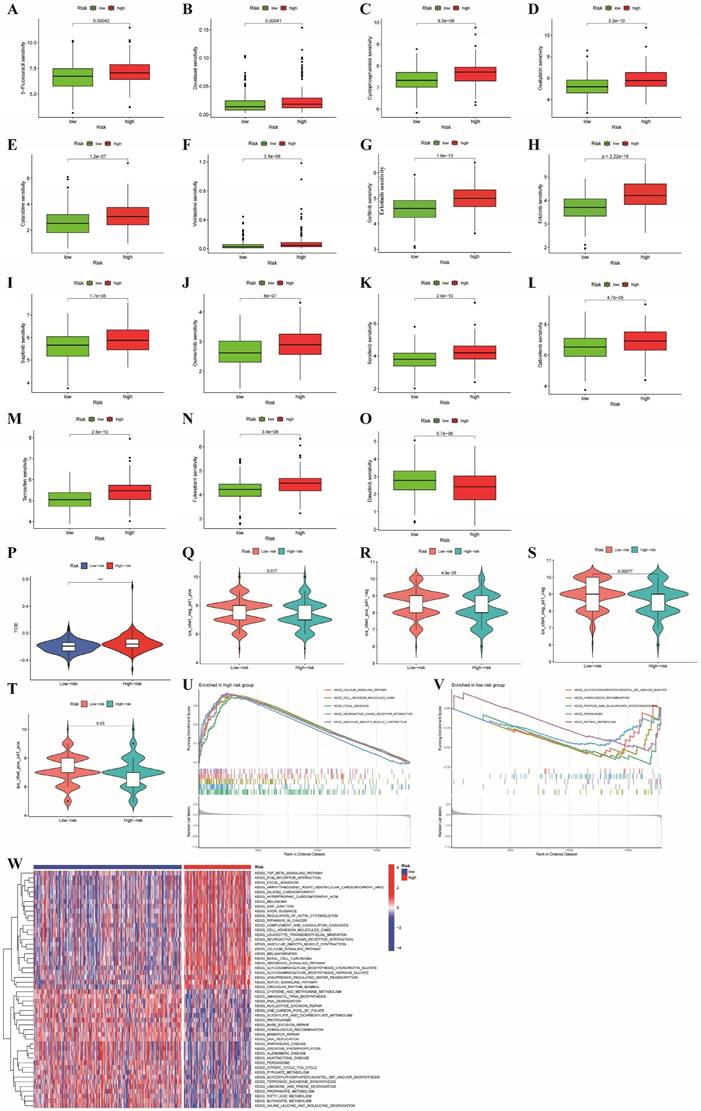
GSEA and GSVA were applied to analyze the pathways enriched in different risk subgroups to discover molecular discrepancies. The GSEA results suggested that the genes in high-risk group were primarily involved in the calcium signaling pathway, cell adhesion molecules (CAMs), focal adhesion, neuroactive ligand receptor interaction, and vascular smooth muscle contraction (Figure 8U).
In the low-risk group, glycosylphosphatidylinositol (GPI) anchor biosynthesis, homologous recombination, pentose and glucuronate interconversions, and peroxisome and retinol metabolism were enriched (Figure 8V). Moreover, we applied GSVA to explore the discrepancies involved in KEGG pathway enrichment between the two subgroups, and the results are revealed in Figure 8W. These findings illustrate that tumor-associated signaling pathways may contribute to the distinct TMEs and drug sensitivities of different risk subgroups.
PRELP inhibits the proliferation and migration of CRC cells
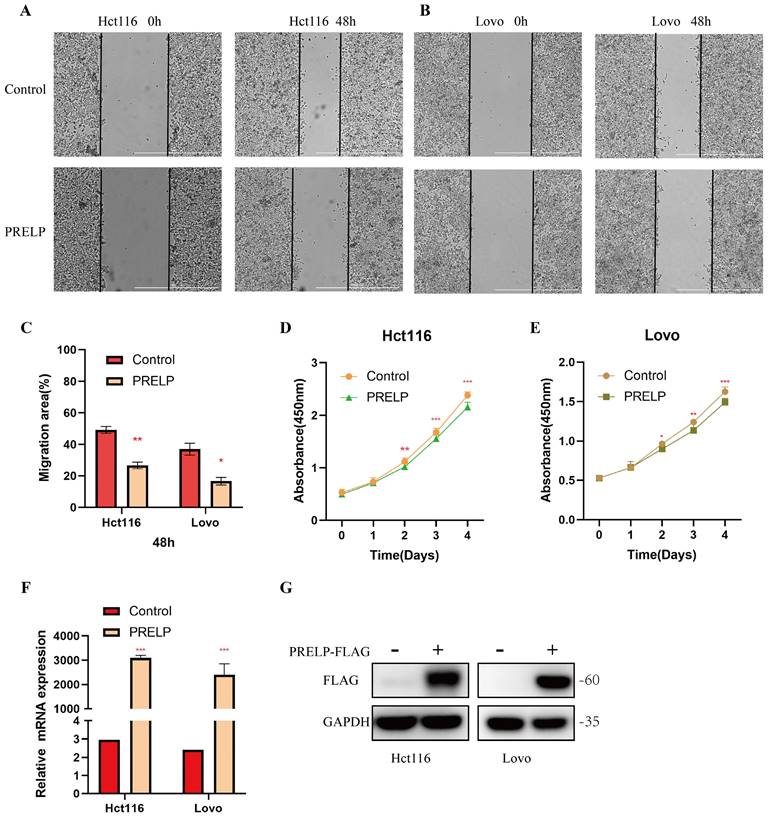
It has been shown that all of these risk genes, except PRELP, are related to colorectal cancer. Although PRELP has been found to be a tumor suppressor in hepatic cancer [38], bladder cancer [39] and retinoblastoma [40], its role in colorectal cancer is unclear. To further clarify its role in CRC, we conducted in vitro experiments. A scratch-wound healing assay was used to determine the effect of PRELP on the migration of CRC cells. PRELP significantly reduced the motility of Hct116 and Lovo cells and prevented cell migration (Figure 9A-C). CCK-8 analysis was performed on Hct116 and Lovo cells, and the results indicated that overexpression of PRELP resulted in a significant decrease in proliferation (Figure 9D-E). Besides, we conducted qRT-PCR and WB analysis to detection the expression of PRELP after exogenous transfection (Figure 9F-G). Above all, in vitro experiments uncovered that PRELP is a potential predictor of CRC.
PRELP inhibit the migration and proliferation of Hct116 and Lovo cells. (A,B) PRELP inhibited the migration of Hct116 and Lovo cells based on scratch wound analysis. Scale bar: 1000μm. (C) Migration rate quantitative analysis in (A,B). (D,E) CCK-8 assay revealed that PRELP inhibited the proliferation of Hct116 and Lovo cells. (F,G) Detection of the expression of PRELP after exogenous transfection by qRT-PCR and WB analysis. *P < 0.05, **P < 0.01, ***P < 0.001 compared with the control group.
Discussion
Due to tumor heterogeneity, chemotherapy, targeted therapy and immunotherapy are currently ineffective for some patients with colon cancer [41]. In this respect, new classifications and prognostic risk models for colon cancer are particularly needed to help promote individualized medicine. In the present study, we first identified ERGs and explored two molecular subtypes based on the screened ERGs that were markedly different in terms of prognosis and immune infiltration. Then, a prognostic risk model based on the DEGs between these two subtypes was identified by using 92 machine learning algorithm combinations. This model was further found to be a potential independent prognostic indicator with favorable predictive properties. Moreover, marked differences in immune infiltration and immune checkpoints between the two clusters and risk groups were detected. Furthermore, the relationship between the prognostic model with 12 risk genes and drug sensitivity was investigated, which may aid in the development of precise therapies for colon cancer.
It is predicted that genetic biomarkers and related diseases could be better understood with the advancement of interaction prediction research in various fields of computational biology. A recent report revealed that a new deep learning algorithm named GCNAT (graph convolutional network with graph attention network) could predict metabolites associated with disease and their potential associations [42]. Additionally, novel deep learning predictive models, such as DMFGAM [43], were developed for predicting cardiotoxicity associated with hERG channel blockers. It has become equally important to study gene/protein signaling networks and establish theoretical models to understand regulatory mechanisms and find potential therapeutic targets. In this research, we established a prognostic risk model to predict the prognosis and therapy response of colon cancer using 92 algorithm combinations based on the integration of 10 machine learning algorithms, elucidated the different risk genes and then constructed a model influenced by ubiquitin modification.
Most of the twelve risk genes in the prognostic model have been implicated in tumor development, especially CRC. Wang et al [44] reported that DEPDC1 could promote the proliferation, invasion, and EMT of CRC via the regulation of zest12-mediated H3K27Me3. Additionally, DEPDC1 is associated with the sensitivity of CRC to 5-fluorouracil [45] and oxaliplatin [46]. CDC25C is involved in regulating the G2/M phase and mediating DNA damage and repair, as well as a key part of tumorigenesis and tumor development [47-49]. Recent research demonstrated that CDC25C was involved in the proliferation and cell cycle progression of CRC cells [50]. PRELP plays a crucial role in regulating the EMT process and further inhibits the progression of retinoblastoma [40]. In addition, CDCA2 can promote progression and may be related to poor prognosis and radioresistance in CRC [51]. TIMP1 can accelerate tumor progression and metastasis by regulating the FAK-PI3K/AKT and MAPK pathways in colon cancer [52].
FSTL3 was found to be related to tumor invasion and metastasis in CRC by activating EMT [53, 54], and T-cell exhaustion and macrophage and fibroblast polarization [55]. Furthermore, recent research has revealed that C2CD4A can interact with p53 and increase its ubiquitination and degradation to restrain the p53 signaling pathway in CRC [56]. CXCR2, a type of chemokine receptor, has been reported to be expressed on CRC cells [57]. Notably, the CXCR2 ligand CXCL2 can promote the development of colon cancer by binding to CXCR2 [58, 59] and remodeling the TME [60-62]. In CRC, the lncRNA ELFN1-AS1 can accelerate the proliferation, invasion and migration of tumors by targeting miR-4270 [63], miR-191-5p [64], miR-1250 [65], miR-4644 [66] and miR-191-5p [67]. In addition, the lncRNA ELFN1-AS1 can promote oxaliplatin resistance [68]. GPX3 acts as both an oncogene and a tumor suppressor in different tumor types, suggesting that it plays a dichotomous role [69]. In a meta-analysis of 17 eligible articles, Zhou et al [70] reported that GPX3 methylation is related to cancer and may be an important indicator for predicting lymph node metastasis. In colon cancer, Sarah and colleagues reported that HEYL inhibits the intravasation of metastatic CRC cells in vivo, hence negatively regulating metastasis formation [71]. In colon cancer, the knockdown of SERPINE1 inhibits the EMT process, invasion and proliferation ability of cancer cells and increases apoptosis [72]. Moreover, Kanto et al. discovered that the function of PRELP could be partially regulated by an HDAC inhibitor to suppress the development of bladder cancer. Given that PRELP play a role in tumor inhibition in hepatic cancer [38], bladder cancer [39] and retinoblastoma [40], the exact role of PRELP in CRC is not clear. Therefore, we further conducted an in vitro experiment and demonstrated that PRELP could inhibit the migration and proliferation of CRC cells. However, the potential molecular mechanisms by which risk genes influence the process of ubiquitination in colon cancer need further investigation.
As previously mentioned, considering the close connections between E3s and the TME, we used three immune analysis tools (CIBERSORT, ssGSEA, and ESTIMATE) to investigate the discrepancies in the immune response between the two risk subgroups based on 12 risk genes. Patients classified in the high-risk subgroup are very likely to experience poorer overall survival and a significantly modified tumor microenvironment. Increasing research has confirmed that ubiquitination plays a vital role in the immune response. Distinct modifications of proteins by ubiquitin in tumor or immune cells affect immune function to some extent [73, 74]. Hence, detecting specific E3s-related biomarkers may help us better understand the immune mechanism of colon cancer. In the present research, the E3s-related genes applied for establishing the risk model to some extent was proved to be associated with tumor immunity and therapy. For instance, CDC25C has been proven to be degraded by the ubiquitin ligases BRCA1 [75] and MDM2 [76]. It has been reported that CDC25C is associated with cell cycle arrest in macrophages [77] and T-cell leukemia/lymphoma cells [78]. Additionally, in colorectal cancer cells with p53 mutations, CDC25C was shown to be involved in irinotecan-induced radiosensitization via the ATM/CHK/CDC25C/CDC2 pathway [79]. A previous study revealed that SerpinE1 was negatively regulated by the E3 ligand RNF123 in aggressive glioblastoma tumors [80]. Moreover, Serpine1 mRNA could accelerate the exclusion of CD8+ T cells from colon adenocarcinomas and confer mesenchymal characteristics to the cell [81]. Additionally, SERPINE1 may serve as a biomarker of chemotherapy resistance in patients with soft tissue sarcoma [82]. CDCA2 can act on SMAD-specific E3 ubiquitin protein ligase 1 and inhibit the degradation of ubiquitin-dependent Aurora kinase A (AURKA) to promote melanoma progression [83]. Another study revealed that elevated CDCA2 expression was linked to the upregulation of immune checkpoints (PD-L1, PD-L2 and CTLA4) [84]. Furthermore, CDCA2 could be involved in the growth inhibition of RCC cells by decitabine, which may function by suppressing p38/NF-κB signaling [85]. This result indicates that the influence of ubiquitin modification on the expression of risk genes may be related to the extent of immune function and tumor progression. Thus, it revealed marked differences in sensitivity to routine chemotherapy, targeted therapy, and immunotherapy between the two risk subgroups, providing a new approach for combined immunotherapy and individualized treatments for colon cancer. In summary, these results illustrate that risk scores may be relevant to discrepancies in the immune response and could predict susceptibility to routine antitumor drugs as well as ICB.
Despite the potential clinical implications of our study, several limitations remain to be resolved. First, our study was a retrospective study, and the prognostic risk model needs to be validated with independent prospective cohorts. Second, although some studies have reported the relationship between these risk genes and tumors, this specific mechanism needs further experimental verification. Finally, the molecular mechanism of prognostic ERGs and their crosstalk with corresponding E3s in colon cancer are still unclear and need to be further investigated.
Conclusions
In conclusion, we established a novel prognostic model using many bioinformatics and integrated machine learning algorithms and effectively validated it with internal and external colon cancer datasets. We demonstrated that this model is linked to the immune landscape and drug sensitivity in colon cancer. However, detailed research on ubiquitination and its corresponding target genes as well as downstream signaling pathways in colon cancer is still lacking. Moreover, the value of risk genes as potential drug targets deserves further investigation.
Abbreviations
E3: E3 ubiquitin ligase; ERGs: E3-related genes; WGCNA: weighted gene coexpression network analysis; TCIA: The Cancer Immunome Atlas; GTEx: Genotype-Tissue Expression; TCGA: The Cancer Genome Atlas; IC50: half-maximal inhibitory concentration; CRC: colorectal cancer; TME: tumor microenvironment; GO: Gene Ontology; KEGG: Kyoto Encyclopedia of Genes and Genomes; GSEA: gene set enrichment analysis; TOM: topological overlap matrix; ROC: receiver operating characteristic; ssGSEA: single-sample gene set enrichment analysis; TIDE: Tumor Immune Dysfunction and Exclusion; CCK8: Cell Counting Kit-8; ICB: immune checkpoint blockade; TMB: tumor mutational burden.
Supplementary Materials
Figure S1: Flow chart of this research; Figure S2: Further validation of the OS-associated prognostic risk model for colon cancer; Table S1: E3s (n=240) obtained from previous literature; Table S2: Genes (62) obtained from univariate Cox analysis; Table S3: Machine learning algorithm combinations (92) and their corresponding C-indices and risk genes in all validation datasets. Table S4: Detailed clinic parameters of patients with colon cancer in TCGA dataset.
Acknowledgements
This work was supported by the National Natural Science Foundation of China (82103151).
Data availability statement
The datasets used during the present research are available in the GTEx database (https://www.gtexportal.org/), TCGA database (https://portal.gdc.cancer.gov/) and GEO database (https://www.ncbi.nlm.nih.gov/geo/).
Author contributions
All the authors contributed to the study conception and design. Material preparation, data collection and analysis were performed by Lunxi Liang, Xiao Liang, Xueke Yu and Wanting Xiang. The first draft of the manuscript was written by Lunxi Liang. Wanting Xiang and Xueke Yu conceived and supervised the research. All the authors have read and approved the final manuscript.
Competing Interests
The authors have declared that no competing interest exists.
References
1. Siegel RL, Miller KD, Fuchs HE, Jemal A. Cancer statistics, 2022. CA: a cancer journal for clinicians. 2022;72:7-33
2. Kanani A, Veen T, Søreide K. Neoadjuvant immunotherapy in primary and metastatic colorectal cancer. The British journal of surgery. 2021;108:1417-25
3. Xiao Y, Wang X, Zhang H, Ulintz PJ, Li H, Guan Y. FastClone is a probabilistic tool for deconvoluting tumor heterogeneity in bulk-sequencing samples. Nature communications. 2020;11:4469
4. Liu J, Lan Y, Tian G, Yang J. A Systematic Framework for Identifying Prognostic Genes in the Tumor Microenvironment of Colon Cancer. Frontiers in oncology. 2022;12:899156
5. Gu L, Jiang C, Xu C, Liu Y, Zhou H. Based on Molecular Subtypes, Immune Characteristics and Genomic Variation to Constructing and Verifying Multi-Gene Prognostic Characteristics of Colorectal Cancer. Frontiers in cell and developmental biology. 2022;10:828415
6. Tang Y, Guo H, Chen L, Wang X, Chen Q, Gou L. et al. Development and validation of a prognostic model for mitophagy-related genes in colon adenocarcinoma: A study based on TCGA and GEO databases. PloS one. 2023;18:e0284089
7. Aki D, Li Q, Li H, Liu YC, Lee JH. Immune regulation by protein ubiquitination: roles of the E3 ligases VHL and Itch. Protein & cell. 2019;10:395-404
8. Liang L, Wang H, Shi H, Li Z, Yao H, Bu Z. et al. A Designed Peptide Targets Two Types of Modifications of p53 with Anti-cancer Activity. Cell chemical biology. 2018;25:761-74.e5
9. Lee YR, Yehia L, Kishikawa T, Ni Y, Leach B, Zhang J. et al. WWP1 Gain-of-Function Inactivation of PTEN in Cancer Predisposition. The New England journal of medicine. 2020;382:2103-16
10. Hatakeyama S. TRIM Family Proteins: Roles in Autophagy, Immunity, and Carcinogenesis. Trends in biochemical sciences. 2017;42:297-311
11. Liao Y, Sumara I, Pangou E. Non-proteolytic ubiquitylation in cellular signaling and human disease. Communications biology. 2022;5:114
12. Wang D, Xu C, Yang W, Chen J, Ou Y, Guan Y. et al. E3 ligase RNF167 and deubiquitinase STAMBPL1 modulate mTOR and cancer progression. Molecular cell. 2022;82:770-84.e9
13. Cai H, Chen H, Huang Q, Zhu JM, Ke ZB, Lin YZ. et al. Ubiquitination-Related Molecular Subtypes and a Novel Prognostic Index for Bladder Cancer Patients. Pathology oncology research: POR. 2021;27:1609941
14. Wang L, Liu Y, Xuan C, Liu Y, Shi H, Gao Y. Identification of ubiquitination-related genes in human glioma as indicators of patient prognosis. PloS one. 2021;16:e0250239
15. Ni W, Bian S, Zhu M, Song Q, Zhang J, Xiao M. et al. Identification and Validation of Ubiquitin-Specific Proteases as a Novel Prognostic Signature for Hepatocellular Carcinoma. Frontiers in oncology. 2021;11:629327
16. Hinshaw DC, Shevde LA. The Tumor Microenvironment Innately Modulates Cancer Progression. Cancer research. 2019;79:4557-66
17. Liu Q, Aminu B, Roscow O, Zhang W. Targeting the Ubiquitin Signaling Cascade in Tumor Microenvironment for Cancer Therapy. International journal of molecular sciences. 2021;22:791
18. Gajewski TF, Schreiber H, Fu YX. Innate and adaptive immune cells in the tumor microenvironment. Nature immunology. 2013;14:1014-22
19. Kuai D, Zhu S, Shi H, Yang R, Liu T, Liu H. et al. Aberrant expression of m(6)A mRNA methylation regulators in colorectal adenoma and adenocarcinoma. Life sciences. 2021;273:119258
20. Zhang H, Xia Y, Wang F, Luo M, Yang K, Liang S. et al. Aldehyde Dehydrogenase 2 Mediates Alcohol-Induced Colorectal Cancer Immune Escape through Stabilizing PD-L1 Expression. Advanced science (Weinheim, Baden-Wurttemberg, Germany). 2021;8:2003404
21. Shan L, Lu Y, Xiang CC, Zhu X, Zuo ED, Cheng X. Identification of Five m6A-Related lncRNA Genes as Prognostic Markers for Endometrial Cancer Based on TCGA Database. Journal of immunology research. 2022;2022:2547029
22. Ito K, Murphy D. Application of ggplot2 to Pharmacometric Graphics. CPT: pharmacometrics & systems pharmacology. 2013;2:e79
23. Langfelder P, Horvath S. WGCNA: an R package for weighted correlation network analysis. BMC bioinformatics. 2008;9:559
24. Wilkerson MD, Hayes DN. ConsensusClusterPlus: a class discovery tool with confidence assessments and item tracking. Bioinformatics (Oxford, England). 2010;26:1572-3
25. Ritchie ME, Phipson B, Wu D, Hu Y, Law CW, Shi W. et al. limma powers differential expression analyses for RNA-sequencing and microarray studies. Nucleic acids research. 2015;43:e47
26. Chen HP, Chen CI, Liu KW, Chen TJ, Tian YF, Kuo YH. et al. High SLC28A2 expression endows an inferior survival for rectal cancer patients managed by neoadjuvant CCRT. Pathology, research and practice. 2022;239:154158
27. Yoshihara K, Shahmoradgoli M, Martínez E, Vegesna R, Kim H, Torres-Garcia W. et al. Inferring tumour purity and stromal and immune cell admixture from expression data. Nature communications. 2013;4:2612
28. Chen B, Khodadoust MS, Liu CL, Newman AM, Alizadeh AA. Profiling Tumor Infiltrating Immune Cells with CIBERSORT. Methods in molecular biology (Clifton, NJ). 2018;1711:243-59
29. Rooney MS, Shukla SA, Wu CJ, Getz G, Hacohen N. Molecular and genetic properties of tumors associated with local immune cytolytic activity. Cell. 2015;160:48-61
30. Zhong Z, Wang Y, Yin J, Ni S, Liu W, Geng R. et al. Identification of Specific Cervical Cancer Subtypes and Prognostic Gene Sets in Tumor and Nontumor Tissues Based on GSVA Analysis. Journal of oncology. 2022;2022:6951885
31. Jiang P, Gu S, Pan D, Fu J, Sahu A, Hu X. et al. Signatures of T cell dysfunction and exclusion predict cancer immunotherapy response. Nature medicine. 2018;24:1550-8
32. Maeser D, Gruener RF, Huang RS. oncoPredict: an R package for predicting in vivo or cancer patient drug response and biomarkers from cell line screening data. Briefings in bioinformatics. 2021;22:bbab260
33. Mayakonda A, Lin DC, Assenov Y, Plass C, Koeffler HP. Maftools: efficient and comprehensive analysis of somatic variants in cancer. Genome research. 2018;28:1747-56
34. Kallies A, Zehn D, Utzschneider DT. Precursor exhausted T cells: key to successful immunotherapy? Nature reviews Immunology. 2020;20:128-36
35. Vitale I, Manic G, Coussens LM, Kroemer G, Galluzzi L. Macrophages and Metabolism in the Tumor Microenvironment. Cell metabolism. 2019;30:36-50
36. Jin Y, Qin X. Profiles of immune cell infiltration and their clinical significance in head and neck squamous cell carcinoma. International immunopharmacology. 2020;82:106364
37. Biller LH, Schrag D. Diagnosis and Treatment of Metastatic Colorectal Cancer: A Review. Jama. 2021;325:669-85
38. Hong R, Gu J, Niu G, Hu Z, Zhang X, Song T. et al. PRELP has prognostic value and regulates cell proliferation and migration in hepatocellular carcinoma. Journal of Cancer. 2020;11:6376-89
39. Shozu K, Kaneko S, Shinkai N, Dozen A, Kosuge H, Nakakido M. et al. Repression of the PRELP gene is relieved by histone deacetylase inhibitors through acetylation of histone H2B lysine 5 in bladder cancer. Clinical epigenetics. 2022;14:147
40. Hopkins J, Asada K, Leung A, Papadaki V, Davaapil H, Morrison M. et al. PRELP Regulates Cell-Cell Adhesion and EMT and Inhibits Retinoblastoma Progression. Cancers. 2022;14:4926
41. McGranahan N, Swanton C. Clonal Heterogeneity and Tumor Evolution: Past, Present, and the Future. Cell. 2017;168:613-28
42. Sun F, Sun J, Zhao Q. A deep learning method for predicting metabolite-disease associations via graph neural network. Briefings in bioinformatics. 2022;23:bbac266
43. Wang T, Sun J, Zhao Q. Investigating cardiotoxicity related with hERG channel blockers using molecular fingerprints and graph attention mechanism. Computers in biology and medicine. 2023;153:106464
44. Wang Q, Jiang S, Liu J, Ma G, Zheng J, Zhang Y. DEP Domain Containing 1 Promotes Proliferation, Invasion, and Epithelial-Mesenchymal Transition in Colorectal Cancer by Enhancing Expression of Suppressor of Zest 12. Cancer biotherapy & radiopharmaceuticals. 2021;36:36-44
45. Lou T, Zhang L, Jin Z, Miao C, Wang J, Ke K. miR-455-5p enhances 5-fluorouracil sensitivity in colorectal cancer cells by targeting PIK3R1 and DEPDC1. Open medicine (Warsaw, Poland). 2022;17:847-56
46. Zhao B, Wang Y, Zhao X, Ni J, Zhu X, Fu Y. et al. SIRT1 enhances oxaliplatin resistance in colorectal cancer through microRNA-20b-3p/DEPDC1 axis. Cell biology international. 2022;46:2107-17
47. Liu K, Zheng M, Lu R, Du J, Zhao Q, Li Z. et al. The role of CDC25C in cell cycle regulation and clinical cancer therapy: a systematic review. Cancer cell international. 2020;20:213
48. Zhang W, Shang X, Yang F, Han W, Xia H, Liu N. et al. CDC25C as a Predictive Biomarker for Immune Checkpoint Inhibitors in Patients With Lung Adenocarcinoma. Frontiers in oncology. 2022;12:867788
49. Tan X, Yuan G, Wang Y, Zou Y, Luo S, Han H. et al. RAB20 Promotes Proliferation via G2/M Phase through the Chk1/cdc25c/cdc2-cyclinB1 Pathway in Penile Squamous Cell Carcinoma. Cancers. 2022;14:1106
50. Maimaiti A, Aizezi A, Anniwaer J, Ayitula, Ali B, Dilixiati M. Zinc finger of the cerebellum 5 promotes colorectal cancer cell proliferation and cell cycle progression through enhanced CDK1/CDC25c signaling. Archives of medical science: AMS. 2021;17:449-61
51. Feng Y, Qian W, Zhang Y, Peng W, Li J, Gu Q. et al. CDCA2 promotes the proliferation of colorectal cancer cells by activating the AKT/CCND1 pathway in vitro and in vivo. BMC cancer. 2019;19:576
52. Song G, Xu S, Zhang H, Wang Y, Xiao C, Jiang T. et al. TIMP1 is a prognostic marker for the progression and metastasis of colon cancer through FAK-PI3K/AKT and MAPK pathway. Journal of experimental & clinical cancer research: CR. 2016;35:148
53. Li Y, Tian M, Liu W, Wang D, Zhou Z, Pei Q. et al. Follistatin-Like 3 Enhances Invasion and Metastasis via β-Catenin-Mediated EMT and Aerobic Glycolysis in Colorectal Cancer. Frontiers in cell and developmental biology. 2021;9:660159
54. Liu Y, Li J, Zeng S, Zhang Y, Zhang Y, Jin Z. et al. Bioinformatic Analyses and Experimental Verification Reveal that High FSTL3 Expression Promotes EMT via Fibronectin-1/α5β1 Interaction in Colorectal Cancer. Frontiers in molecular biosciences. 2021;8:762924
55. Yang C, Cao F, Huang S, Zheng Y. Follistatin-Like 3 Correlates With Lymph Node Metastasis and Serves as a Biomarker of Extracellular Matrix Remodeling in Colorectal Cancer. Frontiers in immunology. 2021;12:717505
56. Rong Z, Luo Z, Fu Z, Zhang P, Li T, Zhang J. et al. The novel circSLC6A6/miR-1265/C2CD4A axis promotes colorectal cancer growth by suppressing p53 signaling pathway. Journal of experimental & clinical cancer research: CR. 2021;40:324
57. Wu W, Sun C, Xu D, Zhang X, Shen W, Lv Y. et al. Expression of CXCR2 and its clinical significance in human colorectal cancer. International journal of clinical and experimental medicine. 2015;8:5883-9
58. Chen MC, Baskaran R, Lee NH, Hsu HH, Ho TJ, Tu CC. et al. CXCL2/CXCR2 axis induces cancer stem cell characteristics in CPT-11-resistant LoVo colon cancer cells via Gαi-2 and Gαq/11. Journal of cellular physiology. 2019;234:11822-34
59. Lepsenyi M, Algethami N, Al-Haidari AA, Algaber A, Syk I, Rahman M. et al. CXCL2-CXCR2 axis mediates αV integrin-dependent peritoneal metastasis of colon cancer cells. Clinical & experimental metastasis. 2021;38:401-10
60. Bao Z, Zeng W, Zhang D, Wang L, Deng X, Lai J. et al. SNAIL Induces EMT and Lung Metastasis of Tumours Secreting CXCL2 to Promote the Invasion of M2-Type Immunosuppressed Macrophages in Colorectal Cancer. International journal of biological sciences. 2022;18:2867-81
61. Cai H, Chen Y, Chen X, Sun W, Li Y. Tumor-associated macrophages mediate gastrointestinal stromal tumor cell metastasis through CXCL2/CXCR2. Cellular immunology. 2023;384:104642
62. Zhang R, Dong M, Tu J, Li F, Deng Q, Xu J. et al. PMN-MDSCs modulated by CCL20 from cancer cells promoted breast cancer cell stemness through CXCL2-CXCR2 pathway. Signal transduction and targeted therapy. 2023;8:97
63. Peng S, Luo Y, Chen L, Dai K, Wang Q. lncRNA ELFN1-AS1 enhances the progression of colon cancer by targeting miR-4270 to upregulate AURKB. Open medicine (Warsaw, Poland). 2022;17:1999-2012
64. Jing X, Du L, Shi S, Niu A, Wu J, Wang Y. et al. Hypoxia-Induced Upregulation of lncRNA ELFN1-AS1 Promotes Colon Cancer Growth and Metastasis Through Targeting TRIM14 via Sponging miR-191-5p. Frontiers in pharmacology. 2022;13:806682
65. Zhai LQ, Wang XX, Qu CX, Yang LZ, Jia CM, Shi XC. A long non-coding RNA, ELFN1-AS1, sponges miR-1250 to upregulate MTA1 to promote cell proliferation, migration and invasion, and induce apoptosis in colorectal cancer. European review for medical and pharmacological sciences. 2021;25:4655-67
66. Lei R, Feng L, Hong D. ELFN1-AS1 accelerates the proliferation and migration of colorectal cancer via regulation of miR-4644/TRIM44 axis. Cancer biomarkers: section A of Disease markers. 2020;27:433-43
67. Du Y, Hou Y, Shi Y, Liu J, Li T. Long Non-Coding RNA ELFN1-AS1 Promoted Colon Cancer Cell Growth and Migration via the miR-191-5p/Special AT-Rich Sequence-Binding Protein 1 Axis. Frontiers in oncology. 2020;10:588360
68. Li Y, Gan Y, Liu J, Li J, Zhou Z, Tian R. et al. Downregulation of MEIS1 mediated by ELFN1-AS1/EZH2/DNMT3a axis promotes tumorigenesis and oxaliplatin resistance in colorectal cancer. Signal transduction and targeted therapy. 2022;7:87
69. Chang C, Worley BL, Phaëton R, Hempel N. Extracellular Glutathione Peroxidase GPx3 and Its Role in Cancer. Cancers. 2020;12:2197
70. Zhou C, Hu H, Zheng Z, Chen C, Li Y, Li B. et al. Association between GPX3 promoter methylation and malignant tumors: A meta-analysis. Pathology, research and practice. 2019;215:152443
71. Weber S, Koschade SE, Hoffmann CM, Dubash TD, Giessler KM, Dieter SM. et al. The notch target gene HEYL modulates metastasis forming capacity of colorectal cancer patient-derived spheroid cells in vivo. BMC cancer. 2019;19:1181
72. Hu B, Chen Z, Wang X, Chen F, Song Z, Cao C. MicroRNA-148a-3p Directly Targets SERPINE1 to Suppress EMT-Mediated Colon Adenocarcinoma Progression. Cancer management and research. 2021;13:6349-62
73. Wang X, Tokheim C, Gu SS, Wang B, Tang Q, Li Y. et al. In vivo CRISPR screens identify the E3 ligase Cop1 as a modulator of macrophage infiltration and cancer immunotherapy target. Cell. 2021;184:5357-74.e22
74. Shang S, Yang YW, Chen F, Yu L, Shen SH, Li K. et al. TRIB3 reduces CD8(+) T cell infiltration and induces immune evasion by repressing the STAT1-CXCL10 axis in colorectal cancer. Science translational medicine. 2022;14:eabf0992
75. Shabbeer S, Omer D, Berneman D, Weitzman O, Alpaugh A, Pietraszkiewicz A. et al. BRCA1 targets G2/M cell cycle proteins for ubiquitination and proteasomal degradation. Oncogene. 2013;32:5005-16
76. Giono LE, Resnick-Silverman L, Carvajal LA, St Clair S, Manfredi JJ. Mdm2 promotes Cdc25C protein degradation and delays cell cycle progression through the G2/M phase. Oncogene. 2017;36:6762-73
77. Yang HL, Huang PJ, Chen SC, Cho HJ, Kumar KJ, Lu FJ. et al. Induction of macrophage cell-cycle arrest and apoptosis by humic acid. Environmental and molecular mutagenesis. 2014;55:741-50
78. Xiao W, Li B, Sun X, Yu D, Xie Y, Wu H. et al. DCZ3301, a novel aryl-guanidino inhibitor, induces cell apoptosis and cell cycle arrest via suppressing the PI3K/AKT pathway in T-cell leukemia/lymphoma. Acta biochimica et biophysica Sinica. 2018;50:643-50
79. Wang Y, Yang L, Zhang J, Zhou M, Shen L, Deng W. et al. Radiosensitization by irinotecan is attributed to G2/M phase arrest, followed by enhanced apoptosis, probably through the ATM/Chk/Cdc25C/Cdc2 pathway in p53-mutant colorectal cancer cells. International journal of oncology. 2018;53:1667-80
80. Wang X, Bustos MA, Zhang X, Ramos RI, Tan C, Iida Y. et al. Downregulation of the Ubiquitin-E3 Ligase RNF123 Promotes Upregulation of the NF-κB1 Target SerpinE1 in Aggressive Glioblastoma Tumors. Cancers. 2020;12:1081
81. Polo-Generelo S, Rodríguez-Mateo C, Torres B, Pintor-Tortolero J, Guerrero-Martínez JA, König J. et al. Serpine1 mRNA confers mesenchymal characteristics to the cell and promotes CD8+ T cells exclusion from colon adenocarcinomas. Cell death discovery. 2024;10:116
82. Zhang J, Chen M, Zhao Y, Xiong H, Sneh T, Fan Y. et al. Complement and coagulation cascades pathway correlates with chemosensitivity and overall survival in patients with soft tissue sarcoma. European journal of pharmacology. 2020;879:173121
83. Sun W, Jin Y, Wei C, Xu Y, Liu W, Zhong J. et al. CDCA2 promotes melanoma progression by inhibiting ubiquitin-mediated degradation of Aurora kinase A. European journal of cancer (Oxford, England: 1990). 2023;188:49-63
84. Tang M, Liao M, Ai X, He G. Increased CDCA2 Level Was Related to Poor Prognosis in Hepatocellular Carcinoma and Associated With Up-Regulation of Immune Checkpoints. Frontiers in medicine. 2021;8:773724
85. Shang D, Han T, Xu X, Liu Y. Decitabine induces G2/M cell cycle arrest by suppressing p38/NF-κB signaling in human renal clear cell carcinoma. International journal of clinical and experimental pathology. 2015;8:11140-8
Author contact
![]() Corresponding authors: Wanting Xiang, E-mail: xiang_wanting01com; ORCID: 0009-0005-6649-0238; Xueke Yu, E-mail: yuxueke2023com; ORCID:0009-0009-0439-9067.
Corresponding authors: Wanting Xiang, E-mail: xiang_wanting01com; ORCID: 0009-0005-6649-0238; Xueke Yu, E-mail: yuxueke2023com; ORCID:0009-0009-0439-9067.