Impact Factor ISSN: 1837-9664

 Global reach, higher impact
J Cancer 2024; 15(17):5557-5576. doi:10.7150/jca.97640 This issue Cite
Research Paper
Lactate Metabolism Subtypes Analysis Reveals CCDC80 as a Novel Prognostic Biomarker in Gastric Cancer
Xiang Li2, Yaqi Du1, ![]()
1. Department of Gastroenterology, The First Hospital of China Medical University, Shenyang 110000, China.
2. Department of Medical Oncology, the First Hospital of China Medical University, Shenyang 110000, China.
Received 2024-4-22; Accepted 2024-7-16; Published 2024-8-26
Abstract

Lactate metabolism plays a vital role in tumor progression. Currently, gastric cancer (GC) has a poor prognosis. Therefore, our research aimed to investigate novel biomarkers related to lactate metabolism in patients. Patient data from The Cancer Genome Atlas (TCGA) and Gene Expression Omnibus (GEO) database were divided into subtypes based on the expression of lactate metabolism-related genes (LMRGs). Based on the subtypes, we identified coiled-coil domain containing 80 (CCDC80) for further investigation. Univariate and multivariate Cox regression models were constructed to determine the prognostic value of CCDC80 in GC. We further explored the mechanism by which CCDC80 affects GC prognosis using gene set enrichment analysis (GSEA). Immune infiltration and drug sensitivity analyses were also performed. Finally, immunohistochemical staining was used to evaluate CCDC80 expression in normal and tumor tissues. We observed that CCDC80 was overexpressed in GC samples and was significantly associated with T and pathological stages. Multivariate Cox analysis identified high CCDC80 expression as an independent prognostic marker. GSEA indicated that the oxidative phosphorylation pathway was highly enriched in the low CCDC80 expression group. Moreover, CCDC80 was associated with immune cell infiltration, especially that of M2 macrophages. Patients with higher CCDC80 expression exhibited lower sensitivity to paclitaxel. In conclusion, our findings demonstrate that CCDC80 is a critical regulator in GC progression and immune response and is associated with lactate metabolism, and it could be used as a novel biomarker for prognostic and chemotherapy treatment purposes.
Keywords: lactate metabolism, unsupervised clustering, gastric cancer, CCDC80, drug sensitivity
Introduction
According to the 2020 worldwide cancer statistics, gastric cancer (GC) is the fourth leading cause of cancer-related deaths worldwide [1]. The main treatment methods for GC include surgery, chemotherapy, and targeted therapy. However, the prognosis of GC remains poor, especially for advanced GC, with a 5-year survival rate of < 10% [2, 3]. Multiple factors contribute to this result, including the difficulty in early diagnosis and treatment, drug resistance, a high rate of recurrence, and tumor heterogeneity. Thus, identifying novel molecular biomarkers that can predict clinical prognosis would help further understand the pathogenesis of GC and promote personalized treatments for GC.
One promising area of research in cancer biology is the investigation of metabolic reprogramming, specifically focusing on lactate metabolism, which has been implicated in various aspects of tumor progression, including metastasis [4] and immune evasion [5, 6]. The alteration of energy metabolism in tumor cells is a hallmark of cancer [7]. Tumor cells use glucose through glycolysis and produce lactic acid even under aerobic conditions; the process is termed aerobic glycolysis and is also known as the Warburg effect [8, 9]. This phenomenon contributes to tumor development and drug resistance [10, 11]; however, the mechanisms underlying aerobic glycolysis are unclear.
CCDC80 (Coiled-Coil Domain Containing 80, also called DRO1, URB, CL2) is an extracellular matrix protein and was first found to be upregulated in the brown adipose tissue of mice with mild obesity [12]. In obese patients, the level of circulating CCDC80 protein is related to fatty liver disease, insulin secretion, and atherosclerosis [13]. CCDC80 is also related to several cancers and serves as a tumor suppressor in colorectal cancer [14], pancreatic cancer [15], thyroid cancer [16], and malignant melanoma [17]. However, the association of CCDC80 with GC, particularly its relationship with lactate metabolism, immune cell infiltration, drug sensitivity, and clinical outcomes, has not yet been reported.
In this study, we sought to identify novel prognostic markers for GC related to lactate metabolism. To that aim, we broadly divided patients with GC into three subgroups based on unsupervised clustering of lactate metabolism-related genes (LMRGs) and further explored the function of each subgroup. CCDC80 was screened as a differentially expressed gene (DEG) among these three subgroups and validated as a predictive biomarker of survival ability and drug sensitivity.
Materials and Methods
Acquisition and preparation of genetic and clinical data
RNA sequencing and clinical data of GC patients were downloaded from The Cancer Genome Atlas (TCGA) data repository (https://portal.gdc.cancer.gov) using the TCGAbiolinks package [18]. This included clinical cases which had pathological TNM staging and survival information.
Three microarray datasets, containing GSE62254 [19], GSE15459 [20], and GSE57303 [21], were downloaded from Gene Expression Omnibus (GEO) database (https://www.ncbi.nlm.nih.gov/geo/) using the GEOquery package [22], and all samples were from Homo sapiens. After background-corrected and normalization, we got three GEO expression datasets, respectively. Batch effects from these independent datasets were corrected by using the sva R package.
Download of LMRGs and unsupervised clustering
We acquired LMRGs from the Molecular Signatures Database (MSigDB; https://www.gsea-msigdb.org/gsea/msigdb/index.jsp) [23]. In this study, five datasets named respectively HP lactic acidosis, HP increased serum lactate, HP severe lactic acidosis, HP lactic aciduria, and GOBP lactate metabolic process were used in the presented analyses.
Survminer and survival R packages (https://CRAN.R-project.org/package=survival) were used to perform survival analysis for further screening LMRGs that could potentially affect prognosis of patients with GC. Based on these genes, samples from TCGA and GEO cohorts were separated into distinct molecular subtypes by the unsupervised clustering method. We do this by using the Bioconductor ConsensusClusterPlus package [24]. Consensus clustering was conducted by hierarchical clustering algorithm for 1000 iterations to ensure the stability of classification.
We calculated the ESTIMATE score, immune score, and stromal score for each sample using the estimate R package [25] to estimate immune and stromal infiltration, and analyzed the differences in each score among the clusters.
A gene set variation analysis (GSVA) analysis of the expression matrix was per-formed by the GSVA package [26], using 18 common biological functional pathway genes as a reference gene set. We further analyzed the main function of each cluster depending on the difference of pathways enrichment in subgroups.
Identification of CCDC80 and correlation analysis with lactate metabolism
The DEGs were screened by the limma package [27], and the volcanic maps of DEGs were drawn by the ggplot2 package (https://ggplot2.tidyverse.org) to show the differential expression of DEGs. DEGs satisfies p.value < 0.05 and | logFC | > 0.7. We conducted DEGs analysis among Cluster3 and Cluster4, Cluster3 and Cluster1+2, Cluster1+2+3 and Cluster4, respectively. Venn diagram was generated and displayed the intersection of DEGs in three groups.
We confirmed CCDC80 by survival analysis of intersecting genes among DEGs. Survival curves were constructed using the survival R package. To verify the clinical significance of CCDC80, independent t-tests were used to determine differences in the expression of CCDC80 in samples with different clinical characteristics in the TCGA dataset.
We analyzed the expression of CCDC80 in different subtypes. In order to clarify the correlation between CCDC80 and lactate metabolism, we analyzed the correlation between CCDC80 and the mRNA expression of hypoxia-inducible factor 1α (HIF -1α), Lactate dehydrogenase A (LDHA), and Lactate dehydrogenase B (LDHB). In addition, we also analyzed the correlation of CCDC80 with some other lactate metabolism-related genes.
Multivariate Cox regression of CCDC80 and nomogram model
To estimate the hazard ratio (HR) of OS, we conducted univariate and multivariate Cox regression analysis. We analyzed the prognosis classification of risk score by multivariate Cox regression analysis by timeROC R package [28], and prognostic classification efficacy for 1-, 3-, and 5-year were displayed. With the result we had gotten from multivariate Cox analysis, the nomogram which can show the survival probability for 1-, 3-, and 5-year was built with the rms R package (https://CRAN.R-project.org/package=rms).
Pathway enrichment analysis
We set the median of CCDC80 expression as cut-off and divided the patients with GC into two groups: low and high CCDC80 expression groups. Limma package was used to identify DEGs between two groups, with the threshold of log fold change |logFC| > 0.6.
The potential biological mechanisms and pathways of DEGs were explored with the clusterProfiler package [29] in R to annotate and visualize the Gene ontology (GO) analysis and Kyoto Encyclopedia of Genes and Genomes (KEGG) pathways.
Gene enrichment analysis was also performed using gene set enrichment analysis (GSEA). The h.all.v7.2.symbols.gmt dataset in the MSigDB of the GSEA website was selected as the reference gene set to assess the influences of different expressions on each reference set. GSEA was carried out by the method of default weighted enrichment statis-tics, and the number of random combinations was designed to be 1,000 times.
Immune cell infiltration analysis
We use the CIBERSORTx website (https://cibersortx.stanford.edu/) [30] to estimate the immune infiltrate in each sample and calculate the relationship between CCDC80 and immune cell subsets. Immune cell infiltration analysis was also done by GSVA R package with the method of single-sample gene set enrichment analysis (ssGSEA) to explore the difference of immune cell infiltration between CCDC80 low and high expression groups. Subsequently, we conducted a correlation analysis between CCDC80 and immune cells in TIMER2.0 (http://timer.cistrome.org/) [31].
IOBR R package [32] was used to calculate the immune cell fraction in the CCDC80 low and high expression groups by the method of quanTIseq. In addition, we also assessed the differences of important signatures between groups.
Drug sensitivity analysis
The GDSC database (www.cancerrxgene.org/) [33] can be used to find tumor drug response data and sensitive markers of the genome. We download drug response data from the GDSC resource. The pRRophetic algorithm is used to construct a ridge regression model according to gene expression, and then we use IC50 to predict the sensitivity of low and high CCDC80 expression groups to common anticancer drugs.
Somatic variant analysis
The gene mutations in GC patients were shown by the maftools R package [34], and the total number of non-synonymous mutations per trillion bases could be used to calculate the tumor mutation load (TMB) in the low and high CCDC80 expression groups.
The clinical validation cohort collection
We collected primary tumor samples from the First Hospital of China Medical University between 2010-2016, which consisted of 80 GC patients' tumor specimens and adjacent non-tumor tissue specimens. Study protocols were approved by the Ethics Committee of The First Hospital of China Medical University (AF-SOP-07-1.1-01). All participants provided written informed consent. Patients diagnosed with GC without other serious diseases were enrolled in the study. During surgery, tumor tissue (within 3 cm of the tumor edge) and normal gastric tissue (3 cm from the tumor edge) were collected from the 80 patients and stored at -80 °C for future use. The inclusion criteria were used as follows: (1) patients pathologically confirmed with gastric cancer; (2) patients subjected to surgery; (3) patients aged 18-80 years. The exclusion criteria included receiving neoadjuvant chemotherapy or radiotherapy, remnant gastric cancer, and postoperative death within 3 months. The pathological diagnoses and classifications were estimated according to the AJCC Cancer Staging Manual (7th edition) [35]. Survival follow-up data were noted by telephone or medical records.
Immunohistochemistry and evaluation with clinicopathologic characteristics
Immunohistochemistry of CCDC80 was performed on the validation cohort. All tissue specimens were fixed in neutral formaldehyde, embedded in paraffin, and sectioned (thickness, 4μm). The streptavidin-peroxidase immunohistochemical method was used to enhance staining intensity. Tissue sections were incubated at 4 °C overnight with An-ti-CCDC80 (1:200) (ab224050; rabbit anti-human, polyclonal, Abcam, MA, USA). Then, samples were lightly counterstained with hematoxylin, dehydrated in alcohol, and mounted. Two pathologists, blinded to the clinical data, independently scored the slides in each sample by evaluating the staining intensity and percentage of stained cells in representative areas. The slides were analyzed by standard light microscopy.
The staining intensity was scored as 0 (negative), 1 (weak), 2 (moderate), or 3 (strong). The percentage of cells stained was scored as 1 (1-25%), 2 (26-50%), 3 (51-75%), or 4 (76-100%). A final combined score of 0-12 was obtained by multiplying the intensity and percentage scores. Specimens with scores ≥ 4 were considered CCDC80-positive, and those with scores < 4 indicated CCDC80-negative.
We also further explored the prognostic value of CCDC80 protein expression and the correlation between CCDC80 protein expression groups and clinicopathologic characteristics of patients with GC.
Statistical analysis
Survival curves were constructed using the R package survival. GSEA was used to identify the pathways that were significantly enriched in low and high CCDC80 expression groups. Group comparisons were performed on continuous variables. Independent t-tests were used for normally distributed variables, and Mann-Whitney U tests were conducted on other variables. All statistical tests were two-sided, and p < 0.05 was considered statistically significant. Statistical analyses were performed using R software (version 4.1.1, www.r-project.org).
Results
Data processing
The workflow of our study is shown in Figure 1. A total of 910 samples were included in the study, with 348 and 562 samples containing clinical and RNA sequencing data from TCGA and GEO database, respectively. The median OS time of these samples was 22 months. Of the 910 samples, 108 (12.1% of the total number of cases) were staged as Stage I, 248 (27.7% of the total number of cases) as Stage II, 357 (39.8% of the total number of cases) as Stage III, and 183 (20.4% of the total number of cases) as Stage IV. Detailed patient baseline data are presented in Table 1.
Clinical information of the 910 samples used in this study.
| Characteristics | Number of cases (%) | TCGA | GEO |
|---|---|---|---|
| n | 910 | 348 | 562 |
| Age, median (IQR) | 65 (56.76, 72) | 67.35 (58.48, 73.15) | 64.35 (56, 70.12) |
| Gender | |||
| Male | 601 (66%) | 225 | 376 |
| Female | 309 (34%) | 123 | 186 |
| Stage | |||
| Stage I | 108 (11.8%) | 46 | 62 |
| Stage II | 248 (27.3%) | 110 | 138 |
| Stage III | 357 (39.2%) | 144 | 213 |
| Stage IV | 183 (20.1%) | 34 | 149 |
| NA | 14 (1.5%) | 14 | 0 |
| Status | |||
| Alive | 482 (53%) | 203 | 279 |
| Dead | 428 (47%) | 145 | 283 |
| OS time (months), median (IQR) | 22 (11.128, 58) | 15.48 (9.2, 26.16) | 32.67 (12.82, 70.57) |
The workflow of this study.
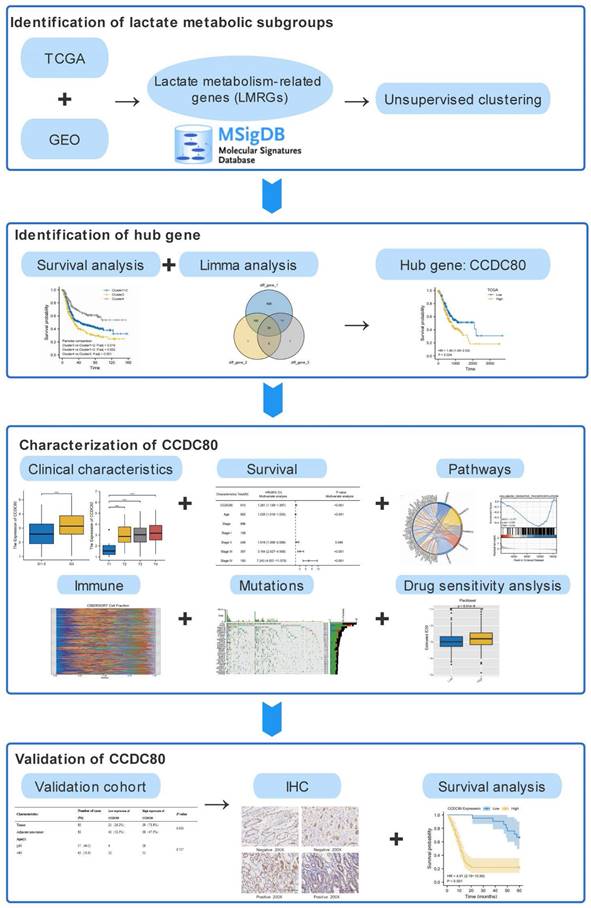
Characterization of lactate metabolism subgroups
Based on LMRG expression, we conducted unsupervised clustering analysis; we chose the clustering results at K = 4 and separated TCGA and GEO samples into four lactate metabolism subgroups (Figure 2A-C).
Characterization of lactate metabolism subgroups in gastric cancer (GC). (A) Consensus clustering matrix when k = 2. (B) Consensus clustering CDF with k valued 2 to 7. (C) Relative change in area under CDF curve. Comparisons and distributions of ESTIMATE (D), immune (E), and stromal scores (F) among clusters. Gene set variation analysis (GSVA) pathway enrichment analysis of cluster 3 and 4 (G), and cluster 3 and 1+2 (H).
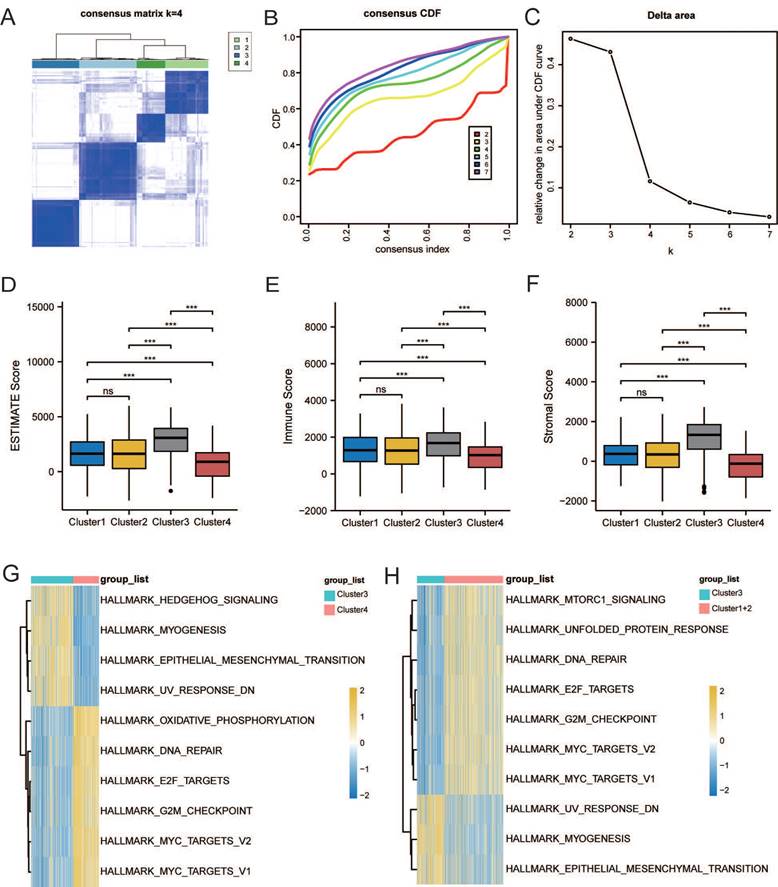
The ESTIMATE algorithm was used to further explore immune and stromal infiltration among these cluster subgroups. Counterintuitively, we observed no significant differences between clusters 1 and 2, but both clusters 1 and 2 had significant differences with the other two subgroups, clusters 3 and 4; an overall higher immune cell infiltration was found in cluster 3 than in the other three clusters (Figure 2D-F). As no significant differences were observed in the immune infiltration analysis between clusters 1 and 2, we subsequently combined the two groups for analysis.
Next, to further explore the function of the three subgroups, we performed GSVA. As shown in Figure 2G, the EMT pathway was significantly enriched in cluster 3, whereas the “HALLMARK_OXIDATIVE_PHOSPHORYLATION” pathway was significantly enriched in cluster 4. Thus, we further defined clusters 3 and 4 as the EMT and metabolic subtypes, respectively. As shown in Figure 2H, “HALLMARK_MTORC1_SIGNALING,” “HALLMARK_E2F_TARGETS,” and “HALLMARK_G2M_CHECKPOINT” pathways, which were related to proliferation, were enriched in cluster 1 and 2. Therefore, we further defined cluster 1+2 as the proliferation subtype.
Survival analysis was conducted among the three subgroups. As shown in Figure 3A, OS of patients with GC statistically significantly differed among the three groups; patients in cluster 3 had the worst prognosis, whereas patients in cluster 4 had a significantly better prognosis than patients in the other two groups. We calculated the score of oxidative phosphorylation (OXPHOS) among groups using the ssGSEA algorithm; cluster 3 had the lowest score, whereas cluster 4 had the highest (Figure 3B). These results suggested that a higher OXPHOS score might be associated with a better prognosis and higher immune cell infiltration, suggesting a potential relationship between LMRGs and immune cell infiltration.
Identification of DEGs related to lactate metabolism to 7. (A) Overall Survival (OS) analysis of different clusters. (B) Comparisons of oxidative phosphorylation (OXPHOS) score among clusters. Volcano plots of DEGs between clusters 3 and 4 (C), clusters 3 and 1+2 (D), and clusters 1+2+3 and 4 (E). (F) Venn diagram indicates overlaps for differentially expressed genes (DEGs).
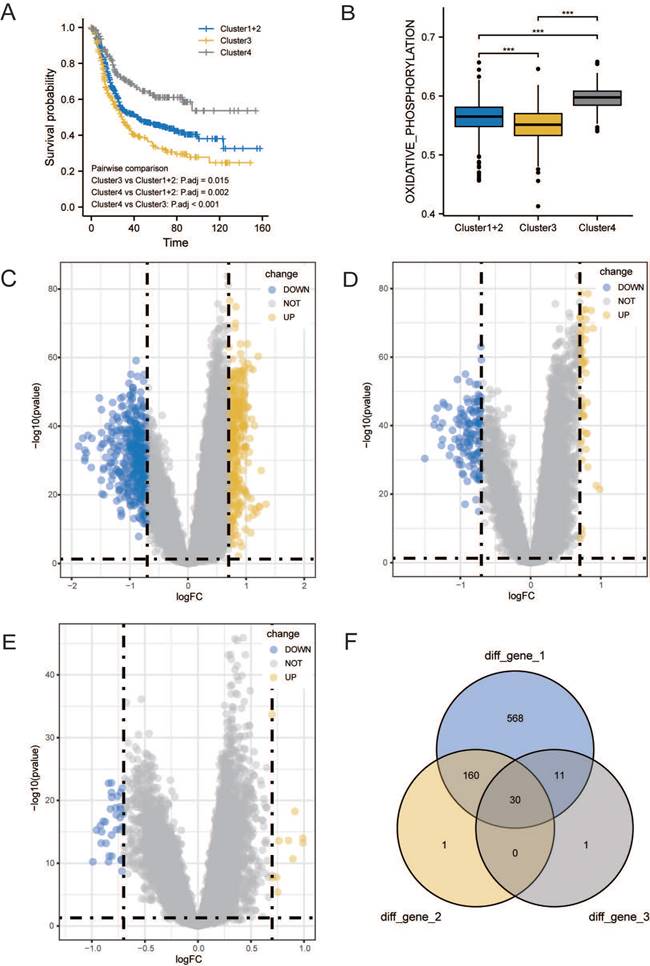
To assess the transcriptomic differences in the regulatory patterns of cellular lactate metabolism, we investigated the DEGs among different subgroups. We identified 317 up-regulated and 452 downregulated DEGs between clusters 3 and 4, 53 upregulated and 138 downregulated DEGs between clusters 3 and 1+2, and 10 upregulated and 32 downregulated DEGs between clusters 1+2+3 and 4. The volcano plots are displayed in Figure 3C-3E. The Venn diagram (Figure 3F) indicates overlaps for 30 DEGs.
In the TCGA dataset, we grouped these DEGs according to median expression and conducted a survival analysis to screen for prognostic genes with p < 0.05. CCDC80 and three other genes (PPP1R14A, APOD, and OGN) were identified. We selected CCDC80 for further investigation since it had not been reported with GC in the previous studies.
CCDC80 expression in TCGA stomach adenocarcinoma (TCGA-STAD) and Pan-Cancers
We conducted a pan-cancer analysis of CCDC80 expression using data from TCGA and the Genotype-Tissue Expression (GTEx) portal. Figure 4A indicates that CCDC80 was highly expressed in GC samples (p < 0.001).
Association between Coiled-coil domain containing 80 (CCDC80) expression and different clinical characteristics. (A)CCDC80 expression in normal and tumor tissues in The Cancer Genome Atlas (TCGA) and Genotype-Tissue Expression (GTEx) databases. (B) Association between CCDC80 expression and OS in TCGA-STAD. Association between CCDC80 expression and clinical characteristics such as grade (C), T stage (D), N stage (E) and pathological stage (F). (G) Association between CCDC80 expression and OS in TCGA and Gene Expression Omnibus (GEO) databases. (H) Different expressions of immune checkpoints (ICPs) in low and high CCDC80 expression groups.
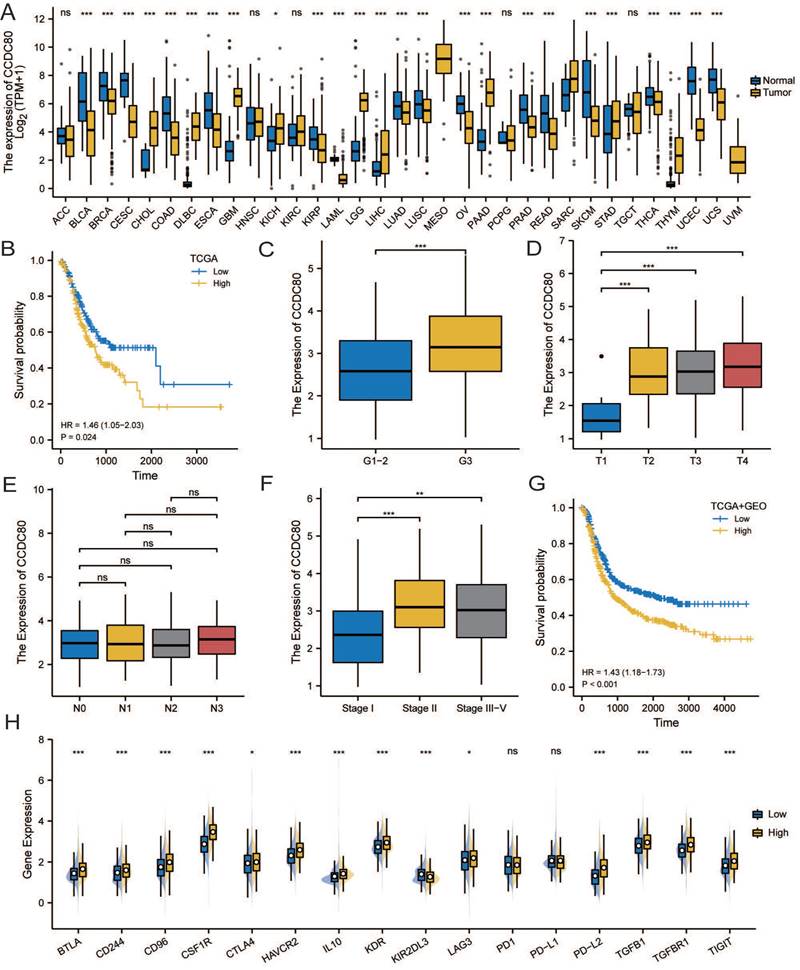
In the TCGA-STAD cohort, survival analysis showed that patients with high CCDC80 expression had lower OS than those with low expression (p < 0.05, Figure 4B). We further explored the relationship between CCDC80 expression and clinicopathological variables. Figure 4C shows the relationship between CCDC80 expression and histological grade, indicating that the CCDC80 expression increased with a higher degree of tumor differentiation (p < 0.001). Similarly, CCDC80 expression was lower in T1 (Figure 4D, p < 0.001) and stage I (Figure 4F, p < 0.05) groups. However, no significant differences were observed between the different N stages (Figure 4E).
Additionally, Figure 4G shows the prognostic value of CCDC80 expression in the TCGA and GEO cohorts, which was consistent with the result in TCGA-STAD cohort. These results indicated that high CCDC80 expression is a predictor of poor prognosis in patients with GC.
We then analyzed the differences in immune checkpoint (ICP) in different CCDC80 expression groups. We confirmed that the expression of most ICPs was significantly in-creased in the high CCDC80 expression group, which suggests that CCDC80 expression may have an impact on immunotherapy.
The correlation analysis of CCDC80 and lactate metabolism
The analysis revealed of the patients in the metabolic subtype, most of the samples were classified in the low CCDC80 expression group (Figure 5A). In Correlation analysis revealed a positive correlation between the mRNA expression of CCDC80 and LDHA (Spearman's R=0.188, p < 0.001; Figure 5B), while a negative correlation between the mRNA expression of CCDC80 and LDHB (Spearman's R=-0.231, p < 0.001; Figure 5C), although the correlations were weak. Moreover, HIF-1α expression levels were positively correlated with CCDC80 (Spearman's R=0.184, p < 0.001; Figure 5D).
The correlation analysis of CCDC80 and lactate metabolism. (A)CCDC80 expression in different clusters and subtypes. Association between CCDC80 expression and LDHA (B), LDHB (C), HIF-1α (D), PYGL (E) and FOXRED1 (F).
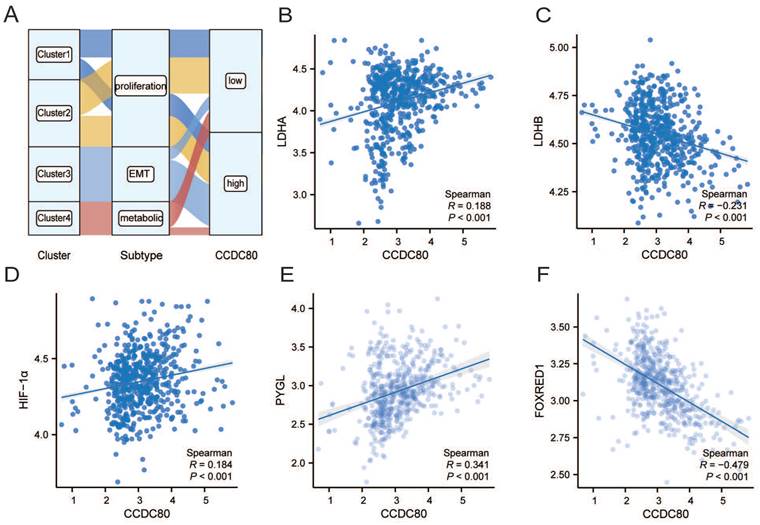
Further analysis of other lactate metabolism-related genes demonstrated that CCDC80 expression was positively correlated with PYGL (Spearman's R=0.341, p < 0.001; Figure 5E) and negatively correlated with FOXRED1 (Spearman's R=-0.479, p < 0.001; Figure 5F).
Multivariate Cox regression of CCDC80 and nomogram model
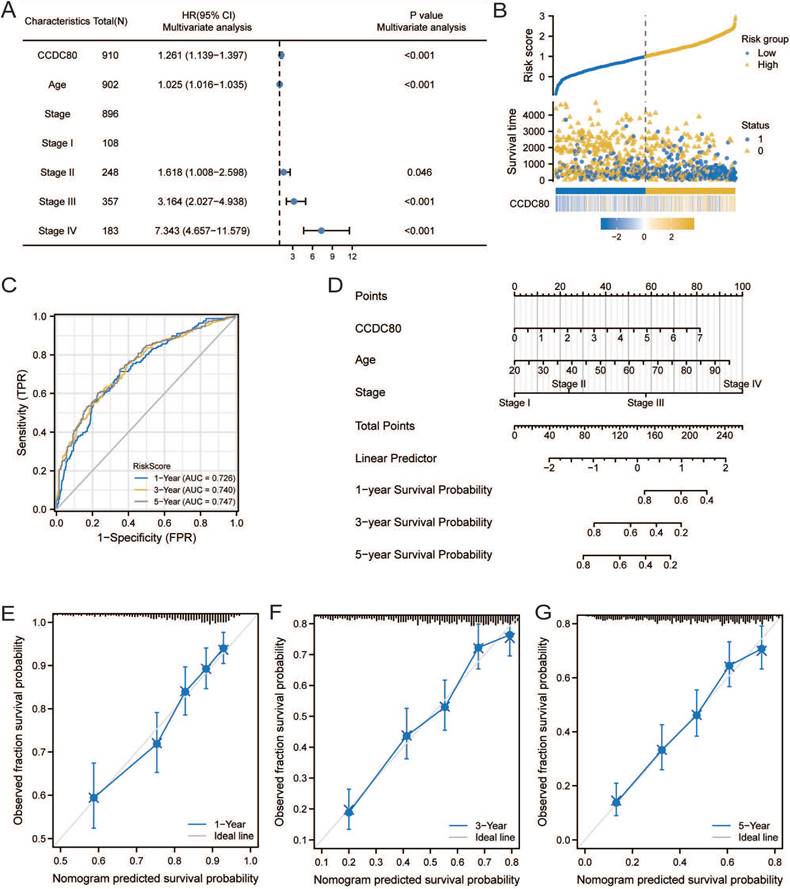
The results of univariate and multivariate Cox regression analyses are presented in Table 2. Multivariate Cox regression analysis revealed that CCDC80 expression was an independent prognostic factor (Figure 6A). Figure 6B depicts the risk score based on multivariate Cox regression, patient survival outcomes, and CCDC80 expression. We used the timeROC function to explore the prognosis of the risk score and then obtained the 1-, 3-, and 5-year prognostic classification efficiency. As shown in Figure 6C, the computed areas under the curve (AUC) were large: 0.726 at 1 year, 0.740 at 3 years, and 0.747 at 5 years. We constructed a nomogram to evaluate the prognosis of patients with GC. Except for CCDC80 expression, the model included age and pathological stage (Figure 6D). Figure 6E-G shows the calibration curve for these time points.
Results of univariate and multivariable analysis.
| Characteristics | Total (N) | Univariate analysis | Multivariate analysis | |||
|---|---|---|---|---|---|---|
| Hazard ratio (95% CI) | P value | Hazard ratio (95% CI) | P value | |||
| CCDC80 | 910 | 1.244 (1.132-1.368) | <0.001 | 1.261 (1.139-1.397) | <0.001 | |
| Age | 902 | 1.014 (1.005-1.022) | 0.003 | 1.025 (1.016-1.035) | <0.001 | |
| Gender | 910 | |||||
| Male | 601 | Reference | ||||
| Female | 309 | 0.844 (0.688-1.037) | 0.106 | |||
| Stage | 896 | |||||
| Stage I | 108 | Reference | ||||
| Stage II | 248 | 1.670 (1.041-2.679) | 0.034 | 1.618 (1.008-2.598) | 0.046 | |
| Stage III | 357 | 3.291 (2.113-5.126) | <0.001 | 3.164 (2.027-4.938) | <0.001 | |
| Stage IV | 183 | 6.766 (4.304-10.637) | <0.001 | 7.343 (4.657-11.579) | <0.001 | |
Multivariate Cox regression of CCDC80 and nomogram model. (A) Multivariate Cox regression for CCDC80 expression and clinical characteristics. (B) Risk score and survival time distributions, and heatmaps of CCDC80 expression. (C) ROC curve with a time dependence indicating the OS rates of 1-, 3-, and 5-year. (D) Nomogram integrated CCDC80 expression, age, and stage to predict OS. Calibration curves for 1- (E), 3- (F), and 5-year (G) survival predictions.
Pathway enrichment analysis
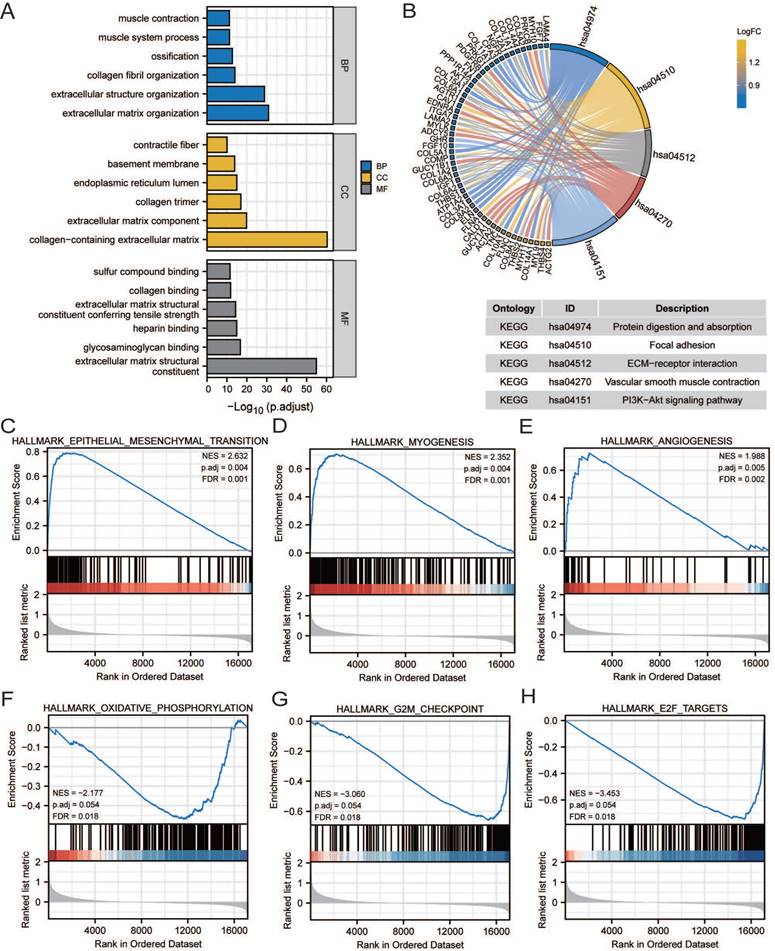
GO, KEGG, and GSEA analyses were performed to reveal the mechanism of CCDC80, using the DEGs between low and high CCDC80 expression groups, including 387 upregulated and 13 downregulated genes. The top enriched GO terms and KEGG pathways are shown in Figures 7A and 7B. The GSEA results suggested that three functional gene sets were enriched in the high CCDC80 expression group, which included EMT, myogenesis and angiogenesis pathways (Figure 7C-E). In contrast, OXPHOS, G2M checkpoint, and E2F targets pathways were significantly enriched in the low CCDC80 expression group (Figure 7F-H).
Pathway enrichment analysis. Gene ontology (GO) (A) and Kyoto Encyclopedia of Genes and Genomes (KEGG) (B) pathway enrichment of DEGs in groups with low and high CCDC80 expression. Gene set enrichment analysis (GSEA) enrichment in the high CCDC80 expression (C-E) and low CCDC80 expression (F-H).
Immune cell infiltration and drug sensitivity analyses
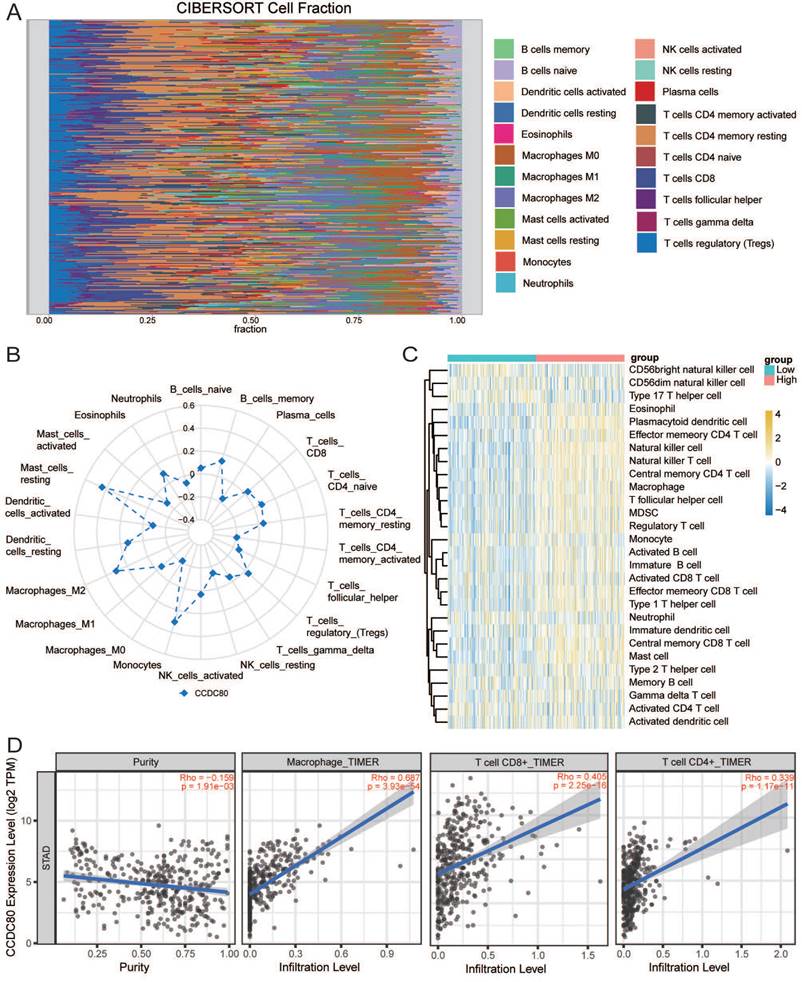
Immune infiltration analysis was performed in the GC tumor microenvironment, as shown in Figure 8A. Figure 8B shows the correlation between CCDC80 expression and various immune cells. This result was consistent with the TIMER database, in which the expression of CCDC80 was significantly positively correlated with macrophage infiltration (r = 0.687, p < 0.001) (Figure 8D). We also compared the differences in immune cell in-filtration between the low and high CCDC80 expression groups. As shown in Fig 8C, many immune cells were highly infiltrated in the high CCDC80 expression group, including CD4+ T cells, CD8+ cells, B cells, and macrophages. Further analysis using the quanTIseq algorithm yielded similar results (Figure 9A). These results suggest that CCDC80 is vital in regulating immune cell infiltration in GC. The score of important signatures was used to explore the difference in function between the high and low CCDC80 expression groups. The high-expression group had higher ICP (Figure 9B) and lower OXPHOS scores (Figure 9C).
Immune infiltration analysis. (A) The distribution of 22 tumor infiltrating cells. (B) Correlation between CCDC80 expression and various immune cells. (C) Immune cell infiltration between low and high CCDC80 expression groups. (D)The correlation of CCDC80 expression with tumor purity and tumor infiltrating cells from the TIMER database.
Correlation of CCDC80 expression with immunotherapy and drug sensitivity analysis. (A) Immune cell infiltration using quanTIseq algorithm between low and high CCDC80 expression groups. Score of ICP (B) and OXPHOS (C) in low and high CCDC80 expression groups. (D) Prediction of drug sensitivity.
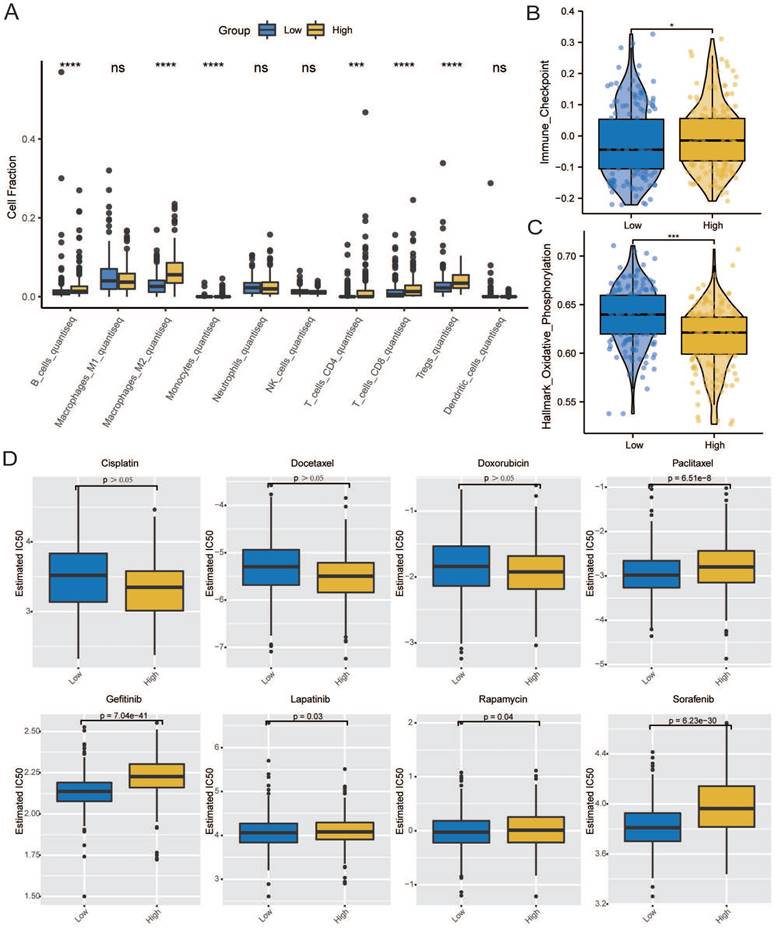
The results of drug sensitivity analysis can be seen in Figure 9D. It demonstrated that the drug sensitivity of paclitaxel is lower in the high CCDC80 expression group (p < 0.05). In other anti-cancer drugs, such as gefitinib, lapatinib, rapamycin and sorafenib, we can see the similar results. However, we observed no significant differences in the drug sensitivity of cisplatin, docetaxel, and doxorubicin between the low and high CCDC80 expression groups.
Mutation characteristics
The overall mutational landscape of TCGA-STAD is shown in Figure 10A; missense mutations occurred most frequently, and the top two mutated genes were TTN and MUC16. Subsequently, we analyzed the TMB. We observed significant differences between the groups, with the high CCDC80 expression group exhibiting lower TMB than the low expression group (Figures 10B and 10C), indicating the impact of immunotherapy.
Mutation characterization in the low and high CCDC80 expression groups. (A) The overall mutational landscape of TCGA-STAD. Tumor mutation load (TMB) (B, C) and somatic mutations (D, E) in low and high CCDC80 expression groups. (F, G) The correlation between the top 20 mutated genes low and high CCDC80 expression groups.
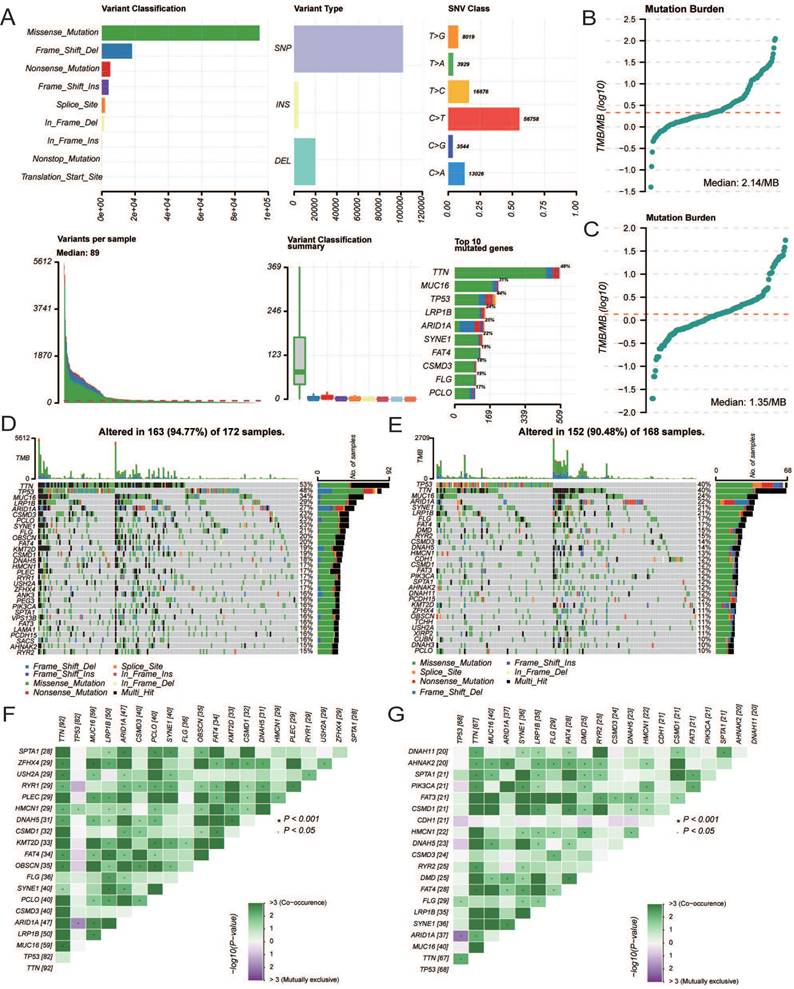
We analyzed the mutation characteristics of the high and low CCDC80 expression groups. The top 30 mutated genes in the low and high CCDC80 expression groups were mapped (Figures 10D and 10E). TTN and MUC16 were more frequently mutated in the low CCDC80 expression group, with mutation frequencies of 53% and 34%, respectively. Figure 10F and 10G shows the correlation between the top 20 mutated genes. These results provide novel insights into the intrinsic connection between immunotherapy and somatic variation.
CCDC80 expression in our GC samples and its relation with clinicopathological characteristics
The age of the independent cohort was 28-80 years old (≥60 years old, n = 37, 46.2%; <60 years old, n = 43, 53.8%), and the cohort included both male (n = 50, 62.5%) and female (n = 30, 37.5%) (Table 3). Patients with clinical stages I (n = 29, 36.3%), II (n = 24, 30%), and III (n = 27, 33.7%) were present. Both GC and adjacent non-tumor tissue specimens exhibited cytoplasmic CCDC80 expression. CCDC80 staining was significantly more intense in GC tissue specimens (score ≥4, 73.8% [59/80]) than in adjacent non-tumor tissue specimens (score ≥4, 47.5% [38/80]) (p = 0.001) (Figure 11A-C). High CCDC80 protein expression was positively correlated with the clinical stage (p < 0.001), T stage (p < 0.001), N stage (p = 0.004), and pathologic differentiation (p = 0.009). Regarding the ability of CCDC80 expression to discriminate between patients with GC and healthy individuals, the ROC area under the curve was 0.737 (Figure 11D).
Clinical characteristics of patients from The First Hospital of China Medical University and correlations between CCDC80 expression and clinicopathological characteristics.
| Characteristics | Number of cases (%) | Low expression of CCDC80 | High expression of CCDC80 | P value |
|---|---|---|---|---|
| Tumor | 80 | 21 (26.2%) | 59 (73.8%) | 0.001 |
| Adjacent non-tumor | 80 | 42 (52.5%) | 38 (47.5%) | |
| Age(y) | ||||
| ≥60 | 37 (46.2) | 9 | 28 | 0.717 |
| <60 | 43 (53.8) | 12 | 31 | |
| Gender | ||||
| Male | 50 (62.5) | 12 | 38 | 0.555 |
| Female | 30 (37.5) | 9 | 21 | |
| Clinical stage | ||||
| Stage I | 29 (36.3) | 17 | 12 | <0.001 |
| Stage II | 24 (30.0) | 2 | 22 | |
| Stage III | 27 (33.7) | 2 | 25 | |
| T stage | ||||
| T1 | 20 (25) | 11 | 9 | <0.001 |
| T2 | 16 (20) | 6 | 10 | |
| T3 | 14 (17.5) | 3 | 11 | |
| T4 | 30 (37.5) | 1 | 29 | |
| N stage | ||||
| N0 | 16 (20) | 9 | 7 | 0.004 |
| N1 | 14 (17.5) | 5 | 9 | |
| N2 | 13 (16.3) | 1 | 12 | |
| N3 | 37 (46.2) | 6 | 31 | |
| Pathologic differentiation | ||||
| G1 | 16 (20.0) | 9 | 7 | 0.009 |
| G2 | 18 (22.5) | 4 | 14 | |
| G3 | 46 (57.5) | 8 | 38 | |
| Histological type | ||||
| Papillary type | 4 (5.0) | 1 | 3 | 0.995 |
| Tubular type | 27 (33.7) | 7 | 20 | |
| Poorly differentiated type | 24 (30.0) | 7 | 17 | |
| Signet Ring type | 9 (11.3) | 2 | 7 | |
| Mucinous type | 16 (20.0) | 4 | 12 | |
| Venous invasion | ||||
| No | 70 (87.5) | 17 | 53 | 0.501 |
| Yes | 10 (12.5) | 4 | 6 | |
| Lymphatic invasion | ||||
| No | 56 (70.0) | 16 | 40 | 0.471 |
| Yes | 24 (30.0) | 5 | 19 | |
Immunohistochemistry and clinical analysis of CCDC80 in GC. (A) Representative Immunohistochemistry image of CCDC80 and subcellular staining localization in GC and adjacent non-tumor tissue specimens. (B) The representative staining of low and high CCDC80 expression. (C) The expression of CCDC80 in GC tissue was higher than adjacent non-tumor tissue (p = 0.001). (D) Receiver-operator characteristics curve. Comparison of clinical stage (E), T stage (F), N stage (G) and grade (H) in low and high CCDC80 expression groups. (I) OS analysis revealed that high CCDC80 expression indicates a poor prognosis (p <0.001). (J) The forest plot of multivariate Cox regression.
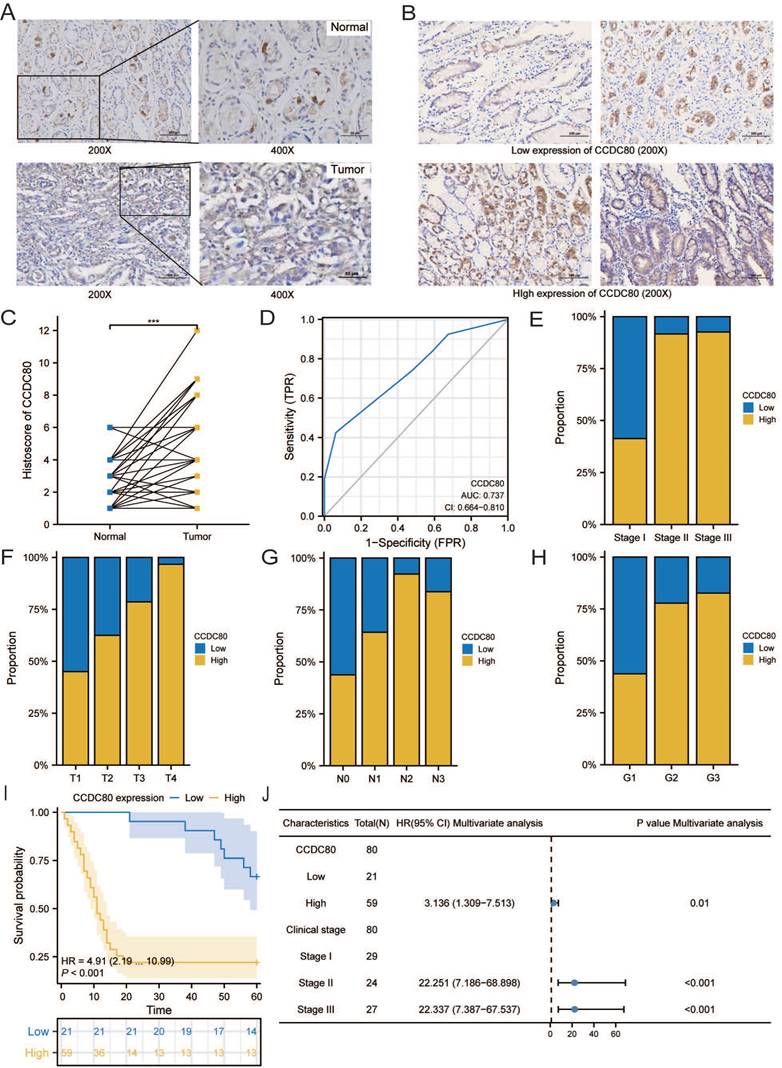
Subsequently, we analyzed the distribution of different clinical characteristics in the high and low CCDC80 expression groups. As shown in Figure 11E-H, the proportion of patients with Stage I in the high CCDC80 expression group was lower than 50%, whereas that of patients with Stages II and III was approximately 90%. Furthermore, we found that CCDC80 expression was higher in patients with a higher degree of malignancy. Survival analysis based on the histoscore of CCDC80 indicated that patients with relatively high CCDC80 expression had poorer OS than those with low CCDC80 expression (p < 0.001) (Figure 11I). Multivariate Cox regression indicated that clinical stage (p < 0.001) and CCDC80 expression level (HR = 3.316; 95% CI [1.309-7.531]; p = 0.01) were prognostic factors independently correlated with poor OS (Figure 11J; Table 4).
Univariate and multivariate Cox regression analyses incorporating clinicopathological characteristics of patients from The First Hospital of China Medical University.
| Characteristics | Total(N) | Univariate analysis | Multivariate analysis | |||
|---|---|---|---|---|---|---|
| Hazard ratio (95% CI) | P value | Hazard ratio (95% CI) | P value | |||
| CCDC80 | 80 | |||||
| Low | 21 | Reference | ||||
| High | 59 | 4.910 (2.194-10.989) | <0.001 | 3.136 (1.309-7.513) | 0.010 | |
| Age | 80 | |||||
| <60 | 43 | Reference | ||||
| ≥60 | 37 | 0.910 (0.530-1.564) | 0.733 | |||
| Clinical stage | 80 | |||||
| Stage I | 29 | Reference | ||||
| Stage II | 24 | 23.788 (7.942-71.253) | <0.001 | 22.251 (7.186-68.898) | <0.001 | |
| Stage III | 27 | 25.072 (8.448-74.408) | <0.001 | 22.337 (7.387-67.537) | <0.001 | |
| Pathologic differentiation | 80 | |||||
| G1 | 16 | Reference | ||||
| G2 | 18 | 1.679 (0.716-3.940) | 0.234 | |||
| G3 | 46 | 1.553 (0.738-3.271) | 0.246 | |||
| Venous invasion | 80 | |||||
| No | 70 | Reference | ||||
| Yes | 10 | 1.236 (0.583-2.623) | 0.581 | |||
| Lymphatic invasion | 80 | |||||
| No | 56 | Reference | ||||
| Yes | 24 | 0.737 (0.400-1.359) | 0.328 | |||
Discussion
Gastric cancer (GC) is one of the most common and deadly malignancies worldwide, significantly impacting human health and quality of life. The high mortality rate is primarily due to late-stage diagnosis and limited effective treatment options[36]. Therefore, studying the biological behavior and molecular mechanisms of GC is of considerable significance for accurately predicting prognosis and screening novel targets of GC.
This study analyzed GC data from TCGA and GEO databases using unsupervised clustering of LMRGs and defined three subgroups, and then we focused on the CCDC80 gene and its relationship with immune cell infiltration, drug sensitivity, and clinical prognosis in GC. Previous research has highlighted the role of metabolic reprogramming and immune microenvironment in cancer progression and treatment response[7, 37]. Our research aims to uncover potential mechanisms and therapeutic targets that could enhance the diagnosis and treatment of GC, offering promising avenues for personalized medicine and improved clinical outcomes.
CCDC80 expression is closely related to patient prognosis in various malignant tumors. For example, overexpression of CCDC80 suppresses epithelial-mesenchymal transition (EMT) and cell migration in pancreatic cancer[15]. Additionally, in colorectal cancer, CCDC80 acted as a suppressor of tumor growth, with research indicating that it involved the phosphorylation of ERK[14]. However, in our study, high CCDC80 expression is associated with poor overall survival (OS) in GC patients, suggesting that CCDC80 may play different roles in various types of tumors. The correlation analysis between CCDC80 and clinical pathological parameters showed that CCDC80 expression was related to T and pathological stages. However, the expression of CCDC80 did not significantly differ among the different N stages. Therefore, we hypothesized that CCDC80 might affect the prognosis of GC by affecting tumor growth.
Additionally, CCDC80's positive correlation with LDHA and negative correlation with LDHB, although weak, implies its involvement in lactate metabolism, potentially influencing the tumor microenvironment and cancer cell metabolism. LDHA is a key enzyme in the glycolytic pathway, catalyzing the conversion of pyruvate to lactate. LDHB is another isoform of lactate dehydrogenase that preferentially converts lactate to pyruvate, playing a crucial role in lactate metabolism[38]. Understanding the interplay among CCDC80, LDHA and LDHB could provide insights into the metabolic reprogramming of cancer cells and identify novel targets for therapeutic intervention aimed at restoring normal metabolic processes and enhancing anti-tumor immunity.
Glycogen phosphorylase L (PYGL) is a key enzyme in glycogen metabolism, which is upregulated under hypoxic conditions through the HIF-1α pathway, thereby promoting glycogen breakdown and glycolysis, providing energy support for cells in hypoxic environments[39]. FAD-dependent oxidoreductase domain containing 1 (FOXRED1) is an important enzyme involved in mitochondrial function and redox reactions. It can regulate the activity of mitochondrial respiratory chain complex I, thereby affecting cellular energy metabolism and oxidative stress response[40]. The correlation between CCDC80 and PYGL and FOXRED1 is stronger, which may suggest that CCDC80's impact on lactate metabolism may occur through multiple pathways, including glycogen metabolism and mitochondrial function.
To further explore the mechanisms of CCDC80 in GC, we applied GSEA to identify pathways enriched in CCDC80; the OXPHOS pathway and angiogenesis were identified in the low and high CCDC80 expression groups, respectively. Based on this, we speculated that CCDC80 overexpression might promote the Warburg effect and inhibit OXPHOS in tumor cells, leading to the production of more lactate, which promotes angiogenesis [41].
The gene's role in modulating immune checkpoints further underscores its importance, as increased expression of immune checkpoint molecules in the high CCDC80 expression group indicates a possible impact on immune evasion mechanisms. The tumor microenvironment (TME), which includes tumor cells, stromal cells, and multiple types of immune cells, plays a vital role in tumor progression and metastasis. In the tumor microenvironment, immune cells are inclined to promote tumor growth instead of exerting antitumor effects [42]. We further analyzed the relationship between CCDC80 and immune cell infiltration and observed that CCDC80 expression was significantly correlated with the infiltration of various immune cells, including mast cells, monocytes, and M2 macrophages. Lactate can promote macrophage polarization towards the M2 subtype [43]. Notably, the high CCDC80 expression group had statistically significantly higher levels of M2 macrophage infiltration than the low expression group. Therefore, high CCDC80 expression may potentially affect the TME through M2 macrophage polarization, which could promote tumor progression [44-46]. The dual role in immune modulation and metabolic regulation positions CCDC80 as a critical player in GC pathogenesis and a potential target for therapeutic intervention.
Paclitaxel is a common chemotherapy drug that exerts its function by blocking mitosis. However, paclitaxel resistance remains a crucial issue that requires resolution [47]. Our results revealed that high CCDC80 expression is related to decreased sensitivity to paclitaxel. However, no significant differences were found for cisplatin. The observed resistance to chemotherapeutic agents such as paclitaxel in high CCDC80 expression groups further highlights the need for targeted therapies that can overcome this resistance and improve patient outcomes. These findings may have significant consequences for personalized medicine.
Finally, we explored the mutation status of cancer-related genes, which may have an impact on treatment strategies [48]. TTN and MUC16 mutations are associated with GC prognosis [49]. In our study, the low CCDC80 expression group tended to have higher TTN and MUC16 mutation frequencies. The TMB was lower in the high CCDC80 expression group than in the low expression group. This was consistent with previous reports that patients with a higher TMB had better survival outcomes [50]. The lower TMB observed in high CCDC80 expression groups could imply a reduced likelihood of benefiting from such therapies, further emphasizing the need for personalized treatment strategies.
However, our study has the following limitations: First, the sample size, particularly for the clinical validation cohort from the First Hospital of China Medical University, is relatively small, which may limit the generalizability of the findings. Additionally, while we have corrected for batch effects, the use of multiple datasets from different sources (TCGA and GEO) could still introduce variability that may affect the results. Finally, the lack of extensive clinical validation and functional assays means that the clinical applicability of CCDC80 as a prognostic marker or therapeutic target in gastric cancer remains to be fully established.
In conclusion, our findings divided patients with GC into proliferation, EMT, and metabolic subtypes, and revealed that CCDC80 is a poor prognostic factor in GC and that CCDC80 may affect the prognosis of GC by regulating OXPHOS and lactate metabolism. Patients with higher CCDC80 expression tended to have drug resistance to paclitaxel. These results might help to guide and personalize patient anticancer treatment decisions.
Acknowledgements
The authors would like to acknowledge TCGA, GEO, TIMER data-bases for free use.
Author contributions
Xiang Li and Yaqi Du conceived and designed the study; Xiang Li con-tributed to date acquisition; Xiang Li and Yaqi Du analyzed data; Xiang Li and Yaqi Du wrote the manuscript. All authors read and approved the final manuscript.
Institutional review board statement
The study was conducted in accordance with the Declaration of Helsinki, and approved by the Ethics Committee of The First Hospital of China Medical University (AF-SOP-07-1.1-01).
Informed consent statement
Written informed consent has been obtained from the patient(s) to publish this paper.
Data availability statement
The datasets and R package listed in the current study are available from the corresponding author on reasonable request.
Competing Interests
The authors have declared that no competing interest exists.
References
1. Sung H, Ferlay J, Siegel RL, Laversanne M, Soerjomataram I, Jemal A. et al. Global Cancer Statistics 2020: GLOBOCAN Estimates of Incidence and Mortality Worldwide for 36 Cancers in 185 Countries. CA Cancer J Clin. 2021;71:209-49
2. Wagner AD, Syn NL, Moehler M, Grothe W, Yong WP, Tai BC. et al. Chemotherapy for advanced gastric cancer. Cochrane Database Syst Rev. 2017;8:CD004064
3. Song Z, Wu Y, Yang J, Yang D, Fang X. Progress in the treatment of advanced gastric cancer. Tumour Biol. 2017;39:1010428317714626
4. Niu D, Luo T, Wang H, Xia Y, Xie Z. Lactic acid in tumor invasion. Clin Chim Acta. 2021;522:61-9
5. Mendler AN, Hu B, Prinz PU, Kreutz M, Gottfried E, Noessner E. Tumor lactic acidosis suppresses CTL function by inhibition of p38 and JNK/c-Jun activation. Int J Cancer. 2012;131:633-40
6. Brand A, Singer K, Koehl GE, Kolitzus M, Schoenhammer G, Thiel A. et al. LDHA-Associated Lactic Acid Production Blunts Tumor Immunosurveillance by T and NK Cells. Cell Metab. 2016;24:657-71
7. Hanahan D, Weinberg RA. Hallmarks of cancer: the next generation. Cell. 2011;144:646-74
8. Gatenby RA, Gillies RJ. Why do cancers have high aerobic glycolysis? Nat Rev Cancer. 2004;4:891-9
9. Lu J, Tan M, Cai Q. The Warburg effect in tumor progression: mitochondrial oxidative metabolism as an anti-metastasis mechanism. Cancer Lett. 2015;356:156-64
10. Doherty JR, Cleveland JL. Targeting lactate metabolism for cancer therapeutics. J Clin Invest. 2013;123:3685-92
11. Liu J, Pan C, Guo L, Wu M, Guo J, Peng S. et al. A new mechanism of trastuzumab resistance in gastric cancer: MACC1 promotes the Warburg effect via activation of the PI3K/AKT signaling pathway. J Hematol Oncol. 2016;9:76
12. Aoki K, Sun YJ, Aoki S, Wada K, Wada E. Cloning, expression, and mapping of a gene that is upregulated in adipose tissue of mice deficient in bombesin receptor subtype-3. Biochem Biophys Res Commun. 2002;290:1282-8
13. Osorio-Conles O, Guitart M, Moreno-Navarrete JM, Escote X, Duran X, Fernandez-Real JM. et al. Adipose tissue and serum CCDC80 in obesity and its association with related metabolic disease. Mol Med. 2017;23:225-34
14. Grill JI, Neumann J, Herbst A, Hiltwein F, Ofner A, Marschall MK. et al. DRO1 inactivation drives colorectal carcinogenesis in ApcMin/+ mice. Mol Cancer Res. 2014;12:1655-62
15. Hong E, Park S, Ooshima A, Hong CP, Park J, Heo JS. et al. Inhibition of TGF-beta signalling in combination with nal-IRI plus 5-Fluorouracil/Leucovorin suppresses invasion and prolongs survival in pancreatic tumour mouse models. Sci Rep. 2020;10:2935
16. Ferraro A, Schepis F, Leone V, Federico A, Borbone E, Pallante P. et al. Tumor suppressor role of the CL2/DRO1/CCDC80 gene in thyroid carcinogenesis. J Clin Endocrinol Metab. 2013;98:2834-43
17. Pei G, Lan Y, Lu W, Ji L, Hua ZC. The function of FAK/CCDC80/E-cadherin pathway in the regulation of B16F10 cell migration. Oncol Lett. 2018;16:4761-7
18. Mounir M, Lucchetta M, Silva TC, Olsen C, Bontempi G, Chen X. et al. New functionalities in the TCGAbiolinks package for the study and integration of cancer data from GDC and GTEx. PLoS Comput Biol. 2019;15:e1006701
19. Oh SC, Sohn BH, Cheong JH, Kim SB, Lee JE, Park KC. et al. Clinical and genomic landscape of gastric cancer with a mesenchymal phenotype. Nat Commun. 2018;9:1777
20. Subhash VV, Yeo MS, Wang L, Tan SH, Wong FY, Thuya WL. et al. Anti-tumor efficacy of Selinexor (KPT-330) in gastric cancer is dependent on nuclear accumulation of p53 tumor suppressor. Sci Rep. 2018;8:12248
21. Qian Z, Zhu G, Tang L, Wang M, Zhang L, Fu J. et al. Whole genome gene copy number profiling of gastric cancer identifies PAK1 and KRAS gene amplification as therapy targets. Genes Chromosomes Cancer. 2014;53:883-94
22. Davis S, Meltzer PS. GEOquery: a bridge between the Gene Expression Omnibus (GEO) and BioConductor. Bioinformatics. 2007;23:1846-7
23. Liberzon A, Subramanian A, Pinchback R, Thorvaldsdottir H, Tamayo P, Mesirov JP. Molecular signatures database (MSigDB) 3.0. Bioinformatics. 2011;27:1739-40
24. Wilkerson MD, Hayes DN. ConsensusClusterPlus: a class discovery tool with confidence assessments and item tracking. Bioinformatics. 2010;26:1572-3
25. Yoshihara K, Shahmoradgoli M, Martinez E, Vegesna R, Kim H, Torres-Garcia W. et al. Inferring tumour purity and stromal and immune cell admixture from expression data. Nat Commun. 2013;4:2612
26. Hanzelmann S, Castelo R, Guinney J. GSVA: gene set variation analysis for microarray and RNA-seq data. BMC Bioinformatics. 2013;14:7
27. Ritchie ME, Phipson B, Wu D, Hu Y, Law CW, Shi W. et al. limma powers differential expression analyses for RNA-sequencing and microarray studies. Nucleic Acids Res. 2015;43:e47
28. Blanche P, Dartigues JF, Jacqmin-Gadda H. Estimating and comparing time-dependent areas under receiver operating characteristic curves for censored event times with competing risks. Stat Med. 2013;32:5381-97
29. Wu T, Hu E, Xu S, Chen M, Guo P, Dai Z. et al. clusterProfiler 4.0: A universal enrichment tool for interpreting omics data. Innovation (Camb). 2021;2:100141
30. Steen CB, Liu CL, Alizadeh AA, Newman AM. Profiling Cell Type Abundance and Expression in Bulk Tissues with CIBERSORTx. Methods Mol Biol. 2020;2117:135-57
31. Li T, Fu J, Zeng Z, Cohen D, Li J, Chen Q. et al. TIMER2.0 for analysis of tumor-infiltrating immune cells. Nucleic Acids Res. 2020;48:W509-W14
32. Zeng D, Ye Z, Shen R, Yu G, Wu J, Xiong Y. et al. IOBR: Multi-Omics Immuno-Oncology Biological Research to Decode Tumor Microenvironment and Signatures. Front Immunol. 2021;12:687975
33. Yang W, Soares J, Greninger P, Edelman EJ, Lightfoot H, Forbes S. et al. Genomics of Drug Sensitivity in Cancer (GDSC): a resource for therapeutic biomarker discovery in cancer cells. Nucleic Acids Res. 2013;41:D955-61
34. Mayakonda A, Lin DC, Assenov Y, Plass C, Koeffler HP. Maftools: efficient and comprehensive analysis of somatic variants in cancer. Genome Res. 2018;28:1747-56
35. Edge SB, Compton CC. The American Joint Committee on Cancer: the 7th edition of the AJCC cancer staging manual and the future of TNM. Ann Surg Oncol. 2010;17:1471-4
36. Smyth EC, Nilsson M, Grabsch HI, van Grieken NC, Lordick F. Gastric cancer. Lancet. 2020;396:635-48
37. Binnewies M, Roberts EW, Kersten K, Chan V, Fearon DF, Merad M. et al. Understanding the tumor immune microenvironment (TIME) for effective therapy. Nat Med. 2018;24:541-50
38. Guyon J, Fernandez-Moncada I, Larrieu CM, Bouchez CL, Pagano Zottola AC, Galvis J. et al. Lactate dehydrogenases promote glioblastoma growth and invasion via a metabolic symbiosis. EMBO Mol Med. 2022;14:e15343
39. Ji Q, Li H, Cai Z, Yuan X, Pu X, Huang Y. et al. PYGL-mediated glucose metabolism reprogramming promotes EMT phenotype and metastasis of pancreatic cancer. Int J Biol Sci. 2023;19:1894-909
40. Lemire BD. Evolution of FOXRED1, an FAD-dependent oxidoreductase necessary for NADH:ubiquinone oxidoreductase (Complex I) assembly. Biochim Biophys Acta. 2015;1847:451-7
41. Vegran F, Boidot R, Michiels C, Sonveaux P, Feron O. Lactate influx through the endothelial cell monocarboxylate transporter MCT1 supports an NF-kappaB/IL-8 pathway that drives tumor angiogenesis. Cancer Res. 2011;71:2550-60
42. Whiteside TL. The tumor microenvironment and its role in promoting tumor growth. Oncogene. 2008;27:5904-12
43. Romero-Garcia S, Moreno-Altamirano MM, Prado-Garcia H, Sanchez-Garcia FJ. Lactate Contribution to the Tumor Microenvironment: Mechanisms, Effects on Immune Cells and Therapeutic Relevance. Front Immunol. 2016;7:52
44. Fu XL, Duan W, Su CY, Mao FY, Lv YP, Teng YS. et al. Interleukin 6 induces M2 macrophage differentiation by STAT3 activation that correlates with gastric cancer progression. Cancer Immunol Immunother. 2017;66:1597-608
45. Li W, Zhang X, Wu F, Zhou Y, Bao Z, Li H. et al. Gastric cancer-derived mesenchymal stromal cells trigger M2 macrophage polarization that promotes metastasis and EMT in gastric cancer. Cell Death Dis. 2019;10:918
46. Zhang Y, Meng W, Yue P, Li X. M2 macrophage-derived extracellular vesicles promote gastric cancer progression via a microRNA-130b-3p/MLL3/GRHL2 signaling cascade. J Exp Clin Cancer Res. 2020;39:134
47. Kwon CH, Park HJ, Choi Y, Won YJ, Lee SJ, Park DY. TWIST mediates resistance to paclitaxel by regulating Akt and Bcl-2 expression in gastric cancer cells. Tumour Biol. 2017;39:1010428317722070
48. Hu H, Mu Q, Bao Z, Chen Y, Liu Y, Chen J. et al. Mutational Landscape of Secondary Glioblastoma Guides MET-Targeted Trial in Brain Tumor. Cell. 2018;175:1665-78 e18
49. Yang Y, Zhang J, Chen Y, Xu R, Zhao Q, Guo W. MUC4, MUC16, and TTN genes mutation correlated with prognosis, and predicted tumor mutation burden and immunotherapy efficacy in gastric cancer and pan-cancer. Clin Transl Med. 2020;10:e155
50. Devarakonda S, Rotolo F, Tsao MS, Lanc I, Brambilla E, Masood A. et al. Tumor Mutation Burden as a Biomarker in Resected Non-Small-Cell Lung Cancer. J Clin Oncol. 2018;36:2995-3006
Author contact
![]() Corresponding author: yqduedu.cn, ORCID: 0000-0002-0945-9972.
Corresponding author: yqduedu.cn, ORCID: 0000-0002-0945-9972.