Impact Factor ISSN: 1837-9664

 Global reach, higher impact
J Cancer 2024; 15(19):6434-6451. doi:10.7150/jca.98470 This issue Cite
Research Paper
IPCEF1: Expression Patterns, Clinical Correlates and New Target of Papillary Thyroid Carcinoma
Dechao Yin1,2, Kun Wang3, Junyu Zhao4, Jinming Yao4, Xiaofang Han2, Bo Yan2, Jianjun Dong5, Lin Liao1,4 ![]()
1. Department of Endocrinology and Metabology, Shandong Provincial Qianfoshan Hospital, Shandong University, Jinan, Shandong, China.
2. Department of Endocrinology and Metabology, The Second People's Hospital of Hefei, Hefei Hospital Affiliated to Anhui Medical University, Hefei, Anhui, China.
3. Department of Endocrinology and Metabology, Liaocheng People's Hospital, Liaocheng, Shandong, China.
4. Department of Endocrinology and Metabology, The First Affiliated Hospital of Shandong First Medical University & Shandong Provincial Qianfoshan Hospital, Jinan, Shandong, China.
5. Department of Endocrinology, Qilu Hospital of Shandong University, Jinan, Shandong, China.
Received 2024-5-15; Accepted 2024-9-26; Published 2024-10-21
Abstract

Introduction: Despite the generally favorable prognosis of PTC (Papillary Thyroid Carcinoma), it can still exhibit aggressive behavior and lead to patient mortality. IPCEF1 (interaction protein for cytohesin exchange factors 1) has emerged as a critical player in cell signaling related to proliferation and migration in cancer progression.
Objective: Our research aimed to determine whether IPCEF1 is a key gene in PTC, elucidate its possible molecular mechanisms and ultimately search for new targets.
Methods: This research utilized four gene expression array datasets and TCGA database to examine the role of IPCEF1 in PTC. Differential gene expression analysis, survival analysis, KEGG and GO enrichment and immune cell infiltration correlations were realized by bioinformatic methods. The expressions of IPCEF1 in PTC tissues were examined by IHC and the proliferation, migration, cell cycles of PTC cells were examined by CCK8, transwell and flow cytometry.
Results: IPCEF1 had lower expression in PTC tumor tissues and its lower expression might lead to worse T/N stage and DFS/ PFS, which is perhaps related to its regulation of the JAK/STAT signaling pathway and immune microenvironment (macrophage and Tregs). IPCEF1 reduced the proliferation and migration ability of PTC cells, which is consistent with our clinical observations. Besides, we also found that high expression level of IPCEF1 lead to cell cycle arrest in the S or G2 phase, which ultimately reduced cell growth and proliferation.
Conclusion: IPCEF1 is a cancer suppressor gene in the progression of PTC, influencing patient survival and prognosis through modulation of immune infiltration and signaling pathways.
Keywords: papillary thyroid carcinoma, IPCEF1, JAK/STAT signaling pathway, immune infiltration, prognosis, therapeutic targets
Introduction
Papillary Thyroid Cancer (PTC), accounting for approximately 90% of all thyroid cancers, is a prevalent endocrine malignancy with an incidence that has been increasing in recent years [1]. The increase in thyroid cancer incidence was almost entirely due to the increase of PTC. The reasons behind the increase are complex, multifactorial, and incompletely understood. Despite the generally indolent nature of PTC and its relatively low mortality rate, the 10-year rates for local recurrence and distant metastasis remain concerning, at approximately 20% and 10%, respectively, significantly affecting patient survival [2,3]. In the realm of advanced thyroid cancers, including recurrent or metastatic cases, the landscape of targeted therapies has evolved rapidly, and China has seen the approval of various targeted drugs with distinct mechanisms of action for these malignancies [4]. However, the severe adverse effects associated with such therapies have curtailed their broader application, necessitating the pursuit of new therapeutic targets and agents.
Emerging evidence has spotlighted the critical role of IPCEF1 (interaction protein for cytohesin exchange factors 1) in various physiological and pathological processes. This protein is recognized for its intricate involvement in cell signaling pathways, particularly those related to cell proliferation and migration [5]. Recent studies have suggested a possible link between IPCEF1 and cancer progression, although the exact mechanisms and implications remain largely unexplored [6-8]. Notably, the involvement of IPCEF1 in thyroid papillary carcinoma remains an uncharted territory deserving of comprehensive investigation.
Our research aimed to determine whether IPCEF1 is a key gene in PTC through the analysis of multiple gene expression array datasets, verification of its expression in clinical tissues, exploring the impact of its expression level on the proliferation, migration, cell cycle of PTC cells, elucidating its possible molecular mechanisms and ultimately searching for new targets.
Materials and methods
Data collection and microarray data
The GEO database (https://www.ncbi.nlm.nih.gov/geo/) [9] was utilized to access public studies available up to September 15, 2023. The search employed the following keywords: “papillary thyroid cancer,” “Homo sapiens” (as the organism), and “array expression profile” (as the research type). The inclusion criteria were: (1) patients diagnosed with PTC; (2) gene expression profiling of mRNA; and (3) availability of sufficient information for analysis. Following a systematic review, four gene expression profiles (GSE29265, GSE60542, GSE151179, and GSE33630) were selected for analysis. The platforms used for gene profiling of these datasets were GPL570 (for GSE29265, GSE60542, and GSE33630) and GPL23159 (for GSE151179), all of which are Affymetrix microarrays.
Data analyses of differentially expressed genes (DEGs)
Microarray data were acquired from the GEO database. The raw data were downloaded in MINiML file format. Differential expression analysis of mRNA was conducted using the limma package within R software [10]. The adjusted P-value was calculated to mitigate false positives in the GEO datasets, with thresholds set at “Adjusted P<0.05” and a log-fold change greater than 1 or less than -1 to define significant differential expression. The Sangerbox tool (http://sangerbox.com/) [10] facilitated the identification of common DEGs across the four datasets and the creation of Venn diagrams.
Expression of DEGs in THCA
Following the identification of DEGs in the GEO datasets, we analyzed the expression levels of these genes in thyroid cancer within the TCGA database. This included an examination of DEG expression across various tumor grades (T grades), nodal involvement (N grades), and TNM stages. RNA-sequencing data (level 3) and corresponding clinical information for thyroid carcinoma (THCA) were sourced from the TCGA database (https://portal.gdc.cancer.gov). Concurrently, the latest GTEx datasets (V8) were retrieved from the GTEx portal (https://www.gtexportal.org/home/datasets). All statistical analyses were performed using R software version 4.0.3 (R Foundation for Statistical Computing, Vienna, Austria), considering a P-value <0.05 as indicative of statistical significance. Data visualization, including the generation of Venn diagrams, was achieved using the “ggplot2” R package and the Sangerbox software [11].
Survival analysis of DEGs in THCA
Kaplan-Meier (KM) survival analysis and the log-rank test were employed to compare the survival differences between two groups, considering overall survival (OS), disease-free survival (DFS), and progression-free survival (PFS). For the Kaplan-Meier curves, p-values and hazard ratios (HR) with 95% confidence intervals (CI) were calculated using log-rank tests and univariate Cox proportional hazards regression models. All analytical methods and R package implementations were conducted using R software version 4.0.3 (The R Foundation for Statistical Computing, 2020). A p-value of less than 0.05 was considered statistically significant.
Immunohistochemical analysis (IHC)
The expression of IPCEF1 was examined in tumor tissues (20 samples) and adjacent normal tissues (20 samples) from 20 PTC patients, acquired from The Second People's Hospital of Hefei. Tissue sections (4 μm thick) from formalin-fixed, paraffin-embedded (FFPE) samples were deparaffinized in xylene and rehydrated through an ethanol-water gradient. Antigen retrieval was performed under high temperature and pressure for 15 minutes using an antigen repair solution. Sections were then incubated with 3% hydrogen peroxide for 10 minutes to quench endogenous peroxidase activity. Overnight incubation with IPCEF1 antibody (1:50, ab272599, Abcam, Cambridge, USA) was carried out at 4°C. Following PBS washes, slides were incubated with goat anti-rabbit secondary antibody conjugated to peroxidase (1:100, ab205718, Abcam, Cambridge, USA) at 37°C for 30 minutes. Peroxidase activity was visualized using DAB Peroxidase Substrate (DA1010, Solarbio, Beijing), and slides were subsequently counterstained with hematoxylin. The protocol was approved by the Research Ethics Committee of The Second People's Hospital of Hefei, Anhui, China, and informed consent was obtained from all patients.
Cell culture
BHP10-3 and TPC-1 were given away from Endocrinology Laboratory of Shandong Province Qianfoshan Hospital. Cells were cultured in DMEM medium (Gibco, 11995065) supplemented with 10% fetal bovine serum (Abwbio, AB-FBS0500) in 5% CO2 and 37°C.
Reagents
The following antibodies were used, E-cadherin (20874-1-AP), N-cadherin (22018-1-AP), MMP9 (10375-2-AP), SNAL1(13099-1-AP), P21 (10355-1-AP), GAPDH (60004-1-Ig) were purchased from Proteintech (Wuhan, China). P27 (ET1608-61), cdc2 (ET1605-54), Cyclin B1 (ET1608-27), Cyclin D1 (ET1601-31), were purchased from huabio (Hangzhou, China). IPCEF1 (ab272599), Cdc25C (ab32444) and the secondary antibodies (ab205718, ab205719) were procured from Abcam (Cambridge, UK).
Lentiviral transfection
Cells were seeded in a 6-well plate at a density of 5×10⁴ cells per well and incubated for 24 hours. When the cell confluence reached 30%, TPC-1/BHP10-3 cells were separately infected with overexpressed/RNA interference lentiviruses targeting IPCEF1. After 16 hours of infection, the medium was replaced with complete culture medium and cells were further cultured for 72 hours. Infection efficiency was assessed, and cells were selected with 2 μg/mL puromycin (Abcam, ab141453) to ensure the establishment of stable IPCEF1-interfered cell lines.
CCK-8 assay
Cells were seeded in a 96-well plate at a density of 3000 cells per well, with medium changed every 2 days. At fixed time intervals, 10% CCK-8 reagent (Beyotime, C0039) was added and incubated at 37°C for 2 hours. The OD value was measured at a wavelength of 450 nanometers using a microplate reader. Cell growth was monitored continuously for 7 days to analyze cell proliferation.
Colony formation
Cells were seeded in a 6-well plate at a density of 600 cells per well, with medium changed every 3 days. After 2 weeks, cells were fixed with 4% paraformaldehyde for 30 minutes, stained with 0.1% crystal violet (Solarbio, G1063) for 15 minutes, and the survival rate of clones was calculated.
Cell migration assay
Cells in the logarithmic growth phase were digested and resuspended in serum-free medium to a final volume. The cell density was adjusted to 5 × 10⁵ cells/mL. 200 μL of cell suspension was added to the upper chamber of a Transwell, while medium containing 10% FBS was added to the lower chamber of a 24-well plate, and co-cultured for 24 hours. Subsequently, the cells were fixed with a 4% paraformaldehyde solution for 30 minutes, the upper chamber cells were removed, and the migratory cells on the bottom of the Transwell were stained with crystal violet. Five fields of view were examined under a microscope after staining to analyze the migration rate.
Western blot analysis
Cellular proteins were lysed and collected using RIPA lysis buffer containing a protease inhibitor (Beyotime, P1045). The protein concentration was determined using a BCA protein quantification kit (Beyotime, P0010). Following separation by SDS-PAGE (10%), the protein samples were transferred onto a PVDF membrane (Millipore, ISEQ00010). The membrane was then incubated in 5% blocking solution for 1 hour, followed by overnight incubation at 4°C with the primary antibody of interest, and subsequent 1h incubation at room temperature with the secondary antibody. Protein bands were visualized and analyzed using the ECL chemiluminescence method (Beyotime, P0018M).
Cell cycle analysis
After incubating the cells in a 6-well plate for 24 hours, they were harvested using trypsin without EDTA, washed with PBS, and centrifuged at 1000 rpm for 5 minutes. The cells were then fixed in 70% ice-cold ethanol for 24 hours, washed with PBS to remove the fixative, and resuspended in 100 μl RNase A before being incubated in a 37°C water bath for 30 minutes. Subsequently, 400 µl of PI staining solution was added, mixed thoroughly, and incubated in the dark at 4°C for 30 minutes. The cell cycle was then analyzed using flow cytometry.
Correlation analysis and KEGG pathway, GO enrichment of top 50 genes
Correlation between two genes was assessed using the ggstatsplot package in R software. Spearman's correlation analysis was utilized to evaluate the association between quantitative variables that do not follow a normal distribution. P-values less than 0.05 were deemed statistically significant (*P < 0.05). The top 50 genes were selected for further Kyoto Encyclopedia of Genes and Genomes (KEGG) and Gene Ontology (GO) analyses.
KEGG (www.kegg.jp/kegg/kegg1.html) [12] and DAVID [13] databases were utilized for conducting KEGG pathway and Gene Ontology (GO) enrichment analyses. GO analysis encompassed three domains: biological process, cellular component, and molecular function. The criteria for selection included a minimum of 2 differentially expressed genes (DEGs) per term, with a threshold for statistical significance set at P < 0.05.
Immune analysis
For robust immune score evaluation, we applied the “immuneeconv” R package, which amalgamates six of the most recent algorithms-TIMER, xCell, MCP-counter, CIBERSORT, EPIC, and QuanTIseq. Each of these algorithms has been benchmarked and offers unique advantages. In this study, the CIBERSORT algorithm was specifically used to calculate the immune cell scores. The “ggstatsplot” package in R software facilitated the creation of correlation plots between gene expression and immune scores. Spearman's correlation analysis was employed to describe the associations between quantitative variables that deviated from normal distribution. P-values less than 0.05 were considered statistically significant (*P<0.05). All analyses and visualization, including the use of the “ggplot2” and “heatmap” packages, were performed with R version 4.0.3, provided by the R Foundation for Statistical Computing (2020).
Statistical analysis
For categorical data, the chi-square test was used to compare proportions. The comparison of means for normally distributed data was conducted using an independent-samples t-test for two-group comparisons or one-way ANOVA for multi-group comparisons. Non-parametric tests were employed for data that did not conform to normal distribution. All statistical analyses were conducted using SPSS software version 26.0, and GraphPad Prism version 8.0 was utilized for graphical representations.
Results
Significantly DEGs between tumor and adjacent normal tissues of PTC in GEO database
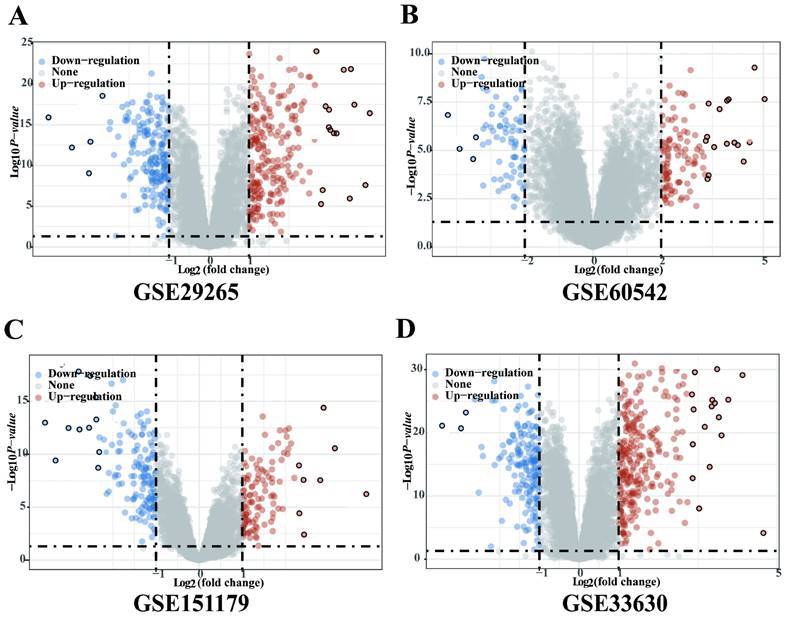
Four gene expression profiles (GSE29265, GSE60542, GSE151179 and GSE33630) were identified from the GEO database. The GSE29265 dataset contained 20 PTC tissues samples and 10 normal thyroid samples; the GSE60542 dataset included 33 PTC tissues samples and 30 normal thyroid samples; the GSE151179 dataset included 39 PTC tissues samples and 13 normal thyroid samples; the GSE33630 dataset included 49 PTC tissues samples and 43 normal thyroid samples. There were 250 upregulated and 206 downregulated DEGs in GSE29265, 225 upregulated and 188 downregulated DEGs in GSE60542, 117 upregulated and 146 downregulated DEGs in GSE151179, 270 upregulated and 170 downregulated DEGs in GSE33630 (Figure 1A-D).
Significantly DEGs between tumor and adjacent normal tissues of PTC in GEO database. (A) Volcano plot for DEGs of GSE29265. (B) Volcano plot for DEGs of GSE60542. (C) Volcano plot for DEGs of GSE151179. (D) Volcano plot for DEGs of GSE33630.The x-axis shows the fold-change in gene expression between different samples, and the y-axis shows statistical significance of the differences. Significantly Up- and Down-regulated genes are filtered (|log2 (Fold Change)| > 1, P < 0.05) and highlighted in red and blue dots, respectively.
The expression of 12 intersection genes of PTC in GSE29265, GSE60542, GSE151179 and GSE33630
Then we found 12 significantly differentially expressed genes between PTC tissues samples and normal samples (Figure 2A) by overlapping the DEGs of the 4 GEO datasets. The 12 intersection genes were DPP4, LRP4, IPCEF1, CDH3, KCNJ2, TFF3, CLDN1, GABRB2, GLT8D2, TPO, FN1 and DIO1.Next, we analyzed the trend of discrepancies of the 12 genes in GSE29265, GSE60542, GSE151179 and GSE33630. The results showed that the expression of IPCEF1, TFF3, GLT8D2, TPO and DIO1 were downregulated in the tumor group and DPP4, LRP4, CDH3, KCNJ2, CLDN1, GABRB2, FN1 were upregulated in the tumor group (Figure 2B-E).
The expression of 12 intersection genes of PTC in GSE29265, GSE60542, GSE151179, GSE33630 and TCGA database. (A) Venn diagrams of common DGEs combined with four datasets (GSE29265, GSE60542, GSE151179 and GSE33630). (B) The expression of 12 intersection genes of PTC in GSE29265. (C) The expression of 12 intersection genes of PTC in GSE60542. (D) The expression of 12 intersection genes of PTC in GSE151179. (E) The expression of 12 intersection genes of PTC in GSE33630. (F) The expression of 12 intersection genes of PTC in TCGA database (*P < 0.05; **P < 0.01; and ***P < 0.001).
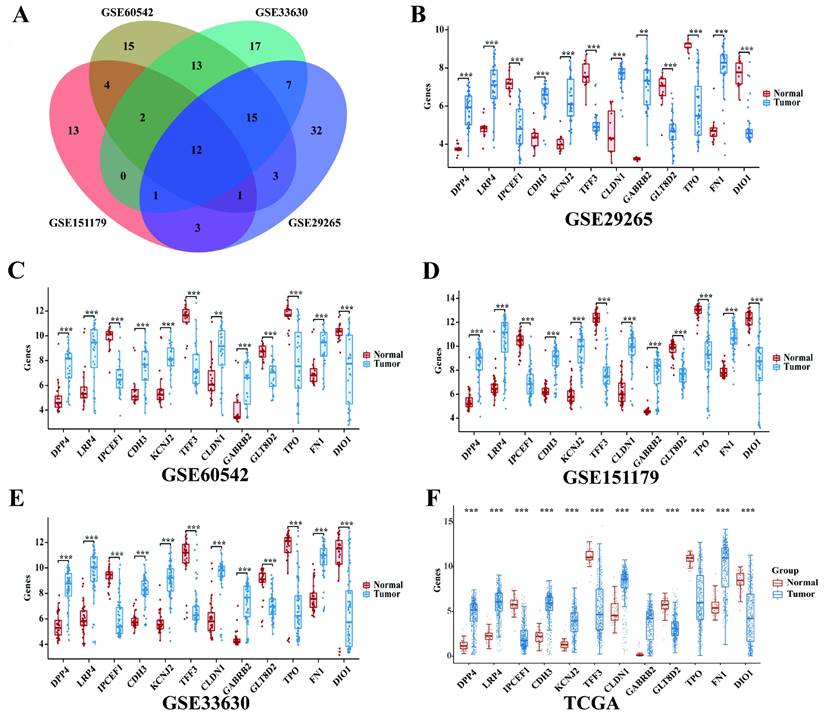
The mRNA expressions of 12 intersection genes were also analyzed in 397 cases of PTC tumor samples and 59 cases of normal thyroid samples. The results showed that all of the 12 intersection genes were significantly differentially expressed between PTC and normal samples and the trend of discrepancies was consistent with that in the GEO database (Figure 2F).
DPP4, IPCEF1, TFF3, GABRB2, TPO, FN1 and DIO1 might play critical oncogenic roles in PTC progression
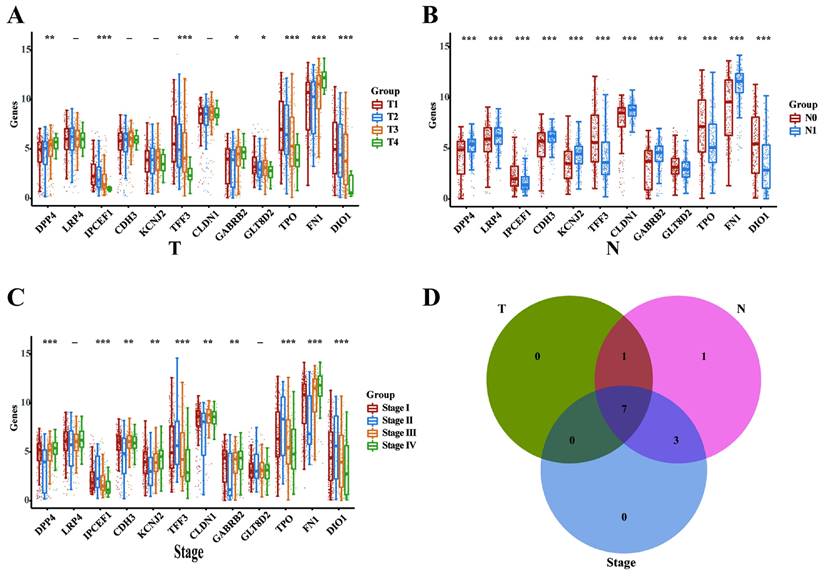
Subsequently, we analyzed the mRNA expression levels of the 12 intersecting genes across various clinicopathological stages in the THCA database, encompassing T, N, and TNM categories. In the T categories (T1, T2, T3, and T4), we identified 8 DEGs (DPP4, IPCEF1, TFF3, GABRB2, GLT8D2, TPO, FN1, and DIO1; Figure 3A). In the N categories (N0 and N1), we delineated 12 DEGs (DPP4, LRP4, IPCEF1, CDH3, KCNJ2, TFF3, CLDN1, TPO, FN1, DIO1; Figure 3B). In the TNM categories, 10 DEGs were identified (DPP4, LRP4, IPCEF1, CDH3, KCNJ2, TFF3, CLDN1, TPO, FN1, and DIO1; Figure 3C). Finally, the intersection of the three sets of DEGs (Figure 3D) revealed that 7 genes (DPP4, IPCEF1, TFF3, GABRB2, TPO, FN1, and DIO1) may play critical oncogenic roles in PTC progression.
DPP4, IPCEF1, TFF3, GABRB2, TPO, FN1 and DIO1 might play critical oncogenic roles in PTC progression (TCGA). (A) The mRNA expressions of the 12 intersection genes in various T stages (8 DEGs). (B) The mRNA expressions of the 12 intersection genes in various N stages (12 DEGs). (C) The mRNA expressions of the 12 intersection genes in various TNM stages (10 DEGs). (D) The intersect of the three sets of DEGs (7 DEGs). (*P < 0.05; **P < 0.01; and ***P < 0.001).
Low expression of IPCEF1 might lead to poor prognosis in PTC patients
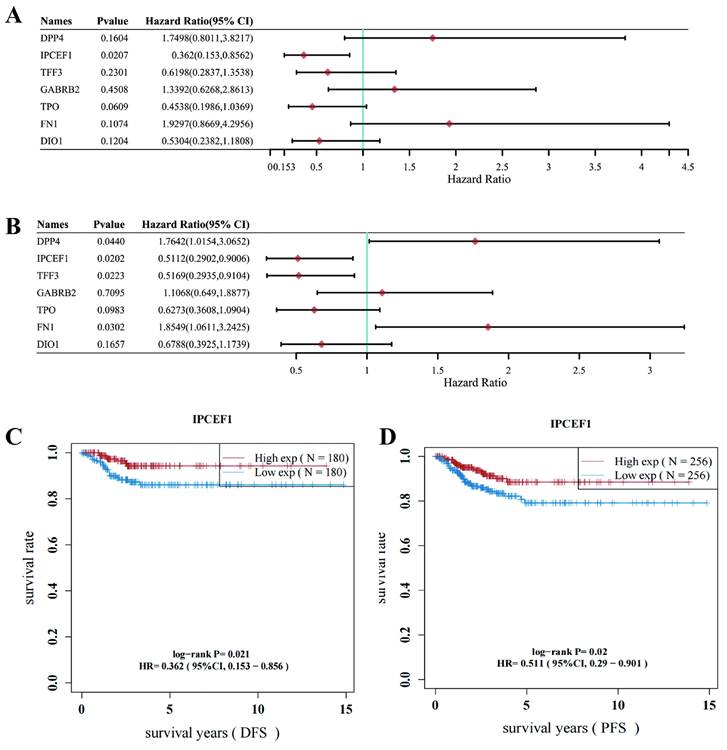
The Disease-Free Survival (DFS) and Progression-Free Survival (PFS) of the 7 DEGs associated with PTC were further analyzed. Survival analysis revealed that IPCEF1 was the sole gene displaying a significant difference in DFS for PTC, while two genes (IPCEF1 and TFF3) showed significant differences in PFS for PTC within the THCA database (Figures 4A-B). Consequently, IPCEF1, which exhibited differences in both DFS and PFS, was chosen as the target gene for our study. Additionally, we presented the results of the survival analysis (DFS and PFS) for IPCEF1 in Figures 4C and 4D, indicating that low expression of IPCEF1 may be associated with a poor prognosis in PTC patients.
Low expression of IPCEF1 might lead to poor prognosis in PTC patients (TCGA). (A) Forest plot of Disease-Free Survival (DFS) analysis of 7 DEGs for PTC patients. (B) Forest plot of Progression-Free Survival (PFS) analysis of 7 DEGs for PTC patients. (C) Disease-Free Survival (DFS) analysis curve of IPCEF1 in PTC. (P < 0.05) (D) Progression-Free Survival (PFS) analysis curve of IPCEF1 in PTC (P < 0.05).
IPCEF1 expression was lower in PTC and was related to clinicopathological features
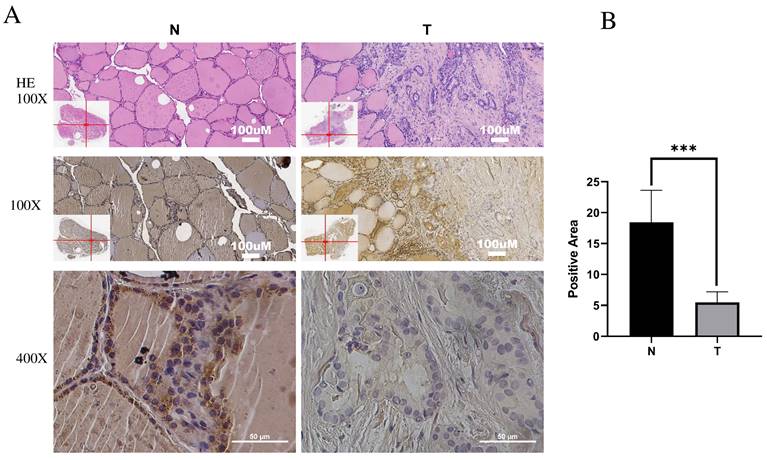
Immunohistochemistry (IHC) was employed to investigate IPCEF1 expression in PTC tissues. The results indicated that IPCEF1 localization was primarily observed in the cell membrane and cytoplasm (Figure 5A). Subsequently, quantification of IHC-positive areas was conducted using ImageJ analysis software and IHC_Profiler. IHC analysis revealed that the positive staining area in PTC sections (5.48%) was significantly lower than in normal tissue (18.44%; Figure 5B, P <0.01), suggesting a reduced expression of IPCEF1 in PTC tissues. This observation supports the hypothesis that reduced IPCEF1 expression could contribute to PTC tumorigenesis.
Low expression of IPCEF1 in PTC. (A) IPCEF1 expression in tumor and adjacent normal tissues of PTC by immunohistochemistry. HE, (the first line), Magnification, x100 (the second line) and x400 (the third line). (B) Quantification of positive-staining for IPCEF1 in thyroid cancer tissues of tumor and adjacent normal tissues of PTC (***P < 0.001).
We then analyzed the association between IPCEF1 expression levels and clinicopathological characteristics of PTC from TCGA database (Table 1). Patients with PTC were categorized based on low and high IPCEF1 expression levels to assess their correlation with clinicopathological parameters, such as age, gender, N stage, T stage, M stage, and overall TNM stage. The analysis showed no significant differences in age and gender distributions between the low and high IPCEF1 expression groups. Notably, in the low IPCEF1 expression group, a significantly greater percentage of patients had advanced T stage (III-IV), lymph node metastases (N1), and higher TNM stages (III-IV) compared to early T stage (I-II), no lymph node metastases (N0), and lower TNM stages (I-II), respectively. The observed correlations between IPCEF1 expression and the clinicopathological characteristics of PTC suggest that lower IPCEF1 levels may be indicative of a higher PTC grade and the presence of lymph node metastases.
The association between IPCEF1 expression levels and clinicopathological characteristics of PTC (TCGA).
| IPCEF1 High expression (N=199) | IPCEF1 Low expression (N=198) | Total | Chi-square | P | |
|---|---|---|---|---|---|
| (N=397) | |||||
| Age | 3.099 | 0.078 | |||
| >45 year | 95 (12.59%) | 112 (17.38%) | 119 (29.97%) | ||
| ≤45 year | 104 (37.53%) | 86 (32.49%) | 278 (70.03%) | ||
| Gender | 1.608 | 0.205 | |||
| Male | 49 (12.34%) | 60 (15.11%) | 109 (27.46%) | ||
| Female | 150 (37.78%) | 138 (34.76%) | 288 (72.54%) | ||
| T | 14.36 | 0.0025 | |||
| I | 74 (18.23%) | 59 (14.53%) | 111 (32.76%) | ||
| II | 65 (16.01%) | 57 (14.04%) | 123 (30.05%) | ||
| III | 54 (13.30%) | 84 (20.69%) | 138 (34.09%) | ||
| IV | 2 (0.49%) | 11 (2.71%) | 13 (3.2%) | ||
| I~II | 139 (35.01%) | 97 (24.43%) | 236 (59.44%) | 17.91 | <0.0001 |
| III~IV | 60 (15.11%) | 101 (25.44%) | 161 (40.56%) | ||
| N | 16.751 | <0.0001 | |||
| N0 | 110 (27.71%) | 68 (17.13%) | 178 (44.84%) | ||
| N1 | 89(22.42%) | 130 (32.75%) | 219 (55.16%) | ||
| M | -- | 0.3718 | |||
| M0 | 198 (49.87%) | 195 (49.12%) | 393 (98.99%) | ||
| M1 | 1 (0.25%) | 3 (0.76%) | 4 (1.01%) | ||
| Stage (TNM) | 17.26 | 0.0006 | |||
| I | 127 (32.23%) | 96 (24.37%) | 223 (55.6%) | ||
| II | 17 (4.32%) | 12 (3.05%) | 29 (7.37%) | ||
| III | 41 (10.41%) | 52 (13.2%) | 93 (23.61%) | ||
| IV | 13 (3.3%) | 36 (9.14%) | 49 (12.44%) | ||
| I~II | 144 (36.27%) | 110 (27.71%) | 254 (63.98%) | 12.161 | 0.0005 |
| III~IV | 55 (13.85%) | 88 (22.17%) | 143 (36.02%) |
The expression level of IPCEF1 could influence the proliferative capacity of PTC cells
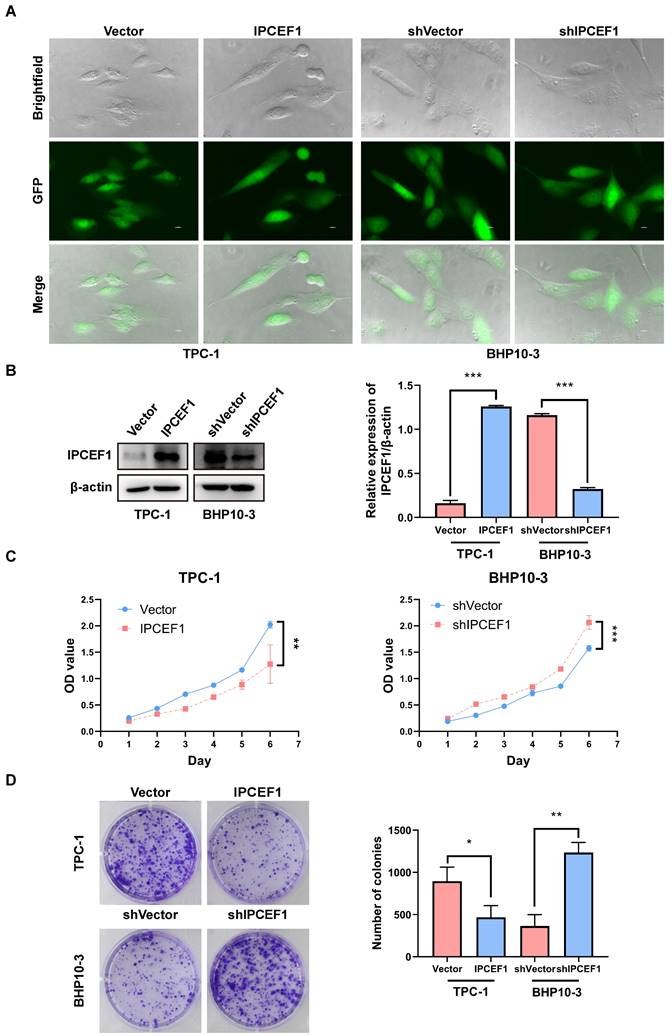
Preliminary observation of GFP fluorescence confirmed successful transfection of IPCEF1 in PTC cell lines (Figure 6A). Western blot analysis revealed elevated levels of IPCEF1 expression in the IPCEF1 group (which was infected with overexpressed lentiviruses targeting IPCEF1) compared to Vector cells, while the shIPCEF1 group (which was infected with RNA interference lentiviruses targeting IPCEF1) displayed the opposite trend (Figure 6B). CCK8 results showed that overexpression of IPCEF1 reduced the proliferation of PTC cells, while silencing low expression of IPCEF1 significantly promoted the proliferation of PTC cells (Figure 6C). Colony formation experiments compared the clonogenic capacity of cells in each group (Figure 6D), where the IPCEF1 group exhibited significantly fewer colony numbers than the Vector group, and the shIPCEF1 group had more colonies, consistent with the growth curve data mentioned earlier.
The expression level of IPCEF1 influences the proliferative capacity of PTC cells. (A) Transfection of cells observed through fluorescence. (B) Transfection efficiency of cells detected by Western Blot. (C) Impact of IPCEF1 gene alterations on the proliferation of thyroid cancer cells assessed using the CCK8 assay. (D) Influence of IPCEF1 gene alterations on cell colony formation examined through crystal violet staining. (*P < 0.05, **P < 0.01, ***P < 0.001).
The expression level of IPCEF1 could influence the migration ability of PTC cells
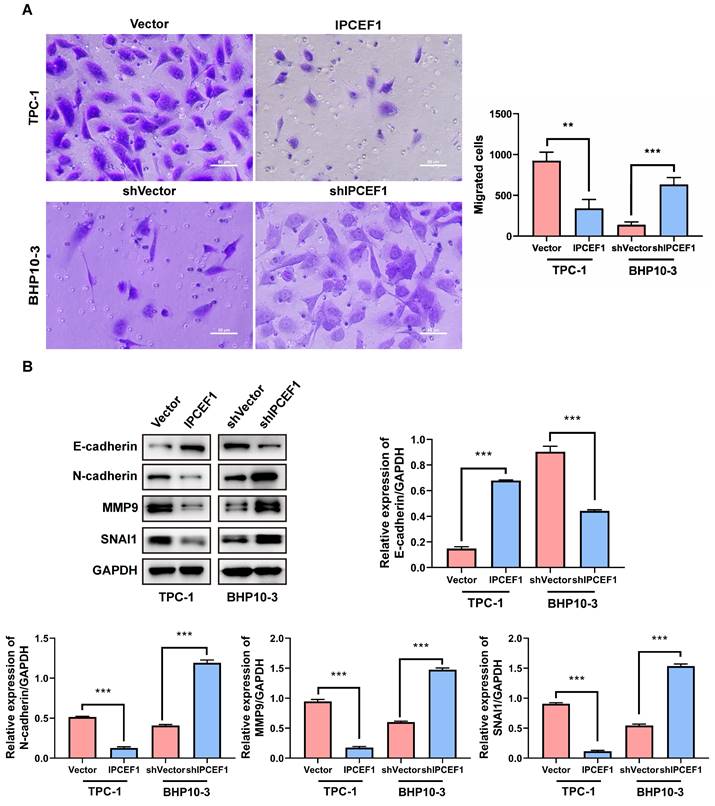
The transwell experiment was employed to examine the changes in cell migration ability following alterations in IPCEF1 expression levels. The results revealed that compared to the control group, cells overexpressing IPCEF1 exhibited weakened migration ability, while cells with silenced low expression of IPCEF1 showed significantly enhanced migration ability (Figure 7A). Furthermore, Western Blot analysis was conducted to assess the impact of changes in IPCEF1 expression levels on the expression levels of EMT epithelial marker E-cadherin, mesenchymal marker N-cadherin, and migration-related indicators MMP9 and SNAI1 in each group. The results indicated that, compared to the Vector group, the IPCEF1 group upregulated E-cadherin and downregulated N-cadherin, MMP9, and SNAI1 expression levels. Conversely, the shIPCEF1 group exhibited the opposite pattern (Figure 7B). This suggested a correlation between changes in IPCEF1 expression levels and EMT.
The expression level of IPCEF1 influences the migration ability of PTC cells. (A) Transwell assay to detect changes in cell migration ability and perform analysis. (B) Western blot analysis of relevant indicators of cell migration and quantitative analysis. (**P < 0.01, ***P < 0.001).
The expression level of IPCEF1 could influence the cell cycle of PTC cells
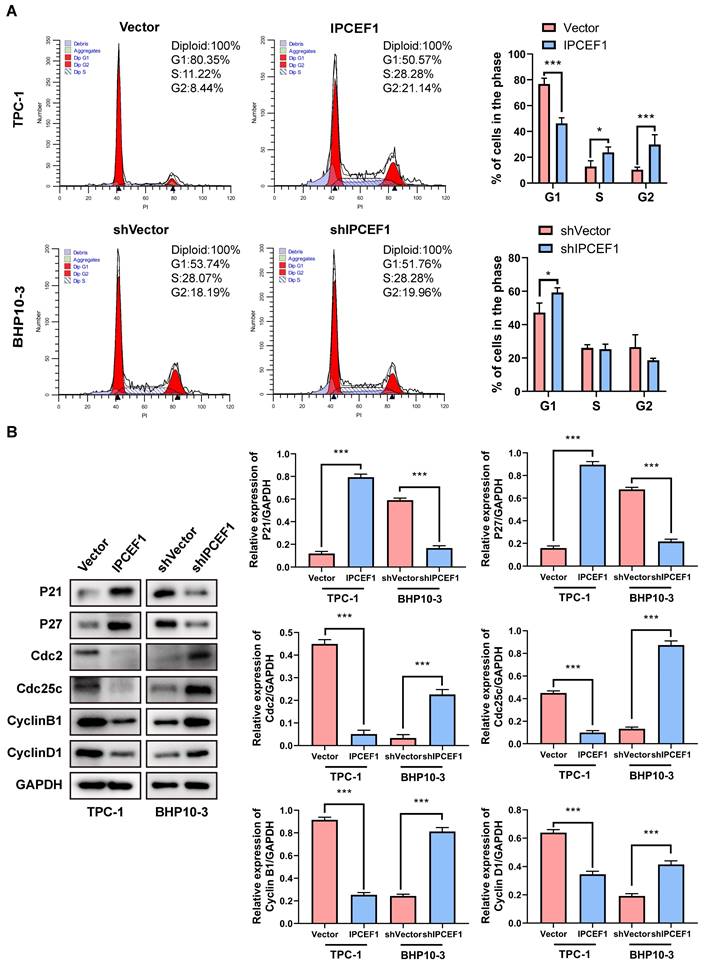
Flow cytometry was utilized to examine the impact of changes in IPCEF1 expression levels on the cell cycle of different cell groups. The results indicated that compared to the Vector group, cells overexpressing IPCEF1 showed a decrease in the proportion of G1 phase cells, with a significant increase in the proportions of S and G2 phase cells. In comparison to the shVector group, the shIPCEF1 group exhibited an increase in the proportion of G1 phase cells, with no significant differences in other phase proportions (Figure 8A). Furthermore, Western blot analysis was conducted to determine whether the expression levels of cell cycle-related indicators P21, P27, cdc2, Cdc25C, CyclinB1, and CyclinD1 were altered in each group of cells. The results revealed that, compared to the Vector group, the IPCEF1 group upregulated P21 and P27, while downregulating the expression levels of cdc2, Cdc25C, CyclinB1, and CyclinD1. Conversely, the shIPCEF1 group showed opposite results (Figure 8B). This suggested that changes in IPCEF1 expression levels could influence the cell cycle of PTC cells.
The expression level of IPCEF1 can influence the cell cycle of PTC cells. (A) Flow cytometry to detect changes in the cell cycle of PTC cells and conduct analysis. (B) Western blot to examine the expression levels of cell cycle-related indicators and perform quantitative analysis (*P < 0.05, **P < 0.01, ***P < 0.001).
Correlation analyses, KEGG pathway and GO enrichment analyses
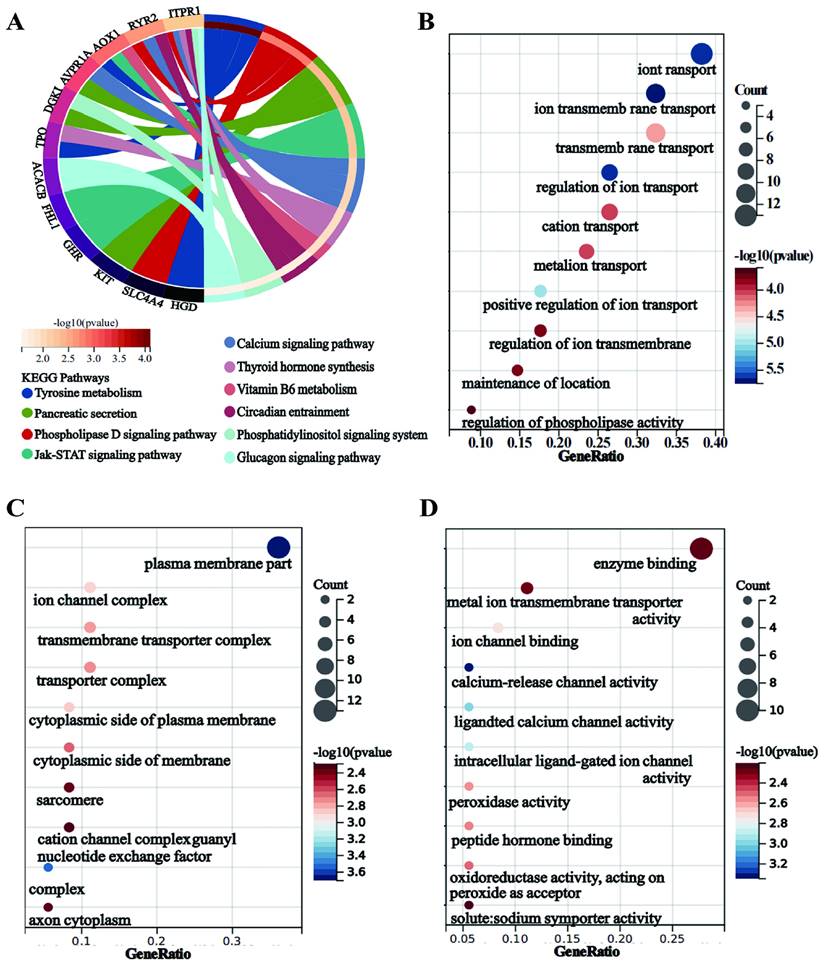
To investigate the mechanisms underlying the poor prognosis associated with reduced IPCEF1 expression, we identified genes correlated with IPCEF1 in PTC patients and selected the top 50 based on their correlation coefficients. Subsequently, KEGG and GO enrichment analyses were conducted on these 50 genes co-expressed with IPCEF1 (Figure 8A-I). KEGG pathway enrichment analyses revealed 10 signaling pathways associated with PTC (p < 0.05) (Figure 9A), such as “Tyrosine metabolism,” “Pancreatic secretion,” “Phospholipase D signaling pathway,” and the “Jak-STAT signaling pathway.” Within the biological processes (BP) category of GO enrichment, terms associated with substance transport and metabolism were prevalent, including ion transport, ion transmembrane transport, and regulation of ion transmembrane transport. The molecular function (MF) category indicated that genes associated with IPCEF1 were primarily involved in enzyme binding, metal ion transmembrane transporter activity, and ion channel binding. In the cellular components (CC) category, IPCEF1-associated genes were predominantly found in the plasma membrane, ion channel complexes, transmembrane transporter complexes, and the cytoplasmic side of the plasma membrane. These findings imply that genes associated with IPCEF1 may contribute to tumor progression by modulating these functions and pathways in PTC.
KEGG pathway and GO enrichment analyses. (A) KEGG pathway enrichment analyses of IPCEF1 and its co-expressed genes. (B-D) GO enrichment analyses of IPCEF1 and its co-expressed genes. (B) Biological Process; (C) Cellular Component; (D) Molecular Function).
IPCEF1 might influence PTC patient prognosis and survival through immune infiltration
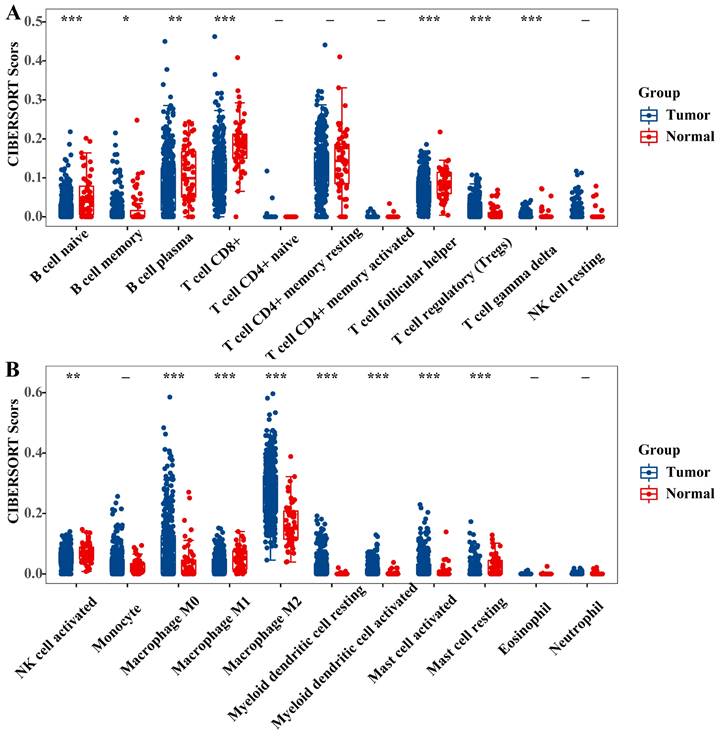
It is recognized that the infiltration of immune cells plays a pivotal role in tumor progression and impacts the prognosis of cancer patients. To delve deeper into the prognostic mechanisms for PTC patients, we employed the 'immuneeconv' function within R software and utilized CIBERSORT to calculate immune cell scores. Our analysis unveiled substantial variances in the infiltration profiles of diverse immune cells when comparing PTC tumors to normal tissue. Specifically, tumor tissues exhibited elevated levels of regulatory T cells (Tregs), M0 and M2 macrophages, both resting and activated myeloid dendritic cells, and activated mast cells. Conversely, normal tissues were characterized by a higher presence of naive B cells, memory B cells, plasma B cells, CD8+ T cells, follicular helper T cells, gamma delta T cells, activated NK cells, M1 macrophages, and resting mast cells (Figure 10A-B).”
Immune cell score of PTC tumor and adjacent normal tissues (TCGA) (A-B). The x-axis represents immune cell types, and the y-axis represents the expression distribution of immune score in different groups (*P < 0.05; **P < 0.01; and ***P < 0.001).
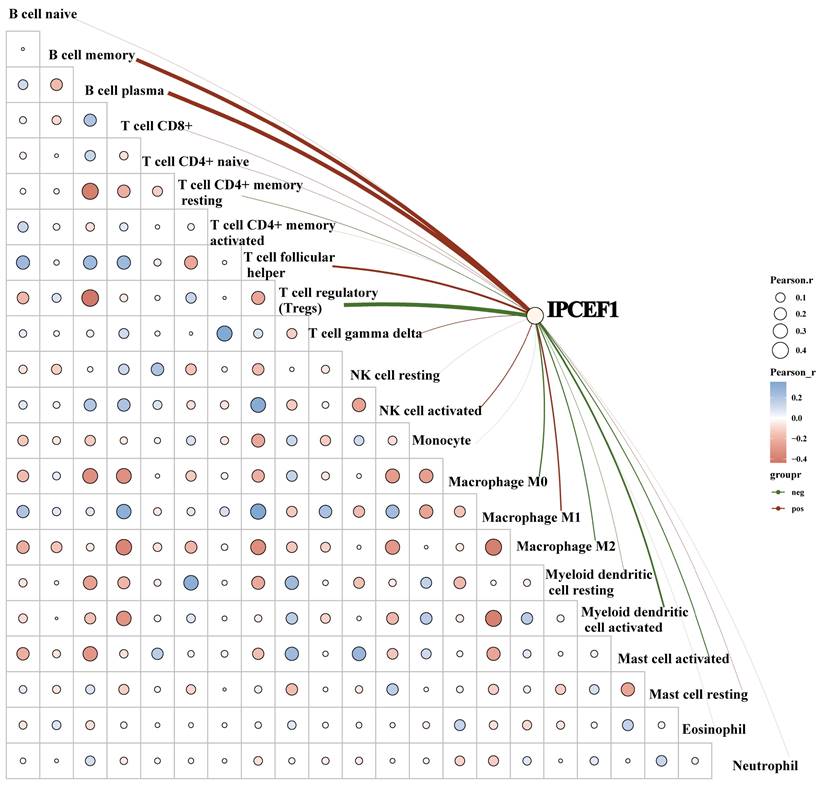
To further elucidate whether IPCEF1 was involved in immune cell infiltration in PTC patients, we conducted a correlation analysis between the expression level of IPCEF1 and immune cells. Our results indicated a positive correlation between IPCEF1 expression level and the immune scores for naive B cells, plasma B cells, follicular helper T cells, activated NK cells, and macrophages M1. Conversely, a negative correlation was observed between IPCEF1 expression level and the immune scores for regulatory T cells (Tregs), M0 and M2 macrophages, activated myeloid dendritic cells, and activated mast cells (Figure 11). These correlations provide additional insight into how IPCEF1 influence prognosis and survival of PTC patients through mechanisms of immune infiltration.
The correlation between IPCEF1 and immune cells in PTC (TCGA). The heat map in the schematic represents the correlation analysis of the immune score itself, red represents positive correlation, blue represents negative correlation, the more red or blue color means the greater correlation, also the larger circle means the stronger correlation; the red line in the schematic represents the positive correlation between IPCEF1 expression and the immune score, green means the negative correlation. (*P < 0.05).
Discussion
Previous studies have indicated that low expression of IPCEF1 might contribute to the progression of several types of cancer and other diseases [8, 14, 15]. Yet, its specific function in thyroid cancer, particularly in PTC, is not well-defined. Recent evidence has implicated the abnormal expression of various genes in both the development and progression of PTC. Identifying key molecular players in this cancer type is essential for advancing our understanding of its pathogenesis and developing more effective therapies. This study postulates that overexpression of IPCEF1 might inhibit PTC progression. We aim to validate this hypothesis by examining the association between IPCEF1 expression levels and PTC clinical parameters, exploring the effect of IPCEF1 expression levels on the function of PTC cells, while also investigating the potential mechanisms driving this relationship.
IPCEF1 is known to interact with cytohesin family members, which are involved in cell adhesion and migration, processes crucial for cancer metastasis [16, 17]. Our analyses of TCGA/GEO databases, supplemented by immunohistochemical findings, consistently demonstrated lower IPCEF1 expression in PTC tumors compared to normal tissue. Echoing this, Ren, S's utilization of bioinformatics and Internet of Things technologies in cancer patient disease analysis revealed a correlation between higher IPCEF1 expressions with extended survival in thyroid cancer patients [7]. Our comprehensive data analysis of PTC patients from the TCGA and GEO databases further revealed that lower IPCEF1 expression correlates not only with poorer T/N grade and advanced stage but also with reduced disease-free survival (DFS) and progression-free survival (PFS). These findings suggest that IPCEF1 may be a critical gene influencing PTC progression, corroborating the results obtained by Ren, S. Our cellular level experimental results showed IPCEF1 reduced the proliferation and migration ability of PTC cells, which is consistent with our clinical observations. Our research showed that overexpression of IPCEF1 could inhibit.
EMT of PTC cells, which was closely related to the progression of malignant tumor invasion and metastasis. Besides, we also found that high expression level of IPCEF1 lead to cell cycle arrest in the S or G2 phase, which ultimately reduced cell growth and proliferation.
In our investigation into the action mechanism of IPCEF1 in PTC, KEGG analysis results showed that the co-expressed genes of IPCEF1 were enriched in the JAK/STAT signaling pathway. This means that IPCEF1 may play a role in PTC by regulating the JAK/STAT signaling pathway. The JAK/STAT signaling pathway was discovered 30 years ago [18, 19]. As a fulcrum of many important cellular processes, the JAK/STAT pathway constitutes a rapid membrane to nucleus signaling module and induces the expression of key mediators in various cancers and inflammations. More and more evidence suggest that dysregulation of the JAK/STAT pathway is associated with various cancers and autoimmune diseases [20].
The JAK/STAT signaling pathway was evolutionarily conserved, which included ligand receptor complex, JAKs (JAK1/2/3 and Tyk2), and STATs (STAT1/2/3/4/5a/5b/6). Cytokines serve as the primary activators of this pathway, binding to membrane receptors to initiate JAK activation, which in turn mediates the phosphorylation of STATs. These phosphorylated STATs translocate into the nucleus to regulate the transcription of target genes [20]. When different stimulus signals were present, the JAK/STAT pathway could mediate different effects and exerted dual anti-tumor and pro-tumor effects based on multiple signals in tumor microenvironment (TME) [21-24]. TME is the area around tumor cells that has not undergone transformation, mainly composed of cancer-related fibroblasts and immune cells, provides the contextual landscape for these effects [25]. Numerous studies have demonstrated that JAK/STAT signaling pathway could influence tumor prognosis and the efficacy of treatments by modulating the tumor immune microenvironment [26, 27].
To delve deeper into the role of IPCEF1 in PTC, we assessed the infiltration of immune cells in the tumor microenvironment and analyzed the correlation between IPCEF1 levels and different immune cell populations. Our findings indicated a negative correlation between IPCEF1 expression and M2 macrophage infiltration, which was higher in tumor tissues compared to normal tissues. Conversely, IPCEF1 expression was positively correlated with M1 macrophage infiltration, typically more abundant in normal tissues than in tumor tissues. Macrophages, a predominant component of infiltrating immune cells, are classified into M1 (classically activated) and M2 (alternatively activated) subtypes [28]. M1 macrophages are known for their tumor-fighting capabilities, whereas M2 macrophages generally promote tumor development and growth [29, 30]. Our data suggest that IPCEF1 may facilitate the polarization towards M1 macrophages, thereby potentially hampering tumor progression in PTC. This hypothesis is in line with findings from Lu, Y, who demonstrated that Monotropein could inhibit colitis-associated cancer through the VDR/JAK1/STAT1pathway, influencing macrophage polarization[27]. Similarly, Xu, Z's research on osteopontin revealed its role in promoting M1 macrophage polarization via activating the JAK1/STAT1/HMGB1 signaling pathway in Nonalcoholic Fatty Liver Disease [31]. These studies complement our results, further suggesting that IPCEF1 might regulate M1/M2 polarization through the JAK/STAT signaling pathway, thereby impacting the prognosis of PTC.
In addition to macrophages, T cells, which are classified into T cell regulatory (Treg), cytotoxic T cells, and helper T cells based on their cellular functions, are also crucial in tumor related immune cells. Our results showed that IPCEF1 was negatively correlated with Tregs, which infiltrated more in tumor tissues than that in normal tissues. Tregs were dysregulated in the tumor microenvironment and are key participants in tumor immune escape [32]. Tregs were associated with poor prognosis in solid tumor patients and were believed to inhibit anti-tumor immune responses by directly interfering with cytotoxic T cell function, thereby promoting tumor progression and metastasis [33, 34]. This pattern suggests that the prognostic significance of IPCEF1 in PTC may not only be attributed to its influence on macrophage polarization but also to its potential role in modulating Treg populations. A lower expression of IPCEF1 may contribute to a more favorable prognosis by reducing Treg-mediated suppression of anti-tumor immunity.
Globally, thyroid cancer is among the top ten commonest cancer in females. In both adult and pediatric populations, there are variations of prevalence of thyroid cancer and rising incidence rates of thyroid cancer worldwide [35]. Despite the generally favorable prognosis of PTC, it can still exhibit aggressive behavior and lead to patient mortality [2, 3]. The various adverse reactions of targeted drugs currently make the development of new targets and agents urgent. In this context, the association of high IPCEF1 expression with improved prognosis in PTC patients emerges as a promising avenue for developing novel targeted treatment strategies. Nonetheless, the design of appropriate delivery carriers and the evaluation of their therapeutic efficacy warrant further investigation.
Collectively, our results suggested that IPCEF1 was lower expression of PTC tumor tissues than that in normal tissues and its lower expression might led to worse T/N stage and DFS/ PFS, which perhaps related to its regulation of the JAK/STAT signaling pathway and immune microenvironment (macrophage and Tregs). Of course, these results still require final basic experiments to confirm, which is also the focus of our subsequent research. But these results at least gave us a way of thinking that using exosomes or biological nanomaterials to target IPCEF1 delivery to the lesion site may be a new approach to inhibiting PTC progression, which still requires us to continue exploring.
Conclusion
Our findings suggested that IPCEF1 is a cancer suppressor gene in the progression of PTC, influencing patient survival and prognosis through modulation of immune infiltration and signaling pathways. These insights pave the way for novel therapeutic strategies, such as targeted delivery of IPCEF1 using exosomes or biomimetic nanomaterials. Although further validation is required, this research offers a new perspective for future PTC treatment modalities.
Abbreviations
PTC: Papillary Thyroid Cancer; IPCEF1: Interaction Protein for Cytohesin Exchange Factors 1; GEO: Gene Expression Omnibus; DEG: Differentially Expressed Genes; TCGA: The Cancer Genome Atlas; THCA: Thyroid Cancer; OS: Overall Survival; DFS: Disease-Free Survival; PFS: Progression-Free Survival; IHC: Immunohistochemical analysis; PBS: Phosphate Buffered Saline; MMP9: Matrix Metallopeptidase 9; SNAL1: Snail Family Transcriptional Repressor 1; GAPDH: Glyceraldehyde-3-Phosphate Dehydrogenase; KEGG: Kyoto Encyclopedia of Genes and Genomes; GO: Gene Ontology.
Acknowledgements
The authors thank Endocrinology Laboratory of Shandong Province Qianfoshan Hospital for providing the cells used in this study.
Author contributions
DY and LL launched the study; DY, WK and JZ undertook the work of bioinformatics analyses, statistical analyses and drafted the manuscript. JY, BY and XH carried out the function experiments; JD and LL reviewed and edited the manuscript. All authors have read and agreed to the published version of the manuscript.
Competing Interests
The authors have declared that no competing interest exists.
References
1. Laetitia G, Sven S, Fabrice J. Combinatorial Therapies in Thyroid Cancer: An Overview of Preclinical and Clinical Progresses. Cells. 2020;9:no 4: 830: 1-39
2. Cabanillas ME, McFadden DG, Durante C. Thyroid cancer. Lancet. 2016;388:2783-2795
3. Sapuppo G, Tavarelli M, Belfiore A, Vigneri R, Pellegriti G. Time to Separate Persistent From Recurrent Differentiated Thyroid Cancer: Different Conditions With Different Outcomes. Journal of clinical endocrinology & metabolism. 2019;104:258-265
4. Miller KC, Chintakuntlawar AV. Molecular-Driven Therapy in Advanced Thyroid Cancer. Current treatment options in oncology. 2021;22:24
5. Attar MA, Salem JC, Pursel HS, Santy LC. CNK3 and IPCEF1 produce a single protein that is required for HGF dependent Arf6 activation and migration. Experimental cell research. 2012;318:228-237
6. Quan K, Cao Z, Xu Q, Zhu M, Liu X, Dai M. A web-based calculator for predicting the prognosis of patients with sarcoma on the basis of antioxidant gene signatures. Aging. 2022;14:1407-1428
7. Ren S, Cao W, Ma J, Li H, Xia Y, Zhao J. Correlation evaluation between cancer microenvironment related genes and prognosis based on intelligent medical internet of things. Frontiers in genetics. 2023;14:1132242
8. Zhang Q, Li J, Shen H, Bai X, Zhang T, Liu P. Screening and validation of lymph node metastasis risk-factor genes in papillary thyroid carcinoma. Frontiers in endocrinology. 2022;13:991906
9. Clough E, Barrett T. The Gene Expression Omnibus Database. Methods in molecular biology (Clifton, NJ). 2016;1418:93-110
10. Ritchie ME, Phipson B, Wu D, Hu Y, Law CW, Shi W. et al. limma powers differential expression analyses for RNA-sequencing and microarray studies. Nucleic acids research. 2015;43:e47
11. Shen W, Song Z, Zhong X, Huang M, Shen D, Gao P. et al. Sangerbox: A comprehensive, interaction-friendly clinical bioinformatics analysis platform. iMeta. 2022;1:e36
12. Kanehisa M, Furumichi M, Sato Y, Ishiguro-Watanabe M, Tanabe M. KEGG: integrating viruses and cellular organisms. Nucleic acids research. 2021;49:D545-d551
13. Dennis G, Sherman BT, Hosack DA, Yang J, Gao W, Lane HC. et al. DAVID: Database for Annotation, Visualization, and Integrated Discovery. Genome biology. 2003;4:P3
14. Speedy HE, Di Bernardo MC, Sava GP, Dyer MJ, Holroyd A, Wang Y. et al. A genome-wide association study identifies multiple susceptibility loci for chronic lymphocytic leukemia. Nature genetics. 2014;46:56-60
15. Cui Q, Tang J, Zhang D, Kong D, Liao X, Ren J. et al. A prognostic eight-gene expression signature for patients with breast cancer receiving adjuvant chemotherapy. Journal of cellular biochemistry. 2020;121:3923-3934
16. Venkateswarlu K. Interaction protein for cytohesin exchange factors 1 (IPCEF1) binds cytohesin 2 and modifies its activity. Journal of biological chemistry. 2003;278:43460-43469
17. Venkateswarlu K. Analysis of the interaction between cytohesin 2 and IPCEF1. Methods in Enzymology. 2005;404:252-266
18. Müller M, Briscoe J, Laxton C, Guschin D, Ziemiecki A, Silvennoinen O. et al. The protein tyrosine kinase JAK1 complements defects in interferon-alpha/beta and -gamma signal transduction. Nature. 1993;366:129-135
19. Velazquez L, Fellous M, Stark GR, Pellegrini S. A protein tyrosine kinase in the interferon alpha/beta signaling pathway. Cell. 1992;70:313-322
20. Hu X, Li J, Fu M, Zhao X, Wang W. The JAK/STAT signaling pathway: from bench to clinic. Signal Transduction and Targeted Therapy. 2021;6:402
21. Zhou H, Li J, He Y, Xia X, Liu J, Xiong H. SLC25A17 inhibits autophagy to promote triple-negative breast cancer tumorigenesis by ROS-mediated JAK2/STAT3 signaling pathway. Cancer cell international. 2024;24:85
22. Shen L, Zhang C, Cui K, Liang X, Zhu G, Hong L. Leptin secreted by adipocytes promotes EMT transition and endometrial cancer progression via the JAK2/STAT3 signalling pathway. Adipocyte. 2024;13:2293273
23. Pradhan R, Paul S, Acharya SS, Sinha S, Dash SR, Kundu CN. Nano formulated Resveratrol inhibits PD-L1 in oral cancer cells by deregulating the association between tumor associated macrophages and cancer associated fibroblasts through IL-6/JAK2/STAT3 signaling axis. Journal of nutritional biochemistry. 2024;125:109568
24. Guo H, Wang Z, Yin K, Ma R, Zhang Y, Yin F. et al. Sciellin promotes the development and progression of thyroid cancer through the JAK2/STAT3 signaling pathway. Molecular carcinogenesis. 2024;701:713
25. Sahai E, Astsaturov I, Cukierman E, DeNardo DG, Egeblad M, Evans RM. et al. A framework for advancing our understanding of cancer-associated fibroblasts. Nature reviews cancer. 2020;20:174-186
26. Wu L, Sun S, Qu F, Sun M, Liu X, Sun Q. et al. CXCL9 influences the tumor immune microenvironment by stimulating JAK/STAT pathway in triple-negative breast cancer. Cancer immunology immunotherapy. 2023;72:1479-1492
27. Lu Y, Chen Y, Li Y, Xu S, Lian D, Liang J. et al. Monotropein inhibits colitis associated cancer through VDR/JAK1/STAT1 regulation of macrophage polarization. International immunopharmacology. 2023;124:110838
28. Cassetta L, Cassol E, Poli G. Macrophage polarization in health and disease. TheScientificWorldJournal. 2011;11:2391-2402
29. Xu Y, Romero R, Miller D, Kadam L, Mial TN, Plazyo O. et al. An M1-like Macrophage Polarization in Decidual Tissue during Spontaneous Preterm Labor That Is Attenuated by Rosiglitazone Treatment. Journal of immunology. 2016;196:2476-2491
30. Cao W, Peters JH, Nieman D, Sharma M, Watson T, Yu J. Macrophage subtype predicts lymph node metastasis in oesophageal adenocarcinoma and promotes cancer cell invasion in vitro. British journal of cancer. 2015;113:738-746
31. Xu Z, Xi F, Deng X, Ni Y, Pu C, Wang D. et al. Osteopontin Promotes Macrophage M1 Polarization by Activation of the JAK1/STAT1/HMGB1 Signaling Pathway in Nonalcoholic Fatty Liver Disease. Journal of Clinical and Translational Hepatology. 2023;11:273-283
32. Toker A, Ohashi PS. Expression of costimulatory and inhibitory receptors in FoxP3+ regulatory T cells within the tumor microenvironment: Implications for combination immunotherapy approaches. Advances in Cancer Research. 2019;144:193-261
33. Schneider T, Kimpfler S, Warth A, Schnabel PA, Dienemann H, Schadendorf D. et al. Foxp3(+) regulatory T cells and natural killer cells distinctly infiltrate primary tumors and draining lymph nodes in pulmonary adenocarcinoma. Journal of Thoracic Oncology. 2011;6:432-438
34. Núñez NG, Tosello Boari J, Ramos RN, Richer W, Cagnard N, Anderfuhren CD. et al. Tumor invasion in draining lymph nodes is associated with Treg accumulation in breast cancer patients. Nature communications. 2020;11:3272
35. Capdevila J, Galofré JC, Grande E, Zafón Llopis C, Ramón Y Cajal Asensio T, Navarro González E. et al. Consensus on the management of advanced radioactive iodine-refractory differentiated thyroid cancer on behalf of the Spanish Society of Endocrinology Thyroid Cancer Working Group (GTSEEN) and Spanish Rare Cancer Working Group (GETHI). Clinical & Translational Oncology. 2017;19:279-287
Author contact
![]() Corresponding author: Lin Liao; liaolinedu.cn. Address: 16766 Jingshi Road, Jinan City, Shandong, China.
Corresponding author: Lin Liao; liaolinedu.cn. Address: 16766 Jingshi Road, Jinan City, Shandong, China.