3.2
Impact Factor
ISSN: 1837-9664
J Cancer 2024; 15(20):6644-6657. doi:10.7150/jca.100911 This issue Cite
Research Paper
Genetic Variants at PRKCG Splice and UTR Sites Promote Cancer Susceptibility by Disrupting Epigenetic and miRNA Regulatory Network
1. Atta-ur-Rahman School of Applied Biosciences, National University of Sciences and Technology, Islamabad, 44000, Pakistan.
2. School of Biochemistry and Biotechnology, University of the Punjab, Lahore, 54590, Pakistan.
3. Minneapolis VA Health Care System Research Service, Minneapolis, MN, 55111 USA.
4. Department of Laboratory Medicine and Pathology, University of Minnesota, Minneapolis, MN,55405 USA.
5. Masonic Cancer Center, University of Minnesota, Minneapolis, MN,55407 USA.
6. Department of Community Health Sciences, College of Applied Medical Sciences, King Saud University, Riyadh 11421, Saudi Arabia.
Received 2024-7-13; Accepted 2024-10-14; Published 2024-10-28
Abstract

The changes in the protein kinase C gamma gene (PRKCG) expression are associated with both coding and non-coding variants. No studies have specifically established the association between PRKCG 3′UTR, 5′UTR, donor and acceptor splice variants with post-transcriptional changes through utilizing in-silico tools. The current study intends to uncover this linkage. In total, 419 3′ and 5′UTR variants were retrieved. 325 of these variant IDs were annotated as functionally significant. 18 variants impacted the transcription factors binding and therefore influenced the post-transcriptional regulatory activity while 7 variants affected regulatory mechanisms through histone modifications. 2 rsIDs (rs373228, rs446795) potentially impacted the interactions with RNA binding proteins. In addition to that, PRKCG showed high expression in brain cells and had variable expression in TCGA tumors, respectively. Furthermore, 5 3′ UTR variants were identified to be targeted by miRNAs. In total, 5 of these miRNAs (hsa-miR-663a, hsa-miR-324-5p, hsa-miR-646, hsa-miR-1205 and hsa-miR-4270) that targeted 3′UTRs (rs57483118, rs181418157 and rs60891969) showed differential expressions in distinct cancer types. The presence of 3′UTR variants likely altered the secondary structure of mRNA. The 7 rsIDs at 3′ UTR site caused the loss of function of authentic splice site at 10 positions was noted; at 1 position, gain of function was observed while at 2 positions no effect was identified. Moreover, the loss of donor and acceptor splice site was evident. Our results highlight the importance of non-coding regions that might boost our research capacity to predict and construct targeted therapeutic approaches.
Keywords: database, in-silico tools, non-coding variants, PRKCG, splice sites, 3′UTR, 5′UTR
Introduction
The human genome contains about ten million SNPs (Single Nucleotide Polymorphisms) located in the non-coding and coding region of genes. Within the human genome, SNPs are the most abundant type of polymorphism identified. Genetic polymorphisms are regarded as the alternative forms of two or more alleles that result in distinct phenotypes. Moreover, SNPs occur approximately every 1000 base pairs on average across the genome [1]. SNPs are categorized as functional and neutral. SNPs that confer disease onset through affecting phenotype are functional SNPs while neutral SNPs bring no deleterious effect to the subsequent translated protein [2]. Reportedly, the frequency of SNPs in non-coding regions compared to coding regions is higher [3, 4]. Through GWAS (Genome Wide Association Studies), it has been determined that non-coding regions constitute about 88% of SNPs linked with phenotype associated alterations, among which 45% occur in intronic while 43% reside in intergenic regions [5].
To add to this, the majority of the functional SNPs lie in the consensus sequences that separate exon and intron boundaries [6]. SNPs in these conserved regions form splice junctions and generate splice variants that can alter the phenotypic expression [6]. A polymorphism is also a mutation type, however, not all mutations come under the category of polymorphisms. The frequency of polymorphism is 1% or higher within a population in comparison to mutations that are rather rare and have a frequency of less than 1% [1]. Furthermore, mutations can give rise to polymorphisms [7]. During the evolutionary process, the mutation that has occurred at some time in the ancestral sequence may become polymorphism later on or get repaired or further mutated [8]. Under the terminology “Genetic variations”, common polymorphisms or rare mutations can be described [1]. In fact, for many genes, genomic variations, which affect the splicing process may represent up to 50% of all mutations that lead to gene dysfunction [9]. Therefore, elucidation of the relationships between genetic variants, altered splicing patterns, post-transcriptional processes, and the resultant phenotypic changes is needed to understand disease onset [10, 11].
Approximately 3.7% of the variants are located in the UTRs (Untranslated Regions) according to GWAS [12]. UTRs form non-coding transcript segments that surround the coding portion of a mRNA (messenger RNA) at the 5' and 3' ends [13]. Interestingly, polymorphisms are reported in 3' UTRs while mutations dominate in the 5' UTRs [12]. UTR region alterations disrupt transcriptional processes, mRNA stability, mRNA folding and translational processes. As 5' UTR sites are critical for recruiting ribosomes, variants at these sites can perturb protein synthesis pathways [14]. To add to this, variants identified in 3' UTRs impact the interaction with miRNAs (microRNAs). Possibly, miRNAs are encoded by 4% of the genome and regulate more than 30% of the genes [15, 16].
The current study is centered on PRKCG, which belongs to the conventional class of PKCs [17]. Variants in PRKCG gene lead to deleterious outcomes. Specifically, PRKCG gene is well-researched in relation to brain diseases. The presence of PRKCG variants disrupt neuronal signaling and leads to neuronal dysfunction [17]. The role of PRKCG in osteosarcoma [18], colon cancer [19], gliomas [20], breast cancer [21], ovarian cancer [22] and hepatocellular carcinoma [23, 24] is established. However, not enough literature is available to elucidate its role in other cancer types. It acts as an oncogene and fosters tumor growth and facilitates metastasis [18]. Its non-coding variants can increase cancer risk, but only a few studies have been conducted in this regard.
Moreover, with the increase in the number of genetic variants in databases, it becomes more challenging to determine their functional contributions in disease development through experimental approaches. Bioinformatics tools have eased the complexity of analyzing data based on variants. Before wet lab validation, in-silico findings can aid in narrowing down deleterious variants for screening of genetic diseases [25]. The pace and accuracy of data processing have significantly accelerated with the employment of these tools in research [26]. There is a gap in published information utilizing in-silico approaches to decipher the impact of these PRKCG variants on disease pathogenesis. We linked phenotypic variations associated with non-coding variants with gene expression, regulatory elements activity and chromatin accessibility due to disrupted transcription factors (TF) binding. Furthermore, we examined the linkage disequilibrium (LD) between the studied UTR variants as well as the impact of the variants on PRKCG functionality and structure.
Methods
Collection of Data
The data related to PRKCG 3′ UTR, 5′ UTR, splice donor and splice acceptor variants was fetched from Ensembl genome browser that provides open access to annotated datasets [27]. Of the provided transcript IDs, the MANE transcript ENST00000263431.4 with 3149 base pairs and 697 amino acids was chosen. The information regarding COSMIC variants was retrieved from COSMIC, which is a curated database that provides access to the clinical data related to cancer and somatic variants [28].
Processing of Retrieved Data
The IDs corresponding to 3′ and 5′ UTRs were input in RegulomeDB software [29] to filter out UTR variants with valid functional scores from 1-6. The RegulomeDB software uses manual annotations, and computational tools along with the experimental datasets from ENCODE [30] to identify putative regulatory variants. The closer the RegulomeDB score is to 1, the higher is the confidence of the variant having a significant functional impact, meaning that the variant presence could affect transcription factor binding and therefore the downstream mechanisms of transcription and translation. The RegulomeDB score of 2 also affects binding but as the scores shifts to 3, the chance variant site to affect transcription factor binding is less likely. Between the scores of 4-6, the experimental evidence of the variant affect binding is minimal [31].
Regulatory Function and Tissue Expression Characterization
The variants that were identified through RegulomeDB were entered in rSNPbase3.1 software, HaploReg software, RBP-Var2 database and Gtex software. The rSNPbase3.1 software helped identify variants with proximal and distal post-transcriptional regulatory activity along with their possibly regulated genes [32]. The HaploReg software searched whether the 3′ and 5′ UTR variants were in linkage disequilibrium (LD) or not by utilizing data on chromatin state, regulatory changes, and conservation alteration [33]. The RBP-Var2 database identified variants that affect RNA binding pattern and post-transcriptional interaction through miRNAs [34]. The effect of variants on riboSNitches, which are regulatory elements present within the untranslated regions of mRNA and have functions comparable to riboswitch [35], was determined from RBP-Var2 database. The relationship between 3′ and 5′ UTR variants and PRKCG gene expression across multiple human tissues was found out through Gtex software [36] while the UALCAN web resource [37] was used for ascertaining PRKCG expression in TCGA (The Cancer Genome Atlas) cancers [38, 39]. The web resource provides RNA-sequencing data from the TCGA for gene expression analysis. The brief data related to number of patients and normal individuals or clinical parameters, including the source of the sample is provided by UALCAN. To add to this, UALCAN does not use the exact cut-off value. The p-values that are less than 0.05 are considered statistically significant. Transcript Per Million (TPM) values that are greater than 1 indicate Median expression.
Influence of Variants on miRNA Regulation
Our study focused on analyzing 3′ UTRs that are majorly targeted by miRNAs. Although 5′UTRs are targets of miRNAs their impact is less than that of 3′ UTR sites [40]. Of the total 5′ and 3′ UTR variants, 3′ UTR variants were selected for further analysis. miRdSNP database [41] was explored to determine the miRNA targets of these 3′ UTR variants. Apart from miRdSNP database, information regarding 3′ UTR variants (that are targets of miRNAs) was retrieved from PolymiRTS Database 3.0 [42, 43]. The expression of these miRNAs in different cancers was discovered through miRCancer Database [44]. The miRNA expression upregulation and downregulation is influenced by epigenetic changes that lead to changes on the histones marks and cause DNA unwrapping or wrapping around histones [45]. To add to this, hypo and hypermethylation and the presence of variants in the promotor also impact miRNA gene expression [46, 47]. Furthermore, miRNAs can act as oncogenes or as tumor suppressors and their aberrant expression levels contribute to oncogenesis. Moreover, because of 3′ UTR variants, the interaction of mRNA with miRNA also gets disrupted which leads to targeted protein over-expression [48]. Our study tried to determine the effect of epigenetic alterations and variants' presence on PRKCG expression at the genetic level. The changed secondary structures because of 3′ UTR variants that act as miRNA target sites were analyzed using RNAfold. The software depicts the Minimum Free Energy (MFE) structure of RNA and variants' presence on base-pairing interactions and RNA stability [49, 50].
Splice Site Identification
Genetic variations that are caused by mutations come into focus every year. Moreover, a larger proportion affects mRNA splicing give rise to altered structure of proteins [10]. The ability of a particular sequence motif to function as a donor or acceptor splice site was identified using the SpliceAI software (https://spliceailookup.broadinstitute.org/) and MaxEntScan software (https://varseak.bio/). The scores presented by SpliceAI vary from 0-1 with higher scores indicating the loss of donor or acceptor site while scores near 0 indicate no effect of the variant on the splice site [51]. The MaxENTScan scores also provide information related to the functionality of donor or acceptor sites. The data regarding the loss of function of the authentic splice site or whether the base substitution does not affect the splice site was gained through MaxEntScan [52].
Graphical Representation
The results were plotted with the aid of Microsoft Excel [53]. Column and Bar chart graph format was selected for representation of data. This chart format is particularly useful for comparing results of different software. For customization of obtained graphs, provided features in the Toolbar were accessed.
Results
Processing and Analysis of Collected Data
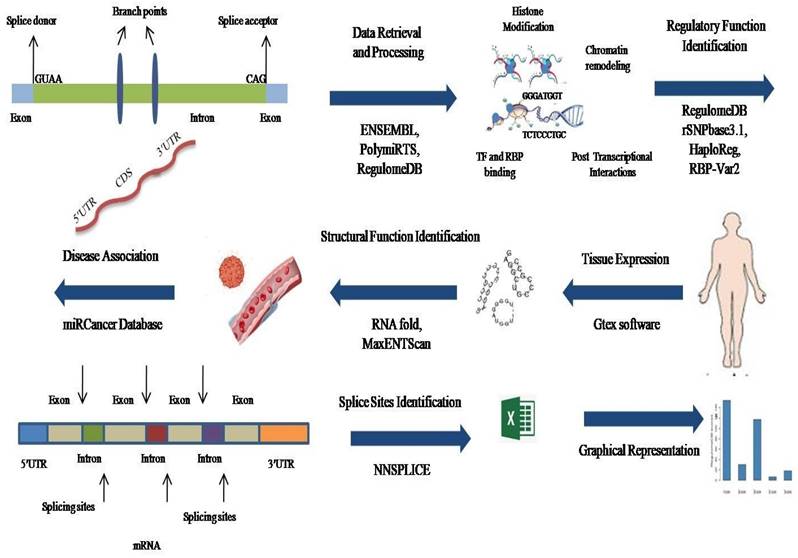
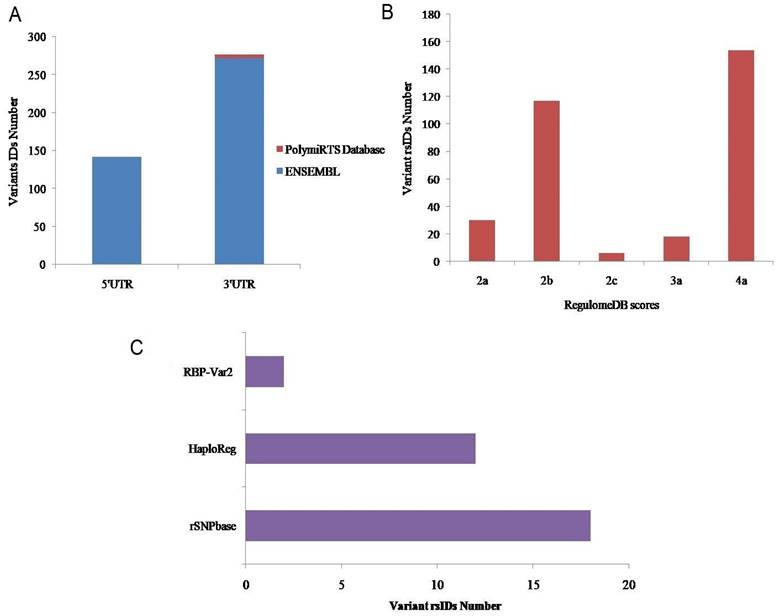
An overview of the research study is provided in Figure 1. In total, 414 variant IDs corresponding to 272 3′ UTRs and 142 5′UTRs were retrieved from the Ensembl genome browser (Figure 2a, Supplementary File S, Table S1). Moreover, 5 IDs corresponding to 3′ UTRs were recovered from PolymiRTS Database 3.0 (Figure 2a, Supplementary Material, Table S2). From both databases, data related to genetic variants including, SNPs or SNVs was extracted while data representing indels, somatic insertion, somatic deletion, and somatic sequence alteration was filtered out. In total 419 IDs, including 414 IDs from Ensembl genome browser and 5 IDs from PolymiRTS were input into RegulomeDB software. Of the 414 IDs fetched from the Ensembl genome browser, 320 IDs have annotated scores. The annotated scores of 5 IDs from PolymiRTS Database 3.0 were also identified. The IDs corresponding to COSMIC variants were removed during the process. So, only variants provided with the valid rsIDs were included for further analysis. In total 325 rsIDs were obtained from software that had varying RegulomeDB scores from 2a to 4 (Figure 2b, Supplementary Material, Table S3 and S4). The RegulomeDB score of 2 indicated that the presence of genetic variant likely had an impact on the gene regulation process and influenced the binding of transcription factor with its target site, but as the score shifted to 3, the variant had less likely functional or regulatory role and unlikely affected binding of transcription factors with the transcription start site or DNAase hypersensitive site. Between the scores of 4-6, the experimental evidence of the genetic variant's presence to affect binding was minimal. Of 325 rsIDs, 30 rsIDs had a score of 2a, 117 rsIDs had a score of 2b, 6 rsIDs had a score of 2c, 18 rsIDs had score of 3a while 154 rsIDs had a score of 4, So, collectively, 153 rsIDs with the RegulomeDB scores between the ranges of 2a-2c likely affected binding with the transcription factors.
Overview of the research study—representation through schematic diagram.
Functional Annotation of 3′ and 5′ UTR Variants
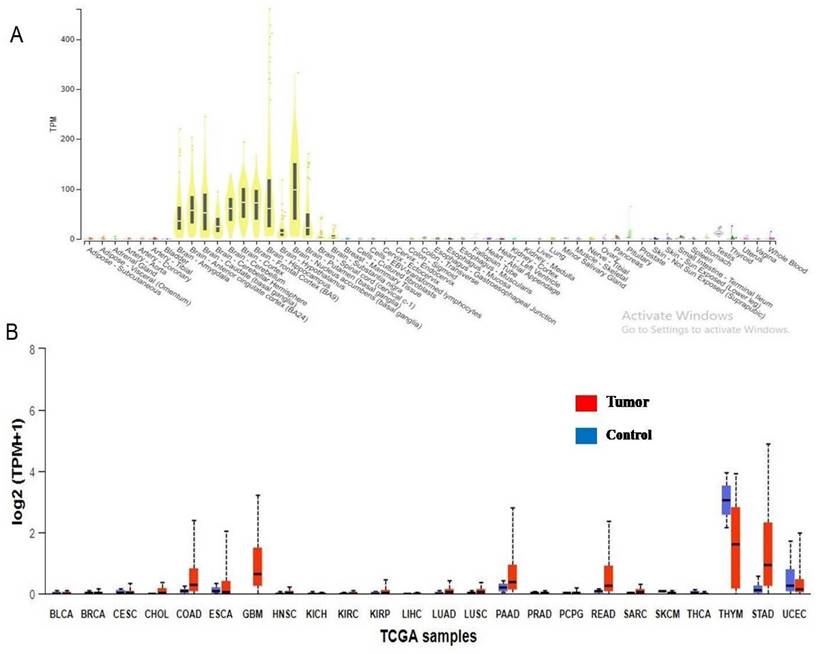
The 325 annotated variant IDs retrieved from RegulomeDB software were entered into rSNPbase3.1 software and 18 variant(s) of PRKCG were involved in binding with transcription factors and regulating the CACNG7 gene (Figure 2c). From HaploReg analysis, 7 variants of PRKCG were found to localise and interact with promotor and enhancer histone markers (Figure 2c). This elaborates that these variants have potential functional roles in regulating gene expression through histone modifications in different cell types and tissues. Also, these variants were identified in the regions deemed as DNase I hypersensitive, indicating their involvement in influencing gene expression. The epigenome ID, histone Marks and DNAase hypersensitive region related to different variants have been represented as well. Also, from 325 inputs, 2 rsIDs (rs373228, rs446795) were identified using RBP-Var2 software (Figure 2c). Through CLIP technique, both the variant IDs were found in RNA regions that interact directly with RNA binding proteins. Of 2 rsIDs (rs373228, rs446795), 1 rsID (rs446795) was identified in a motif that was a riboSNitch, which indicated that because of the genetic variant, the interaction with RNA binding protein was potentially impacted, which was supported by RBP-Var2 score as well. Neither of the rsIDs were found to interact with miRNAs and the presence of these variants did not perturb interaction with miRNAs. According to Gtex software, PRKCG is expressed in multiple tissues, but its expression is high in brain cells according to RNA sequence reads number and through calculation of TPM of target gene in the studied samples (Figure 3a). When the rsIDs from PolymiRTS, rSNPbase, HaploReg and RBP-Var2 were put in Gtex software, no information related to variants was identified that needs further elucidation. To add to this, PRKCG expression across TCGA tumors indicated that it is expressed in cancers differently according to UALCAN software (Figure 3b). The Red boxplot indicated the expression of PRKCG in tumors of primary origin, while blue boxplot indicates expression in the normal samples. The high expression is indicated by the values equal to or more than 3rd quartile while the values below 3rd quartile indicated low or medium expression of the PRKCG.
A. 3' and 5' UTR variants retrieved from databases. B. The annotated scores obtained through RegulomeDB software. C. Regulatory function determination of Variant rsIDs through bioinformatics.
A. Gene expression profile of PRKCG identified in major human tissues. B. PRKCG expression in TCGA specific tumors in comparison with control.
Impact of 3′-UTR Variants linkage with miRNA on Cancer Risk
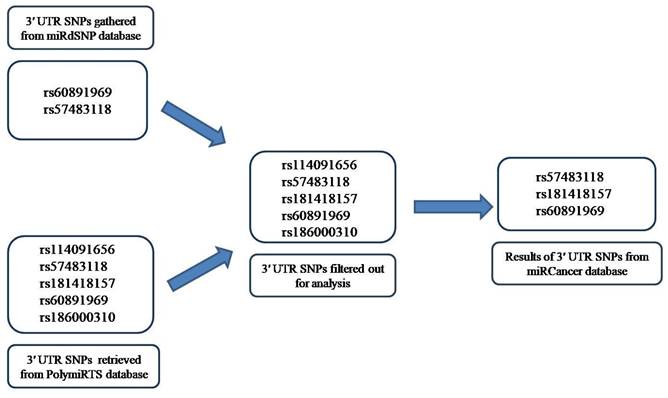
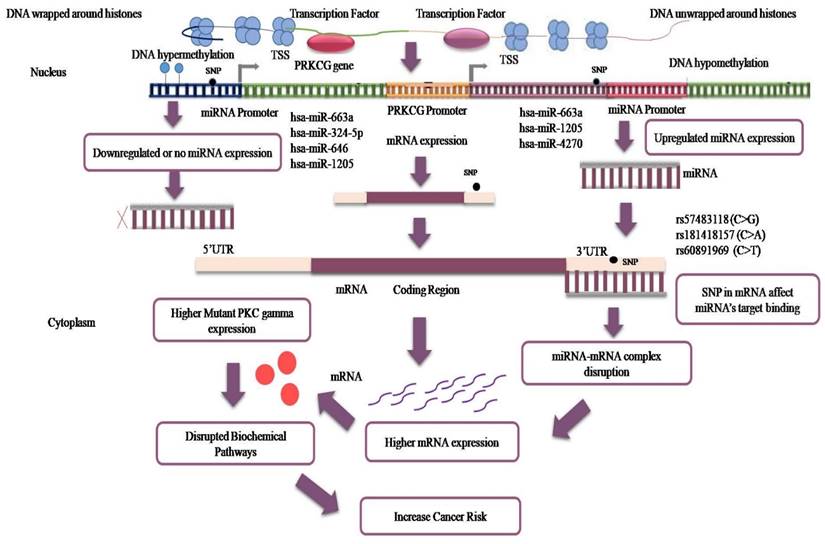
Two 3′ UTR variants from miRdSNP database and five 3′ UTR variants from PolymiRTS database with experimentally confirmed targeting by miRNAs were analyzed. Two of the variant rsIDs were found common in both the databases and therefore, the remaining five were analyzed further. The miRNAs targeting those variants, their expression levels in different cancers were determined through miRCancer Database. The three 3′ UTR variants were separated out of five rsIDs whose targeted miRNAs had differential expression in cancers (Figure 4). The miRNAs that gave no results on miRCancer Database and whose expression were not significantly changed in cancers were not included in analysis. As noted, in most cancers, the miRNAs expression was downregulated (Figure 5). To add to this, even if the levels of the miRNAs have been upregulated but due to the SNPs presence at 3′ UTR sites, miRNAs have not been able to bind to their potential target site that has contributed to PRKCG higher expression. The miRNAs along with SNP rsIDs connected with cancer have been shown in schematic representation (Figure 6). Epigenetic aberrations that cause the wrapping or unwrapping of the histones or dysregulation in transcriptional regulatory mechanisms including hypo or hypermethylation and the presence of SNPs at the promotor regions are the primary steps that lead to less or higher expression of target genes including miRNAs. Furthermore, miRNAs including hsa-miR-663a, hsa-miR-324-5p, hsa-miR-646, hsa-miR-1205 and hsa-miR-4270 with aberrant expression in cancers have been displayed separately as downregulated or upregulated. The variants at 3′ UTR sites that act as miRNA target sites have been shown as well (Figure 6). RNAfold was used to analyze the variant rsIDs for altered RNA secondary structures by entering the miRsite sequences of target 3′ UTR variants. The effect of variants on the folded structure of RNA was found out. The lower free energy indicates stable structure of RNA. In the studied rsIDs, all the structure had negative free energy values, indicating towards the stability of structure and less potential effect of variants on RNA fold structure (Table 1).
Schematic representation of gathering of data from miRdSNP and PolymiRTS databases followed by filtering step and the final result after miRCancer database analysis.
Relation between miRNA dysregulation and PRKCG over-expression in cancer cells.
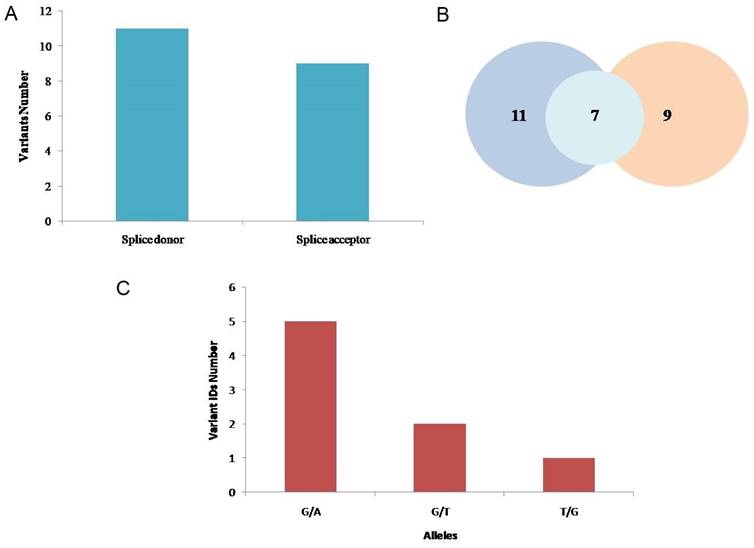
A. Splice donor and acceptor variants identified through ENSEMBL software. B. Venn diagram representing the 11 splice donor and 9 splice acceptor variants and 7 transcript rsIDs that were analyzed. C. Alleles and nucleotide positions (before and after mutation) of the total splice donor and splice acceptor variants.
Splicing Variant Analysis
11 splice donor variants and 9 splice acceptor variants were identified through Ensembl genome browser software (Figure 6). After removing the 13 IDs that were COSMIC variants or were repeated and had similar chromosome positions, the remaining 7 variants IDs were further analyzed (Table 2). The MaxEntScan scores above 3.5 were interpreted to show that the respective sequences can function as the splice site. At different chromosome positions (cPos), the probability scores are given that shows the probability of authentic splice site to be functional or not with or without substitution. At 10 different chromosome positions, loss of function of authentic splice site because of variants was reported, at 1 position, gain of function while at 2 positions no effect was indicated. The likelihood that the sequence is a real splice site increases with the increasing score or positive value and decreases with the decreasing score or negative value. The higher scoring sequence has a greater chance of being used as the splice site when two sequences with different scores are shown. “No AG” or “No GT” shows the probable loss of function for authentic splice site. The SpliceAI scores of 7 rsIDs indicated that the presence of variants led to the loss of splice site's function (Table 2).
Discussion
Gaps in knowledge continue to exist in relation to PRKCG involvement in different diseases. Past studies indicate connection of PRKCG with neurological and oncological disorders [19, 54, 55]. In a notable study, its expression was found to be upregulated by 54% in colon cancer patients in comparison to normal individuals [19]. Moreover, its suppression was found to reduce ability of colon cancer cells to migrate and metastasize to distant secondary sites [56]. Through studies conducted in-vivo, immortal epithelial cells became tumorigenic with the upregulation of PRKCG [57]. To add to this, PRKCG expression was reported in glioma cells [58]. In another study, PRKCG transcript was observed in one of four anaplastic astrocytomas [59]. In Triple-negative breast cancer (TNBC), aberrant expression of PRKCG was also noted. Moreover, lethality of inhibitor of HDAC6 was increased in TNBC because of PRKCG signaling pathway [21]. PRKCG expression has not been detected in melanocytes, which requires further investigation [60]. These studies indicate the importance of studying coding and non-coding SNPs of PRKCG that mainly deregulate PRKCG signaling pathways and progress the cells towards cancer. Past studies highlight the prominent role of non-synonymous (ns) SNPs in carcinogenesis. These nsSNPs form the part of coding region of PRKCG. In a study, the pathogenic non-synonymous SNP rs386134171 of PRKCG was found to destabilize the structure of PRKCG and alter its function that leads to HCC [23]. In another study, positive association of PRKCG non-synonymous variant rs1331262028 with ovarian cancer was established [22].
Furthermore, the presence of SNP rs454006 in PRKCG was linked with increased risk of osteosarcoma [55]. This SNP was identified in the non-coding region i.e. intron 3 region of PRKCG [18]. Previously, no study has demonstrated the role of non-coding variants that reside in 5′UTR, 3′UTR, splice donor and acceptor sites with cancer susceptibility. The current study has utilized in-silico approaches to understand the PRKCG gene and the effects of its non-coding variants on post-transcriptional and translational mechanisms. The regulatory roles of 5′ and 3′UTR variants were evaluated using RegulomeDB [29], rSNPbase [61], HaploReg [62], and RBP-Var2 [63].
Variant rsIDs with their changed secondary structures identified through RNAfold
| sIDs | Target site (miRsite) sequences | Free energy (kcal/mol) | Frequency of MFE (Minimum Free Energy) structure | Graphical output (MFE secondary structure) |
|---|---|---|---|---|
| rs57483118 | GaggctGCCCGCC | -2.63 | 95.50% | 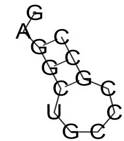 |
| GggATGGTGATG | -0.02 | 97.33 % | 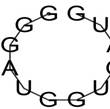 | |
| rs181418157 | AcgtccAGCTGCT | -0.10 | 85.36% | 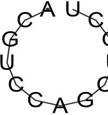 |
| rs60891969 | TctcCCTGCAGcc | -0.01 | 98.58% | 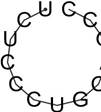 |
| TCTCCCTGcagcc | -0.01 | 98.58% |  | |
| GggATGTTGATG | -0.02 | 97.02 % | 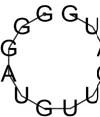 |
Interpretation by MaxEntScan software
| rsIDs | cPos | Score | Score Interpretation (Effect on authentic splice site) | MaxEntScan scores |
|---|---|---|---|---|
| rs1344692203 | 1: 285+1 | +45.59% (reference) | Loss of Function | 9.22 |
| <no GT> (variant) | ||||
rs1568755566 | 1: 822-2 | +5.96% (reference) | Loss of Function | 7.09 |
| <no AG> (variant) | ||||
| 2: 822:1 | <no AG> (reference) | Loss of Function | ||
| -33.56% (variant) | 2.07 | |||
| rs1395398748 | 1: 909+1 | +20.00% (reference) | No predictive effect | 7.84 |
| +20.00% (variant) | 7.84 | |||
| 2: 939 | <no GT> (reference) | Loss of Function | -23.68 | |
| -89.54% (variant) | ||||
| 3: 939+1 | +82.62% (reference) | Loss of Function | 10.03 | |
| <no GT> (variant) | ||||
rs1384774676 | 1:1282-2 | +32.08% (reference) | Loss of Function | 9.07 |
| <no AG> (variant) | ||||
2:1282-1 | <no AG> (reference) | Gain of Function | ||
| +0.49% (variant) | 0.56 | |||
rs59309543 | 1:1576-2 | +55.16% (reference) | Loss of Function | 10.14 |
| <no AG> (variant) | ||||
rs1599953647 | 1:1656+1 | +87.92% (reference) | Loss of Function | 11.08 |
| <no GT> (variant) | ||||
| 2:1656+11 | +42.96% (reference) | No predictive effect | 5.87 | |
| +42.96% (variant) | 5.87 | |||
rs1406338491 | 1:1764 | <no GT> (reference) | Loss of Function | |
| -67.95% (variant) | -11 | |||
2:1764+1 | +26.51% (reference) | Loss of Function | 4.74 | |
| <no GT> (variant) |
The RegulomeDB software incorporates data from experimental techniques and from ENCODE project to gain knowledge regarding gene regulation mechanisms and variant IDs that are entered into the software [64]. The scoring system provided by the software helps in the elucidation of functional components including TF interaction, chromatin structure and histone modification. One of the important conclusions from the ENCODE research is that there is a complicated interaction between TFs and other genome components because of chromatin shape and histone modification. Different forms of histone modifications have been demonstrated to be related to active or repressed chromatin states, which in turn might alter the binding of TFs to the surrounding DNA sequences. Similarly, the spatial structure of DNA inside the nucleus may also influence gene expression, since TFs may be more or less accessible to their target sites depending on their placement within the genome. Moreover, there is an increasing amount of data to imply that TFs play a crucial role in gene regulation. For example, high-throughput functional assays such as ChIP-seq and DNase I-hypersensitive site sequencing experimentally aid in discovering functional areas for TF binding [65].
Another major area of study in the realm of gene regulation is the function of genetic variation in modifying TF binding. It has been demonstrated that variants in genes may lead to variations in TF binding, which can in turn impact gene expression and contribute to disease risk. In one study that was directed towards FGFR2, it was noted that because of the single nucleotide changes in the sequence of Intron 2 at two positions, the reported altered binding of transcription factors lead to increase expression of FGFR2 in breast cancer [66]. Thus, variants cause both up-and down-regulation of gene expression [67]. rSNPbase3.1 and HaploReg software [32] provided additional information on variant-related post-transcriptional regulatory activity in the study. HaploReg identified promotor and enhancer histone marks and DNAase hypersensitivity of variants. Further, the RBP-Var2 database identified variants that affects post-transcriptional mechanisms by altering RNA binding patterns [34].
The relationship between 3′ and 5′ UTR variants and gene expression across multiple human tissues was determined utilizing Gtex software [68]. With the help of Gtex software [69], we ascertained the PRKCG and the variants expression in human tissues. Through UALCAN [37], gene expression was identified in TCGA cancers. In addition to 5′UTR and 3′UTR variants, our study focused on splice donor and acceptor sites. These sites are positioned at the intersections of exons and introns in a pre-mRNA molecule. The splice donor site is positioned at the 5' end of an intron and is identified by the splicing machinery that recognizes the splice donor site through attaching with the GU conserved nucleotide sequence in humans. On the other hand, the splice acceptor site is identified near the 3' end of an intron and is also recognized by the same splicing machinery through the AG conserved sequence of nucleotides. The splicing mechanisms splice out the introns for the functional protein generation [70]. Notably, variants at these junctions can perturb the splicing mechanisms that lead to altered protein sequence and structures, contributing to disease pathology [70].
Moreover, splice site consensus sequences present at exon-intron junctions are phylogenetically conserved. Understanding splicing mechanisms requires the recognition of splice site motifs [71]. Nine splice acceptor variations and eleven splice donor variations were studied to see if they had a significant impact on splice sites. The entropy model-based software, MaxEntScan, was used to estimate whether a specific sequence motif would act as a donor or acceptor splice site. The variations on splice sites could lead to formation of a new splice site or deletion of the authentic one that can vary withMaxENT scores. For example, a normal splice site might have a MaxENTscore of 7.84 while the mutated splice site has a MaxENT score of 10.42 [72]. Along with MaxENTScan, the scores of SpliceAI [73] also provided thorough and detailed information regarding the functionality of spice sites.
Further, in this study, we have taken into consideration the involvement of miRNAs in causing perturbed gene expression due to alteration in miRNA target sites on the mRNA. miRNAs are intriguing molecular players for gene regulation and are associated with numerous human disorders. Importantly, variants found in the target sequences of these miRNAs lead to dysregulated gene expression which may cause disease advancement [58]. Moreover, gene expressions that encode miRNAs get repressed or down regulated, one reason of which is the presence of variants in the promoter. The resultant gene, in this case miRNA, is not expressed that leads to increased expression of the targeted gene [36, 59]. Furthermore, miRNAs can act as oncogenes or as tumor suppressors and their aberrant expression levels contribute to oncogenesis [37].
Moreover, because of 3'UTR variants, the interaction of mRNA with miRNA gets disrupted that also causes the expression of targeted protein to increase that finally leads to higher cancer risk when biochemical pathways are disrupted [37, 60, 61]. Moreover, the miRNA expression upregulation and downregulation get influenced by epigenetic changes that lead to changes on the histone's marks and cause DNA unwrapping or wrapping around histones [34]. To add to this, hypo and hypermethylation and the presence of variants in the promotor also impact expression of genes that encode miRNAs [35, 36].
In the current study, we analyze genetic variants in the miRNA sites. Not only are the variants in the target sites of miRNA functionally important but also the variants that originate in the miRNAs. In a previous study, miR-146a polymorphism, rs2910164, including a G>C nucleotide variation on the seed region of miR146a-3p caused the conversion of G:U pair to a C:U. This mismatch resulted in changing the selectivity of mature miR-146a binding to its targets that contributed to higher production of miR-146a in cancers [74].
Our study presently focused on studying 3′UTRs in relation to interaction with miRNAs. Although miRNAs may target 5′UTRs, their impact when compared to 3′UTR regions is limited [40]. In one study, variant rsIDs including rs12516, rs3092995 and rs8176318 that were noted in 3′UTR of BRCA1 affected the interaction with the miR-103 seed sequence that caused the breast cancer risk to increase in the study group of African American women [75]. miRdSNP and PolymiRTS databases [76] were explored for identification of miRNAs that target 3′UTR sites. For the miRNAs that were found in the study to bind with variants at 3′UTR, their expression levels were assessed in different cancers through the miRCancer Database [44]. Moreover, when the conserved or non-conserved site is disrupted, it impacts miRNA targeting. Genetic variants significantly affect miRNA target sites, which is determined through scores [42]. In our study, we used RNAfold [77] to determine the altered secondary structure of 3′UTR variants whose binding with miRNAs gets disrupted because of genetic variants.
This study has covered in-silico analysis to explore the potential mechanisms affected at molecular level because of non-coding variants. The in-silico approach provided a cost and time-efficient means of screening a vast array of non-coding variants for further experimental validation. The wet lab experiments that are lacking in the current study would be part of future studies. Moreover, for the outcomes of the current study to have significant clinical implications and applications, this study would be conducted in a larger cohort. Our future explorations involve the validation of obtained in-silico results through in-vitro and in-vivo methods. Further investigations would take into consideration the use of surgically resected cancer tissue and cancer cell line for reliable results. The non-coding variants can interfere with the transcription factors binding and affect normal function of gene regulatory elements. Moreover, the presence of SNPs in the enhancer and silencer that form the part of non-coding genomic regions [78], also affect the regulatory mechanisms that lead to cancer [79]. This study would be utilized to study non-coding SNPs, specifically in relation to enhancer and silencer elements. Notably, the 3'UTR, 5' UTRs and splice sites would be studied through deep sequencing technology. Past studies have indicated different molecular pathways of PRKCG with reference to cancer [19, 23]. This study would be utilized to unveil the role of non-coding SNPs in impacting PRKCG signalling pathways. A past study compares the expression of non-phosphorylated and Thr514-phosphorylated form of PRKCG in colon cancer cells [80]. So, PTMs can alter the expression of PRKCG in cancer cells. Our further investigations would include the identification of PTMs of PRKCG that could affect transcription and translation processes.
Conclusion
This study analyzed the non-coding variants of the PRKCG gene, especially present within the 3'UTR, 5' UTR, splice donor and acceptor sites. The presence of pathogenic non-coding SNPs affected the binding of transcription factors with the regulatory elements. Moreover, the mRNA interactions with miRNAs were also impacted because of 3'UTR variants. The splice site variants caused the loss of donor and acceptor sites that influenced the splicing mechanisms. The study also covered the effect of presence of non-coding variants in DNase hypersensitive regions. Also, the effect of change in histone modifications and chromatin architecture on transcription mechanisms was briefly studied.
Supplementary Material
Supplementary tables.
Acknowledgements
The authors extend their appreciation to the Researchers Supporting project number (RSP2024R502), King Saud University, Riyadh Saudi Arabia for funding this project.
Funding
The authors extend their appreciation to the Researchers Supporting project number (RSP2024R502), King Saud University, Riyadh Saudi Arabia for funding this project. The funding body has no role in study design.
Author contributions
Authors contribution is: “Conceptualization, FA, MS, TA, NMA and YS; methodology, MS and NMA; experimentation, validation YB, and KK, formal analysis, FA, JHT and KK; investigation, TA, SR, AA, KK, and SR; resources, MS, TA; data curation, SR, and NWA; writing—original draft preparation, TI, FA; writing—review and editing, JHT, YS; visualization, MS and NMA; supervision, MS; project administration, MS; and SR funding acquisition, MS. All authors have read and agreed to the published version of the manuscript.
Availability of data and material
Data as supplementary material is provided along with the manuscript. Raw data will be available from corresponding author on request.
Competing Interests
The authors have declared that no competing interest exists.
References
1. Karki R, Pandya D, Elston RC, Ferlini C. Defining “mutation” and “polymorphism” in the era of personal genomics. BMC medical genomics. 2015;8:1-7
2. George Priya Doss C, Sudandiradoss C, Rajasekaran R, Choudhury P, Sinha P, Hota P. et al. Applications of computational algorithm tools to identify functional SNPs. Functional and integrative genomics. 2008;8:309-16
3. Smits BM, van Zutphen BF, Plasterk RH, Cuppen E. Genetic variation in coding regions between and within commonly used inbred rat strains. Genome Research. 2004;14:1285-90
4. Ramírez-Bello J, Jiménez-Morales M. Functional implications of single nucleotide polymorphisms (SNPs) in protein-coding and non-coding RNA genes in multifactorial diseases. Gaceta medica de Mexico. 2017;153:238-50
5. Lin H, Hargreaves KA, Li R, Reiter JL, Wang Y, Mort M. et al. RegSNPs-intron: a computational framework for predicting pathogenic impact of intronic single nucleotide variants. Genome biology. 2019;20:1-16
6. Cooper DN. Functional intronic polymorphisms: Buried treasure awaiting discovery within our genes. Human genomics: BioMed Central. 2010:1-5
7. Ismail S, Essawi M. Genetic polymorphism studies in humans. Middle East Journal of Medical Genetics. 2012;1:57-63
8. Dawkins RL, Willamson JF, Lester S, Dawkins ST. Mutation versus polymorphism in evolution. Genomics. 2013;101:211-12
9. Buratti E, Baralle M, Baralle FE. Defective splicing, disease and therapy: searching for master checkpoints in exon definition. Nucleic acids research. 2006;34:3494-510
10. Desmet F-O, Hamroun D, Lalande M, Collod-Béroud G, Claustres M, Béroud C. Human Splicing Finder: an online bioinformatics tool to predict splicing signals. Nucleic acids research. 2009;37:e67-e
11. Mignone F, Gissi C, Liuni S, Pesole G. Untranslated regions of mRNAs. Genome biology. 2002;3:1-10
12. Steri M, Idda ML, Whalen MB, Orrù V. Genetic variants in mRNA untranslated regions. Wiley Interdisciplinary Reviews: RNA. 2018;9:e1474
13. George Priya Doss C, Rajasekaran R, Arjun P, Sethumadhavan R. Prioritization of candidate SNPs in colon cancer using bioinformatics tools: An alternative approach for a cancer biologist. Interdisciplinary Sciences: Computational Life Sciences. 2010;2:320-46
14. Hinnebusch AG, Ivanov IP, Sonenberg N. Translational control by 5′-untranslated regions of eukaryotic mRNAs. Science. 2016;352:1413-6
15. Knox B, Wang Y, Rogers LJ, Xuan J, Yu D, Guan H. et al. A Functional SNP in the 3′-UTR of TAP2 Gene Interacts with microRNA hsa-miR-1270 to Suppress the Gene Expression. Environmental and molecular mutagenesis. 2018;59:134-43
16. Gu S, Jin L, Zhang F, Sarnow P, Kay MA. Biological basis for restriction of microRNA targets to the 3′ untranslated region in mammalian mRNAs. Nature structural and molecular biology. 2009;16:144-50
17. Pilo CA, Newton AC. Two sides of the same coin: protein kinase C γ in cancer and neurodegeneration. Frontiers in cell and developmental biology. 2022;10:929510
18. Lu H, Zhu L, Lian L, Chen M, Shi D, Wang K. Genetic variations in the PRKCG gene and osteosarcoma risk in a Chinese population: a case-control study. Tumor Biology. 2015;36:5241-7
19. Dowling CM, Hayes SL, Phelan JJ, Cathcart MC, Finn SP, Mehigan B. et al. Expression of protein kinase C gamma promotes cell migration in colon cancer. Oncotarget. 2017;8:72096
20. Xiao H, Goldthwait DA, Mapstone T. The identification of four protein kinase C isoforms in human glioblastoma cell lines: PKC alpha, gamma, epsilon, and zeta. Journal of neurosurgery. 1994;81:734-40
21. Alothaim T, Charbonneau M, Tang X. HDAC6 inhibitors sensitize non-mesenchymal triple-negative breast cancer cells to cysteine deprivation. Scientific Reports. 2021;11:10956
22. Shahid K, Khan K, Badshah Y, Mahmood Ashraf N, Hamid A, Trembley JH. et al. Pathogenicity of PKCγ genetic variants—possible function as a non-invasive diagnostic biomarker in ovarian cancer. Genes. 2023;14:236
23. Abid F, Khan K, Badshah Y, Ashraf NM, Shabbir M, Hamid A. et al. Non-synonymous SNPs variants of PRKCG and its association with oncogenes predispose to hepatocellular carcinoma. Cancer Cell International. 2023;23:123
24. Abid F, Iqbal T, Khan K, Badshah Y, Trembley JH, Ashraf NM. et al. Analyzing PKC Gamma (+ 19,506 A/G) polymorphism as a promising genetic marker for HCV-induced hepatocellular carcinoma. Biomarker Research. 2022;10:87
25. Lee PH, Shatkay H. An integrative scoring system for ranking SNPs by their potential deleterious effects. Bioinformatics. 2009;25:1048-55
26. Clifford RJ, Edmonson MN, Nguyen C, Scherpbier T, Hu Y, Buetow KH. Bioinformatics tools for single nucleotide polymorphism discovery and analysis. Annals of the New York Academy of Sciences. 2004;1020:101-9
27. Howe KL, Achuthan P, Allen J, Allen J, Alvarez-Jarreta J, Amode MR. et al. Ensembl 2021. Nucleic acids research. 2021;49:D884-D91
28. Forbes S, Clements J, Dawson E, Bamford S, Webb T, Dogan A. et al. COSMIC 2005. British journal of cancer. 2006;94:318-22
29. Dong S, Boyle AP. Predicting functional variants in enhancer and promoter elements using RegulomeDB. Human mutation. 2019;40:1292-8
30. Diehl AG, Boyle AP. Deciphering encode. Trends in Genetics. 2016;32:238-49
31. Cheema AN, Rosenthal SL, Ilyas Kamboh M. Proficiency of data interpretation: identification of signaling SNPs/specific loci for coronary artery disease. Database. 2017;2017:bax078
32. Lou J, Gong J, Ke J, Tian J, Zhang Y, Li J. et al. A functional polymorphism located at transcription factor binding sites, rs6695837 near LAMC1 gene, confers risk of colorectal cancer in Chinese populations. Carcinogenesis. 2017;38:177-83
33. Prabhu B, Kanchamreddy S, Sharma A, Bhat S, Bhat PV, Kabekkodu SP. et al. Conceptualization of functional single nucleotide polymorphisms of polycystic ovarian syndrome genes: an in silico approach. Journal of Endocrinological Investigation. 2021;44:1783-93
34. Moraghebi M, Maleki R, Ahmadi M, Negahi AA, Abbasi H, Mousavi P. In silico analysis of polymorphisms in microRNAs deregulated in Alzheimer disease. Frontiers in neuroscience. 2021;15:631852
35. Solem AC, Halvorsen M, Ramos SB, Laederach A. The potential of the riboSNitch in personalized medicine. Wiley Interdisciplinary Reviews: RNA. 2015;6:517-32
36. Carithers LJ, Moore HM. The genotype-tissue expression (GTEx) project. Biopreservation and biobanking: Mary Ann Liebert, Inc. 140 Huguenot Street, 3rd Floor New Rochelle, NY 10801 USA. 2015 p. 307-8
37. Chandrashekar DS, Bashel B, Balasubramanya SAH, Creighton CJ, Ponce-Rodriguez I, Chakravarthi BV. et al. UALCAN: a portal for facilitating tumor subgroup gene expression and survival analyses. Neoplasia. 2017;19:649-58
38. Tomczak K, Czerwińska P, Wiznerowicz M. Review The Cancer Genome Atlas (TCGA): an immeasurable source of knowledge. Contemporary Oncology/Współczesna Onkologia. 2015;2015:68-77
39. Cooper LA, Demicco EG, Saltz JH, Powell RT, Rao A, Lazar AJ. PanCancer insights from The Cancer Genome Atlas: the pathologist's perspective. The Journal of pathology. 2018;244:512-24
40. Thomas LF, Saito T, Sætrom P. Inferring causative variants in microRNA target sites. Nucleic acids research. 2011;39:e109-e
41. Bruno AE, Li L, Kalabus JL, Pan Y, Yu A, Hu Z. miRdSNP: a database of disease-associated SNPs and microRNA target sites on 3'UTRs of human genes. BMC genomics. 2012;13:1-7
42. Bhattacharya A, Ziebarth JD, Cui Y. PolymiRTS Database 3.0: linking polymorphisms in microRNAs and their target sites with human diseases and biological pathways. Nucleic acids research. 2014;42:D86-D91
43. Panda AK, Tripathy R, Das BK. CD14 (C-159T) polymorphism is associated with increased susceptibility to SLE, and plasma levels of soluble CD14 is a novel biomarker of disease activity: A hospital-based case-control study. Lupus. 2021;30:219-27
44. Xie B, Ding Q, Han H, Wu D. miRCancer: a microRNA-cancer association database constructed by text mining on literature. Bioinformatics. 2013;29:638-44
45. Gulyaeva LF, Kushlinskiy NE. Regulatory mechanisms of microRNA expression. Journal of translational medicine. 2016;14:143
46. Varghese RS, Barefoot ME, Jain S, Chen Y, Zhang Y, Alley A. et al. Integrative analysis of DNA methylation and microRNA expression reveals mechanisms of racial heterogeneity in hepatocellular carcinoma. Frontiers in genetics. 2021;12:708326
47. Mukherjee M, Ghosh S, Goswami S. Investigating the interference of single nucleotide polymorphisms with miRNA mediated gene regulation in pancreatic ductal adenocarcinoma: An in silico approach. Gene. 2022;819:146259
48. Rykova E, Ershov N, Damarov I, Merkulova T. SNPs in 3′ UTR miRNA Target Sequences Associated with Individual Drug Susceptibility. International Journal of Molecular Sciences. 2022;23:13725
49. Lorenz R, Wolfinger MT, Tanzer A, Hofacker IL. Predicting RNA secondary structures from sequence and probing data. Methods. 2016;103:86-98
50. Trotta E. On the normalization of the minimum free energy of RNAs by sequence length. PloS one. 2014;9:e113380
51. Wagner N, Çelik MH, Hölzlwimmer FR, Mertes C, Prokisch H, Yépez VA. et al. Aberrant splicing prediction across human tissues. Nature Genetics. 2023;55:861-70
52. Shamsani J, Kazakoff SH, Armean IM, McLaren W, Parsons MT, Thompson BA. et al. A plugin for the Ensembl Variant Effect Predictor that uses MaxEntScan to predict variant spliceogenicity. Bioinformatics. 2019;35:2315-7
53. Godino L. How to structure Microsoft Excel documents for systematic reviews. Nurse Researcher. 2023;31:40-46
54. Tada Y, Kume K, Noguchi S, Sekiya T, Nishinaka K, Ishiguchi H. et al. Comparison of two families with and without ataxia harboring novel variants in PRKCG. Journal of Human Genetics. 2022;67:595-9
55. Zhang Y, Hu X, Wang H-K, Shen W-W, Liao T-Q, Chen P. et al. Single-nucleotide polymorphisms of the PRKCG gene and osteosarcoma susceptibility. Tumor Biology. 2014;35:12671-7
56. Satow R, Suzuki Y, Asada S, Ota S, Idogawa M, Kubota S. et al. Downregulation of protein kinase C gamma reduces epithelial property and enhances malignant phenotypes in colorectal cancer cells. Iscience. 2022;25:105501
57. Mazzoni E, Adam A, Bal de Kier Joffe E, Aguirre-Ghiso JA. Immortalized mammary epithelial cells overexpressing protein kinase C γ acquire a malignant phenotype and become tumorigenic in vivo. Molecular cancer research. 2003;1:776-87
58. Mishima K, Ohno S, Shitara N, Yamaoka K, Suzuki K. Opposite effects of the overexpression of protein kinase Cγ and δ on the growth properties of human glioma cell line U251 MG. Biochemical and biophysical research communications. 1994;201:363-72
59. Baltuch GH, Dooley NP, Villemure J-G, Yong VW. Protein kinase C and growth regulation of malignant gliomas. Canadian journal of neurological sciences. 1995;22:264-71
60. Yamanishi D, Graham M, Buckmeier J, Meyskens Jr F. The differential expression of protein kinase C genes in normal human neonatal melanocytes and metastatic melanomas. Carcinogenesis. 1991;12:105-9
61. Guo L, Du Y, Chang S, Zhang K, Wang J. rSNPBase: a database for curated regulatory SNPs. Nucleic acids research. 2014;42:D1033-D9
62. Ward LD, Kellis M. HaploReg v4: systematic mining of putative causal variants, cell types, regulators and target genes for human complex traits and disease. Nucleic acids research. 2016;44:D877-D81
63. Mao F, Wang L, Zhao X, Xiao L, Li X, Liu Q. et al. De novo mutations involved in post-transcriptional dysregulation contribute to six neuropsychiatric disorders. BioRxiv. 2017: 175844.
64. Ritchie GR, Flicek P. Computational approaches to interpreting genomic sequence variation. Genome medicine. 2014;6:1-11
65. Slattery M, Zhou T, Yang L, Machado ACD, Gordân R, Rohs R. Absence of a simple code: how transcription factors read the genome. Trends in biochemical sciences. 2014;39:381-99
66. Liu Y, Walavalkar NM, Dozmorov MG, Rich SS, Civelek M, Guertin MJ. Identification of breast cancer associated variants that modulate transcription factor binding. PLoS genetics. 2017;13:e1006761
67. Vazquez-Mena O, Medina-Martinez I, Juárez-Torres E, Barrón V, Espinosa A, Villegas-Sepulveda N. et al. Amplified genes may be overexpressed, unchanged, or downregulated in cervical cancer cell lines. PloS one. 2012;7:e32667
68. Stanfill AG, Cao X. Enhancing research through the use of the genotype-tissue expression (GTEx) database. Biological research for nursing. 2021;23:533-40
69. McCall MN, Illei PB, Halushka MK. Complex sources of variation in tissue expression data: analysis of the GTEx lung transcriptome. The American Journal of Human Genetics. 2016;99:624-35
70. Anna A, Monika G. Splicing mutations in human genetic disorders: examples, detection, and confirmation. Journal of applied genetics. 2018;59:253-68
71. Keren H, Lev-Maor G, Ast G. Alternative splicing and evolution: diversification, exon definition and function. Nature Reviews Genetics. 2010;11:345-55
72. Eng L, Coutinho G, Nahas S, Yeo G, Tanouye R, Babaei M. et al. Nonclassical splicing mutations in the coding and noncoding regions of the ATM Gene: maximum entropy estimates of splice junction strengths. Human mutation. 2004;23:67-76
73. de Sainte Agathe J-M, Filser M, Isidor B, Besnard T, Gueguen P, Perrin A. et al. SpliceAI-visual: a free online tool to improve SpliceAI splicing variant interpretation. Human Genomics. 2023;17:7
74. Gong H-b, Zhang S-l, Wu X-j, Pu X-m, Kang X-j. Association of rs2910164 polymorphism in MiR-146a gene with psoriasis susceptibility: A meta-analysis. Medicine. 2019;98:e14401
75. Chhichholiya Y, Suryan AK, Suman P, Munshi A, Singh S. SNPs in miRNAs and target sequences: role in cancer and diabetes. Frontiers in Genetics. 2021;12:793523
76. Ning S, Li X. Non-coding RNA resources. Non-coding RNAs in Complex Diseases: A Bioinformatics Perspective. 2018:1-7
77. Zheng Y, Wang M, Wang S, Xu P, Deng Y, Lin S. et al. LncRNA MEG3 rs3087918 was associated with a decreased breast cancer risk in a Chinese population: a case-control study. BMC cancer. 2020;20:1-8
78. Kim S, Welsh DA, Myers L, Cherry KE, Wyckoff J, Jazwinski SM. Non-coding genomic regions possessing enhancer and silencer potential are associated with healthy aging and exceptional survival. Oncotarget. 2015;6:3600
79. Iñiguez-Muñoz S, Llinàs-Arias P, Ensenyat-Mendez M, Bedoya-López AF, Orozco JI, Cortés J. et al. Hidden secrets of the cancer genome: unlocking the impact of non-coding mutations in gene regulatory elements. Cellular Molecular Life Sciences. 2024;81:274
80. Garczarczyk D, Szeker K, Galfi P, Csordas A, Hofmann J. Protein kinase Cγ in colon cancer cells: Expression, Thr514 phosphorylation and sensitivity to butyrate-mediated upregulation as related to the degree of differentiation. Chemico-biological interactions. 2010;185:25-32
Author contact
![]() Corresponding author: Suhail Razak, Department of Community Health Sciences, College of Applied Medical Sciences, King Saud University, KSA; Email: smaraziedu.sa. Naeem Mahmood Ashraf, School of Biochemistry and Biotechnology, University of the Punjab, Lahore, 54590, Pakistan; Email: naeem.sbbedu.pk.
Corresponding author: Suhail Razak, Department of Community Health Sciences, College of Applied Medical Sciences, King Saud University, KSA; Email: smaraziedu.sa. Naeem Mahmood Ashraf, School of Biochemistry and Biotechnology, University of the Punjab, Lahore, 54590, Pakistan; Email: naeem.sbbedu.pk.

 Global reach, higher impact