Impact Factor ISSN: 1837-9664

 Global reach, higher impact
J Cancer 2025; 16(7):2145-2166. doi:10.7150/jca.110646 This issue Cite
Research Paper
Identification and Validation of Prognostic Genes Related to Histone Lactylation Modification in Glioblastoma: An Integrated Analysis of Transcriptome and Single-cell RNA Sequencing
Wenfeng He1,3,4†, Ruihong Chen5,6†, Guangliang Chen4†, Lihan Zhang4,7, Yuhang Qian4, Jie Zhou4,7, Jianhua Peng4,8,9 ![]() , Vincent Kam Wai Wong1
, Vincent Kam Wai Wong1 ![]() , Yong Jiang2,4,8,10
, Yong Jiang2,4,8,10 ![]()
1. Dr. Neher's Biophysics Laboratory for Innovative Drug Discovery & State Key Laboratory of Quality Research in Chinese Medicine & Faculty of Chinese Medicine, Macau University of Science and Technology, Macau, China.
2. Faculty of Chinese Medicine, Macau University of Science and Technology, Macau, China.
3. Department of Oncology, The Affiliated Hospital of Southwest Medical University, Luzhou, China.
4. Department of Neurosurgery, The Affiliated Hospital of Southwest Medical University, Luzhou, China.
5. Guangdong Provincial Key Laboratory of Medical Molecular Diagnostics, The First Dongguan Affiliated Hospital, Guangdong Medical University, Dongguan, China.
6. Songshan Lake Innovation Center of Medicine & Engineering, Guangdong Medical University, Dongguan, China.
7. Sichuan Clinical Research Center for Neurosurgery, The Affiliated Hospital of Southwest Medical University, Luzhou, China.
8. Institute of Epigenetics and Brain Science, Southwest Medical University, Luzhou, China.
9. Academician (Expert) Workstation of Sichuan Province, The Affiliated Hospital of Southwest Medical University, Luzhou, China.
10. Laboratory of Neurological Diseases and Brain Function, The Affiliated Hospital of Southwest Medical University, Luzhou, China.
†Wenfeng He, Ruihong Chen and Guangliang Chen contributed equally to this work.
Received 2025-1-17; Accepted 2025-3-5; Published 2025-3-21
Abstract

Background: The impact of histone lactylation modification (HLM) on glioblastoma (GBM) progression is not well understood. This study aimed to identify HLM-associated prognostic genes in GBM and explore their mechanisms of action.
Methods: The presence and role of lactylation in glioma clinical tissue samples and its correlation with GBM progression were analysed through immunohistochemical staining and Western blotting. Sequencing data for GBM were obtained from publicly available databases. An initial correlation analysis was performed between global HLM levels and GBM. Differentially expressed HLM-related genes (HLMRGs) in GBM were identified by intersecting differentially expressed genes (DEGs) from the TCGA-GBM dataset, key module genes derived from weighted gene coexpression network analysis (WGCNA), and previously reported HLMRGs. Prognostic genes were subsequently identified through univariate Cox regression and least absolute shrinkage and selection operator (LASSO) regression analyses, which formed the basis for constructing a risk prediction model. Associations between HLMRGs and GBM were further evaluated via single-cell RNA sequencing (scRNA-seq) datasets. Complementary analyses, including functional enrichment, immune infiltration, somatic mutation, and nomogram-based survival prediction, were conducted alongside in vitro experiments. Additionally, drug sensitivity and Chinese medicine prediction analyses were performed to identify potential therapeutic agents for GBM.
Results: We detected a significant increase in global lactylation levels in GBM, which correlated with patient survival. We identified 227 differentially expressed HLMRGs from the intersection of 3,343 differentially expressed genes and 948 key module genes, indicating strong prognostic potential. Notably, genes such as SNCAIP, TMEM100, NLRP11, HOXC11, and HOXD10 were highly expressed in GBM. Functional analysis suggested that HLMRGs are involved primarily in pathways related to cytokine‒cytokine receptor interactions, cell cycle regulation, and cellular interactions, including microglial differentiation states. Further connections were established between HLMRGs and infiltrating immune cells, particularly type 1 T helper (Th1) cells, as well as mutations in genes such as PTEN. The potential therapeutic agents identified included ATRA and Can Sha.
Conclusion: The HLM-related gene risk prediction model shows substantial promise for improving patient management in GBM, providing crucial insights for clinical prognostic evaluations and immunotherapeutic approaches in GBM.
Keywords: Glioblastoma, Histone lactylation modification, Prognostic genes, Single-cell RNA sequencing
1. Introduction
Gliomas, arising from the neoplastic transformation of glial or neuronal progenitor cells within the central nervous system, represent approximately 32% of all intracranial neoplasms. Among these gliomas, malignant gliomas are the most prevalent and lethal brain tumors. According to the WHO classification system, gliomas are categorized into grades 1 through 4, with glioblastoma (GBM) corresponding to grade 4. GBM represents approximately 57% of all gliomas and 48% of primary malignant central nervous system tumors, with an incidence rate of 3.21 per 100,000 individuals [1-3]. GBM is characterized by aggressive proliferation, invasion, angiogenesis, heterogeneity, and immunosuppression and remains a significant clinical challenge. In the face of advancements in therapeutic approaches, which encompass surgical interventions, radiation therapy, chemotherapy, and targeted treatments, the median survival for GBM patients remains dishearteningly short at just 15 months, with respective 2-year and 5-year survival rates of 26.5% and a mere 5.8%[1, 4-6]. Prognostic and predictive biomarkers play indispensable roles in assessing patient outcomes and guiding therapeutic strategies. Identifying novel prognostic genes is crucial for elucidating GBM pathogenesis, improving the prognosis management of patients, optimizing personalized treatment approaches, and facilitating the development of targeted therapies.
Glycolysis refers to the process in which glucose is broken down into pyruvate in the cytoplasm under anaerobic conditions and a small amount of ATP is produced, which belongs to a type of glucose metabolism [7, 8]. Glycolysis is of great importance in organisms as it is the main pathway of glucose breakdown under hypoxic conditions and also provides rapid energy during strenuous exercise. Tumor cells adapt to the altered metabolic environment by switching between glycolysis and oxidative phosphorylation. Aerobic glycolysis means that the tumor consumes more glucose than the surrounding normal tissue, and glucose can be fermented to produce lactate, with the consequence of aerobic glycolysis being increased intracellular and extracellular lactate concentrations [9, 10]. The increased demand for ATP metabolism in tumor cells leads to the occurrence of glycolysis, which is also the reason for the higher concentration of lactate in tumor cells than in non-tumor cells [9, 11]. Lactate produced by glycolysis in tumor cells may bias tumor-associated macrophages toward an immunosuppressive phenotype, tumor progression is associated with the accumulation of lactate produced by aerobic glycolysis in the tumor microenvironment [12]. A large number of studies have shown that lactate is produced by aerobic glycolysis under a variety of conditions, such as trauma, inflammation, infection, myocardial infarction, and tumor [13]. This indicates that glycolysis and lactate have an important effect on our body.
Lactate, a byproduct of glycolysis under hypoxic conditions, plays a multifaceted role in tumor biology. Tumor cells predominantly rely on glycolysis to convert glucose to lactate, even in the presence of oxygen—a metabolic reprogramming known as the Warburg effect [14, 15]. Lactate functions as an energy source, promotes angiogenesis, acts as a signalling molecule, and regulates immune responses [16, 17]. Within glioblastoma multiforme, lactate has emerged as a pivotal activator of oxidative metabolism, enhancing tumor cell proliferation, longevity, and migratory potential [18, 19]. Furthermore, lactate production inhibitors have reprogrammed the glucose metabolism of cancer stem cells, thereby alleviating the immunosuppression within the tumor microenvironment [20].
Histones are basic proteins in the chromatin of eukaryotic cells, which together with DNA form the nucleosome structure. Posttranslational chemical modifications of histones represent a key mechanism of epigenetic regulation and play a pivotal role in gene expression [21]. Among these modifications, histone lactylation modification (HLM), characterized by the addition of a lactoyl group derived from lactoyl-CoA to lysine residues, represents a significant advancement in the study of lactate biology. HLMs have been implicated in various pathological processes, including tumor progression, inflammation, sepsis, pulmonary hypertension, Alzheimer's disease, and renal fibrosis [22-27]. Warburg effect induced histone lactylation drives NF-κB-associated LINC01127 expression through MAP4K4/JNK/NF-κB axis to promote self-renewal of GBM cells [28]. Furthermore, increased histone H3K9 lactylation has been observed in recurrent GBM, with chronic temozolomide exposure contributing to elevated H3K9 lactylation levels [29]. These findings suggest a critical role for HLM in GBM pathogenesis; however, the precise mechanisms of HLM-related genes (HLMRGs) in GBM remain unexplored.
Single-cell RNA sequencing (scRNA-seq) is a powerful high-throughput technology that enables cell-specific transcriptomic analysis at single-cell resolution. This technique has been extensively employed in studies of embryonic development and tumor biology. By elucidating the gene structure and expression status of individual cells, scRNA-seq distinguishes functionally normal cells from cancer cells across different stages of tumor development, thereby advancing molecular-level investigations [30, 31]. Studies have reported that scRNA-seq analysis of different GBM cells revealed inherent differences in the expression of different transcriptional programs related to oncogenic signaling, proliferation, immune response, and hypoxia [32]. This technology has proven invaluable in studying tumor heterogeneity, including understanding tumor evolution, uncovering chemotherapy resistance mechanisms, and informing novel therapeutic strategies [33].
By leveraging transcriptome and scRNA-seq data from publicly available databases, this study identified HLM-related prognostic genes in GBM through bioinformatics analyses and developed a prognostic risk model to predict patient survival. Additionally, the biological functions and molecular mechanisms of the identified prognostic genes were systematically explored. These findings provide new perspectives for clinical prognosis prediction and targeted drug development in GBM.
2. Methods
2.1 Clinical samples
The tumor tissues used for this study were obtained from patients with gliomas who underwent surgical resection at the Department of Neurosurgery, Affiliated Hospital of Southwest Medical University. Ethical approval was granted by the ethics committee of the Affiliated Hospital of Southwest Medical University, and all participants provided written informed consent.
2.2 Data sources
The TCGA-GBM dataset, comprising 169 GBM tissue samples from 168 patients (167 samples from 166 patients with survival information) and 5 normal tissue samples from 5 individuals, was retrieved from The Cancer Genome Atlas (TCGA) database (https://portal.gdc.cancer.gov/) and utilized as the training set. Additionally, the CGGA-GBM dataset, containing 693 GBM tissue samples from 693 patients (413 samples from 413 patients with survival information), was sourced from the Chinese Glioma Genome Atlas (CGGA) database (http://www.cgga.org.cn/) and served as the validation set. The scRNA-seq dataset GSE162631 (GPL24676), which included 4 GBM and 4 normal tissue samples, was acquired from the Gene Expression Omnibus (GEO) database (https://www.ncbi.nlm.nih.gov/geo/). A total of 14 HLMRGs were identified from the literature [34-36].
2.3 Association analysis between the global HLM level and GBM
To assess the associations between HLM levels and the survival of patients with GBM, the 14 HLMRGs in the TCGA-GBM dataset were subjected to single-sample gene set enrichment analysis (ssGSEA) via the GSVA package (v1.42.0) [37]. The ssGSEA scores of the HLMRGs were compared between GBM and normal samples via the Wilcoxon rank-sum test, with P < 0.05 indicating statistical significance.
GBM samples were classified into high- and low-scoring groups on the basis of the optimal cut-off value of the ssGSEA score. Kaplan‒Meier (KM) survival curves for these groups were generated via the survival package (v3.5--5) [38], and survival differences were evaluated via the log-rank test, with P < 0.05 indicating statistical significance.
2.4 Functional enrichment and protein‒protein interaction (PPI) analyses of HLMRGs in GBM
To identify differentially expressed genes (DEGs) in the TCGA-GBM dataset, differential expression analysis was conducted via the DESeq2 package (v1.40.2) [39] under the criteria of a |log2-fold change (FC)| > 2 and adjusted P < 0.05. Visualization of the DEGs was performed via the ggplot2 package (v3.5.0) [40] for generating volcano plots and the ComplexHeatmap package (v2.12.1) [41] for creating heatmaps.
After unqualified genes and samples were filtered and the data were clustered via the GoodSamplesGenes function, weighted gene coexpression network analysis (WGCNA) was conducted within the TCGA-GBM dataset. The pickSoftThreshold function was used to determine an optimal threshold, ensuring that gene interactions conformed to a scale-free network. Genes were subsequently grouped into modules through hierarchical clustering, with parameters set to minModuleSize = 30, mergeCutHeight = 0.3, and verbose = 5. The Pearson correlation coefficient was applied to evaluate the relationships between module eigengene (ME) scores and the ssGSEA scores of the HLMRGs via the WGCNA package (v1.71) [42]. The genes in the module whose ME scores had the highest correlation with the ssGSEA score of the HLMRGs were defined as key module genes.
To identify candidate genes, the VennDiagram package (v1.7.1)[43] was employed to find the intersection between DEGs and key module genes, representing genes closely associated with HLM in GBM. Functional enrichment analyses of these candidate genes were performed via the clusterProfiler package (v4.2.2) [44] for Gene Ontology (GO) and Kyoto Encyclopedia of Genes and Genomes (KEGG) pathway analyses, with statistical significance set at P < 0.05. To explore protein-level interactions among the candidate genes, the Search Tool for the Retrieval of Interacting Genes/Proteins (STRING) database (https://cn.string-db.org/) was utilized to construct a protein‒protein interaction (PPI) network, with a confidence score threshold > 0.9. High-quality interactions, defined as those with at least 30 connections and coexpressions and experimentally determined interaction scores > 0.6, were visualized via Cytoscape software (v3.1.1)[45].
2.5 Construction and validation of a risk model based on HLMRGs
To evaluate the potential prognostic value of candidate genes in predicting overall survival (OS) in patients with GBM, univariate Cox regression analysis was performed on the TCGA-GBM dataset, and genes with hazard ratios (HR ≠ 1) and P < 0.05 were selected. The survival package (v3.5-3) [38] was used to conduct a proportional hazards (PH) assumption test, retaining genes with P > 0.05. These candidate prognostic genes were visualized via the forestplot package (v2.0.1) [46]. Subsequently, least absolute shrinkage and selection operator (LASSO) regression analysis was conducted via the glmnet package (v4.1--4) [46] to identify key prognostic genes. Differential expression of the prognostic genes between GBM and normal samples in the TCGA-GBM dataset was analysed via the Wilcoxon rank-sum test (P < 0.05) to validate their expression profiles.
A risk model was constructed on the basis of the identified prognostic genes via the following formula:
Risk score

In this formula, "coef" represents the LASSO regression coefficient, and "expr" denotes the expression level of each prognostic gene.
Patients with GBM were stratified into high- and low-risk groups on the basis of the optimal cut-off values of risk scores. The survminer package (v0.4.9) [47] and ggrisk package (v1.3) [48] were used to visualize the risk score distribution, survival state distribution, and gene expression heatmap across the risk groups. KM survival curves comparing high- and low-risk groups were generated via the survminer and survival packages, with survival differences assessed via the log-rank test (P < 0.05). To assess the model's predictive performance, receiver operating characteristic (ROC) curves were plotted at 3, 5, and 7 years via the pROC package (v1.18.0) [49], and the area under the curve (AUC) was calculated. To validate the accuracy and generalizability of the HLMRGS model, the same analysis was performed within the CGGA-GBM dataset.
2.6 Gene set enrichment analysis
To elucidate the pathways and biological mechanisms associated with HLMRGS, differential expression analysis between the high- and low-risk groups within the TCGA-GBM dataset was performed via the DESeq2 package (v 1.40.2). Genes were ranked on the basis of their log2-fold change (log2 FC) in descending order, and gene set enrichment analysis (GSEA) was conducted via the clusterProfiler package (v4.2.2) with an adjusted P < 0.05. The reference gene set "c2.cp.kegg.v7.2.symbols.gmt" was sourced from the msigdbr package (v7.5.1) [50].
Additionally, GSEA was applied to prognostic genes within the TCGA-GBM dataset to investigate their functional roles and pathway differences. Using the KEGG pathway reference gene set "c2.cp.kegg.v7.2.symbols.gmt," Spearman correlation coefficients between prognostic genes and other genes were calculated with the cor function, applying thresholds of |cor| > 0.3 and P < 0.05. The resulting correlation coefficients were ranked in descending order, and individual GSEA analyses for each prognostic gene were performed via the clusterProfiler package, with an adjusted P < 0.05 as the significance criterion.
2.7 scRNA-seq data processing and expression pattern analysis of prognostic genes
To further examine the expression patterns of prognostic genes at the single-cell level, analyses were conducted via the scRNA-seq dataset.
The percentageFeatureSet function in the Seurat package (v5.1.0) [51] was applied for the initial filtering of the scRNA-seq data. Genes expressed in more than three cells were retained, while cells containing between 200 and 8,000 genes and gene counts ranging from 200--30,000 were included. Additionally, mitochondrial gene percentages were calculated, and cells whose mitochondrial gene content was less than 10% were selected. The data were standardized via the NormalizeData function (LogNormalize, scale.factor = 10,000), and the top 2,000 genes with the largest variance were identified via the FindVariableFeatures function. Further normalization was conducted with the ScaleData function. Principal component analysis (PCA) was performed via the RunPCA, ElbowPlot, and JackStraw functions, and principal components were identified for subsequent analyses (P < 0.05).
Following PCA, cell annotation was performed via the FindAllMarkers function (|log2 FC| > 0.5, P < 0.05) on the basis of marker genes from the literature [52]. Visualization of the annotation results was achieved through uniform manifold approximation and projection (UMAP) and bubble plots. Cell type proportions were calculated for the GBM and normal groups, and the cell type showing the greatest difference and highest proportion in the GBM group was identified as the key cell type.
Cell‒cell communication analysis was then conducted to investigate intercellular interactions between key cell types and other annotated cell types in both the GBM and normal groups via the CellChat package (v1.5.0) [53] (P < 0.05). To explore potential ligand‒receptor interactions, the CellPhoneDB database (v2.0) (https://www.cellphonedb.org/) was used for further analysis.
For a deeper understanding of the expression dynamics of prognostic genes, cell trajectory analysis was performed on the key cell types via the Monocle package (v2.26.0) [54]. This analysis simulated the differentiation trajectory of key cell types and assessed the expression trends of prognostic genes across different developmental stages.
2.8 Immune microenvironment analysis
Within the TCGA-GBM dataset, differences in the immune microenvironment between the HLMRGS groups were analysed. The relative proportions of 22 types of immune-infiltrating cells in the high- and low-risk groups, stratified by ssGSEA scores, were assessed and visualized via a stacked histogram. Immune cells with significant differences between groups were identified via the Wilcoxon rank-sum test (P < 0.05). Spearman correlation analysis was subsequently performed between these immune cells and prognostic genes via the psych package (v2.2.9) [55], and the results were visualized via the pheatmap package (v1.0.12) [41].
Somatic mutation data for patients with GBM were retrieved from the TCGA-GBM dataset. The maftools package (v2.20.0) (https://github.com/poisonalien/maftools) was utilized to analyse and visualize somatic mutation profiles for the high- and low-risk groups, providing insights into mutation patterns and their potential implications.
2.9 Independent prognostic analysis and nomogram establishment
To identify independent prognostic factors and evaluate the clinical applicability of the HLMRGS, age, sex, and risk score were subjected to univariate and multivariate Cox regression analyses (HR ≠ 1, P < 0.05). Factors that passed the proportional hazards (PH) assumption test (P > 0.05) were considered independent predictors. A nomogram model was constructed via the rms package (v6.7-0) [56] to predict survival probabilities at 3, 5, and 7 years. The model's predictive accuracy was evaluated by plotting ROC curves via the pROC package (v1.18.0), with the AUC calculated to quantify performance.
Independent prognostic analysis was conducted on the CGGA-GBM dataset to further validate the findings. Factors such as chemotherapy status, histology, O6-methylguanine-DNA-methyltransferase gene promoter (MGMTp), polygenic risk score (PRS), age, and sex were evaluated through univariate and multivariate Cox analyses (HR ≠ 1, P < 0.05) and the PH assumption test (P > 0.05). A nomogram model was then established to predict survival probabilities at 1, 2, and 3 years. Calibration curves, decision curve analysis (DCA), and receiver operating characteristic (ROC) curves were generated to assess the model's accuracy and clinical utility. These visualizations were produced via the rms package (v6.7-0) for calibration curves, the ggDCA package (v1.2) [57] for DCA curves, and the pROC package (v1.18.0) for ROC curves.
2.10 Drug sensitivity analysis and Chinese medicine prediction
To identify potential drugs for patients with GBM exhibiting high HLMRGS, 50% inhibitory concentration (IC50) values for 138 chemotherapy drugs from the Genomics of Drug Sensitivity in Cancer (GDSC) database (https://www.cancerrxgene.org/) were calculated for GBM samples in the TCGA-GBM dataset via the pRRophetic package (v0.5) [58]. Differences in the IC50 values between the high- and low-risk groups were evaluated via the Wilcoxon rank-sum test (P < 0.05). The top 10 drugs with the lowest p values were visualized via the ggplot2 package (v3.5.0).
To predict Chinese medicines with potential therapeutic effects for patients with GBM, prognostic genes were first analysed via GO enrichment analysis via the clusterProfiler package (v4.2.2), with P < 0.05 as the significance threshold. The identified prognostic genes and biological processes (BP) related to immune infiltration were then input into the Coremine Medical database (http://www.coremine.com/medical/) to identify related Chinese medicines (P < 0.05). The network linking prognostic genes, immune infiltration-related BPs, and Chinese medicines was visualized via Cytoscape software (v3.1.1).
2.11 Cell culture and Western blotting
For in vitro experiments, T98G, U87MG, and U251MG cells were obtained from Sichuan Bio Biotech Co., Ltd. (Chengdu, China), and HA1800 cells were obtained from Guangzhou Jennio Biotech Co., Ltd. (Guangzhou, China). The cells were cultured in DMEM (Gibco, Shanghai, China) supplemented with 10% fetal bovine serum (Vazyme, Nanjing, China) and 1% penicillin‒streptomycin (Solarbio, Beijing, China) at 37°C in a 5% CO2 incubator.
For Western blot analysis, total protein was extracted via RIPA lysis buffer (P10013B; Beyotime, Shanghai, China) supplemented with a protease and phosphatase inhibitor cocktail (P1045; Beyotime, Shanghai, China) on ice and quantified via a BCA protein assay kit (P0011; Beyotime, Shanghai, China). Equal amounts of protein were resolved by SDS‒PAGE and transferred onto PVDF membranes (ISEQ00010, Merck Millipore, USA). The membranes were blocked with 5% skim milk for 1 hour at room temperature, followed by overnight incubation with the following primary antibodies at 4°C: Kla (PTM-1401RM, PTMBIO, Hangzhou, China), HOXC11 (P12672, ProMab, Shanghai, China), HOXD10 (P05871, ProMab, Shanghai, China), SNCAIP (P34200, ProMab, Shanghai, China), TMEM100 (P30991, ProMab, Shanghai, China), and NLRP11 (PAB37681, Bioswamp, Wuhan, China). The membranes were then incubated with secondary antibodies (SA00001-1/SA00001-2; Proteintech, Wuhan, China) for 1 hour at room temperature. Protein bands were visualized via the SuperPico ECL Chemiluminescence Kit (E422-02, Vazyme, Nanjing, China) and standardized against histone H3 (MB9211S, Abmart, Shanghai, China) and β-actin (66009-1-Ig, Proteintech, Wuhan, China). Band intensities were analysed via ImageJ software.
2.12 Immunohistochemistry
Paraffin-embedded tissue samples were sectioned, deparaffinized, and subjected to antigen retrieval. Endogenous peroxidase activity was blocked, followed by serum blocking. The sections were incubated overnight at 4°C with the primary antibody Kla (1:100, PTM-1401RM, PTMBIO, Hangzhou, China) and then with the secondary antibody at room temperature for 50 minutes. Detection was carried out via DAB staining, and the nuclei were counterstained. The slides were subsequently dehydrated, sealed, and visualized under a microscope for interpretation of the results.
2.13 Lactate measurement
Cells were harvested by trypsin digestion, washed with PBS, and subjected to ultrasonic disruption on ice. After centrifugation, the supernatant was collected. Following the protocol of the lactate assay kit, samples were reacted and absorbance was measured using a microplate reader. Simultaneously, protein concentration was determined via the BCA method to normalize lactate content in the final calculation.
2.14 Statistical analysis
Statistical analyses were conducted via GraphPad Prism 9, whereas bioinformatics analyses were performed via R (v4.2.2). Group comparisons were carried out via the Wilcoxon rank-sum test, Student's t test, or one-way ANOVA, as appropriate. The data are presented as the means ± standard deviations, with P < 0.05 considered statistically significant.
3. Results
3.1 Global HLM levels are increased in GBM patients and associated with survival
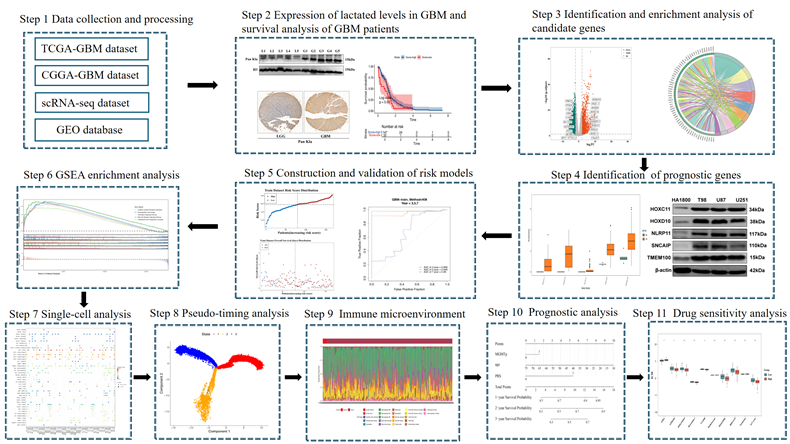
This study aimed to evaluate the clinical significance and potential value of HLM in GBM (Figure 1). Western blot analysis of glioma clinical samples revealed elevated global lactylation levels in GBM compared with low-grade glioma (LGG) (Figure 2a). Immunohistochemical staining further validated this observation, revealing increased global lactylation levels in GBM tissue samples relative to LGG samples (Figure 2b). ssGSEA revealed that the ssGSEA scores of the HLMRGs were significantly greater in the GBM samples than in the normal control samples (P < 0.05) (Figure 2c).
Flow chart of this study.
Validation of clinical samples for gliomas. (a) Results of western blot validation. (b) Results of immunohistochemical staining. (c) Results of ssGSEA. (d) Results of the KM survival analysis.
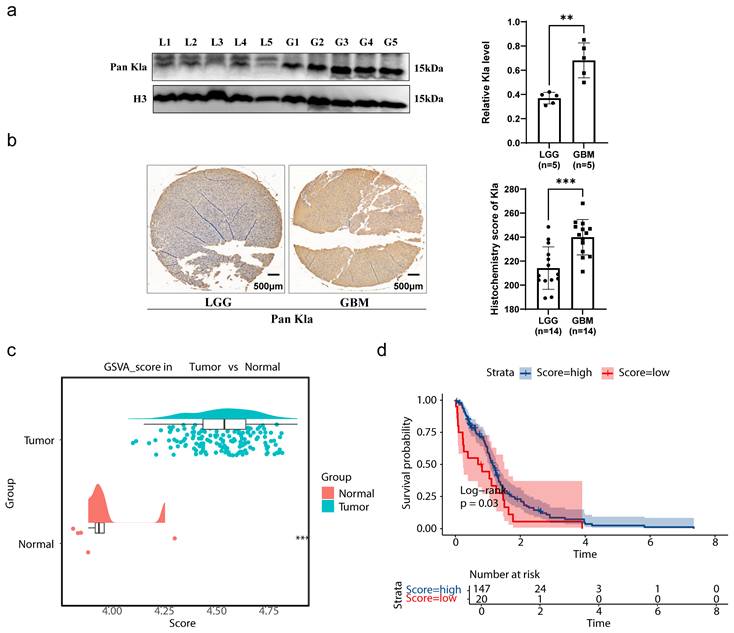
Using the optimal cut-off value for the ssGSEA scores of the HLMRGs (4.350889), the GBM samples were stratified into high- and low-scoring groups. K‒M survival analysis revealed significant differences in survival between the two groups (P = 0.03), with patients in the low-score group exhibiting poorer survival probabilities. These findings suggest an association between global HLM levels and the survival and prognosis of patients with GBM (Figure 2d). In parallel with these findings, we have incorporated comprehensive lactate quantification data comparing normal astrocytes with GBM cell lines in Supplementary Figure S7. Quantitative analysis revealed that GBM cell lines demonstrated markedly elevated lactate levels compared to HA1800 astrocytes (p < 0.0001). The demographic and clinical characteristics of the study cohort are comprehensively summarized in Table S1.
3.2 Related functional pathways and complex PPI network of HLMRGs in GBM
A total of 3,343 DEGs were identified between the GBM and normal groups, including 1,577 upregulated genes and 1,766 downregulated genes. A volcano plot highlighted the most significantly upregulated and downregulated genes, with the top 10 genes labelled (Figure 3a). The expression patterns of these DEGs were visualized via a heatmap (Figure 3b).
Identification of candidate genes. (a) Volcano map of differentially expressed genes. The green dots indicate genes whose expression was differentially downregulated, the red dots indicate genes whose expression was differentially upregulated, the gray dots indicate genes whose expression was not significantly different, and the names of the genes whose expression was differentially upregulated and downregulated in the top ten multiplicities of difference are indicated. (b) Heatmap of differentially expressed genes. (c) Results of sample clustering. (d) Screening of soft thresholds. (e) Dendrogram of gene clusters. (f) Heatmap of the relationships between the HLMRG scores and color modules are shown on the left, and the color bands on the right represent correlations. In the middle heatmap, darker colours indicate greater correlations, blue represents negative correlations, red represents positive correlations, and the numbers in each cell indicate correlations and significance (in parentheses). (g) Venn diagram used to identify candidate genes.
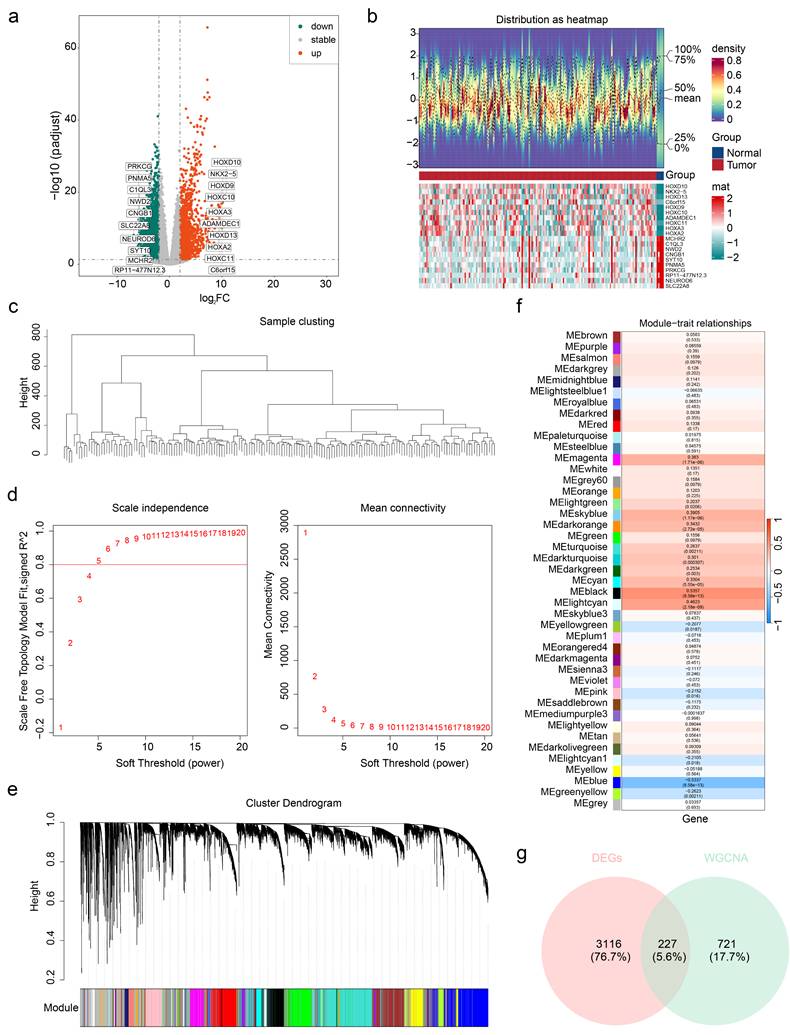
Following sample clustering and confirmation of data quality (Figure 3c), WGCNA was performed. An optimal soft threshold of 5 was selected on the basis of the scale-free topology fit index (signed R2 = 0.8) and mean connectivity. This analysis grouped genes into 42 coexpression modules (Figure 3d-e). Among these, the MEblack module, containing 948 genes, exhibited the strongest correlation with the ssGSEA scores of the HLMRGs (cor = 0.5357015, P < 0.001) and was identified as the key module (Figure 3f).
From the intersection of the DEGs and key module genes, 227 candidate genes associated with HLM in GBM were identified (Figure 3g). GO enrichment analysis revealed significant enrichment in 403 entries, including 318 BP, 57 CC, and 28 MF terms. Key enriched processes, such as chromosome segregation, nuclear division, and organelle fission, were visualized (Figure S1a). KEGG pathway analysis revealed 25 significantly enriched pathways, including those related to the cell cycle, oocyte meiosis, and cellular senescence, with the top 10 pathways highlighted (Figure S1b). These findings suggest that candidate genes are involved primarily in critical cellular processes and pathways, shedding light on the functional roles of HLMRGs in GBM. PPI network analysis further revealed 153 proteins and 1,287 interaction pairs, highlighting the complex interactions among proteins encoded by the candidate genes. These findings underscore the potential importance of HLMRGs in GBM cellular functions and progression (Figure S1c).
3.3 HLMRGs demonstrated strong predictive power for GBM prognosis
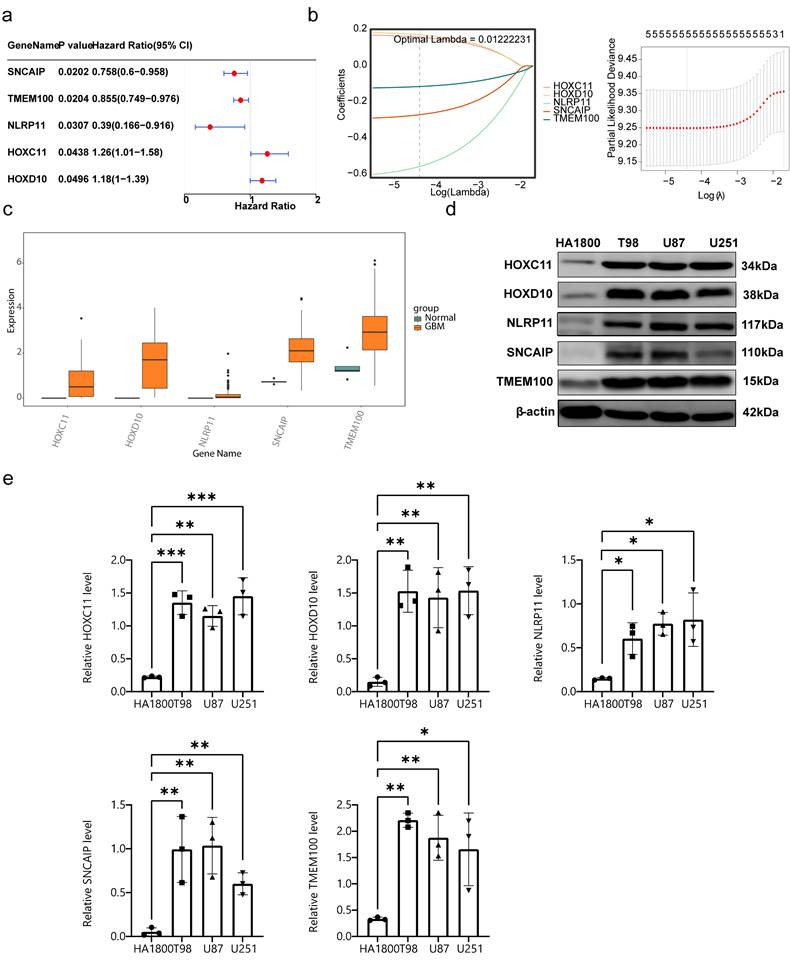
Univariate Cox analysis identified SNCAIP, TMEM100, NLRP11, HOXC11, and HOXD10 as candidate prognostic genes (Figure 4a). Among these, SNCAIP, TMEM100, and NLRP11 were associated with better prognoses (HR < 1), suggesting their potential inhibitory effects on GBM progression. In contrast, HOXC11 and HOXD10 were linked to worse prognoses (HR > 1), indicating their possible roles in promoting GBM progression. Additionally, the PH assumption test confirmed that these genes satisfied the PH assumption (P > 0.05) (Table S2). LASSO regression analysis further validated these five genes as key prognostic markers (lambda min = 0.01222231) (Figure 4b). All five genes presented significantly higher expression levels in GBM samples than in normal control samples, highlighting their relevance to GBM progression and their potential as therapeutic targets (Figure 4c). The protein expression levels of these genes were verified in normal human astrocytes and three GBM cell lines (T98G, U87MG, and U251MG) through Western blot analysis. The results demonstrated that the protein levels of the five prognostic genes were significantly elevated in GBM cell lines compared with normal astrocytes, which aligns with the gene expression analysis results (Figure 4d-e). In parallel with these findings, we have supplemented the data on Kla protein levels in normal astrocytes and different GBM cell lines, as shown in Figure S8. The results revealed that compared to HA1800 cells, the expression levels of Kla in GBM cell lines were significantly higher, with statistically significant differences. This trend aligns with the detection results of prognostic genes in GBM cell lines, indicating that there is indeed a correlation between prognostic genes and lactylation.
Screening for prognostic genes. (a) Results of univariate Cox analysis. (b) Results of LASSO regression analysis. (c) Expression of prognostic genes in the GBM and control groups. (d-e) Protein expression level analysis of 5 prognostic genes.
On the basis of the identified prognostic genes, a risk model named the HLMRGS model was constructed via the following formula: risk score = (-0.2698277) × SNCAIP expression level + (-0.1142342) × TMEM100 expression level + (-0.5557958) × NLRP11 expression level + (0.1585500) × HOXC11 expression level + (0.1718749) × HOXD10 expression. Using this model, 166 patients with GBM from the TCGA-GBM dataset were stratified into high- and low-risk groups (87:79) on the basis of the optimal cut-off value (-0.5511703). Risk score distribution and survival state analyses demonstrated that higher risk scores were correlated with increased mortality in patients with GBM (Figure 5a). KM survival analysis revealed that patients in the low-risk group had significantly better survival probabilities (P < 0.001) (Figure 5b). The AUCs for 3-, 5-, and 7-year survival exceeded 0.6, reflecting the strong predictive performance of the model (Figure 5c).
Construction of prognostic models. (a-1) Risk score distribution of GBM patients. (a-2) Survival state distribution of GBM patients. (b) K‒M curves for patients in the high- and low-risk groups. (c) ROC curves for patients at 3, 5 and 7 years. (d-1) Risk score distributions of the high- and low-risk groups. (d-2) Survival distribution of the high- and low-risk groups. (e) Distribution of the KM survival curve. (f) Distribution of the ROC curve.
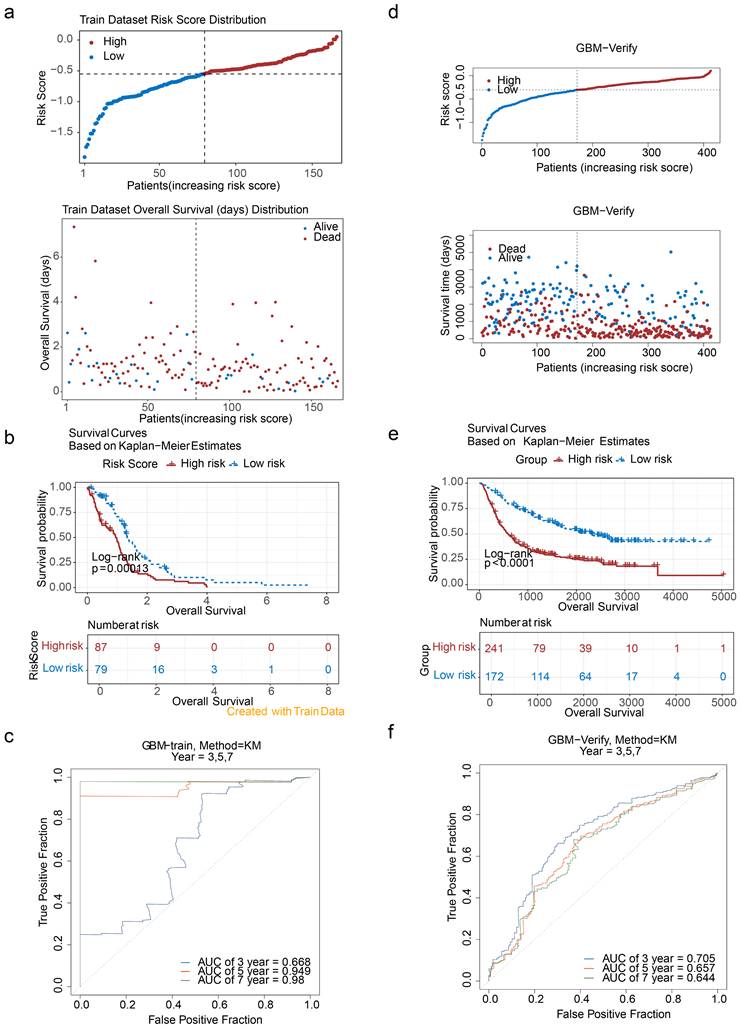
To validate the model, it was applied to the CGGA-GBM dataset, where 413 patients with GBM were similarly divided into high- and low-risk groups (241:172) on the basis of an optimal cut-off value (-0.3031568). The distributions of risk scores and survival states (Figure 5d), KM survival curves (Figure 5e), and ROC curves (AUC exceeding 0.6) (Figure 5f) were consistent with the results from the TCGA-GBM dataset. These findings underscore the robustness and generalizability of the HLMRGS model, demonstrating its efficacy in stratifying patient risk and predicting survival outcomes across independent datasets. The HLMRGS model provides a promising tool for personalized prognostic assessment in GBM clinical practice, offering valuable insights for tailoring patient management and improving outcome predictions. We used the "ssGSEA" algorithm in the R package "GSVA" to calculate HLMRGs scores with WHO grades in the CGGA dataset, and used Wilcoxon rank sum test (p<0.05) to analyze the differences in HLMRGs scores among different WHO grades (Figure S9). The results showed that HLMRGs scores were significantly different between WHO IV grade and WHO II, WHO III grade samples.
3.4 Potential mechanisms associated with HLMRGS and prognostic genes
Pathway enrichment analysis via GSEA within the TCGA-GBM dataset revealed that DEGs between the high- and low-risk HLMRGS groups were significantly associated with pathways such as cytokine‒cytokine receptor interactions, hematopoietic cell lineages, and chemokine signalling (Figure S2a). These results suggest the multifaceted roles of differentially expressed genes in GBM pathogenesis. Additionally, pathways associated with the identified prognostic genes were examined, highlighting the five pathways most significantly associated with each gene. SNCAIP was enriched in 55 pathways, including allograft rejection (Figure S2b). TMEM100 and NLRP11 are linked to pathways such as the cell cycle (51 and 14 pathways, respectively) (Figure S2c-d). HOXC11 was associated with 54 pathways, including the calcium signalling pathway (Figure S2e), and HOXD10 was enriched in 33 pathways, such as antigen processing and presentation (Figure S2f). Notably, pathways such as the cell cycle and spliceosome were enriched across multiple prognostic genes, emphasizing their potential roles in GBM progression. These findings underscore the importance of further exploration of these pathways to elucidate how HLM levels influence GBM progression. Therapeutic strategies targeting prognostic genes or these pathways may offer innovative approaches for GBM treatment.
At the single-cell level, scRNA-seq data were processed to investigate the underlying mechanisms involved. Initial filtering and quality control metrics, including nFeature RNA, nCount RNA, and percent.mt, are presented in Figure S3. After filtering, the integrated dataset comprised 95,428 cells and 24,983 genes. The degree of variation in these genes, with the top 10 most variable genes labelled, is shown in Figure S4. PCA confirmed that the cells from all eight samples were well integrated without outliers (Figure S5), validating the suitability of the dataset for further analysis. On the basis of the inflection point plot and PCA replacement test, the top 20 principal components were retained (Figure 6a). The cells were subsequently clustered and annotated into eight subtypes via marker genes, including dendritic cells (DCs), macrophages (Macro), microglia (Micro), neutrophils (Neutro), endothelial cells (Endoth), T cells (TCs), B cells (BCs), and proliferating macrophages (MPs) (Figure 6b). The proportions of these cell types in the GBM and normal groups were compared, revealing that DCs were most abundant in the normal group, whereas microglia were present in the highest proportion in the GBM group (Figure 6c). Given the established association between microglia and GBM progression, microglia were identified as the key cell type for further analysis.
Analysis of cellular communication. (a-1) Inflection plot for PCA. (a-2) The top 20 principal components of the PCA. (b-1) Bubble diagram of marker gene expression in different cell types. (b-2) Visualization of cell clusters after cell annotation. (c) Proportion of annotated cells in the GBM and normal groups. (d) Communication network between Micro and different cells. (e) Specific receptor‒ligand interactions between different cell types.
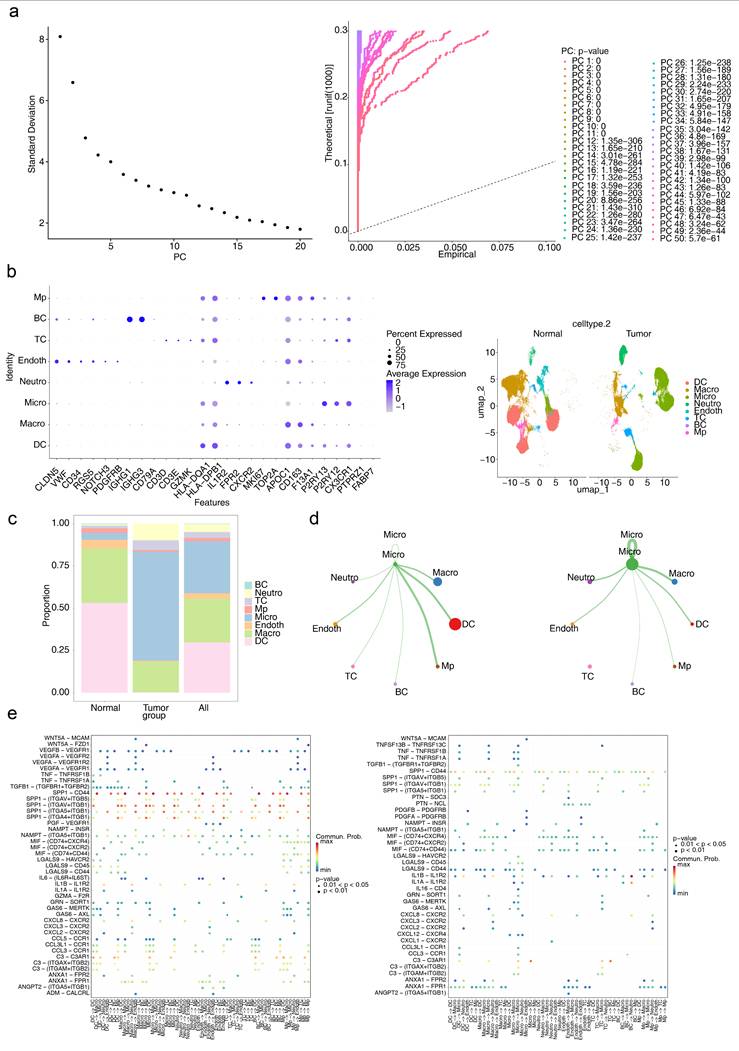
Intercellular interactions between Micro and other cell types were further analysed. In the normal group, Micro exhibited interactions with all other cell types, with the strongest interactions observed between Micro and DCs and MPs. Conversely, in the GBM group, no interactions were detected between Micro and TCs, whereas interactions with Macro and Neutro were the strongest (Figure 6d). These findings highlight the distinct roles of various cell types in the intercellular communication networks of the GBM and normal groups. Ligand‒receptor interactions were also examined, with notable differences identified. The SPP1‒CD44 axis is strongly implicated in numerous interactions, such as Micro-TCs, in the normal group but plays a diminished role in GBM, suggesting that interactions such as Micro-TCs are highly influenced by the SPP1‒CD44 ligand‒receptor pair and are significantly affected in the GBM microenvironment (Figure 6e).
The differentiation trajectories of Micro plants were analysed to illustrate their dynamic behavior over time, with darker colors in the graph indicating earlier cell differentiation (Figure S6a). The trajectory revealed three distinct differentiation states of Micro (Figure S6b). In the normal group, subpopulation 2 was the dominant state, whereas subpopulations 1 and 3 were predominant in the GBM group (Figure S6c). Additionally, a greater proportion of cells was observed at the terminal differentiation stages in the GBM group than in the normal group, indicating increased heterogeneity of Micro in the GBM group (Figure S6d). These findings suggest that Micro plays a pivotal role in GBM progression. Notably, no significant differences were found in the expression patterns of prognostic genes within Micro across distinct differentiation states (Figure S6e). These findings indicate that changes in the proportions of microsubpopulations, rather than the expression of prognostic genes, might be critical in GBM progression. These results suggest that the role of HLM in GBM progression and prognosis may involve additional cellular or molecular mechanisms beyond the direct expression patterns of HLMRGs in key cell types.
3.5 The role of HLMRGs in the immune microenvironment
The relative percentages of 22 immune cell types differed significantly between the high- and low-risk groups, as determined by HLMRGS (Figure 7a). Among these, 16 immune cell types, including activated dendritic cells, had significantly higher infiltration scores in the high-risk group (Figure 7b). Correlation analysis between these differential immune cell types and prognostic genes revealed inverse relationships (P < 0.05), with the strongest negative correlation observed between SNCAIP and type 1 T helper (Th1) cells (|cor| > 0.3, P < 0.05) (Figure 7c). These findings suggest that the immune microenvironment is significantly altered between risk groups, underscoring the role of HLM in modulating immune responses. Furthermore, the identified prognostic genes offer potential targets for personalized therapeutic strategies in GBM.
Results of immune infiltration analysis. (a) Relative percentages of 22 immune cell types. (b) Infiltration scores for immune cell types. (c) Correlations between differential immune cell types and prognostic genes. (d) Somatic mutations in high-risk groups. (e) Somatic mutations in low-risk groups.
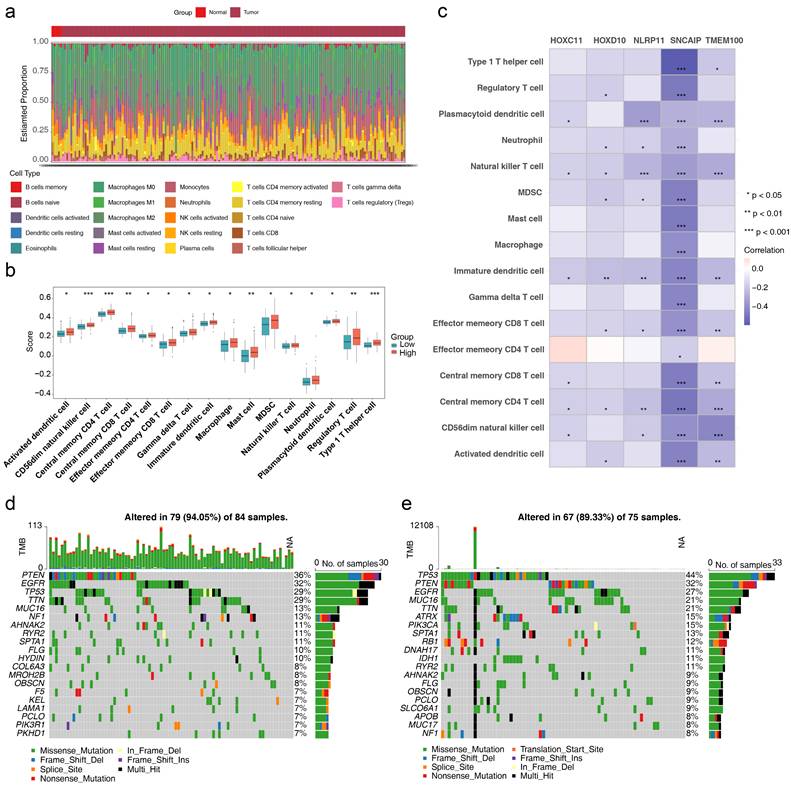
The somatic mutation profiles of the two risk groups were also examined (Figure 7d-e). Missense mutations dominated in both groups. PTEN mutations were present in 36% of the high-risk group, whereas TP53 mutations were observed in 44% of the low-risk group. These results imply that HLM levels may influence tumor mutation profiles, providing insights into the interplay between HLM and genomic alterations. These findings offer potential avenues for personalized treatment strategies and refined prognostic assessments in GBM.
3.6 A nomogram integrating the HLMRGS and clinical characteristics was established for accurate prediction
Cox regression analysis of the TCGA-GBM dataset revealed that risk score and age were independent prognostic factors (P < 0.001) (Figure 8a), both of which satisfied the PH assumption (P > 0.05) (Table S3). A nomogram was constructed, which demonstrated that higher total points corresponded to improved survival probabilities (Figure 8b). The model's predictive accuracy was robust, with AUCs for 3-, 5-, and 7-year survival exceeding 0.6, validating its effectiveness as a clinical tool for GBM prognosis (Figure 8c).
Construction of the nomogram. (a) Independent prognostic analysis of the TCGA-GBM dataset. (b) Construction of a nomogram in the TCGA-GBM dataset. (c) ROC curves for the nomogram. (d-e) Independent prognostic analysis of the CGGA-GBM dataset. (f) Construction of a nomogram in the CGGA-GBM dataset. (g) Calibration curve for the nomogram. (h) DCA curves for the nomogram. (i-k) ROC curves for the nomogram in the CGGA-GBM dataset.
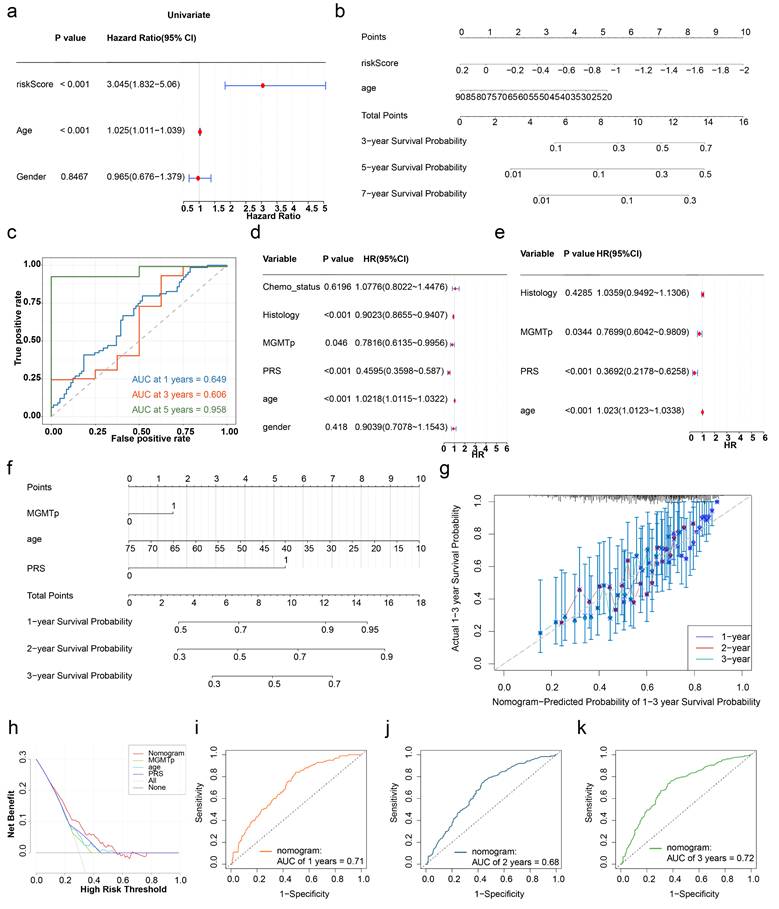
In the CGGA-GBM dataset, age, PRS, and MGMTp were identified as independent prognostic factors (P < 0.05) (Figure 8d-e), and the PH assumption test confirmed their validity (P > 0.05) (Table S4). A corresponding nomogram was established (Figure 8f), with a calibration curve slope close to 1, indicating excellent agreement between the predicted and observed survival probabilities. DCA demonstrated a greater net benefit for the nomogram than for the individual genes did (Figure 8g-h). The model's AUCs for 1-, 2-, and 3-year survival exceeded 0.6, confirming its superior predictive ability (Figure 8i-k). In summary, the nomograms integrating the HLMRGS and clinical characteristics showed exceptional predictive accuracy and clinical applicability in GBM patients.
3.7 Identification of potential therapeutic drugs for GBM patients with high HLMRGS and targeted prognostic genes
Analysis of the therapeutic drugs revealed significant differences in the IC50 values of the 12 drugs between the high- and low-risk groups, with the top 10 drugs showing the most significant changes (Figure 9a). Among these drugs, AZD6244 exhibited a lower IC50 in the high-risk group, suggesting increased sensitivity in patients with GBM with high HLMRGS, potentially enabling better therapeutic effects at lower doses. Conversely, ATRA had a lower IC50 in the low-risk group than in the high-risk group, indicating improved efficacy in patients with low HLMRGS. These variations may reflect differences in drug metabolism or mechanisms of action influenced by prognostic genes. These findings suggest that HLMRGs could modulate drug sensitivity, providing a basis for personalized drug therapy in GBM. This approach could optimize treatment plans on the basis of HLMRGS stratification and increase the therapeutic efficacy of targeted drugs.
Potential therapeutic drugs for GBM patients. (a) Drug sensitivity analyses for the high- and low-risk groups. (b) GO enrichment analysis of prognostic genes. (c) Traditional Chinese medicines related to prognostic genetic and biological parameters associated with immune infiltration.
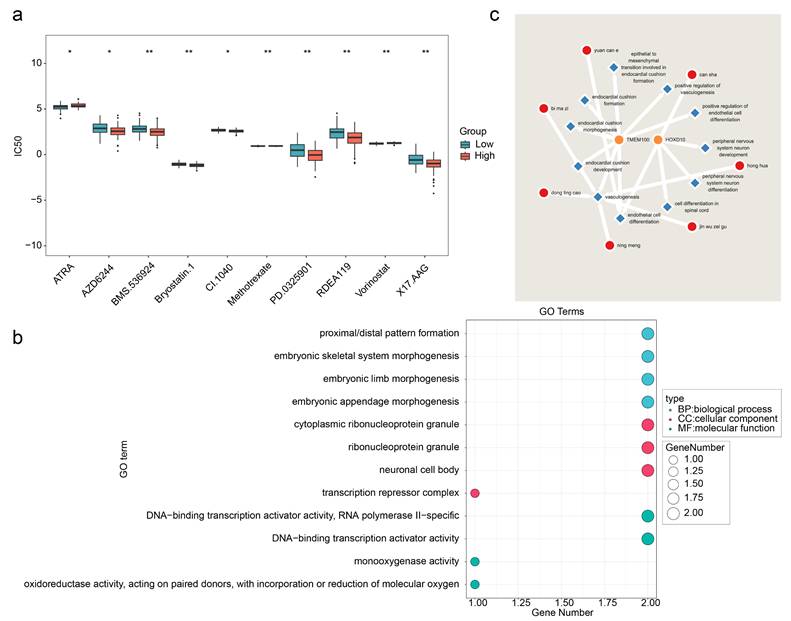
In addition, enrichment analysis of the prognostic genes revealed 96 significant GO terms, including 86 BPs, 6 CCs, and 4 MFs. The top four significant entries, such as those related to proximal/distal pattern formation, were visualized (Figure 9b). Thirteen immune infiltration-related BPs were identified, including positive regulation of endothelial cell differentiation (Table S5). Chinese medicine predictions revealed that Can sha corresponded directly to HOXD10, whereas no direct matches were found for the other prognostic genes. However, a total of 7 Chinese medicines were predicted for all the immune infiltration-related BPs of prognostic genes, among which 2 Chinese medicines were predicted for endothelial cell differentiation, namely, can sha and Yuan can e, whereas 5 Chinese medicines were predicted for vasculogenesis, namely, Bi ma zi, Dong ling cao, Ning meng, Jin wu zei gu and Hong hua (Figure 9c). These medicines may exert therapeutic effects by targeting HLMRGs or their associated biological processes, suggesting their potential as therapeutic agents for patients with GBM.
4. Discussion
GBM is an aggressive and incurable brain tumor characterized by a low 5-year survival rate and a high recurrence rate [59]. HLM is a histone modification associated with metabolic stress that plays a crucial role in immune regulation and the maintenance of homeostasis in diseases such as cancer. [24, 60]. This study integrated scRNA-seq and bulk RNA-seq data to evaluate the prognostic significance of HLMRGs in GBM via bioinformatics approaches. A prognostic risk model was constructed on the basis of five key genes (SNCAIP, TMEM100, NLRP11, HOXC11, and HOXD10) to analyse the molecular regulatory mechanisms and immune characteristics associated with HLMRGs. The ultimate goal is to facilitate the development of targeted therapies for GBM and improve patient survival.
Our findings revealed elevated Kla levels in GBM, which were significantly associated with patient prognosis. These results align with previous studies reporting that increased Kla in gastric cancer and malignant melanoma correlates with poor prognosis, suggesting that Kla is a potential prognostic biomarker in these malignancies [24, 61]. Furthermore, the high-risk group exhibited significantly higher infiltration scores for 16 distinct immune cell types, including activated dendritic cells, compared to the low-risk group. Notably, there was a discernible divergence in the immune microenvironment across the HLMRGS groups. These findings suggest that HLM may contribute to GBM progression by modulating the immune microenvironment. Recent studies support this notion, showing that lactate generation inhibitors can alleviate immunosuppression in the tumor microenvironment and potentially enhance CAR-T-cell efficacy in GBM treatment [20]. Furthermore, PERK-driven glucose metabolism has been shown to promote the immunosuppressive activity of monocyte-derived macrophages (MDMs) through histone lactylation, and combining such approaches with immunotherapy may effectively inhibit GBM progression [62]. In summary, these findings highlight the pivotal role of histone lactylation in the prognosis and immunotherapy of patients with GBM.
TCGA-GBM transcriptome data analysis revealed five prognostic genes (HOXC11, HOXD10, TMEM100, SNCAIP, and NLRP11) that are significantly overexpressed in GBM and are likely associated with its progression. The HOXC11 gene, a member of the homeobox gene family, plays a critical role in the morphogenesis of multicellular organisms [63]. In GBM, a risk model incorporating HOXC11 has demonstrated the ability to predict patient prognosis [64]. HOXC11 is overexpressed in colorectal cancer (CRC) and lung adenocarcinoma (LUAD) and is associated with poor patient prognosis. HOXC11 can regulate the chemotherapy resistance of CRC and increase the proliferation, migration and invasion of LUAD cells [63, 65]. HOXD10, a member of the Abd-B homeobox gene family, has emerged as a detrimental prognostic biomarker in glioblastoma patients, aligning seamlessly with the conclusions drawn from the present investigation[66]. Previous research has demonstrated that miRNA-23a and miRNA-10b regulate GBM tumor invasion by targeting HOXD10 [67, 68]. TMEM100 is distributed across various cellular components and serves as a marker for the mitotic subtype of GBM, one of three primary subtypes, alongside invasive and intermediate types [69]. Its downregulation has been implicated in nonleptomeningeal metastasis in patients with GBM [70]. In addition to its role in GBM, TMEM100 serves as a prognostic marker in esophageal cancer, LUAD, and gastric cancer, where it is closely linked to immune cell infiltration [71-73]. The overexpression of TMEM100 has been shown to inhibit the proliferation, invasion, and migration of esophageal squamous cell carcinoma cells [71].
Additionally, TMEM100 suppresses proliferation, migration, and invasion in prostate cancer, as well as migration and angiogenesis in colorectal cancer (CRC) cells [74, 75]. SNCAIP is an intracellular prognostic marker in GBM that is involved in cytoplasmic inclusion body formation and neurodegeneration [76]. SNCAIP duplication may promote the development of type 4 medulloblastoma by inducing PRDM6 [77]. Patients with metastatic clear cell renal cell carcinoma are more likely to present with SNCAIP alterations [78]. NLRP11, a member of the NOD-like receptor protein family, is implicated in the proliferation and metastasis of LUAD [79], as well as in steroid-resistant multiple myeloma and retinoblastoma [80, 81]. In summary, these five prognostic genes not only are prognostic markers of GBM but also may play important roles in the proliferation, migration, invasion, angiogenesis, immune infiltration and chemotherapy resistance of GBM.
GSEA identified the cytokine‒cytokine receptor interaction pathway as a key pathway distinguishing high- and low-risk groups in GBM. Previous investigations have elucidated that HOXD10 expression predominantly encompasses this pathway, with its role demonstrating variability—often even exhibiting opposing effects—across different stages of GBM progression and development.[66]. This pathway is critical for GBM growth and immune evasion [82]. The differential roles of HOXD10 in various stages of GBM suggest that its high expression may modulate the activity of this pathway, exerting multifaceted effects on tumor progression. Th1-like CD4 T helper cells are critical for antitumour immunity and long-term survival in patients with GBM [83]. Studies have shown that knocking down NLRP11 in Burkitt B lymphoma cells increases IFN-γ and IL-17A and that adenosine negatively regulates Th1 cell responses via NLRP11 [84]. These findings underscore the significant role of NLRP11 and immune cells in the tumor immune response.
In this study, immune cell infiltration analysis revealed significant differences in immune cell populations, particularly Th1 cells, between the high- and low-risk GBM groups, with these cells strongly correlated with prognostic genes. These results suggest that prognostic genes may regulate the GBM immune microenvironment by influencing immune cell activity and function, thereby affecting tumor progression and therapeutic responses. Understanding these relationships could facilitate the development of novel immunotherapy strategies to improve treatment outcomes in GBM patients. Interactions between microglia and Th1 cells have been reported to stimulate microglia-mediated antitumour effects in GBM [83]. Grounded in cell trajectory analysis, prognostic genes are shown to modulate microglia-Th1 cell interactions through the alteration of their expression profiles, thereby assuming a critical role in the initiation and progression of GBM.
We know that GBM contains a variety of immune infiltrating cells[85], immune-infiltrating cells play an important role in cancer proliferation and development[86, 87]. We know that glycolysis and lactate play an important role in tumor growth, while lactate enhances the expression of regulatory T cells and helps to defend against malignant cells, thereby escaping the attack of the immune system [88, 89]. Studies have reported that high lactate can affect immune infiltrating cells, lactate regulates the metabolism of endogenous and adaptive immune cells through lactylation modification to form immunosuppression, and this possible mechanism needs to be explored [90, 91]. Regulatory T cells (Tregs) play a crucial role in maintaining the immunosuppressive microenvironment, and lactate can promote tumorigenesis by regulating the lactatation of MOESIN and enhancing TGF-β signaling, thereby inducing the production of efficient Tregs [90]. High concentrations of lactate can inhibit the secretion of proinflammatory cytokines by cytotoxic T lymphocytes (CTLS), lead to T cell dysfunction, and induce immunosuppression [90, 92, 93]. Lactate-associated polarization of tumor-associated macrophages plays an important role in the immune escape of malignant tumors [90, 94]. Lactate can recruit peripheral blood macrophages to infiltrate the tumor site, and then induce the expression of vascular endothelial growth factor and arginase 1 to influence polarization [94, 95]. The level of lactate is closely related to immune signaling and contributes to the remodeling of the tumor environment [96, 97]. High lactate can lead to tumor immune escape by impairing tumor surveillance by T or NK cells [36, 93].
Analysis of the scRNA-seq datasets revealed Micro as the predominant cell population in GBM, which is consistent with the findings of previous studies [98, 99]. Microglia are essential for anti-GBM CD4+ T-cell responses and the inhibition of tumor growth [83]. However, microglia and macrophages can also secrete cytokines and growth factors that contribute to immune evasion, tumor growth, and invasion [100].
Cytokines released by GBM cells can interact with microglia to increase glutamate levels in the tumor microenvironment, driving astrocyte scar formation, which in turn limits GBM growth [101]. These findings highlight the dual role of microglia in GBM development and the tumor microenvironment. In light of the significant infiltration of microglia in GBM, which contributes to tumor progression, immunosuppression, and therapy resistance [99], it is a plausible speculation that prognostic genes may regulate microglial infiltration by manipulating their expression patterns. This modulation could have profound effects on GBM progression and treatment resistance.
This study identified five HLM-related prognostic genes with significant prognostic value in GBM, and the risk model constructed using these genes demonstrated strong and stable predictive performance for GBM prognosis. These findings provide a theoretical foundation and direction for early GBM diagnosis, treatment, and investigation of HLMRG mechanisms. However, this study has certain limitations. The molecular mechanisms underlying the expression of prognostic genes in GBM have not been explored. Additionally, the predictive power of the risk model and the clinical applicability of identified therapeutic drugs require further validation through large-scale, evidence-based research. Prospective studies are necessary to confirm these findings and to further elucidate the mechanisms by which HLM-related prognostic genes influence GBM progression and treatment outcomes.
5. Conclusion
In this study, histone lactylation was found to have an important effect on the clinical prognosis of GBM patients, and five HLM-related prognostic genes (SNCAIP, TMEM100, NLRP11, HOXC11, and HOXD10) were identified in GBM patients. The established prognostic model showed good prognostic ability for GBM patients. HLMRGs play important roles in cell cycle regulation, cell interactions, and immune cell infiltration and identify potential therapeutic drugs for GBM. These results provide a solid theoretical basis and valuable reference for the development of personalized treatment strategies and targeted drugs for GBM therapy.
Supplementary Material
Supplementary figures and tables.
Acknowledgements
We thank the Sichuan Neurosurgery Clinical Medical Research Center for providing the clinical tissue samples and the Gene Expression Omnibus (GEO), Cancer Genome Atlas (TCGA), and Chinese Glioma Genome Atlas Database for sharing a large amount of data. The graphic figure was created with BioRender.com.
Funding
This study was supported by grants from the Sichuan Science and Technology Support Program (2023NSFSC0028, 2024ZYD0113, 2023YFH0069), the Scientific Research Project of the Sichuan Provincial Health Commission (23LCYJ040), the Luzhou Government-Southwest Medical University Cooperation Project (2021LZXNYD-P01, 24YKDZD0010, 2021LZXNYD-D07), the Southwest Medical University Project (2021ZKZD013), and the Songshan Lake Innovation Center of Medicine & Engineering of Guangdong Medical University (4SG22317P).
Ethics approval and consent to participate
This study was conducted in accordance with the principles of the Helsinki Declaration and approved by the ethics Committee of the Affiliated Hospital of Southwest Medical University (Luzhou, China).
Author contributions
Conceptualization, Y.J., V.K.W.W. and J.P.; methodology, W.H., R.C., G.C., Y.J., V.K.W.W. and J.P.; software, L.Z. and Y.Q.; validation, W.H., R.C. and G.C.; formal analysis, L.Z., Y.Q. and J.Z.; investigation, W.H., R.C., G.C., L.Z., Y.Q., J.Z., Y.J., V.K.W.W. and J.P.; resources, J.Z.; data curation, L.Z., Y.Q. and J.Z.; writing—original draft preparation, W.H., R.C. and G.C.; writing—review and editing, W.H., R.C.,G.C., Y.J., V.K.W.W. and J.P.; visualization, Y.Q. and J.Z.; supervision, Y.J., V.K.W.W. and J.P.; project administration, Y.J., V.K.W.W. and J.P.; funding acquisition, Y.J., J.P. and R.C.; All authors have read and agreed to the published version of the manuscript.
Availability of data and materials
The datasets analysed during the current study are available in the [GEO] repository [https://www.ncbi.nlm.nih.gov/geo/], the [TCGA] repository [https://portal.gdc.cancer.gov/], the [CGGA] repository [http://www.cgga.org.cn/], and the [STRING] repository [https://cn.string-db.org/].
Consent for publication
All the authors agreed to publish this research manuscript.
Competing Interests
The authors have declared that no competing interest exists.
References
1. Tan AC, Ashley DM, López GY, Malinzak M, Friedman HS, Khasraw M. Management of glioblastoma: State of the art and future directions. CA Cancer J Clin. 2020;70:299-312
2. Ostrom QT, Gittleman H, Truitt G, Boscia A, Kruchko C, Barnholtz-Sloan JS. CBTRUS Statistical Report: Primary Brain and Other Central Nervous System Tumors Diagnosed in the United States in 2011-2015. Neuro Oncol. 2018;20:iv1-iv86
3. Hadziahmetovic M, Shirai K, Chakravarti A. Recent advancements in multimodality treatment of gliomas. Future Oncol. 2011;7:1169-83
4. Zdioruk M, Jimenez-Macias JL, Nowicki MO, Manz KE, Pennell KD, Koch MS. et al. PPRX-1701, a nanoparticle formulation of 6'-bromoindirubin acetoxime, improves delivery and shows efficacy in preclinical GBM models. Cell Rep Med. 2023;4:101019
5. McClellan BL, Haase S, Nunez FJ, Alghamri MS, Dabaja AA, Lowenstein PR. et al. Impact of epigenetic reprogramming on antitumor immune responses in glioma. J Clin Invest. 2023;133:e163450
6. Ghosh MK, Chakraborty D, Sarkar S, Bhowmik A, Basu M. The interrelationship between cerebral ischemic stroke and glioma: a comprehensive study of recent reports. Signal Transduct Target Ther. 2019;4:42
7. Ye L, Jiang Y, Zhang M. Crosstalk between glucose metabolism, lactate production and immune response modulation. Cytokine Growth Factor Rev. 2022;68:81-92
8. Li H, Lin C, Qi W, Sun Z, Xie Z, Jia W. et al. Senecavirus A-induced glycolysis facilitates virus replication by promoting lactate production that attenuates the interaction between MAVS and RIG-I. PLoS Pathog. 2023;19:e1011371
9. Li X, Yang Y, Zhang B, Lin X, Fu X, An Y. et al. Lactate metabolism in human health and disease. Signal Transduct Target Ther. 2022;7:305
10. Liberti MV, Locasale JW. Correction to: 'The Warburg Effect: How Does it Benefit Cancer Cells?': [Trends in Biochemical Sciences, 41 (2016) 211]. Trends Biochem Sci. 2016;41:287
11. Teng R, Liu Z, Tang H, Zhang W, Chen Y, Xu R. et al. HSP60 silencing promotes Warburg-like phenotypes and switches the mitochondrial function from ATP production to biosynthesis in ccRCC cells. Redox Biol. 2019;24:101218
12. Zhang Y, Zhang X, Meng Y, Xu X, Zuo D. The role of glycolysis and lactate in the induction of tumor-associated macrophages immunosuppressive phenotype. Int Immunopharmacol. 2022;110:108994
13. Brooks GA. Lactate as a fulcrum of metabolism. Redox Biol. 2020;35:101454
14. Warburg O. On the origin of cancer cells. Science. 1956;123:309-14
15. Koppenol WH, Bounds PL, Dang CV. Otto Warburg's contributions to current concepts of cancer metabolism. Nat Rev Cancer. 2011;11:325-37
16. Zhang W, Wang G, Xu ZG, Tu H, Hu F, Dai J. et al. Lactate Is a Natural Suppressor of RLR Signaling by Targeting MAVS. Cell. 2019;178:176-89.e15
17. Brooks GA. The Science and Translation of Lactate Shuttle Theory. Cell Metab. 2018;27:757-85
18. Torrini C, Nguyen TTT, Shu C, Mela A, Humala N, Mahajan A. et al. Lactate is an epigenetic metabolite that drives survival in model systems of glioblastoma. Mol Cell. 2022;82:3061-76.e6
19. Baumann F, Leukel P, Doerfelt A, Beier CP, Dettmer K, Oefner PJ. et al. Lactate promotes glioma migration by TGF-beta2-dependent regulation of matrix metalloproteinase-2. Neuro Oncol. 2009;11:368-80
20. Sun T, Liu B, Li Y, Wu J, Cao Y, Yang S. et al. Oxamate enhances the efficacy of CAR-T therapy against glioblastoma via suppressing ectonucleotidases and CCR8 lactylation. J Exp Clin Cancer Res. 2023;42:253
21. Strahl BD, Allis CD. The language of covalent histone modifications. Nature. 2000;403:41-5
22. Irizarry-Caro RA, McDaniel MM, Overcast GR, Jain VG, Troutman TD, Pasare C. TLR signaling adapter BCAP regulates inflammatory to reparatory macrophage transition by promoting histone lactylation. Proc Natl Acad Sci U S A. 2020;117:30628-38
23. Pan RY, He L, Zhang J, Liu X, Liao Y, Gao J. et al. Positive feedback regulation of microglial glucose metabolism by histone H4 lysine 12 lactylation in Alzheimer's disease. Cell Metab. 2022;34:634-48.e6
24. Yu J, Chai P, Xie M, Ge S, Ruan J, Fan X. et al. Histone lactylation drives oncogenesis by facilitating m(6)A reader protein YTHDF2 expression in ocular melanoma. Genome Biol. 2021;22:85
25. Chen J, Zhang M, Liu Y, Zhao S, Wang Y, Wang M. et al. Histone lactylation driven by mROS-mediated glycolytic shift promotes hypoxic pulmonary hypertension. J Mol Cell Biol. 2023;14:mjac073
26. Zhang D, Tang Z, Huang H, Zhou G, Cui C, Weng Y. et al. Metabolic regulation of gene expression by histone lactylation. Nature. 2019;574:575-80
27. Wang Y, Li H, Jiang S, Fu D, Lu X, Lu M. et al. The glycolytic enzyme PFKFB3 drives kidney fibrosis through promoting histone lactylation-mediated NF-κB family activation. Kidney Int. 2024;106:226-40
28. Li L, Li Z, Meng X, Wang X, Song D, Liu Y. et al. Histone lactylation-derived LINC01127 promotes the self-renewal of glioblastoma stem cells via the cis-regulating the MAP4K4 to activate JNK pathway. Cancer Lett. 2023;579:216467
29. Yue Q, Wang Z, Shen Y, Lan Y, Zhong X, Luo X. et al. Histone H3K9 Lactylation Confers Temozolomide Resistance in Glioblastoma via LUC7L2-Mediated MLH1 Intron Retention. Adv Sci (Weinh). 2024;11:e2309290
30. Zhang J, Song C, Tian Y, Yang X. Single-Cell RNA Sequencing in Lung Cancer: Revealing Phenotype Shaping of Stromal Cells in the Microenvironment. Front Immunol. 2021;12:802080
31. Levitin HM, Yuan J, Sims PA. Single-Cell Transcriptomic Analysis of Tumor Heterogeneity. Trends Cancer. 2018;4:264-8
32. Patel AP, Tirosh I, Trombetta JJ, Shalek AK, Gillespie SM, Wakimoto H. et al. Single-cell RNA-seq highlights intratumoral heterogeneity in primary glioblastoma. Science. 2014;344:1396-401
33. Jovic D, Liang X, Zeng H, Lin L, Xu F, Luo Y. Single-cell RNA sequencing technologies and applications: A brief overview. Clin Transl Med. 2022;12:e694
34. Moreno-Yruela C, Zhang D, Wei W, Bæk M, Liu W, Gao J. et al. Class I histone deacetylases (HDAC1-3) are histone lysine delactylases. Sci Adv. 2022;8:eabi6696
35. Wang N, Wang W, Wang X, Mang G, Chen J, Yan X. et al. Histone Lactylation Boosts Reparative Gene Activation Post-Myocardial Infarction. Circ Res. 2022;131:893-908
36. Wu Q, Li X, Long M, Xie X, Liu Q. Integrated analysis of histone lysine lactylation (Kla)-specific genes suggests that NR6A1, OSBP2 and UNC119B are novel therapeutic targets for hepatocellular carcinoma. Sci Rep. 2023;13:18642
37. Hänzelmann S, Castelo R, Guinney J. GSVA: gene set variation analysis for microarray and RNA-seq data. BMC Bioinformatics. 2013;14:7
38. Lei J, Qu T, Cha L, Tian L, Qiu F, Guo W. et al. Clinicopathological characteristics of pheochromocytoma/paraganglioma and screening of prognostic markers. J Surg Oncol. 2023;128:510-8
39. Love MI, Huber W, Anders S. Moderated estimation of fold change and dispersion for RNA-seq data with DESeq2. Genome Biol. 2014;15:550
40. Gustavsson EK, Zhang D, Reynolds RH, Garcia-Ruiz S, Ryten M. ggtranscript: an R package for the visualization and interpretation of transcript isoforms using ggplot2. Bioinformatics. 2022;38:3844-6
41. Gu Z, Hübschmann D. Make Interactive Complex Heatmaps in R. Bioinformatics. 2022;38:1460-2
42. Langfelder P, Horvath S. WGCNA: an R package for weighted correlation network analysis. BMC Bioinformatics. 2008;9:559
43. Chen H, Boutros PC. VennDiagram: a package for the generation of highly-customizable Venn and Euler diagrams in R. BMC Bioinformatics. 2011;12:35
44. Wu T, Hu E, Xu S, Chen M, Guo P, Dai Z. et al. clusterProfiler 4.0: A universal enrichment tool for interpreting omics data. Innovation (Camb). 2021;2:100141
45. Shannon P, Markiel A, Ozier O, Baliga NS, Wang JT, Ramage D. et al. Cytoscape: a software environment for integrated models of biomolecular interaction networks. Genome Res. 2003;13:2498-504
46. Li Y, Lu F, Yin Y. Applying logistic LASSO regression for the diagnosis of atypical Crohn's disease. Sci Rep. 2022;12:11340
47. Liu TT, Li R, Huo C, Li JP, Yao J, Ji XL. et al. Identification of CDK2-Related Immune Forecast Model and ceRNA in Lung Adenocarcinoma, a Pan-Cancer Analysis. Front Cell Dev Biol. 2021;9:682002
48. Fang Y, Huang S, Han L, Wang S, Xiong B. Comprehensive Analysis of Peritoneal Metastasis Sequencing Data to Identify LINC00924 as a Prognostic Biomarker in Gastric Cancer. Cancer Manag Res. 2021;13:5599-611
49. Robin X, Turck N, Hainard A, Tiberti N, Lisacek F, Sanchez JC. et al. pROC: an open-source package for R and S+ to analyze and compare ROC curves. BMC Bioinformatics. 2011;12:77
50. Liberzon A, Birger C, Thorvaldsdóttir H, Ghandi M, Mesirov JP, Tamayo P. The Molecular Signatures Database (MSigDB) hallmark gene set collection. Cell Syst. 2015;1:417-25
51. Satija R, Farrell JA, Gennert D, Schier AF, Regev A. Spatial reconstruction of single-cell gene expression data. Nat Biotechnol. 2015;33:495-502
52. Xie Y, He L, Lugano R, Zhang Y, Cao H, He Q. et al. Key molecular alterations in endothelial cells in human glioblastoma uncovered through single-cell RNA sequencing. JCI Insight. 2021;6:e150861
53. Azadian S, Doustmohammadi A, Naseri M, Khodarahmi M, Arab SS, Yazdanifar M. et al. Reconstructing the cell-cell interaction network among mouse immune cells. Biotechnol Bioeng. 2023;120:2756-64
54. Joo EH, Kim S, Park D, Lee T, Park WY, Han KY. et al. Migratory Tumor Cells Cooperate with Cancer Associated Fibroblasts in Hormone Receptor-Positive and HER2-Negative Breast Cancer. Int J Mol Sci. 2024;25:5876
55. Orifjon S, Jammatov J, Sousa C, Barros R, Vasconcelos O, Rodrigues P. Translation and Adaptation of the Adult Developmental Coordination Disorder/Dyspraxia Checklist (ADC) into Asian Uzbekistan. Sports (Basel). 2023;11:135
56. Sachs MC. plotROC: A Tool for Plotting ROC Curves. J Stat Softw. 2017;79:2
57. Balachandran VP, Gonen M, Smith JJ, DeMatteo RP. Nomograms in oncology: more than meets the eye. Lancet Oncol. 2015;16:e173-80
58. Geeleher P, Cox N, Huang RS. pRRophetic: an R package for prediction of clinical chemotherapeutic response from tumor gene expression levels. PLoS One. 2014;9:e107468
59. Gai QJ, Fu Z, He J, Mao M, Yao XX, Qin Y. et al. EPHA2 mediates PDGFA activity and functions together with PDGFRA as prognostic marker and therapeutic target in glioblastoma. Signal Transduct Target Ther. 2022;7:33
60. Xie Y, Hu H, Liu M, Zhou T, Cheng X, Huang W. et al. The role and mechanism of histone lactylation in health and diseases. Front Genet. 2022;13:949252
61. Yang D, Yin J, Shan L, Yi X, Zhang W, Ding Y. Identification of lysine-lactylated substrates in gastric cancer cells. iScience. 2022;25:104630
62. De Leo A, Ugolini A, Yu X, Scirocchi F, Scocozza D, Peixoto B. et al. Glucose-driven histone lactylation promotes the immunosuppressive activity of monocyte-derived macrophages in glioblastoma. Immunity. 2024;57:1105-23.e8
63. Peng X, Liu X, Hu W, Zhou Y, Ouyang L, Peng X. et al. HOXC11 drives lung adenocarcinoma progression through transcriptional regulation of SPHK1. Cell Death Dis. 2023;14:153
64. Wang Y, Liu X, Guan G, Zhao W, Zhuang M. A Risk Classification System With Five-Gene for Survival Prediction of Glioblastoma Patients. Front Neurol. 2019;10:745
65. Chu S, Ren X, Cao L, Ma C, Wang K. HOXC11-mediated regulation of mitochondrial function modulates chemoresistance in colorectal cancer. BMC Cancer. 2024;24:921
66. Li Y, Ma K, Xie Q, Zhang X, Zhang X, Chen K. et al. Identification of HOXD10 as a Marker of Poor Prognosis in Glioblastoma Multiforme. Onco Targets Ther. 2021;14:5183-95
67. Yachi K, Tsuda M, Kohsaka S, Wang L, Oda Y, Tanikawa S. et al. miR-23a promotes invasion of glioblastoma via HOXD10-regulated glial-mesenchymal transition. Signal Transduct Target Ther. 2018;3:33
68. Lin J, Teo S, Lam DH, Jeyaseelan K, Wang S. MicroRNA-10b pleiotropically regulates invasion, angiogenicity and apoptosis of tumor cells resembling mesenchymal subtype of glioblastoma multiforme. Cell Death Dis. 2012;3:e398
69. Park J, Shim JK, Yoon SJ, Kim SH, Chang JH, Kang SG. Transcriptome profiling-based identification of prognostic subtypes and multi-omics signatures of glioblastoma. Sci Rep. 2019;9:10555
70. You HJ, Park HY, Kim J, Lee IH, Seol HJ, Lee JI. et al. Integrative radiogenomic analysis for genomic signatures in glioblastomas presenting leptomeningeal dissemination. Medicine (Baltimore). 2016;95:e4109
71. Xu YF, Dang Y, Kong WB, Wang HL, Chen X, Yao L. et al. Regulation of TMEM100 expression by epigenetic modification, effects on proliferation and invasion of esophageal squamous carcinoma. World J Clin Oncol. 2024;15:554-65
72. Zhang W, Hu Y, Qian M, Mao L, Yuan Y, Xu H. et al. A novel APA-based prognostic signature may predict the prognosis of lung adenocarcinoma in an East Asian population. iScience. 2023;26:108068
73. Xie R, Liu L, Lu X, He C, Li G. Identification of the diagnostic genes and immune cell infiltration characteristics of gastric cancer using bioinformatics analysis and machine learning. Front Genet. 2022;13:1067524
74. Ye Z, Xia Y, Li L, Li B, Chen W, Han S. et al. Effect of transmembrane protein 100 on prostate cancer progression by regulating SCNN1D through the FAK/PI3K/AKT pathway. Transl Oncol. 2023;27:101578
75. Zheng Y, Zhao Y, Jiang J, Zou B, Dong L. Transmembrane Protein 100 Inhibits the Progression of Colorectal Cancer by Promoting the Ubiquitin/Proteasome Degradation of HIF-1α. Front Oncol. 2022;12:899385
76. Zhang F, Ye J, Zhu J, Qian W, Wang H, Luo C. Key Cell-in-Cell Related Genes are Identified by Bioinformatics and Experiments in Glioblastoma. Cancer Manag Res. 2024;16:1109-30
77. Schmidt C, Cohen S, Gudenas BL, Husain S, Carlson A, Westelman S. et al. PRDM6 promotes medulloblastoma by repressing chromatin accessibility and altering gene expression. Sci Rep. 2024;14:16074
78. Meng H, Jiang X, Cui J, Yin G, Shi B, Liu Q. et al. Genomic Analysis Reveals Novel Specific Metastatic Mutations in Chinese Clear Cell Renal Cell Carcinoma. Biomed Res Int. 2020;2020:2495157
79. Yang R, Peng W, Shi S, Peng X, Cai Q, Zhao Z. et al. The NLRP11 Protein Bridges the Histone Lysine Acetyltransferase KAT7 to Acetylate Vimentin in the Early Stage of Lung Adenocarcinoma. Adv Sci (Weinh). 2023;10:e2300971
80. Ghosal S, Banerjee S. In silico bioinformatics analysis for identification of differentially expressed genes and therapeutic drug molecules in Glucocorticoid-resistant Multiple myeloma. Med Oncol. 2022;39:53
81. Feng X, Gong J, Li Q, Xing C, Pan J, Zou R. et al. Identification and functional annotation of differentially expressed long noncoding RNAs in retinoblastoma. Exp Ther Med. 2021;22:1447
82. Sun JM, Fan HY, Zhu Y, Pan TT, Wu YP, Zhang DY. et al. Glioblastoma cellular MAP4K1 facilitates tumor growth and disrupts T effector cell infiltration. Life Sci Alliance. 2023;6:e202301966
83. Chen D, Varanasi SK, Hara T, Traina K, Sun M, McDonald B. et al. CTLA-4 blockade induces a microglia-Th1 cell partnership that stimulates microglia phagocytosis and anti-tumor function in glioblastoma. Immunity. 2023;56:2086-104.e8
84. Ozel I, Akkaya I, Oylumlu E, Uzel G, Ciraci C. Adenosine-Induced NLRP11 in B Lymphoblasts Suppresses Human CD4(+) T Helper Cell Responses. J Immunol Res. 2020;2020:1421795
85. Zhang H, Zhang N, Wu W, Zhou R, Li S, Wang Z. et al. Machine learning-based tumor-infiltrating immune cell-associated lncRNAs for predicting prognosis and immunotherapy response in patients with glioblastoma. Brief Bioinform. 2022;23:bbac386
86. Zhou M, Zhang Z, Bao S, Hou P, Yan C, Su J. et al. Computational recognition of lncRNA signature of tumor-infiltrating B lymphocytes with potential implications in prognosis and immunotherapy of bladder cancer. Brief Bioinform. 2021;22:bbaa047
87. Zhang H, Wang Z, Dai Z, Wu W, Cao H, Li S. et al. Novel Immune Infiltrating Cell Signature Based on Cell Pair Algorithm Is a Prognostic Marker in Cancer. Front Immunol. 2021;12:694490
88. Kumagai S, Koyama S, Itahashi K, Tanegashima T, Lin YT, Togashi Y. et al. Lactic acid promotes PD-1 expression in regulatory T cells in highly glycolytic tumor microenvironments. Cancer Cell. 2022;40:201-18.e9
89. Yang H, Zou X, Yang S, Zhang A, Li N, Ma Z. Identification of lactylation related model to predict prognostic, tumor infiltrating immunocytes and response of immunotherapy in gastric cancer. Front Immunol. 2023;14:1149989
90. Qu J, Li P, Sun Z. Histone lactylation regulates cancer progression by reshaping the tumor microenvironment. Front Immunol. 2023;14:1284344
91. Certo M, Tsai CH, Pucino V, Ho PC, Mauro C. Lactate modulation of immune responses in inflammatory versus tumour microenvironments. Nat Rev Immunol. 2021;21:151-61
92. Mendler AN, Hu B, Prinz PU, Kreutz M, Gottfried E, Noessner E. Tumor lactic acidosis suppresses CTL function by inhibition of p38 and JNK/c-Jun activation. Int J Cancer. 2012;131:633-40
93. Brand A, Singer K, Koehl GE, Kolitzus M, Schoenhammer G, Thiel A. et al. LDHA-Associated Lactic Acid Production Blunts Tumor Immunosurveillance by T and NK Cells. Cell Metab. 2016;24:657-71
94. Colegio OR, Chu NQ, Szabo AL, Chu T, Rhebergen AM, Jairam V. et al. Functional polarization of tumour-associated macrophages by tumour-derived lactic acid. Nature. 2014;513:559-63
95. Yu X, Yang J, Xu J, Pan H, Wang W, Yu X. et al. Histone lactylation: from tumor lactate metabolism to epigenetic regulation. Int J Biol Sci. 2024;20:1833-54
96. Huang H, Chen K, Zhu Y, Hu Z, Wang Y, Chen J. et al. A multi-dimensional approach to unravel the intricacies of lactylation related signature for prognostic and therapeutic insight in colorectal cancer. J Transl Med. 2024;22:211
97. Yang K, Fan M, Wang X, Xu J, Wang Y, Tu F. et al. Lactate promotes macrophage HMGB1 lactylation, acetylation, and exosomal release in polymicrobial sepsis. Cell Death Differ. 2022;29:133-46
98. Pombo Antunes AR, Scheyltjens I, Lodi F, Messiaen J, Antoranz A, Duerinck J. et al. Single-cell profiling of myeloid cells in glioblastoma across species and disease stage reveals macrophage competition and specialization. Nat Neurosci. 2021;24:595-610
99. Khan F, Pang L, Dunterman M, Lesniak MS, Heimberger AB, Chen P. Macrophages and microglia in glioblastoma: heterogeneity, plasticity, and therapy. J Clin Invest. 2023;133:e163446
100. Watters JJ, Schartner JM, Badie B. Microglia function in brain tumors. J Neurosci Res. 2005;81:447-55
101. Diep YN, Park HJ, Kwon JH, Tran M, Ko HY, Jo H. et al. Astrocytic scar restricting glioblastoma via glutamate-MAO-B activity in glioblastoma-microglia assembloid. Biomater Res. 2023;27:71
Author contact
![]() Corresponding authors: Jianhua Peng, Department of Neurosurgery, The Affiliated Hospital of Southwest Medical University, No. 25 of Taiping Street, Luzhou, Sichuan 646000, China. Email: pengjianhuaedu.cn Vincent Kam Wai Wong, H701, Biological Science Building, Dr. Neher's Biophysics Laboratory for Innovative Drug Discovery, State Key Laboratory of Quality Research in Chinese Medicine, Macau University of Science and Technology, Macau 999078, China. Email: kawwongedu.mo Yong Jiang, Department of Neurosurgery, The Affiliated Hospital of Southwest Medical University, No. 25 of Taiping Street, Luzhou, Sichuan 646000, China. Email: jiangyongedu.cn.
Corresponding authors: Jianhua Peng, Department of Neurosurgery, The Affiliated Hospital of Southwest Medical University, No. 25 of Taiping Street, Luzhou, Sichuan 646000, China. Email: pengjianhuaedu.cn Vincent Kam Wai Wong, H701, Biological Science Building, Dr. Neher's Biophysics Laboratory for Innovative Drug Discovery, State Key Laboratory of Quality Research in Chinese Medicine, Macau University of Science and Technology, Macau 999078, China. Email: kawwongedu.mo Yong Jiang, Department of Neurosurgery, The Affiliated Hospital of Southwest Medical University, No. 25 of Taiping Street, Luzhou, Sichuan 646000, China. Email: jiangyongedu.cn.