Impact Factor ISSN: 1837-9664

 Global reach, higher impact
J Cancer 2016; 7(14):1960-1967. doi:10.7150/jca.16123 This issue Cite
Research Paper
The Three-Gene Signature in Urinary Extracellular Vesicles from Patients with Clear Cell Renal Cell Carcinoma
Giuseppe De Palma1,2*, Fabio Sallustio3*, Claudia Curci1,2, Vanessa Galleggiante4, Monica Rutigliano4, Grazia Serino5, Pasquale Ditonno4, Michele Battaglia4, Francesco P. Schena1,2,3 ![]()
1. C.A.R.S.O. Consortium, Valenzano, Italy;
2. Schena Foundation - European Research Center for Kidney Diseases, Valenzano, Italy;
3. DETO, Nephrology, Dialysis and Transplantation Unit, University of Bari, Italy;
4. DETO, Urology, Andrology and Kidney Transplantation Unit, University of Bari, Italy;
5. IRCCS "de Bellis", Laboratory of Experimental Immunopathology, Castellana Grotte, Italy.
*Equal contributors
Received 2016-5-10; Accepted 2016-8-14; Published 2016-9-27
Abstract
Renal cell carcinoma (RCC) accounts for more than 2% of neoplasias in humans worldwide. Renal biopsy is the gold standard among the diagnostic procedures, but it is invasive and not suitable for all patients. Therefore, new reliable and non-invasive biomarkers for RCC are required. Secretion of extracellular vesicles (EVs), containing RNA molecules that can be transferred between cells, appears to be a common feature of neoplasia. Consistently, cancer-derived EVs are increased in blood and urine. Therefore, urinary samples may be a non-invasive approach for discovering new diagnostic biomarkers.
We enrolled 46 patients of whom 33 with clear cell renal cell carcinoma (ccRCC) and 22 healthy subjects (HS). Urinary EVs were isolated by differential centrifugation. Microarray analysis led to the identification of RNA molecules that were validated using RT-qPCR.
We found that urinary exosomal shuttle RNA (esRNA) pattern was significantly different in ccRCC patients compared to HS and to non-clear cell RCC (non-ccRCC) and we identified three esRNAs involved in the tumor biology that may be potentially suitable as non-invasive gene signature. GSTA1, CEBPA and PCBD1 esRNA levels were decreased in urine of patients compared with HS. This pattern was specific of the ccRCC and one month after partial or radical nephrectomy the esRNA levels increased to reach the normal level.
This study suggests, for the first time, the potential use of the RNA content of urinary EVs to provide a non-invasive first step to diagnose the ccRCC.
Keywords: extracellular vesicles, renal cell carcinoma, gene signature, transcriptomics.
Introduction
Renal cell carcinoma (RCC) accounts for more than 2% of neoplasias in humans worldwide (1). In European Union the mean incidence is 16.8 per 100,000 person-years (2). It is more often diagnosed in men than in women (M/F: 2/1). Clear cell renal cell carcinoma (ccRCC) is the most common subtype of RCC, which accounts for 60-65% of all renal cancers.
Currently, methods such as imaging techniques and biopsy are used to detect ccRCC (3). Nevertheless, the most utilized imaging techniques indicate the size of tumors but not the morphology. On the other hand, the percutaneous renal tumour biopsy is the gold standard for diagnosis, especially for radiologically indeterminate renal masses, but it is invasive and not suitable for all patients. Therefore, new reliable and non-invasive biomarkers for ccRCC detection are required.
Urinary sample can be a non-invasive approach for discovering diagnostic biomarkers. Whole urine or urinary sediments were analyzed in several studies (4-6). Recent findings have shown that a heterogeneous population of nanosized structures (i.e. microvesicles, apoptotic vesicles and exosomes) called extracellular vesicles (EVs), surrounded by a membrane composed of a phospholipid bilayer, is a component of urine, like other biofluids. They contain a wide variety of proteins and RNAs (mRNAs, miRNAs and non-coding RNAs) that represent the tissue of origin. The RNA encapsulated in EVs is termed exosomal shuttle RNA (esRNA). It can be transferred to recipient cells and can modulate their transcriptome.
Abundance of esRNA is poor in urinary EVs; therefore, the isolation and downstream RNA analysis are challenging (7). A few studies have used microarrays (8) or real time quantitative PCR assays (9) to examine esRNA. Recently, the comparison of the protein profile of urinary EVs derived from RCC patients has been carried out by Raimondo et al. (10). This study has shown a specific protein profile.
In this study, we have performed the transcriptome analysis of esRNA obtained from urinary EVs of ccRCC patients. The esRNA content was significantly different in ccRCC patients compared to healthy subjects (HS) and patients with other types of RCC. We identified three EV transcripts involved in the tumor biology that may be considered a potential diagnostic three-gene signature for ccRCC.
Materials and Methods
Patients
Approval was obtained from the local ethics committee and written informed consent was obtained from all patients.
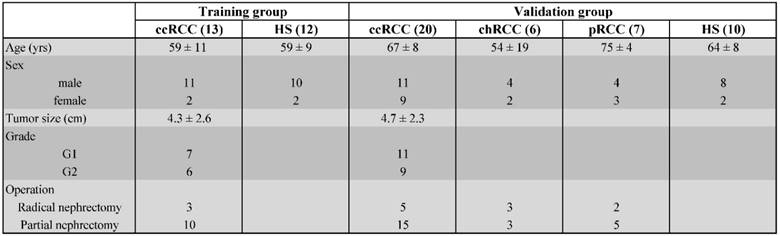
Midstream samples of the second morning urine samples were obtained from 33 untreated patients with ccRCC, before and after partial or radical nephrectomy. Urine samples were obtained during the first post-operative clinic. In this study we considered only adult patients who underwent nephrectomy with the following criteria: solid renal mass ranging from 1.5 to 7 cm; pathologically confirmed diagnosis of ccRCC with low-Fuhrman-grade (I or II); absence of distant metastasis; no treatment before nephrectomy. We collected and processed also urine samples from 22 HS as controls and from 13 patients with non-clear cell RCC (non-ccRCC) before nephrectomy in the same way as the ccRCC patients. They included 7 papillary RCC and 6 chromophobe RCC of similar age and sex. Table 1 shows the demographic and clinical characteristics of 33 patients with ccRCC, the tumor size, grade, as well as a composite of 22 HS and 13 non-ccRCC.
Demographic and clinical characteristics of patients with clear cell RCC (ccRCC), chromophobe RCC (chRCC), papillary RCC (pRCC) and healthy subjects (HS).
EVs and esRNA isolation
Briefly, 50 ml of urine was initially centrifuged at 300xg for 10 min to pellet whole cell contaminants. The supernatant was carefully removed and centrifuged at 17,000xg for 20 min to pull down cell fragments and apoptotic cells. The supernatant was then removed and filtered through a 0.8 mm filter to separate residual debris from the EV containing supernatant. Finally, the filtrate underwent ultracentrifugation at 118,000xg for 70 min, the supernatant was removed and the EV pellet washed in PBS. Total RNA, including small RNA (<200 nt), was isolated using the miRCURY RNA isolation kit (Exiqon, Vedbaek, Denmark) following the manufacturer's instructions. Then, an aliquot was run on a RNA Pico 6000 chip (Agilent Tech, Santa Clara, CA, USA) using an Agilent Bioanalyzer 2100 instrument (Agilent Tech) to assess quantity and integrity.
Microarray Screening
The Whole-Genome cDNA mediated annealing, selection, extension, and ligation (DASL) HT assay (Illumina, San Diego, CA, USA) was used to amplify the RNA for gene expression profiling. Briefly, 50 ng of each sample was reverse transcribed to cDNA and annealed to the DASL assay probe groups, which consisted of 29,285 oligonucleotides. Biotin-labeled cRNA was hybridized to Illumina HumanHT-12 v4 BeadChip microarrays and scanned. Array results were analyzed using GeneSpring GX 11.0 (Agilent Tech) to identify genes that had statistically significantly changed expression between groups. We checked and excluded the batch error by principal component analysis (Supplementary Figure 1). Identification of genes differentially expressed between esRNAs from ccRCC patients and HS was carried out with FDR method of Benjamini-Hochberg and gene probe sets were filtered on the basis of the false discovery rate, FDR, (adjusted-P value with multiple testing on 1000 permutations) and fold-change. Fold change filter was set to 2-fold in each comparison. Only genes that were significantly (adjusted-P value <0.05 and fold-change >2) modulated were considered for further analysis.
To assess biological relationships among differently regulated genes, we used the Ingenuity Pathway Analysis software (IPA) (Ingenuity Systems, Redwood City, CA, USA; http://www.ingenuity.com). IPA generates networks based on the connectivity of the genes and computes a score for each network according to the fit of the set of supplied focus genes. These scores indicate the likelihood of focus genes to belong to a network versus those obtained by chance. Fischer's exact test with FDR option was used to calculate the significance of the canonical pathway. The computational analysis of the scientific literature was performed using the PubGene tool in Coremine Medical (http://www.coremine.com/medical) (11).
The Illumina microarray data are MIAME compliant and the raw data have been deposited in NCBI's Gene Expression Omnibus and are accessible through GEO Series accession number GSE72922.
Validation by qRT-PCR
Quantitative real-time PCR (qRT-PCR) was used to validate the differential expression of selected genes. Reverse transcription and cDNA amplification were performed using the Complete Whole Transcriptome Amplification Kit (Sigma-Aldrich, Saint Louis, MO, USA) according to the manufacturer's instructions. qRT-PCR was performed using Sso Advanced Universal SYBR Green Supermix (Bio-Rad Laboratories, Hercules, CA, USA) on a final volume of 20 μl using a StepOne Plus thermocycler (Applied Biosystems, Foster City, CA, USA). The primers used for the qRT-PCR analysis of GSTA1, CEBPA, PCBD1, PDCD6IP, GAPDH were purchased from QuantiTect Primer Assays (Qiagen, Hilden, Germany); the product numbers of the used primers were QT01671530, QT00203357, QT00001841, QT00067942, and QT00079247, respectively. The commercially primers were designed and optimized for qRT-PCR assay using SYBR green detection. Each assay was done in triplicate and the mean threshold cycle (Ct) was calculated. We calculated the 2-ΔCT of expression profiles normalized to the expression of the control gene GAPDH.
Statistical analysis
For qRT-PCR data, statistical analysis was carried out by using a two-tailed t-test. A P-value<0.05 was considered as significant.
Results
Isolation and transcriptome analysis of esRNA
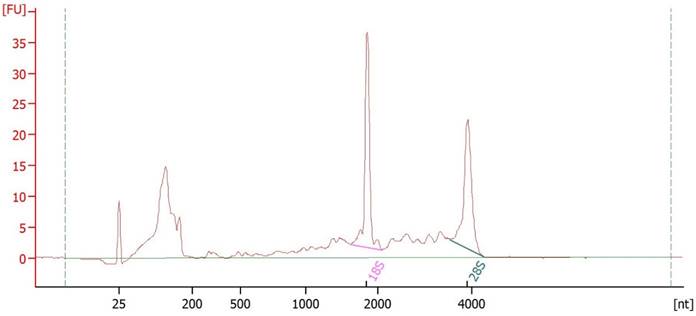
We isolated esRNA from the urine samples of 22 HS, 33 untreated patients with ccRCC and 13 untreated patients with non-ccRCC of similar age and sex. For transcriptome profiling, we extracted total RNA from purified EVs. The extracted nucleic acid material was assessed for size distribution and quality using the Agilent Bioanalyzer (Figure 1), which demonstrated two high rRNA peaks (18S and 28S) that were enriched in short RNA such as mRNA and miRNA. Figure 1 shows the small RNA peak between 25 and 200 nucleotides, and enough ribosomal RNA with a profile similar to that observed by Miranda et al. (12). To confirm the identity of the source of the RNA preparations, the mRNA of the EV biomarker PDCD6IP (also known as ALIX) was used for the qRT-PCR and demonstrated to be present [not shown].
Urinary EVs RNA integrity. RNA isolated from urinary EVs was shown to be of high integrity with prominent 18S and 28S rRNA peaks when analyzed using the Agilent Bioanalyzer.
Transcriptome profiles of urinary EVs from 12 patients with ccRCC and 11 HS belonging to the training group were generated using the Illumina HumanHT-12 v4 BeadChip oligonucleotide arrays interrogating >29,000 genes. In the esRNA we detected a mean of 2213 genes.
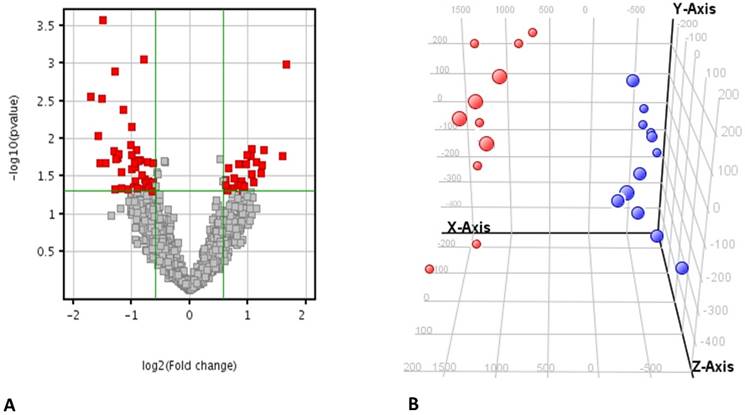
Microarray analysis revealed the differential expression of 70 genes that were significantly modulated in the ccRCC compared to the HS with a fold change of 1.5 and a false discovery rate <0.05 (Figure 2A and Supplementary Table 1). The principal component analysis (PCA) showed that these genes could clearly distinguish the ccRCC patients from the healthy cohort (Figure 2B) only starting from genes differentially modulated, excluding that the separation could be ascribed to a batch effect (Supplementary Figure 1).
Principal component analysis of the gene expression. A) Volcano plot showing 70 genes that were significantly modulated in the ccRCC compared to the HS with a fold change of 1.5 and a false discovery rate <0.05. B) Principal component analysis 3-D diagram showed different spatial distribution of the ccRCC (blue) and HS (red) populations. The two groups had significant differences in gene expression distribution and indicated two transcriptionally distant populations.
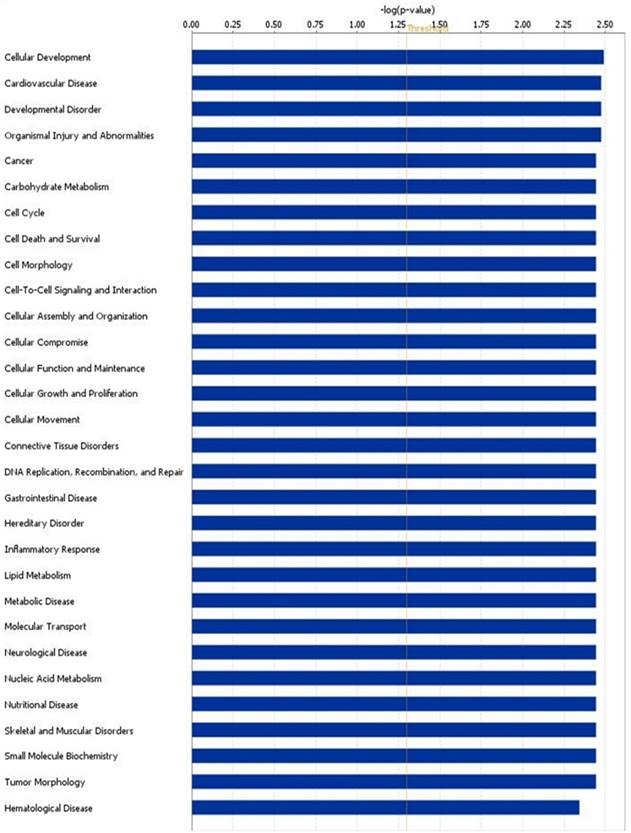
We performed the pathway analysis on the modulated genes and we found several biological pathways that were significantly modulated in ccRCC patients compared to HS. In particular, among the most significant networks we found “developmental disorder”, “cancer”, “cell cycle” and “cell death and survival” (Figure 3 and Supplementary Table 2).
Altered canonical pathways associated with ccRCC. The canonical pathways are shown along the y-axis of the bar chart. The x-axis indicates the statistical significance. Interestingly, “developmental disorder”, “cancer”, “cell cycle” and “cell death and survival” were found the most significant identified canonical pathways in ccRCC.
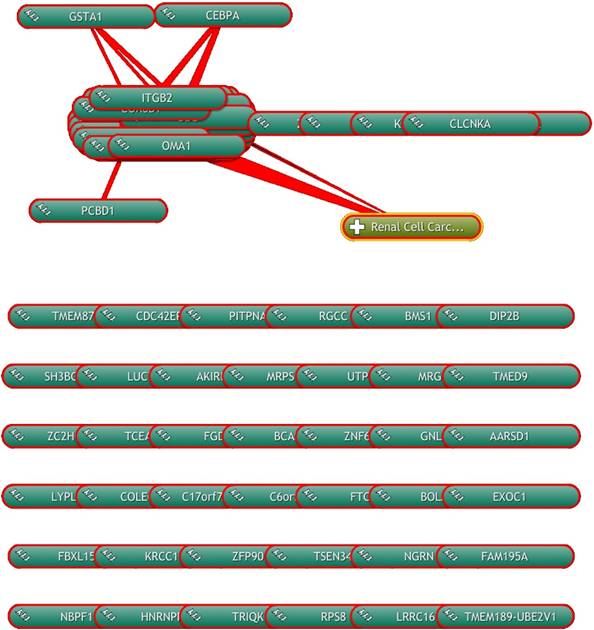
Moreover, we performed a computational analysis of the scientific literature to evidence modulated genes directly or indirectly involved in the biological processes of RCC. We found that, on the basis of the literature, 24 of 70 modulated genes were involved in biological processes activated in RCC (Figure 4). Some of these were involved also in the evidenced pathways of “cell death and survival”, “cancer” and “developmental disorder”, as GSTA1, CEBPA and PCBD1, respectively.
Computational analysis of the scientific literature. Computational analysis of the scientific literature evidences 24 modulated genes that are involved in biological processes activated in RCC using the COREMINE online database/tool.
Gene signature validation
In order to validate our findings obtained with microarray analyses, we performed qRT-PCR analysis of the three genes in the urinary esRNA from an independent cohort of 33 RCC patients, of whom 20 with ccRCC and 13 with non-ccRCC.
The qRT-PCR findings were broadly consistent with our microarray data (Figure 5). We observed that GSTA1 esRNA expression was significantly decreased in ccRCC patients compared to the group of HS. This alteration trend in gene expression was also observed for the transcription CEBPA gene, a general inhibitor of cell proliferation and a tumor suppressor. Also PCBD1, which codes for a coactivator of HNF1A-dependent transcription, had a low gene expression in patients affected by ccRCC compared to HS.
Validation of GSTA1, CEBPA, PCBD1 esRNA levels. Levels of GSTA1, CEBPA, PCBD1 were validated by qRT-PCR in an independent cohort of 20 ccRCC patients and 10 HS. Results showed a significant decrease in levels of GSTA1, CEBPA and PCBD1 esRNA in ccRCC compared to both HS and chromophobe RCC (chRCC) and papillary RCC (pRCC). Samples have been standardized for GAPDH. Data represent the means ± s.d. Different asterisks (*) indicate significant differences (*, P < 0.05; **, P < 0.01; ***, P < 0.001).
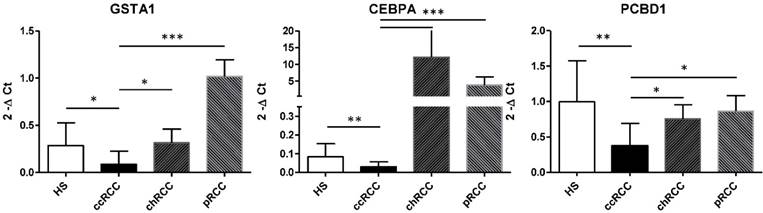
Next, we interrogated this three-gene signature in a cohort of patients with non-ccRCC, consisting of papillary and chromophobe cell type (Figure 5). Interestingly, non-ccRCC patients had significantly higher GSTA1, CEBPA and PCBD1 esRNA transcript levels, indicating that our gene signature is tumor histotype specific. In particular, in chromophobe RCC patients the esRNA levels of GSTA1 and PCBD1 were similar to that of HS, whereas the CEBPA levels were very higher compared to both HS and ccRCC patients. In papillary RCC patients, the PCBD1 levels were similar to that of HS, whereas the amount of GSTA1 and CEBPA transcripts was higher compared to both HS and ccRCC patients.
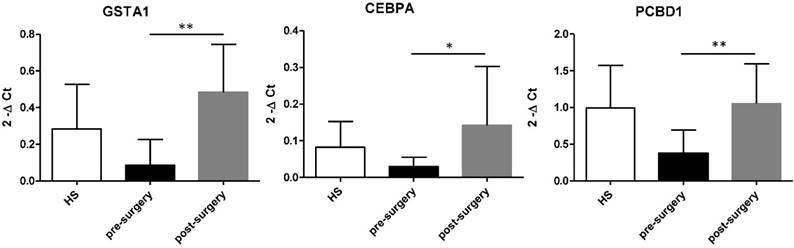
Then, we compared esRNA levels of GSTA, CEBPA and PCBD1 before and after nephrectomy. After tumour removal esRNA levels of these three genes significantly increased compared to that of pre-surgery values and HS (Figure 6).
Increased level of GSTA1, CEBPA, and PCBD1 esRNA after nephrectomy. GSTA, CEBPA and PCBD1 esRNA levels significantly increased at 1 month after nephrectomy compared to their basal levels. Samples have been standardized for GAPDH. Data represent the means ± s.d. Different asterisks (*) indicate significant differences (*, P < 0.05; **, P < 0.01).
These results suggest that the GSTA1, CEBPA and PCBD1 esRNA signature may be considered a potential diagnostic pattern for ccRCC.
Discussions
EV secretion appears to be a common feature of neoplasia. Consistently, they increase in blood and urine. Cancer-derived EVs reflect the original cancer cells and esRNA extracted from them contains a snap of the cancer transcriptome (13).
They have been widely studied in the last few years and seem to have several functions such as intercellular communication, expressing signaling pathway activation through growth factor/receptor transfer, induction of angiogenesis and immune regulation (14-21). esRNA is protected from urinary ribonuclease degradation by packaging in EVs (22).
To validate the concept of urinary EVs as potential source of new cancer biomarkers for ccRCC, we carried out a study to compare gene expression for the identification of esRNA as tools useful for the ccRCC diagnosis. Our initial bioanalyzer data showed that isolated esRNA had a fragment length ranging between the small (<200 nt) and the large (>200 nt) RNA fractions. Since we isolated a low amount of esRNA, we used a pre-amplification step for the qRT-PCR validation.
Analysis of urinary EV transcripts revealed GSTA1 decreased in ccRCC when compared to HS. Interestingly, the function of GST-α is to protect cell by catalyzing the detoxification of xenobiotics and carcinogens. In renal tissue three cytosolic isoenzymatic GSTs have been identified, which are mentioned as α, μ, and π. The location of these isoenzymes is different along the nephron. GST-α is expressed principally in the convoluted proximal tubule where ccRCC usually is supposed to origin (23). Our data is in agreement with those of several authors who reported a decreased level of GST-α expression in tumor tissue of patients with RCC as determined by Northern or Western blotting (24-26) but these findings are in disagreement with the findings of other studies where glutathione S-transferase A was highly expressed in RCC tumor tissue by immunostaining and correlated with histology (27).
We also found a decreased CEBPA expression in ccRCC urinary EVs when compared to HS samples. C/EBPs comprise a family of transcription factors of which CEBPA plays an important role in normal tissue development and in the regulation of cell proliferation and cell differentiation (28). Some experiments established that various molecular mechanisms control CEBPA expression or function in various types of cancers. Our findings are consistent with an early study of CEBPA in tumor tissue samples from RCC patients. Protein levels of tumor suppressor CEBPA have been reported to be downregulated in the pools of tumor tissues when compared to that of normal tissues (29).
Another interesting aspect of our study was the significant decrease of PCBD1 in the ccRCC urinary EVs. The multifunctional protein PCBD1 is a cofactor for the HNF1 homeobox transcription factor that stabilizes HNF1α dimers and enhances its transcriptional activity. It can assemble a stable tetrameric PCBD1-HNF1α leaving unchanged DNA binding properties of HNF1α (30). Our results are supported by an interestingly analysis of the RCC samples by western blotting that revealed considerably less levels of HNF1α compared to the control tissue (24).
Then, the expression of these three esRNAs was confirmed by qRT-PCR in the validation group.
We also found differences in the expression level of these three exosomal transcripts between the different histotypes of RCC, with highest expression in papillary and chromophobe RCC compared with ccRCC. This data is consistent with previous mRNA and cytogenetic data showing that different histotypes are not only different in their morphological appearance but also in their molecular characteristics (31).
Moreover, our qRT-PCR results revealed that at one month after tumor eradication the levels of GSTA1, CEBPA and PCBD1 increased significantly, reaching the expression levels of HS.
Taken together these results support the definition of a specific histotype esRNA gene signature able to distinguish low-Fuhrman-grade ccRCC patients from HS and from non-ccRCC.
Supplementary Material
Supplementary tables and figures.
Abbreviations
RCC: Renal cell carcinoma; EVs: Extracellular vesicles; ccRCC: Clear cell RCC; HS: Healthy subjects; non-ccRCC: Non-clear cell RCC; esRNA: Exosomal shuttle RNA; qRT-PCR: Quantitative real-time PCR; PCA: Principal component analysis.
Acknowledgements
This work was supported by FIRB RBAP11B2SX (CAROMICS project) of the Ministry of Education, University and Research, Italy. This work was also supported in part by Schena Foundation - European Research Center for Kidney Diseases, Valenzano, Italy. We are thankful to the members of “Centro di Aggregazione della Terza Età” - Alberobello.
Competing interests
The authors have declared that no competing interests exists.
References
1. Cho E, Adami H-O, Lindblad P. Epidemiology of renal cell cancer. Hematol. Oncol. Clin. North Am. 2011Aug;25(4):651-65
2. Ferlay J, Soerjomataram I, Ervik M, Dikshit R, Eser S, Mathers C. et al. GLOBOCAN 2012 v1. 0, Cancer Incidence and Mortality Worldwide: IARC CancerBase No. 11. International Agency for Research on Cancer, Lyon, France. 2013. globocan. iarc. fr. 2015
3. Ljungberg B, Bensalah K, Canfield S, Dabestani S, Hofmann F, Hora M. et al. EAU guidelines on renal cell carcinoma: 2014 update. Eur. Urol. 2015May;67(5):913-24
4. Morrissey JJ, Mellnick VM, Luo J, Siegel MJ, Figenshau RS, Bhayani S. et al. Evaluation of Urine Aquaporin-1 and Perilipin-2 Concentrations as Biomarkers to Screen for Renal Cell Carcinoma: A Prospective Cohort Study. JAMA Oncol. 2015May;1(2):204-12
5. Kind T, Tolstikov V, Fiehn O, Weiss RH. A comprehensive urinary metabolomic approach for identifying kidney cancerr. Anal. Biochem. 2007Apr;363(2):185-95
6. Bosso N, Chinello C, Picozzi SCM, Gianazza E, Mainini V, Galbusera C. et al. Human urine biomarkers of renal cell carcinoma evaluated by ClinProt. Proteomics Clin Appl. 2008Jul;2(7-8):1036-46
7. Lv L-L, Cao Y, Liu D, Xu M, Liu H, Tang R-N. et al. Isolation and quantification of microRNAs from urinary exosomes/microvesicles for biomarker discovery. Int. J. Biol. Sci. 2013;9(10):1021-31
8. Cheng L, Sun X, Scicluna BJ, Coleman BM, Hill AF. Characterization and deep sequencing analysis of exosomal and non-exosomal miRNA in human urine. Kidney Int. 2014Aug;86(2):433-44
9. Lv L-L, Cao Y-H, Pan M-M, Liu H, Tang R-N, Ma K-L. et al. CD2AP mRNA in urinary exosome as biomarker of kidney disease. Clin. Chim. Acta. 2014Jan;428:26-31
10. Raimondo F, Morosi L, Corbetta S, Chinello C, Brambilla P, Mina PD. et al. Differential protein profiling of renal cell carcinoma urinary exosomes. Mol Biosyst. 2013Jun;9(6):1220-33
11. Jenssen T-K, Laegreid A, Komorowski J, Hovig E. A literature network of human genes for high-throughput analysis of gene expression. NATURE GENETICS [Internet]. 2001;28(1):21-28 Available from: http://www.ingentaconnect.com/content/np/10614036/2001/00000028/00000001/art00002
12. Miranda KC, Bond DT, Levin JZ, Adiconis X, Sivachenko A, Russ C. et al. Massively parallel sequencing of human urinary exosome/microvesicle RNA reveals a predominance of non-coding RNA. PLoS ONE. 2014;9(5):e96094
13. Skog J, Würdinger T, Rijn S van, Meijer DH, Gainche L, Sena-Esteves M. et al. Glioblastoma microvesicles transport RNA and proteins that promote tumour growth and provide diagnostic biomarkers. Nat. Cell Biol. 2008Dec;10(12):1470-6
14. Zhang H-G, Grizzle WE. Exosomes and cancer: a newly described pathway of immune suppression. Clin. Cancer Res. 2011Mar;17(5):959-64
15. Simons M, Raposo G. Exosomes-vesicular carriers for intercellular communication. Curr. Opin. Cell Biol. 2009Aug;21(4):575-81
16. Webber J, Steadman R, Mason MD, Tabi Z, Clayton A. Cancer exosomes trigger fibroblast to myofibroblast differentiation. Cancer Res. 2010Dec;70(23):9621-30
17. Al-Nedawi K, Meehan B, Kerbel RS, Allison AC, Rak J. Endothelial expression of autocrine VEGF upon the uptake of tumor-derived microvesicles containing oncogenic EGFR. Proc. Natl. Acad. Sci. U.S.A. 2009Mar;106(10):3794-9
18. Chairoungdua A, Smith DL, Pochard P, Hull M, Caplan MJ. Exosome release of β-catenin: a novel mechanism that antagonizes Wnt signaling. J. Cell Biol. 2010Sep;190(6):1079-91
19. Deregibus MC, Cantaluppi V, Calogero R, Iacono ML, Tetta C, Biancone L. et al. Endothelial progenitor cell derived microvesicles activate an angiogenic program in endothelial cells by a horizontal transfer of mRNA. Blood. 2007Oct;110(7):2440-8
20. Grange C, Tapparo M, Collino F, Vitillo L, Damasco C, Deregibus MC. et al. Microvesicles released from human renal cancer stem cells stimulate angiogenesis and formation of lung premetastatic niche. Cancer Res. 2011Aug;71(15):5346-56
21. Ciravolo V, Huber V, Ghedini GC, Venturelli E, Bianchi F, Campiglio M. et al. Potential role of HER2-overexpressing exosomes in countering trastuzumab-based therapy. J. Cell. Physiol. 2012Feb;227(2):658-67
22. Miranda KC, Bond DT, McKee M, Skog J, Păunescu TG, Silva ND. et al. Nucleic acids within urinary exosomes/microvesicles are potential biomarkers for renal disease. Kidney Int. 2010Jul;78(2):191-9
23. Harrison DJ, Kharbanda R, Cunningham DS, McLellan LI, Hayes JD. Distribution of glutathione S-transferase isoenzymes in human kidney: basis for possible markers of renal injury. J. Clin. Pathol. 1989Jun;42(6):624-8
24. Clairmont A, Ebert T, Weber H, Zoidl C, Eickelmann P, Schulz WA. et al. Lowered amounts of the tissue-specific transcription factor LFB1 (HNF1) correlate with decreased levels of glutathione S-transferase alpha messenger RNA in human renal cell carcinoma. Cancer Res. 1994Mar;54(5):1319-23
25. Ilio CD, Aceto A, Bucciarelli T, Angelucci S, Felaco M, Grilli A. et al. Glutathione transferase isoenzymes in normal and neoplastic human kidney tissue. Carcinogenesis. 1991Aug;12(8):1471-5
26. Eickelmann P, Ebert T, Warskulat U, Schulz WA. Expression of NAD(P)H: quinone oxidoreductase and glutathione S-transferases α and π in human renal cell carcinoma and in kidney cancer-derived cell lines. Carcinogenesis. 1994Feb;15(2):219-225
27. Searchfield L, Price SA, Betton G, Jasani B, Riccardi D, Griffiths DFR. Glutathione S-transferases as molecular markers of tumour progression and prognosis in renal cell carcinoma. Histopathology. 2011Jan;58(2):180-90
28. Lopez RG, Garcia-Silva S, Moore SJ, Bereshchenko O, Martinez-Cruz AB, Ermakova O. et al. C/EBPalpha and beta couple interfollicular keratinocyte proliferation arrest to commitment and terminal differentiation. Nat. Cell Biol. 2009Oct;11(10):1181-90
29. Weng Wang, Xie Long, Li Sun. et al. YY1-C/EBPα-miR34a regulatory circuitry is involved in renal cell carcinoma progression. Oncology Reports. 2014;31(4):1921-1927 http://www.ingentaconnect.com/content/sp/or/2014/00000031/00000004/art00056
30. Mendel DB, Khavari PA, Conley PB, Graves MK, Hansen LP, Admon A. et al. Characterization of a cofactor that regulates dimerization of a mammalian homeodomain protein. Science. 1991Dec;254(5039):1762-7
31. Sanford T, Chung PH, Reinish A, Valera V, Srinivasan R, Linehan WM. et al. Molecular sub-classification of renal epithelial tumors using meta-analysis of gene expression microarrays. PloS one. Public Library of Science. 2011;6(7):e21260
Author contact
![]() Corresponding author: paolo.schenait.
Corresponding author: paolo.schenait.