3.2
Impact Factor
ISSN: 1837-9664
J Cancer 2017; 8(4):578-596. doi:10.7150/jca.17633 This issue Cite
Research Paper
A Comprehensive NGS Data Analysis of Differentially Regulated miRNAs, piRNAs, lncRNAs and sn/snoRNAs in Triple Negative Breast Cancer
1. Division of Plastic Surgery, Department of Surgery, College of Medicine, Pennsylvania State University, 500 University Drive, Hershey, PA 17033;
2. Department of Pharmacology & Experimental Therapeutics, College of Pharmacy & Pharmaceutical Sciences, University of Toledo - Health Sciences Campus, 300 Arlington Ave, Toledo, OH 43614;
3. Department of Anesthesia, College of Medicine, Pennsylvania State University, 500 University Drive, Hershey, PA 17033;
4. Department of Pharmacology, Department of Biochemistry and Molecular Biology, and Institute for Personalized Medicine, Pennsylvania State University College of Medicine, 500 University Drive, Hershey, PA17033;
5. Genomics Facility, Department of Genetics and Genomics Sciences, Icahn School of Medicine, Mount Sinai, 1425 Madison Ave, New York, NY 10029.
Received 2016-9-19; Accepted 2016-11-6; Published 2017-2-11
Abstract
Cancer is the second leading cause of death in the United States and is a major public health concern worldwide. Basic, clinical and epidemiological research is leading to improved cancer detection, prevention, and outcomes. Recent technological advances have allowed unbiased and comprehensive screening of genome-wide gene expression. Small non-coding RNAs (sncRNAs) have been shown to play an important role in biological processes and could serve as a diagnostic, prognostic and therapeutic biomarker for specific diseases. Recent findings have begun to reveal and enhance our understanding of the complex architecture of sncRNA expression including miRNAs, piRNAs, lncRNAs, sn/snoRNAs and their relationships with biological systems. We used publicly available small RNA sequencing data that was derived from 24 triple negative breast cancers (TNBC) and 14 adjacent normal tissue samples to remap various types of sncRNAs. We found a total of 55 miRNAs were aberrantly expressed (p<0.005) in TNBC samples (8 miRNAs upregulated; 47 downregulated) compared to adjacent normal tissues whereas the original study reported only 25 novel miRs. In this study, we used pathway analysis of differentially expressed miRNAs which revealed TGF-beta signaling pathways to be profoundly affected in the TNBC samples. Furthermore, our comprehensive re-mapping strategy allowed us to discover a number of other differentially expressed sncRNAs including piRNAs, lncRNAs, sn/snoRNAs, rRNAs, miscRNAs and nonsense-mediated decay RNAs. We believe that our sncRNA analysis workflow is extremely comprehensive and suitable for discovery of novel sncRNAs changes, which may lead to the development of innovative diagnostic and therapeutic tools for TNBC.
Keywords: sncRNA, TNBC, breast cancer, NGS, snoRNA, miRNA, piRNA
Introduction
Breast cancer (BCa) is a leading cause of cancer-related death among women in the United States and is a major public health concern worldwide, with an estimated 1.7 million newly diagnosed cases in 2015 [1]. The American Cancer Society estimates about 246,660 BCa cases and 61,000 non-invasive new cases will lead to 40,450 US deaths in 2016 [1]. Triple-Negative Breast Cancer (TNBC) is a subtype of BCa defined by the lack of estrogen receptor (ER), progesterone receptor (PR) and human epidermal growth factor receptor 2 (HER2) expression and represents a focus of increasing interest [2]. This is due in part to the aggressive nature of TNBC, which is noted to have higher recurrence and lower survival rates than other BCa subtypes and the lack of targeted therapies [3]. There has been intensified interest in further understanding their molecular profile to identify unique therapeutic target sites which could improve overall survival and quality of life in patients diagnosed with TNBC.
Technological advances in next generation sequencing (NGS) have helped to profile the whole transcriptomic expression of diseased biological systems at the molecular level and increase our fundamental understanding. Small RNAs are non-coding RNAs (sncRNA) consisting of 17-250 nucleotides in length that perhaps play a crucial role in disease development [4]. Secondary to accumulating NGS investigations, a nearly comprehensive repertoire of small RNAs i.e. miRNAs (17-22 nucleotides) [5], piRNAs (26-33 nucleotides) [6], lncRNAs (more than 200 nucleotides) [7] and small nuclear/nucleolar RNAs (70-120 nucleotides) [8] has been collected and their roles in disease development analyzed. Over the last decade there has been a great deal of focus on revealing miRNAs role in transcriptional regulation. Furthermore, piwi-interacting RNAs (piRNA) are the largest class of the small non-coding RNA family and are implicated in epigenetic and post transcriptional regulation, however most of their functions are still unknown [9]. Long non-coding RNAs (lncRNA) are a diverse class of RNAs that are believed to be functional; however, little biological relevance has been established thus far [10]. snoRNAs are perhaps the most ancient and highly conserved class of sncRNAs present in eukaryotes which carry out a fundamental role of modification and processing of ribosomal RNAs (rRNA), transfer RNAs (tRNA) and small nuclear RNAs (snRNA) [11]. Two well-known classes of snoRNAs are C/D snoRNAs and box H/ACA snoRNAs which primarily differ in sequence and structure [11].
The present study focuses on in-depth analysis of small RNA sequencing data obtained from TNBC patient samples compared to normal tissue. We aimed to identify differential molecular signature expressions in whole small RNA groups. We further sought to identify the most predominant non-coding RNA expressions along with the corresponding molecular pathways that may be involved in the development of TNBC and serve as biomarkers.
Materials and Methods
Samples and Data Assembly
Triple-negative breast cancer (TNBC) small RNA sequencing raw sample datasets (project no: PRJNA172756; GEO: GSE40049) were downloaded from the NIH bioproject [12] which included 24 TNBC human tissue samples (stage I=7; stage II=15; stage III=2) and 14 normal adjacent samples. Detailed clinical information about the patients was reported by Chang et al. [12]. The small RNA library was constructed from total RNA using the SOLiD Total RNA-Seq Kit (Applied Biosystems, Foster City, CA, USA). This method utilizes SOLiD's Adaptor Mix which is a set of oligonucleotides that can bind to an RNA molecule with a 5'-monophosphate and a 3'-hydroxyl end; therefore, most small RNAs can participate in this reaction, and intact mRNA molecules with a 5' cap structure are excluded. The ligated small RNAs were reverse transcribed, size-selected, and amplified, before SOLiD sequencing. Raw files were downloaded as sequence raw archive (SRA) files then converted to FASTQ, using the SRA toolkit version 2.5.7. Data was assembled using PartekFlow® software, version 5.0 (Partek, Inc., St. Louis, MO, USA). Converted FASTQ files were uploaded to the PartekFlow® server and remapped to human genome hg19. Transcript abundances were determined and expression values were represented using reads per million (RPM) mapped reads which normalizes for sequencing depth. All small RNA with expression RPM values >1 in at least 10% of the samples was considered robustly expressed and used for further analysis. Expression matrices were aligned to clinicopatholgical features in order to compare miRNA, piRNA, lncRNA and sn/snoRNA levels for association with specific TNBC phenotypes. Statistical analyses were carried out using the non-parametric Mann-Whitney U test followed by false discovery rate (FDR) correction through the Benjamin-Hochberg method, with the default p-value <0.05 considered statistically significant [13]. A Circos plot [14] was generated for differential expression of all small RNAs.
Assembly of miRNA, piRNA, lncRNA and snoRNA Annotations
Small RNA sequencing data was trimmed and aligned to the whole human genome (hg19), and BWA-0.7.12 aligner (BWA-MEM) with a few modifications (mismatch penalty 2, gap open penalty 6, clipping penalty 4 and alignment score cutoff 15) for short read mapping. miRNAs were annotated from miRBase version 21 (http://www.mirbase.org/), which contains more than 1900 high confidence miRNAs [15]. piRNA data was generated and annotated from piRBase (http://regulatoryrna.org/database/piRNA), which is manually curated with a focus on piRNA functional analysis [16]. lncRNAs were quantified using reference annotation LNCipedia (http://www.lncipedia.org) version 3.1, downloaded from all coordinates relative to the hg19 reference genome [17]. Total small RNA (including miRNA, piRNA, snRNA, scRNA, snoRNA, piRNA, tRF3, tRF5, tRNA, rRNA) was annotated using Gencode version 19 annotation file (www.gencodegenes.org), which provides comprehensive information on human small non-coding RNAs, with specific regards to small nuclear and nucleolar RNAs.
Biological Processes and Gene Network Visualization by MetaCore
Biological pathway interactions of small RNA expression were analyzed using MetaCore pathway analysis of differentially expressed genes (Thomson Reuters, New York, NY) [18] with p < 0.05 from each group (TNBC vs adjacent normal tissue; along with different stages). Functional gene networks were built based on differentially regulated gene lists as input to generate disease biomarkers and GO terms (Data analyzed by Gene Arrays, Entity of Vedic Research, Inc., New York, USA).
Statistical Analysis
All experiments calculated p-values using paired student's t test, with p < 0.05 considered statistically significant. Furthermore, the Benjamini and Hochberg multiple testing adjustment method has been applied for all small RNA sequencing studies and pathway analysis.
Results and Discussion
miRNA Expression in Triple Negative Breast Cancer Tissue Samples
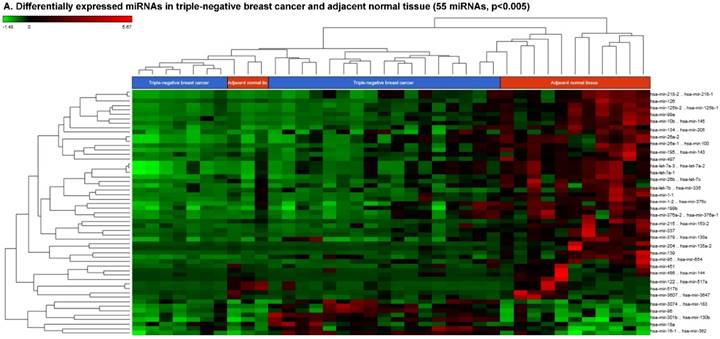
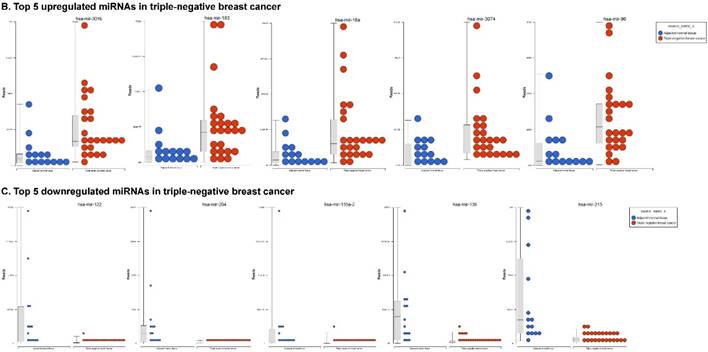
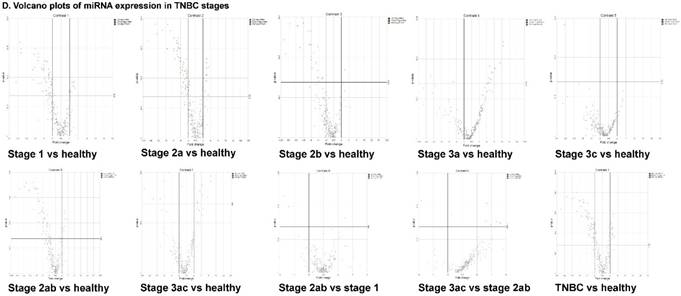
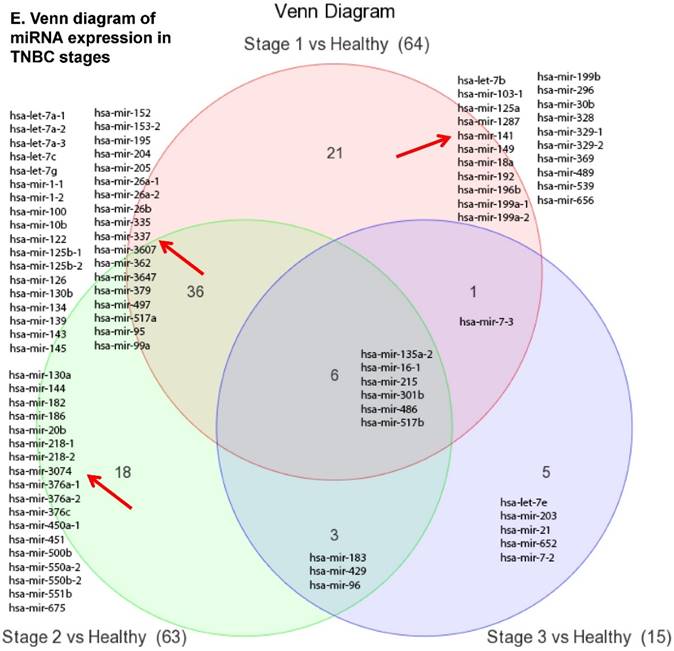
The miRNA raw data from patients with TNBC and adjacent normal tissue samples (control) were first downloaded from GEO series accession number GSE40049 which was then converted to FASTQ files and uploaded to the PartekFlow server for miRNA data analysis. We identified 99 miRNAs enriched in TNBC vs adjacent normal tissues that were statistically significant (p < 0.05). Applying more stringent statistical analysis (p < 0.005) to create hierarchical clustering, we found 55 dysregulated miRs (p < 0.005; Fig. 1A) of which eight were upregulated and 47 miRs were downregulated. Top five upregulated/downregulated miRNAs are shown in Figure 1B, C, respectively. Our miRNA findings were in line with that originally published by Chang et al [12] i.e. the top upregulated microRNA was miR-301b in TNBC (2.73 fold, p < 0.0001) along with miR-183 (p < 0.004), miR-18a ( p< 0.003), miR-3074 (p < 0.003) and miR-96 (p < 0.001). While, miR-122, miR-204, miR-135a-2, miR-139 and miR-215 were substantially downregulated in TNBC samples (Figure 1B). In other findings, miR-301 was highly upregulated in hepatocellular cancer [19], while specific miR-301b promotes cell invasiveness through targeting TP63 in pancreatic carcinoma cells [20]. Similarly, miR-183, a cluster (miR-96 and miR-182) of family genes, which is a potent prognostic marker for lung adenocarcinoma and other cancers, was found to be highly upregulated in our TNBC samples [21-27]. Likewise, a well-known onco-miR miR-18a belongs to miR-17-92 cluster that consists of seven miRNAs (miR-17-5p, miR-17-3p, miR-18a, miR-19b, miR-20a and miR-92) [28] and is considered as a biomarker for several cancers, particularly, esophageal, nasopharyngeal, colorectal and gastric cancer [29-34]. Another miR that was highly dysregulated in TNBC samples was miR-96. Previous studies have shown miR-96 as a potential biomarker for bladder, colorectal, non-small cell lung cancer and acute myeloid leukemia [35-40]. On the other hand, many of the miRs were found to be significantly downregulated in TNBC samples compared to adjacent normal tissues. The top five downregulated miRs, miR-122 (~45 fold, p < 0.00003), miR-204 (~26 fold, p < 0.0000001), miR-135a-2 (16 fold, p < 0.0000003), miR-139 (~14 fold, p < 0.0000001) and miR-215 (~11 fold, p < 0.000000001), are listed in Figure 1C. Stage-wise analysis of TNBC samples identified significantly dysregulated miRs in TNBC (sub-stages with differential expression of miRs are shown as a volcano plot in Figure 1D). We found 64 miRs in stage I, 63 miRs in stage II and 15 miRs in stage III, whereas, we found 36 miRs differentially expressed commonly in stage I & II, three miRs in stage II & III and only one miRs in stage I & III. Overall, there were six miRs commonly regulated in all three stages; miR-135a-2, miR-16-1, miR-215, miR-301b, miR-486 and miR-517b (Venn diagram in Fig. 1E). The reduction of miR-122 (Fig. 1C), which is known as a crucial member with a wide variety of functionality [41], is consistent with the recent similar study in breast cancer specimens [42] and in hepatocellular carcinoma and with poor prognosis and metastasis [41, 43-49]. Furthermore, miR-204, which was downregulated in TNBC (Fig. 1C), is considered to have tumor suppressor activity [50]. The low expression was observed in the breast cancer cells, prostate cancer cells, hepatoma, esophageal and gastric cancer cells [51-54] with notable correlation with advancement of cancer stages. We similarly plotted the differentially expressed miRNAs by both p-value (0.05 cutoff) and fold change (2 fold) for the stage-by-stage comparisons (Fig. 1D). We further classified differentially expressed miRNAs in each stage (stages I, II and III) of the TNBC (Fig. 1E). Chang et al, showed only 25 miRNAs that were significantly affected, however, in our data analysis, we found 98 miRs [p < 0.05; 55 miRs (p < 0.005)]. Out of the 25 miRs identified by Chang et al., we were able to identify 22 of them along with an additional 76 more miRs.
Differential expression of miRNAs in TNBC tissue samples. A heatmap view of differentially expressed miRNAs in Triple Negative Breast Cancer tissue samples (p ≤ 0.005; A). Top five statistically upregulated (B) and downregulated (C) microRNAs in TNBC were shown by dot plots and box plots. Volcano plots shown stage wise miRNA differential expression in TNBC compared with adjacent normal tissue samples (D). All significantly expressed miRNAs were summarized by a Venn diagram which identified six miRNAs commonly expressed in all stages with stages 1 and 2 sharing 36 miRs (E).
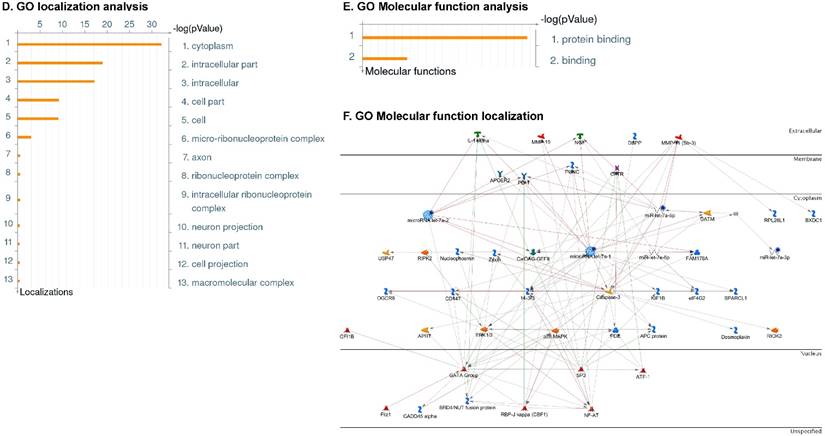
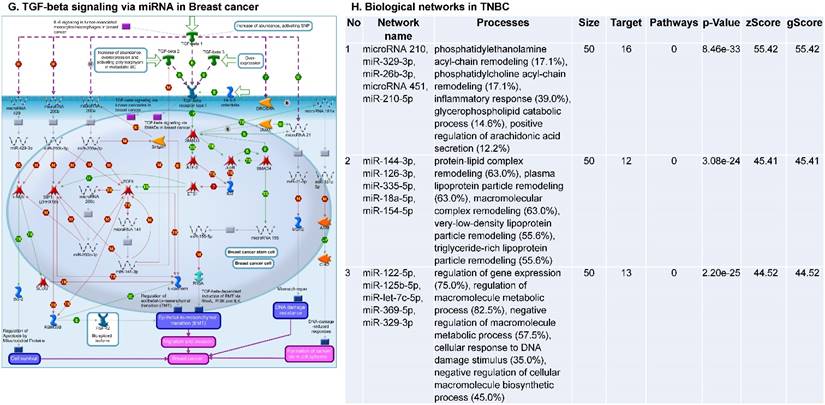
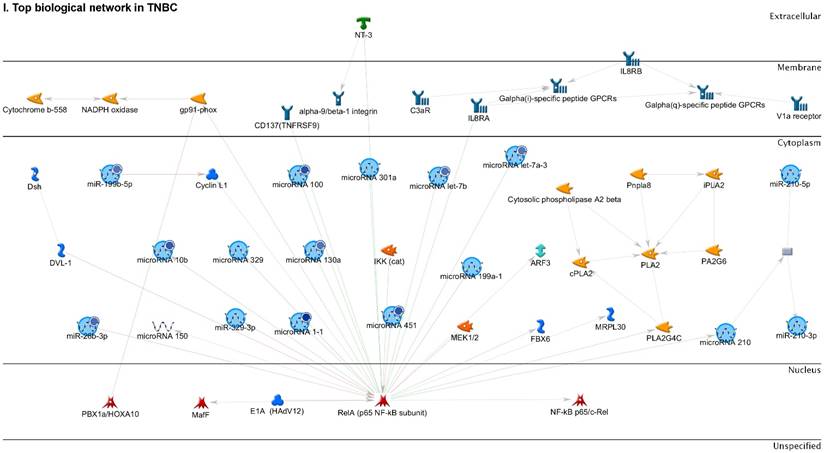
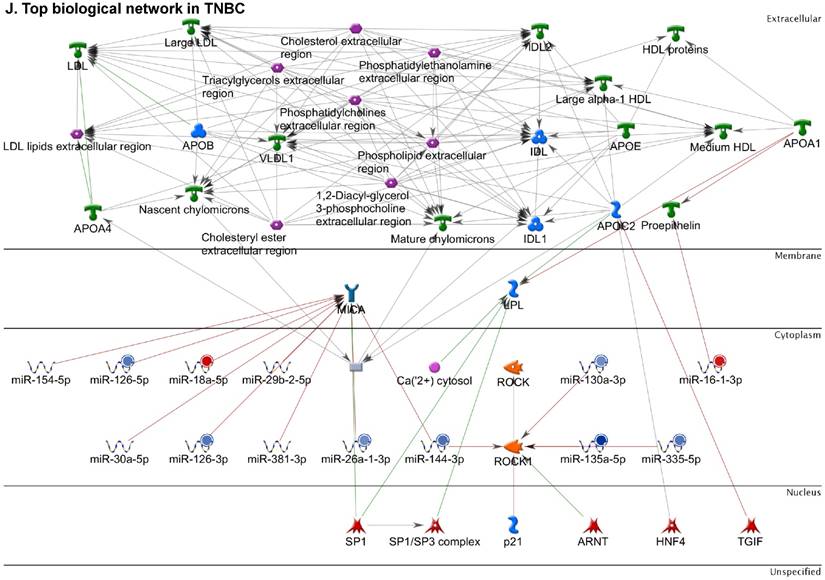
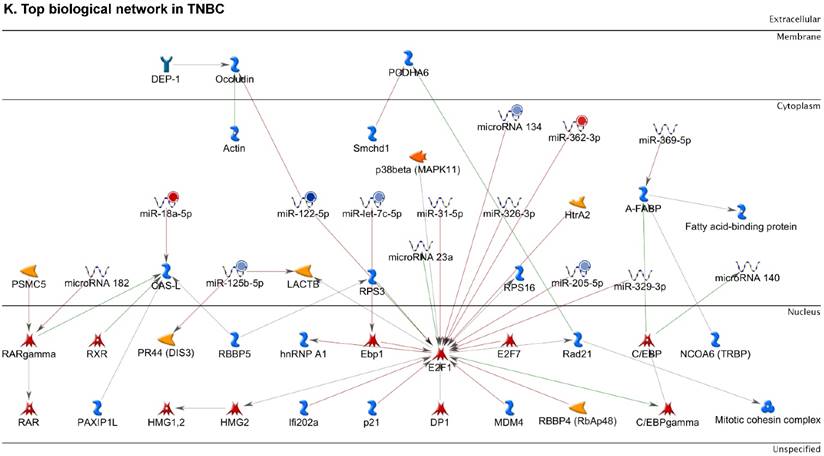
Following the miRNA expression analysis, using MetaCore software, we looked at various biological pathways to identity the molecular signature of the most affected and crucial signaling proteins in TNBC pathogenesis. Pathway analysis of differentially expressed biological pathways in TNBC compared to adjacent normal tissue samples clearly showed involvement of signaling molecules in the cell regulation, cell proliferation, migration and angiogenesis of TNBC (Fig. 2A). Response to amino acid was most significantly over-represented by Gene Ontology (GO) Biological Processes analysis (Fig. 2B) and many cancer-related categories were over-represented by Disease Stages by Biomarkers analysis (Fig. 2C). Enrichment analysis of the miRNA in TNBC GO Localization analysis revealed utmost of the miRNA located in the cytoplasm and intracellular compartments (Fig. 2D). While GO Molecular Function analysis showed enrichment of protein binding and a functional pathway was depicted around let 7a-1 and let 7a-2 miRNAs, which includes Interleukin-1 alpha, NSF, DSPP, MMP-11 and MMP-19 as extracellular regulators, by way of intercellular signaling molecules such as Caspase 3, ERK1/2, p38/MAPK, and PDE, and then resulting in involving nuclear transcription factors such as GATA Group, SP3, BRD4/NUT fusion protein, RBP-J kappa, and NF-AT (Fig. 2E, F). In-depth pathway analysis showed the TGF-beta signaling pathway to be majorly affected in the TNBC samples (Fig. 2G). Biological network analysis of miRNA involved with the highest affected network processes were shown in Figure 2H-K, respectively.
Enrichment analysis of microRNA for Pathway Maps, Gene Ontology, Disease by Biomarker and Network processes in TNBC. Pathway analysis was carried by MetaCore software, differentially expressed miRNA data were uploaded to MetaCore server and the most significantly affected pathways were created. (A): Pathway Maps: Canonical pathway analysis showed most of the miRNAs that were affected involved the oncogenic signature. (B): GO Biological Processed: The most affected Biological Processes involved stimulation of cellular responses to various substances. (C): Disease status: Significantly affected miRNAs in disease status included various carcinomas. (D): GO localization: Affected miRNA in TNBC showed localization into cytoplasm and intracellularly. (E): GO Molecular function: Protein binding was shown to be the most enriched molecular function. (F): GO Molecular function localization: miRNA data analysis for affected miRNAs distribution. (G): Enrichment analysis of top pathway: TGF-b signaling pathway involved in breast cancer, analyzed by MetaCore software, Up‑ward thermometers have red color and indicate up‑regulated signals and down‑ward (blue) ones indicate down‑regulated expression levels of the genes. (H-K): Biological network analysis: miRNA differentially expressed data were analyzed for the biological networks involved in TNBC, we presented the top three networks and involved miRs in the disease process (H). Top three regulated biological networks are shown in I, J and K. This is a variant of the shortest paths algorithm with main parameters of enrichment with enriched miRNAs prioritized based on the number of fragments of canonical pathways on the networks. Up‑regulated genes were marked with red circles; down‑regulated genes with blue circles. The 'checkerboard' color indicates mixed expression for the gene between files or between multiple tags for the same gene.

Differentially Expressed piRNAs in Triple Negative Breast Cancer
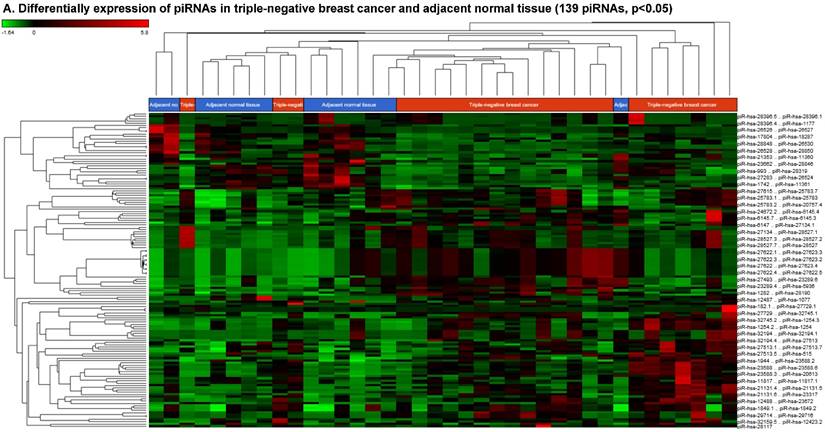
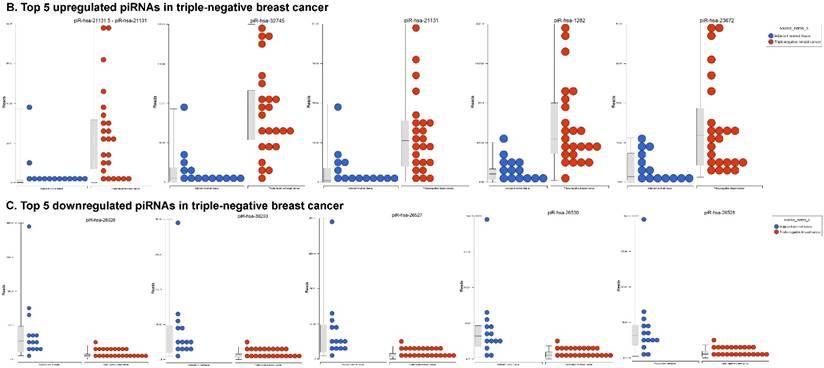
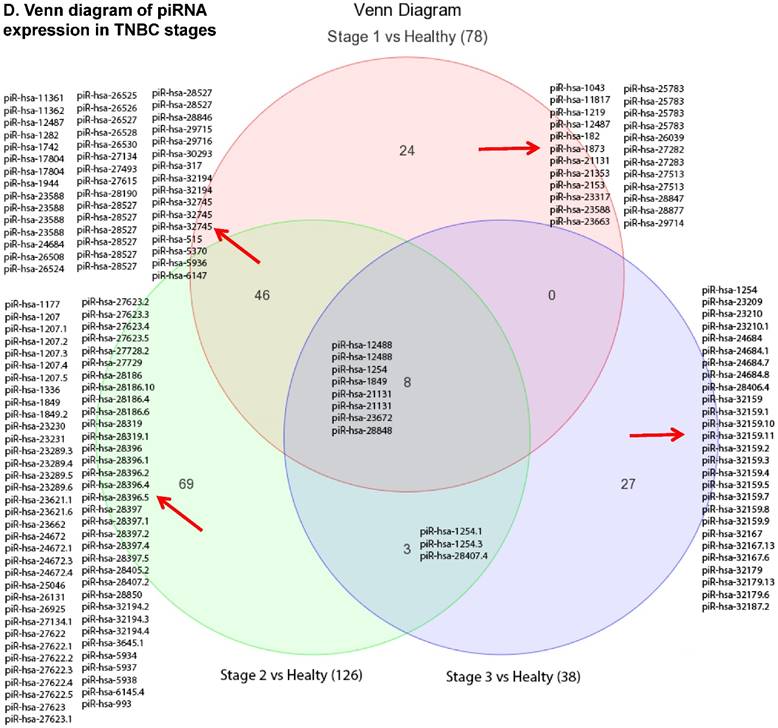
Piwi-interacting RNAs (piRNAs) are the largest class of endogenous non-coding small RNAs. The piRNAs have been recently shown to play important biological roles as RNA silencers, where piwi-proteins form RNA-protein complexes and are required for both epigenetic and post-transcriptional gene silencing of retrotransposons and other genetic elements in germ line cells, particularly during spermatogenesis [55]. Aligning small RNA sequencing data and remapping with piRBase annotation that contains thousands of the piRNAs, we identified more than 139 differentially expressed piRNAs that were statistically significant (p < 0.05; Fig. 3A-C) in TNBC samples compared to normal adjacent tissue samples. Out of 139, 103 piRNAs were upregulated and 36 piRNAs were downregulated in TNBC samples. A number of groups have directed their attention to understand the biological and epigenetic functions of piRNAs. Since, detection of piRNAs in cancer correlates with poorer prognostics and clinical outcomes, suggesting that piRNAs play an important functional role in the cancer biogenesis, there is an ongoing effort to utilize piRNAs for developing diagnostic, prognostic and therapeutic tools. However, until the gap in our understanding of mechanisms underlying piRNA biogenesis and functions is filled, it will be difficult to entirely discriminate between a 'passenger' role for the ectopic expression of piRNAs and PIWI proteins in cancer from a 'driver' role in the pathogenesis of these diseases [56]. We listed the top five upregulated piRNAs (Fig. 3B) i.e.piR-21131 (8 fold, p < 0.00004), piR-32745 (6 fold, p < 0.00001), piR-21131 (5 fold, p < 0.003), piR-1282 (5 fold, p < 0.0003) and piR-23672 (4 fold, p < 0.0006) and downregulated (Fig. 3C) piR-23662 (15 fold, p < 0.003), piR-26526 (10 fold, p < 0.00003), piR-26527 (9 fold, p < 0.00009), piR-30293 (9 fold, p < 0.00009) and piR-26528 (8 fold, p < 0.000008) in TNBC compared to normal tissue. Recent studies have also reported the involvement of specific piRNAs in different cancers, for example, piR-4987, piR-20365, piR-20485, piR-20582 and piR-932 in breast cancer [57, 58], piR-823 and piR651 in gastric cancer [59, 60], upregulated piR-32051, piR-39894, piR-43607 and downregulated piR-38756, piR-57125, piR-30924 in kidney cancer [61], piR-Hep1 in liver cancer [62], downregulated piR-017061 in pancreatic cancer [63], downregulated piR-823 in multiple myeloma, downregulated piR-L-163 in lung cancer [64], and piR-59056, piR-32105 and piR-58099 in colon cancer [65]. Analyzing stage-wise differential expression of piRNAs, we found 46 piRNAs were shared between stages I & II; three shared piRNAs in stage II & III whereas no common piRNAs in stages I & III. However, in all three stages eight piRNAs were differentially expressed (Fig. 3D).
Differential expression of piRNAs in TNBC patient's tissue samples: piRNA analysis revealed 139 piRNAs statistically significant in TNBC vs adjacent normal tissue samples that were shown as hierarchical clustering (p ≤ 0.05; A), within which, 103 piRNAs were upregulated (B) and 36 piRNAs were downregulated (C). Differential expression of piRNAs in stagewise analysis shown as a Venn diagram with affected gene list diagram which identified eight piRNAs commonly expressed in all stages and stage 1 and 2 sharing 46 piRs (D).
Differentially Expressed Long Non-coding RNAs in TNBC Tissue Samples
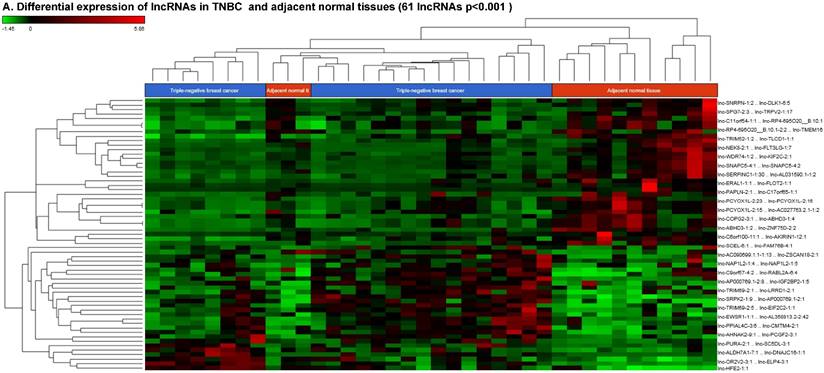
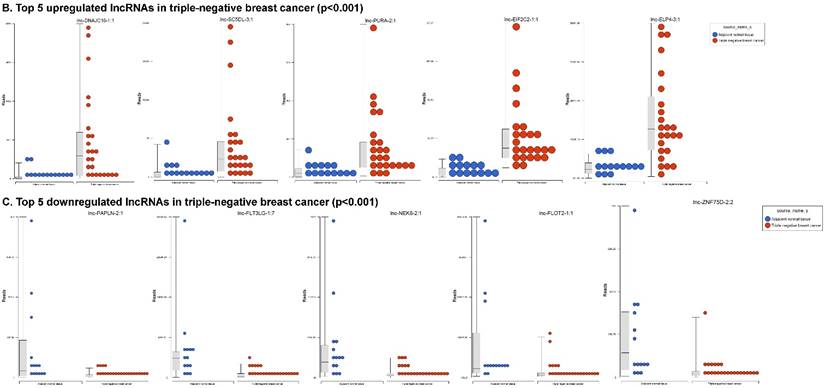
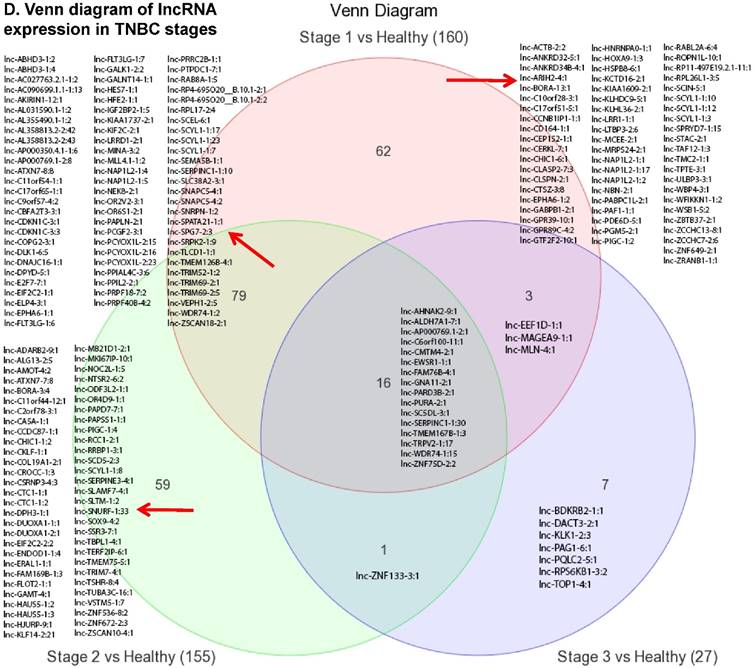
Long non-coding RNAs (lncRNAs) are the most recent and the least characterized class of the sncRNAs family, being larger than 200 nucleotides and non-conserved among species [55]. lncRNAs are known to have tissue-specific expression in a regulated manner correlatingwith distinct gene sets that influence cellular function [66], in addition to, acting as a tumor suppressor or promoter [67-69]. Our small RNA sequencing data remapped to identify differentially expressed lncRNAs in TNBC patient's tissue samples found 258 lncRNAs (p<0.05) significantly expressed. When more stringent p-values (p < 0.001) were applied, we identified 61 lncRNAs (Fig. 4A) where 28 lncRNAs were upregulated (Top five: lnc-DNAJC16-1:1, lnc-SC5DL-3:1, lnc-PURA-2:1, lnc-EIF2C2-1:1 and lnc-ELP4-3:1; Fig. 4B) and 33 lncRNAs were downregulated (Top five: lnc-PAPLN-2:1, lnc-FLT3LG-1:7, lnc-NEK8-2:1, lnc-FLOT2-1:1 and lnc-ZNF75D-2:2; Fig. 4C). lncRNAs are a heterogeneous groups of transcripts with diverse mechanisms and are differentially expressed in many diseases including cancer [68]. DNAJC16 belonging to the DnaJ Heat shock protein family, functions in protein translation, translocation and degradation and this lnc-DNAJC16-1:1 was significantly upregulated (17 fold, p < 0.0001) in TNBC tissue samples. PURA is a sequence-specific, multi-functional single-stranded-DNA/RNA-binding protein and RNA-binding protein which can act as a transcriptional activator and repressor and we observed lnc-PURA-2:1 (5 fold, p < 0.002) upregulated in TBNC, which has not been reported in the literature, however, recently, Inoue et al., showed PURA over expression leads to activation of PSA production in PC3 cells [70]. We furthermore analyzed the data for stage wise assertion of lncRNA profiling and found 160 lncRNAs in stage I, 155 lncRNAs in stage II and 27 lncRNAs in stage III, whereas, 79 were commonly regulated in stage I & II, only one lncRNA in stage II & III and 3 lncRNAs in stage I & III. Overall, in all three stages, 16 lncRNAs were differentially regulated (Fig. 4D). Further investigation is needed to check their functions in TNBC and other diseases.
Differential expression of long non-coding RNAs (lncRNAs) in TNBC tissue samples: (A): Dendrogram view of 61 lncRNAs that were statistically significant in TNBC vs adjacent normal tissue samples (p ≤ 0.001) as a hierarchical tree. Top five upregulated lncRNA (B) and top five downregulated lncRNAs (C) shown in figures. Differential expression of lncRNAs in stagewise analysis shown as a Venn diagram which identified 16 lncRNAs commonly expressed in all stages and stage 1 and 2 sharing 79 lncRNAs (D).
Differentially Expressed snRNA and snoRNAs in TNBC Tissue Samples
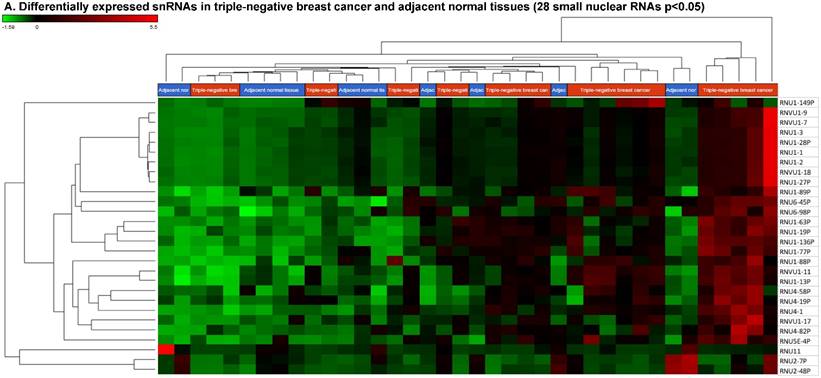
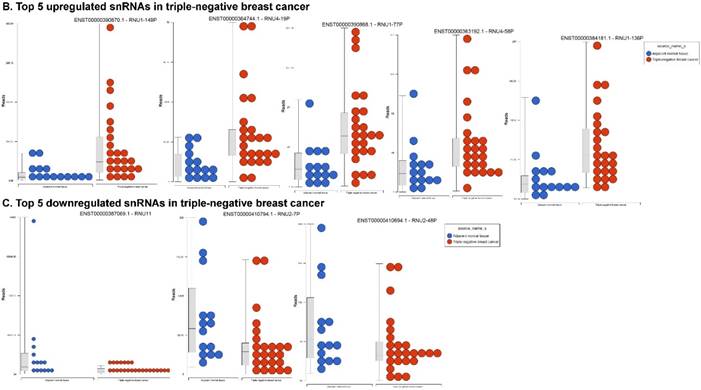
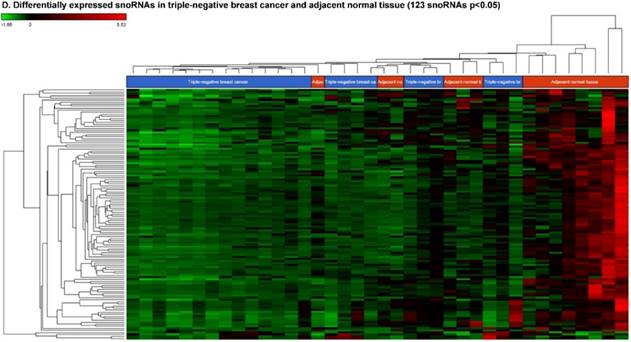
Small nuclear RNAs (snRNAs) form a class of RNA molecules that localize within the nucleus of eukaryotic cells [55]. Their primary function is pre-mRNA processing, for which they are always associated with a set of specific proteins. These complexes are referred to as small nuclear ribonucleoproteins (snRNP). The small nucleolar RNAs (snoRNAs) are another subclass of snRNA that are localized in the nucleolus and are associated with the maturation of RNA molecules through chemical modifications targeting mainly rRNAs, tRNAs and snRNAs [55]. We remapped aligned reads to GenCode database, which contains most of the curated small RNAs in order to specifically look for snRNAs and snoRNAs. We identified 28 snRNAs (p < 0.05; Fig. 5A) and 123 snoRNAs (p < 0.05; Fig. 5D). Out of 28 snRNAs, only three snRNAs were downregulated (Fig. 6C; RNU11, RNU2-7P and RNU2-48P) and the remaining 25 were upregulated (Top five upregulated snRNAs are listed in Fig. 5B; i.e. RNU1-149P, RNU4-19P, RNU1-77P, RNU4-58P and RNU1-136P). U1 small nuclear RNA is a multigene family located on the small arm of chromosome 1 and in addition to this, U1 snRNA pseudogenes are present throughout the genome [71]. Many of the snRNAs which are upregulated in TNBC samples indicated that these snRNAs may be involved in oncogenesis, however, this needs to be further validated and investigated to be developed as biomarkers. RNU11 plays a role in splicing the U12-dependent class of eukaryotic nuclear introns and was found to be downregulated in TNBC samples. Although previous studies have shown the RNU family of snRNAs are expressed in pancreatic, colorectal and lung cancers, no concrete evidence is available to define the function of RNU2 snRNAs [72].
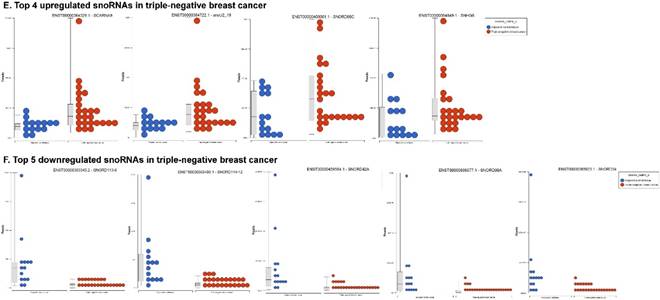
Accumulating evidence through recent reports indicate the role of snoRNA in regulation of cell fate and tumorigenesis [73]. We identified 123 snoRNAs that were differentially affected in the TNBC samples (p < 0.05; Fig. 5D), where only 4 out of 123 snoRNAs (scaRNA9, snoU2_19, snoRD88C and SNHG6) were upregulated (Fig. 5E) while the remaining 119 snoRNAs were downregulated (Fig. 5F). Recent studies have shown that, the SNGH family of snoRNAs plays a crucial role in oncogenesis. For example, Zhang et al., have shown long noncoding RNA SNHG1 affects tumor suppressor gene p53, thus promoting hepatocellular carcinoma tumorigenesis. They proposed SNHG1 could serve as a predictor of poor prognosis [74]. Additionally, Zhao et al, showed SNHG5 suppresses gastric cancer progression by trapping MTA2 in the cytosol [75]. Conversely, in our study, SNHG6 was found to be upregulated in TNBC samples. Similarly, snoU2_19, a modifying snRNA (function as modification of other snRNAs) was also found to be upregulated in the TNBC tissue samples. In our analysis downregulated snoRNAs spotted were snoRD113 (~10 fold, p < 0.0000001, multiple transcript types), snoRD114 (~9 fold, p < 0.0000001), snoRD42A (~9 fold, p < 0.0001), snoRD96A (~8 fold, p < 0.000001) and snoRD34 (~7 fold, p < 0.0000001). snoRD113, snoRD114 and snoRD116, that belong to the C/D box class of snoRNAs were found to be remarkably downregulated in TNBC samples. The snoRNA113, which was significantly downregulated in TNBC samples has been previously reported to suppress tumorigenesis in hepatocellular carcinoma [76]. While it was downregulated in our TNBC samples, snoRD114 was previously reported to be overexpressed in acute promyelocytic leukemia (APL) [77], suggesting, tissue specific action of this cluster of snoRNAs. The role of the snoRD113, snoRD114 and snoRD116 cluster region is becoming an important molecular target [78]. For example, genetic mapping of snoRD116 has been recently reported to be absent or change its expression and affect other snoRNAs in Prader-Willi syndrome (PWS), a complex rare genetic condition caused by a loss of normally expressed genes on chromosome 15 from the paternal parent [79, 80]. It is known that snoRD42A regulates snoRD116 clusters [81], and in our TNBC samples, both snoRNAs (snoRD42A and snoRD116) were found to be drastically under expressed. Purified box C/D snoRNPs were predicted to function in site specific methylation of substrate RNA [82]. At the moment, we do not understand the biological and clinical implication of this finding, however, it is anticipated that better understanding of these molecules will lead to finding a prognostic marker or novel drug target for specific diseases.
Differential expression of small nuclear or nucleolar RNAs (snRNAs or snoRNAs) in TNBC tissue samples: small RNA-seq data were analyzed for snRNAs or snoRNAs with GenCode annotation and found 28 snRNAs (p <0.05; A) shown with their hierarchical clustering. Top five upregulated (B) and top three downregulated (C) snRNAs shown. Dendrogram view of 123 snoRNAs (p < 0.05; D) expressed in in TNBC vs adjacent normal tissue samples. Top four upregulated (E) and top five downregulated (F) snoRNAs shown.
Differential Expression of rRNAs, miscRNAs and Nonsense Mediated Decay (NMD) RNAs in TNBC
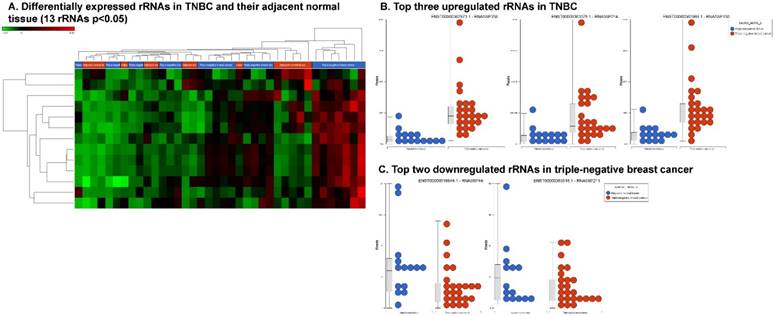
We extended our analysis to other different types of small non-coding RNAs, i.e. rRNAs, miscRNAs and nonsense mediated decay (NMD) RNAs. Ribosomal RNAs are known to be essential tools for protein biosynthesis [83, 84]. In our analysis, we found that 13 rRNAs were differentially expressed (p < 0.05; Fig. 6A), with 11 upregulated (RNA5SP358, RNA5SP214, RNA5SP150, RNA5S9, RNA5SP204, RNA5SP248, RNA5SP500, RNA5-8SP2, RNA5SP207, RNA5SP132 and RNA5SP19; Fig. 6B) and two downregulated (RNA5SP444 and RNA5SP211; Fig. 6C). Presently, none of these rRNAs have been reported to have any specific function in any known disease status. Very few studies have been reported in this area and so further in-depth investigation is needed to link the disease status and the rRNA expression.
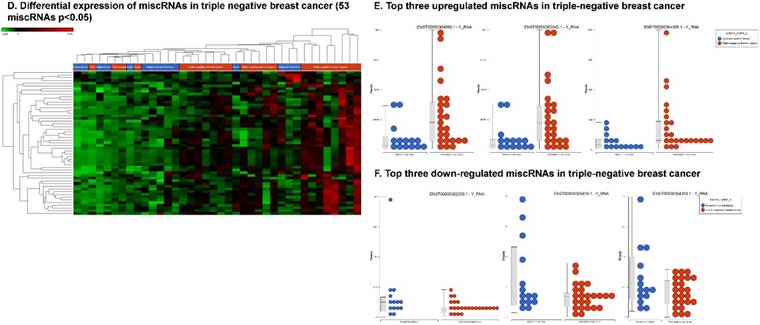
We also identified the 53 differentially expressed miscRNAs, and most of the them are described as Y RNAs that are required for DNA replication [85] (p < 0.05; Fig. 6D) in TNBC tissue samples. Only four miscRNAs were found to be downregulated (Fig. 6F), while the remaining 49 miscRNAs were significantly upregulated (Fig. 6E).
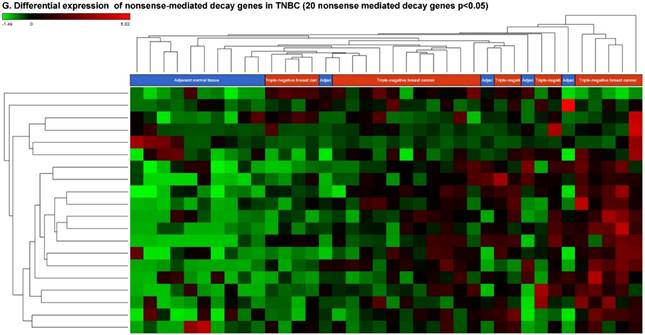
Nonsense-mediated decay RNAs (nmdRNAs) are involved in surveillance pathways in all eukaryotes and reducing errors in gene expression by eliminating mRNA transcripts that contain premature stop codons. However, in some cases translation of these aberrant mRNAs could lead to deleterious dominant-negative activity or gain-of-function of the resulting abnormal proteins [86]. In our data analysis, we found 20 substantially deregulated nmdRNAs, out of which, two nmdRNAs were downregulated and 18 nmdRNAs were upregulated (Fig. 6G).
Differential expression of other types of small RNAs enriched in TNBC tissue samples: small RNA-seq data were analyzed for rRNAs, miscRNAs and nonsense mediated decay RNAs (nmdRNAs) with GenCode annotation and found 13 rRNAs (p < 0.05; A), 53 miscRNAs (p < 0.05; D) and 20 nmdRNAs (p < 0.05; G) shown as hierarchical clustering. Top three upregulated (B) and top two downregulated (C) rRNAs and top three upregulated (E) and top three downregulated (F) miscRNAs shown.
Further validation and clinical studies on large clinical samples are needed to confirm the biological function of dysregulated small non-coding RNAs identified in this study and to use as future prognostic, diagnostic and therapeutic biomarkers in TNBC.
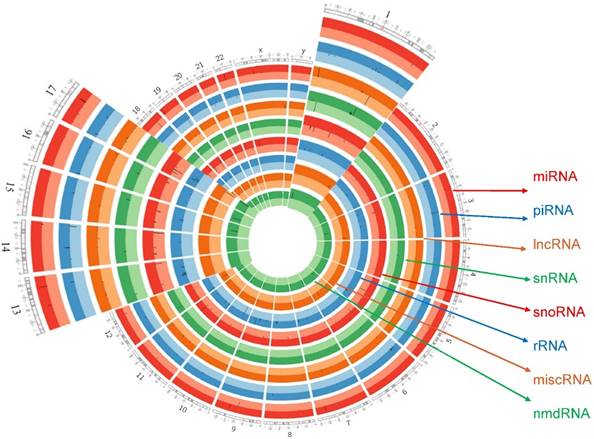
We further designed a Circos plot for comprehensive genomic data visualization allowing for decreased graph complexity and better readability. Circos plot (v0.69-4) was used to generate plots, upregulated and downregulated genes shown as darker and lighter colors respectively. Comprehensive data visualization shows, enrichment of each sncRNAs type in chromosome view. Most of the differential expression of miRNAs was enriched in chromosome 14 and chromosome 11 while expressions of piRNAs were enriched in chromosome 14, chromosome 1 and chromosome 16. Further observing all the data, lncRNAs were enriched on chromosome 11, chromosome 1 and chromosome 17 whereas sn/snoRNAs on chromosome 15, chromosome 14 and chromosome 1. Overall, the most affected chromosomes in all the sncRNAs were on chromosomes 14, 11 and 1. Extending inward from the outer ring of the Circos plot, miRNAs were followed in order by piRNAs, lncRNAs, snRNAs, snoRNAs, rRNAs, miscRNAs and nmdRNAs. Black lines inside the respective rings shows the affected gene location on chromosome number (Fig. 7).
Conclusion
High-throughput sequencing technologies have effectively enabled the unbiased and sensitive detection of non-coding RNAs in disease as well as in normal cellular biology. It is presumed that small RNA plays a crucial role in disease network and pathogenesis. However, our understanding is presently limited mostly towards the biological role of small RNAs, and little is known about the expression pattern of non-coding RNAs in pathological conditions. We believe that by identifying the specific molecular gene signature in distinct disease states will allow for better diagnosis and optimization of treatment modalities. In summary, the present study analyzed all sncRNA sequencing data from TNBC and adjacent normal tissue samples for the first time. We have identified several differentially regulated miRNAs, piRNAs, lncRNAs and sn/snoRNAs in TNBC that could serve as new biomarkers for easy and early disease detection while offering new therapeutic targets, pending experimental validation. Our investigation demonstrates a comprehensive screening of non-coding RNA signature in publicly available NGS resources. Our approach seeks to maximize the utilization of established datasets to understand the biological role of non-coding RNAs in tumorigenesis, disease prognosis and treatment outcome.
Acknowledgements
We thank Gene Arrays (An entity of Vedic Research, Inc., USA) for MetaCore data analysis free of charge. This work is supported by the Department of Surgery at Penn State Milton S Hershey Medical Center. Authors also want to acknowledge Mr. Clark Royden & Ms. Anna Salzberg for Circos plot technical assistance and Kimberly Walker for manuscript formatting to journal style.
Circos plot incorporating differential expressions of all small non-coding RNAs effected in TNBC. Chromosome and bands are listed in chromosomal positions of small RNAs affected expression in TNBC vs adjacent normal tissue samples. Outermost ring is for miRNA, then piRNA, then lncRNA then snRNA, then snoRNA, then rRNA, then miscRNAs and nmdRNAs with darker and lighter background colors representing upregulated and downregulated genes listed respectively.
Competing Interests
The authors have declared that no competing interest exists.
References
1. Siegel RL, Miller KD, Jemal A. Cancer statistics, 2016. CA: A Cancer Journal for Clinicians. 2016;66:7-30
2. Irvin Jr WJ, Carey LA. What is triple-negative breast cancer? European Journal of Cancer. 2008;44:2799-805
3. Kaplan N, Moore IK, Fondufe-Mittendorf Y, Gossett AJ, Tillo D, Field Y. et al. The DNA-encoded nucleosome organization of a eukaryotic genome. Nature. 2009;458:362-6
4. Eddy SR. Non-coding RNA genes and the modern RNA world. Nat Rev Genet. 2001;2:919-29
5. Lee RC, Feinbaum RL, Ambros V. The C. elegans heterochronic gene lin-4 encodes small RNAs with antisense complementarity to lin-14. Cell. 1993;75:843-54
6. Sai Lakshmi S, Agrawal S. piRNABank: a web resource on classified and clustered Piwi-interacting RNAs. Nucleic Acids Research. 2008;36:D173-D7
7. Cao J. The functional role of long non-coding RNAs and epigenetics. Biological Procedures Online. 2014;16:11
8. Scott MS, Ono M, Yamada K, Endo A, Barton GJ, Lamond AI. Human box C/D snoRNA processing conservation across multiple cell types. Nucleic Acids Research. 2011
9. Thomson T, Lin H. The Biogenesis and Function PIWI Proteins and piRNAs: Progress and Prospect. Annual review of cell and developmental biology. 2009;25:355-76
10. Derrien T, Johnson R, Bussotti G, Tanzer A, Djebali S, Tilgner H. et al. The GENCODE v7 catalog of human long noncoding RNAs: Analysis of their gene structure, evolution, and expression. Genome Res. 2012;22:1775-89
11. Scott MS, Ono M. From snoRNA to miRNA: Dual function regulatory non-coding RNAs. Biochimie. 2011;93:1987-92
12. Chang Y-Y, Kuo W-H, Hung J-H, Lee C-Y, Lee Y-H, Chang Y-C. et al. Deregulated microRNAs in triple-negative breast cancer revealed by deep sequencing. Molecular Cancer. 2015;14:36
13. Firmino N, Martinez VD, Rowbotham DA, Enfield KS, Bennewith KL, Lam WL. HPV status is associated with altered PIWI-interacting RNA expression pattern in head and neck cancer. Oral Oncol. 2016;55:43-8
14. Krzywinski M, Schein J, Birol İ, Connors J, Gascoyne R, Horsman D. et al. Circos: An information aesthetic for comparative genomics. Genome Research. 2009;19:1639-45
15. Kozomara A, Griffiths-Jones S. miRBase: annotating high confidence microRNAs using deep sequencing data. Nucleic Acids Research. 2014;42:D68-D73
16. Zhang P, Si X, Skogerbø G, Wang J, Cui D, Li Y. et al. piRBase: a web resource assisting piRNA functional study. Database. 2014. 2014
17. Volders P-J, Verheggen K, Menschaert G, Vandepoele K, Martens L, Vandesompele J. et al. An update on LNCipedia: a database for annotated human lncRNA sequences. Nucleic Acids Research. 2015;43:D174-D80
18. Sehgal K, Guo X, Koduru S, Shah A, Lin A, Yan X. et al. Plasmacytoid dendritic cells, interferon signaling, and FcgammaR contribute to pathogenesis and therapeutic response in childhood immune thrombocytopenia. Sci Transl Med. 2013;5:193ra89
19. He K, Hu Z, Ruan J, Ma Q, Zhong F, Cheng X. et al. MicroRNA301 is a potential diagnostic biomarker for hepatocellular cancer. International Journal of Clinical and Experimental Pathology. 2015;8:5603-8
20. Funamizu N, Lacy CR, Parpart ST, Takai A, Hiyoshi Y, Yanaga K. MicroRNA-301b promotes cell invasiveness through targeting TP63 in pancreatic carcinoma cells. International journal of oncology. 2014;44:725-34
21. Zhu W, Liu X, He J, Chen D, Hunag Y, Zhang YK. Overexpression of members of the microRNA-183 family is a risk factor for lung cancer: A case control study. BMC Cancer. 2011;11:393 -
22. Zhang Q-H, Sun H-M, Zheng R-Z, Li Y-C, Zhang Q, Cheng P. et al. Meta-analysis of microRNA-183 family expression in human cancer studies comparing cancer tissues with noncancerous tissues. Gene. 2013;527:26-32
23. Xu F, Zhang H, Su Y, Kong J, Yu H, Qian B. Up-regulation of microRNA-183-3p is a potent prognostic marker for lung adenocarcinoma of female non-smokers. Clinical and Translational Oncology. 2014;16:980-5
24. Yuan D, Li K, Zhu K, Yan R, Dang C. Plasma miR-183 predicts recurrence and prognosis in patients with colorectal cancer. Cancer Biology & Therapy. 2015;16:268-75
25. Zhang Q, Di W, Dong Y, Lu G, Yu J, Li J. et al. High serum miR-183 level is associated with poor responsiveness of renal cancer to natural killer cells. Tumor Biology. 2015;36:9245-9
26. Chen J, Gu L, Ni J, Hu P, Hu K, Shi Y-L. MiR-183 Regulates ITGB1P Expression and Promotes Invasion of Endometrial Stromal Cells. BioMed Research International. 2015;2015:340218
27. Pak MG, Lee C-H, Lee W-J, Shin D-H, Roh M-S. Unique microRNAs in lung adenocarcinoma groups according to major TKI sensitive EGFR mutation status. Diagnostic Pathology. 2015;10:99
28. KOMATSU S, ICHIKAWA D, TAKESHITA H, MORIMURA R, HIRAJIMA S, TSUJIURA M. et al. Circulating miR-18a: A Sensitive Cancer Screening Biomarker in Human Cancer. In Vivo. 2014;28:293-7
29. Su Z-X, Zhao J, Rong Z-H, Wu Y-G, Geng W-M, Qin C-K. Diagnostic and prognostic value of circulating miR-18a in the plasma of patients with gastric cancer. Tumor Biology. 2014;35:12119-25
30. Tsujiura M, Komatsu S, Ichikawa D, Shiozaki A, Konishi H, Takeshita H. et al. Circulating miR-18a in plasma contributes to cancer detection and monitoring in patients with gastric cancer. Gastric Cancer. 2015;18:271-9
31. Yau TO, Wu CW, Dong Y, Tang CM, Ng SSM, Chan FKL. et al. microRNA-221 and microRNA-18a identification in stool as potential biomarkers for the non-invasive diagnosis of colorectal carcinoma. British Journal of Cancer. 2014;111:1765-71
32. Luo Z, Dai Y, Jiang C, Li Z, Yang J, McCarthy JB. et al. miR-18a promotes malignant progression by impairing microRNA biogenesis in nasopharyngeal carcinoma. Carcinogenesis. 2013;34:415-25
33. Hirajima S, Komatsu S, Ichikawa D, Takeshita H, Konishi H, Shiozaki A. et al. Clinical impact of circulating miR-18a in plasma of patients with oesophageal squamous cell carcinoma. British Journal of Cancer. 2013;108:1822-9
34. Zheng Y, Li S, Ding Y, Wang Q, Luo H, Shi Q. et al. The role of miR-18a in gastric cancer angiogenesis. Hepato-gastroenterology. 2013;60:1809-13
35. Li J, Li P, Chen T, Gao G, Chen X, Du Y. et al. Expression of microRNA-96 and its potential functions by targeting FOXO3 in non-small cell lung cancer. Tumor Biology. 2015;36:685-92
36. Zhao J, Lu Q, Zhu J, Fu J, Chen Y-x. Prognostic value of miR-96 in patients with acute myeloid leukemia. Diagnostic Pathology. 2014;9:76 -
37. Wang Y, Luo H, Li Y, Chen T, Wu S, Yang L. hsa-miR-96 up-regulates MAP4K1 and IRS1 and may function as a promising diagnostic marker in human bladder urothelial carcinomas. Molecular medicine reports. 2012;5:260-5
38. Gao F, Wang W. MicroRNA-96 promotes the proliferation of colorectal cancer cells and targets tumor protein p53 inducible nuclear protein 1, forkhead box protein O1 (FOXO1) and FOXO3a. Molecular medicine reports. 2015;11:1200-6
39. Eissa S, Habib H, Ali E, Kotb Y. Evaluation of urinary miRNA-96 as a potential biomarker for bladder cancer diagnosis. Medical Oncology. 2014;32:1-7
40. Ress AL, Stiegelbauer V, Winter E, Schwarzenbacher D, Kiesslich T, Lax S. et al. MiR-96-5p influences cellular growth and is associated with poor survival in colorectal cancer patients. Molecular Carcinogenesis. 2015;54:1442-50
41. Bandiera S, Pfeffer S, Baumert TF, Zeisel MB. miR-122 - A key factor and therapeutic target in liver disease. Journal of Hepatology. 2015;62:448-57
42. Wang B, Wang H, Yang Z. MiR-122 Inhibits Cell Proliferation and Tumorigenesis of Breast Cancer by Targeting IGF1R. PLoS ONE. 2012;7:e47053
43. Hsu S-h, Wang B, Kota J, Yu J, Costinean S, Kutay H. et al. Essential metabolic, anti-inflammatory, and anti-tumorigenic functions of miR-122 in liver. The Journal of Clinical Investigation. 2012;122:2871-83
44. Coulouarn C, Corlu A, Glaise D, Guénon I, Thorgeirsson SS, Clément B. Hepatocyte-Stellate Cell Cross-Talk in the Liver Engenders a Permissive Inflammatory Microenvironment That Drives Progression in Hepatocellular Carcinoma. Cancer Research. 2012;72:2533-42
45. Bai S, Nasser MW, Wang B, Hsu S-H, Datta J, Kutay H. et al. MicroRNA-122 inhibits tumorigenic properties of hepatocellular carcinoma cells and sensitizes these cells to sorafenib. Journal of Biological Chemistry. 2009;284:32015-27
46. Fornari F, Gramantieri L, Giovannini C, Veronese A, Ferracin M, Sabbioni S. et al. MiR-122/Cyclin G1 Interaction Modulates p53 Activity and Affects Doxorubicin Sensitivity of Human Hepatocarcinoma Cells. Cancer Research. 2009;69:5761-7
47. Nassirpour R, Mehta PP, Yin M-J. miR-122 Regulates Tumorigenesis in Hepatocellular Carcinoma by Targeting AKT3. PLoS ONE. 2013;8:e79655
48. Xu J, Zhu X, Wu L, Yang R, Yang Z, Wang Q. et al. MicroRNA-122 suppresses cell proliferation and induces cell apoptosis in hepatocellular carcinoma by directly targeting Wnt/β-catenin pathway. Liver International. 2012;32:752-60
49. Nakao K, Miyaaki H, Ichikawa T. Antitumor function of microRNA-122 against hepatocellular carcinoma. Journal of Gastroenterology. 2014;49:589-93
50. Lee H, Lee S, Bae H, Kang H-S, Kim SJ. Genome-wide identification of target genes for miR-204 and miR-211 identifies their proliferation stimulatory role in breast cancer cells. Scientific reports. 2016:6
51. Turner DP, Findlay VJ, Moussa O, Semenchenko VI, Watson PM, LaRue AC. et al. Mechanisms and functional consequences of PDEF protein expression loss during prostate cancer progression. The Prostate. 2011;71:1723-35
52. Ge Y, Yan X, Jin Y, Yang X, Yu X, Zhou L. et al. fMiRNA-192 and miRNA-204 Directly Suppress lncRNA HOTTIP and Interrupt GLS1-Mediated Glutaminolysis in Hepatocellular Carcinoma. PLoS Genet. 2015;11:e1005726
53. Sun Y, Yu X, Bai Q. miR-204 inhibits invasion and epithelial-mesenchymal transition by targeting FOXM1 in esophageal cancer. International journal of clinical and experimental pathology. 2015;8:12775
54. Li W, Jin X, Zhang Q, Zhang G, Deng X, Ma L. Decreased expression of miR-204 is associated with poor prognosis in patients with breast cancer. Int J Clin Exp Pathol. 2014;7:3287-92
55. Morceau F, Chateauvieux S, Gaigneaux A, Dicato M, Diederich M. Long and Short Non-Coding RNAs as Regulators of Hematopoietic Differentiation. International Journal of Molecular Sciences. 2013;14:14744-70
56. Moyano M, Stefani G. piRNA involvement in genome stability and human cancer. Journal of Hematology & Oncology. 2015:8
57. Huang G, Hu H, Xue X, Shen S, Gao E, Guo G. et al. Altered expression of piRNAs and their relation with clinicopathologic features of breast cancer. Clinical and Translational Oncology. 2013;15:563-8
58. Zhang H, Ren Y, Xu H, Pang D, Duan C, Liu C. The expression of stem cell protein Piwil2 and piR-932 in breast cancer. Surgical Oncology. 2013;22:217-23
59. Cheng J, Deng H, Xiao B, Zhou H, Zhou F, Shen Z. et al. piR-823, a novel non-coding small RNA, demonstrates in vitro and in vivo tumor suppressive activity in human gastric cancer cells. Cancer Letters. 2012;315:12-7
60. Cui L, Lou Y, Zhang X, Zhou H, Deng H, Song H. et al. Detection of circulating tumor cells in peripheral blood from patients with gastric cancer using piRNAs as markers. Clinical Biochemistry. 2011;44:1050-7
61. Busch J, Ralla B, Jung M, Wotschofsky Z, Trujillo-Arribas E, Schwabe P. et al. Piwi-interacting RNAs as novel prognostic markers in clear cell renal cell carcinomas. Journal of Experimental & Clinical Cancer Research: CR. 2015:34
62. Lee JH, Schütte D, Wulf G, Füzesi L, Radzun H-J, Schweyer S. et al. Stem-cell protein Piwil2 is widely expressed in tumors and inhibits apoptosis through activation of Stat3/Bcl-XL pathway. Human Molecular Genetics. 2006;15:201-11
63. Müller S, Raulefs S, Bruns P, Afonso-Grunz F, Plötner A, Thermann R. et al. Next-generation sequencing reveals novel differentially regulated mRNAs, lncRNAs, miRNAs, sdRNAs and a piRNA in pancreatic cancer. Mol Cancer. 2015:14
64. Mei Y, Wang Y, Kumari P, Shetty AC, Clark D, Gable T. et al. A piRNA-like small RNA interacts with and modulates p-ERM proteins in human somatic cells. Nature Communications. 2015:6
65. Ng KW, Anderson C, Marshall EA, Minatel BC, Enfield KSS, Saprunoff HL. et al. Piwi-interacting RNAs in cancer: emerging functions and clinical utility. Molecular Cancer. 2016;15:1-13
66. Guttman M, Amit I, Garber M, French C, Lin MF, Feldser D. et al. Chromatin signature reveals over a thousand highly conserved large non-coding RNAs in mammals. Nature. 2009;458:223-7
67. Huarte M, Guttman M, Feldser D, Garber M, Koziol MJ, Kenzelmann-Broz D. et al. A large intergenic non-coding RNA induced by p53 mediates global gene repression in the p53 response. Cell. 2010;142:409-19
68. Huarte M. The emerging role of lncRNAs in cancer. Nat Med. 2015;21:1253-61
69. Zheng GXY, Do BT, Webster DE, Khavari PA, Chang HY. Dicer-microRNA-Myc circuit promotes transcription of hundreds of long noncoding RNAs. Nat Struct Mol Biol. 2014;21:585-90
70. Inoue T, Maeno A, Talbot C, Zeng Y, Yeater DB, Leman ES. et al. Purine-rich element binding protein (PUR) α induces endoplasmic reticulum stress response, and cell differentiation pathways in prostate cancer cells. The Prostate. 2009;69:861-73
71. O'Reilly D, Dienstbier M, Cowley SA, Vazquez P, Drożdż M, Taylor S. et al. Differentially expressed, variant U1 snRNAs regulate gene expression in human cells. Genome research. 2013;23:281-91
72. Köhler J, Schuler M, Gauler TC, Nöpel-Dünnebacke S, Ahrens M, Hoffmann A-C. et al. Circulating U2 small nuclear RNA fragments as a diagnostic and prognostic biomarker in lung cancer patients. Journal of Cancer Research and Clinical Oncology. 2016;142:795-805
73. Chen L, Han L, Wei J, Zhang K, Shi Z, Duan R. et al. SNORD76, a box C/D snoRNA, acts as a tumor suppressor in glioblastoma. Scientific reports. 2015:5
74. Zhang M, Wang W, Li T, Yu X, Zhu Y, Ding F. et al. Long noncoding RNA SNHG1 predicts a poor prognosis and promotes hepatocellular carcinoma tumorigenesis. Biomedicine & Pharmacotherapy. 2016;80:73-9
75. Zhao L, Guo H, Zhou B, Feng J, Li Y, Han T. et al. Long non-coding RNA SNHG5 suppresses gastric cancer progression by trapping MTA2 in the cytosol. Oncogene. 2016
76. Xu G, Yang F, Ding C-L, Zhao L-J, Ren H, Zhao P. et al. Small nucleolar RNA 113-1 suppresses tumorigenesis in hepatocellular carcinoma. Molecular Cancer. 2014;13:216
77. Liuksiala T, Teittinen KJ, Granberg K, Heinaniemi M, Annala M, Maki M. et al. Overexpression of SNORD114-3 marks acute promyelocytic leukemia. Leukemia. 2014;28:233-6
78. Bieth E, Eddiry S, Gaston V, Lorenzini F, Buffet A, Conte Auriol F. et al. Highly restricted deletion of the SNORD116 region is implicated in Prader-Willi Syndrome. Eur J Hum Genet. 2015;23:252-5
79. Cruvinel E, Budinetz T, Germain N, Chamberlain S, Lalande M, Martins-Taylor K. Reactivation of maternal SNORD116 cluster via SETDB1 knockdown in Prader-Willi syndrome iPSCs. Human Molecular Genetics. 2014;23:4674-85
80. Falaleeva M, Surface J, Shen M, de la Grange P, Stamm S. SNORD116 and SNORD115 change expression of multiple genes and modify each other's activity. Gene. 2015;572:266-73
81. Lestrade L, Weber MJ. snoRNA-LBME-db, a comprehensive database of human H/ACA and C/D box snoRNAs. Nucleic Acids Research. 2006;34:D158-D62
82. Galardi S, Fatica A, Bachi A, Scaloni A, Presutti C, Bozzoni I. Purified Box C/D snoRNPs Are Able To Reproduce Site-Specific 2′-O-Methylation of Target RNA In Vitro. Molecular and cellular biology. 2002;22:6663-8
83. Schultz J, Wolf M. ITS2 sequence-structure analysis in phylogenetics: A how-to manual for molecular systematics. Molecular Phylogenetics and Evolution. 2009;52:520-3
84. Son DJ, Kumar S, Takabe W, Woo Kim C, Ni C-W, Alberts-Grill N. et al. The atypical mechanosensitive microRNA-712 derived from pre-ribosomal RNA induces endothelial inflammation and atherosclerosis. Nature Communications. 2013:4
85. Christov CP, Gardiner TJ, Szüts D, Krude T. Functional Requirement of Noncoding Y RNAs for Human Chromosomal DNA Replication. Molecular and cellular biology. 2006;26:6993-7004
86. Holbrook JA, Neu-Yilik G, Hentze MW, Kulozik AE. Nonsense-mediated decay approaches the clinic. Nature genetics. 2004;36:801-8
Author contact
![]() Corresponding author: Srinivas V Koduru, PhD. Pennsylvania State University, College of Medicine, Department of Surgery, Division of Plastic Surgery, 500 University Drive, Hershey, PA 17033-0850. Phone: 717-531-4332; Fax: 717-531-4339; Email: skodurupsu.edu.
Corresponding author: Srinivas V Koduru, PhD. Pennsylvania State University, College of Medicine, Department of Surgery, Division of Plastic Surgery, 500 University Drive, Hershey, PA 17033-0850. Phone: 717-531-4332; Fax: 717-531-4339; Email: skodurupsu.edu.

 Global reach, higher impact