Impact Factor ISSN: 1837-9664

 Global reach, higher impact
J Cancer 2017; 8(4):606-616. doi:10.7150/jca.17356 This issue Cite
Research Paper
Immunization-based scores as independent prognostic predictors in soft tissue sarcoma patients
Shan-Shan Jiang1, 2*, Long Jiang1, 3*, De-Sheng Weng1, Yuan-fang Li1, Qiu-Zhong Pan1, Jing-Jing Zhao1, Yan Tang1, Zhi-Wei Zhou1, Jian-Chuan Xia1 ![]()
1. Sun Yat-sen University Cancer Center; State Key Laboratory of Oncology in South China; Collaborative Innovation Center for Cancer Medicine, Guangzhou, 510060, China.
2. Department of Medical oncology, the First Affiliated Hospital, College of Medicine, Zhejiang University, Qingchun Road 79#, Hangzhou, 310003, China.
3. Department of Respiratory and Critical Care Medicine, Second Affiliated Hospital, Zhejiang University School of Medicine, Hangzhou, 310003, China.
*Shan-Shan Jiang and Long Jiang contributed equally to this work.
Received 2016-8-26; Accepted 2016-11-27; Published 2017-2-25
Abstract
Background: The purpose of this study was to examine and compare the prognostic value of different immunization-based scoring systems in patients with soft tissue sarcoma (STS).
Methods: We conducted a retrospective study evaluating a cohort of 165 patients diagnosed with STS between July 2007 and July 2014. The relative Glasgow prognostic score (GPS) of these patients was calculated using 3 different systems: the traditional GPS system (tGPS), the modified GPS system 1 (m1GPS), and the modified GPS system 2 (m2GPS). Then, we evaluated the relationships between each GPS system and clinicopathological characteristics. The mean follow-up for survivors in the cohort was 73.7 months as of March 2015.
Results: The most favorable overall survival (OS) rate was associated with the score 0 groups, and the poorest progression-free survival (PFS) rate was associated with the score 2 groups, regardless of which system was used to calculate the score. Specifically, the m1GPS provided the greatest accuracy in predicting OS and PFS. Moreover, the same effect was observed in a separate analysis restricted to patients with metastases. Remarkably, in patients with a score of 2 as measured by all 3 systems, local treatment resulted in a poorer prognosis compared to patients with a score of 2 who did not receive local treatment.
Conclusion: The GPS is a valuable prognostic marker and has the capability to predict the appropriate treatment strategy for STS patients with metastases. The modified GPS systems demonstrated superior prognostic and predictive value compared with the traditional GPS system.
Keywords: Immunization, Prognosis, Predictor, Soft tissue sarcoma, Retrospective cohort study.
Introduction
With the continued success of immunotherapies for various cancers in recent years [1], it is becoming widely accepted that cancer progression is not solely dependent on local tumor characteristics but also on the host inflammatory response [2]. Indeed, complex interactions between cancer cells and the host inflammatory response have been validated at the molecular and clinical level [3]. Multiple lines of evidence indicate that the systemic inflammation is linked with disease progression in cancer patients and serves as an independent prognostic indicator [4]. Moreover, nutritional imbalances resulting from decreased food intake in cancer patients further promote the systemic inflammatory response, thereby further contributing to poor outcomes [5].
To improve and simplify the prognostic evaluation of cancer patients, considerable efforts have focused on identifying novel immunological markers [6]. Elevated systemic C-reactive protein (CRP) is commonly used as a sensitive measure of the systemic inflammatory response and a negative prognostic indicator in cancer patients, either independently or in conjunction with other prognostic algorithms [7]. Furthermore, hypoalbuminemia, an indicator of malnutrition, is also associated with a negative prognosis in some malignancies [8]. Studies have shown that CRP and albumin are independent prognostic factors in cancer patients and hypoalbuminemia and elevated CRP are associated with a poor cancer prognosis [9]. Therefore, the significance of the combination of these parameters, which together represent both the systemic inflammatory response and nutritional imbalance, is becoming increasingly clear [10].
The prognostic role of the systemic inflammatory response is well accepted and has been validated with the establishment of an immunization-based prognostic system, referred to as the Glasgow prognostic score (GPS)[11]. The GPS is assayed by simply examining both serum CRP and albumin levels, which measure of the systemic inflammatory response and nutritional imbalance, respectively [12]. Research efforts aimed at improving the prognostic value of the GPS system have led to the development of modified versions of the GPS system that use either adjusted cut-off values for both serum CRP and albumin levels [13] or that omit hypoalbuminemia as an independent negative prognostic indicator [14]. These 2 modified GPS (mGPS) systems have demonstrated greater prognostic value in predicting the outcome of cancer patients [15].
Although recent reports have shown that the GPS score was an accurate indicator of cancer-specific survival in many cancers of epithelial origin, including colorectal [16], renal [17] and non-small cell lung cancers [18], the prognostic role of GPS in patients with soft tissue sarcoma (STS) remains unclear. STS accounts for nearly 1% of newly diagnosed malignancies annually [19], and improving the low survival rate of STS remains an enormous challenge [20]. Despite advances in chemotherapy, radiation therapy and surgery, the 3-year survival rate of patients with metastatic STS is 20-45% [21]. Considerable efforts aimed at distinguishing which high-risk STS patients are appropriate candidates for more aggressive procedures and determining the appropriate treatment strategy for individual patients is still needed.
The purpose of this study was to examine and compare prognostic value of different GPS systems in patients with STS and to analyze the predictive value of the GPS score in determining which patients with metastatic STS are more likely to benefit from more aggressive therapy. To this end, we conducted a retrospective study in STS patients.
Materials and methods
Patients
The study was conducted according to the principles expressed in the Declaration of Helsinki. The study protocol was approved by the institutional review boards of Sun Yat-Sen University Cancer Center. Written informed consent was obtained from each patient at the time of sample acquisition and included consent for tissue analysis and for the potential use of information for medical research.
The charts of 165 consecutive patients who suffered from STS between July 2007 and July 2014 were reviewed. Follow-up data, including morbidity, mortality and survival, were obtained from clinical charts or by contacting the patient on an outpatient basis or by telephone. The other patients with STS were excluded from the study due either to conditions known to evoke a systemic inflammatory response or to incomplete clinical or pathological data, such as a lack of the pathological or laboratory records with CRP and albumin levels. Conditions known to evoke a systemic inflammatory response were defined as (i) a prior clinical history of other malignancies or neoadjuvant chemotherapy or radiotherapy, (ii) clinical evidence of active pretreatment infection or (iii) chronic active inflammatory diseases such as rheumatoid arthritis. Characteristics of the patients and tumors, including age, sex (male vs. female), primary tumor size, and tumor depth (superficial: tumor does not involve the superficial fascia vs. deep), were collected at the first diagnosis of STS and at the onset of metastases. The WHO classification system was used as the basis for determining the pathological diagnosis and tumor grade. All data were reviewed and confirmed by 2 independent pathologists.
Local treatment was defined as 1 or more procedures of surgery, radiotherapy or radiofrequency ablation. The specific treatment regimens varied and included conventional fractionated radiotherapy, stereotactic body radiation therapy (SBRT) with different radiotherapy doses and radiofrequency ablation procedures using various parameters. The response to treatment was classified according to the RECIST criteria (version 1.1) [22].
Progression-free survival (PFS) was calculated from the first treatment to the time that disease progression was recorded, and overall survival (OS) was calculated from the first diagnosis to the time of death reported or the date of the last follow-up. For the 97 patients with metastases, PFS1 was defined from the date of metastases treatment to the time that disease progression was recorded, and OS1 was defined as the time between the date of the metastasis diagnosis and the time of death reported or the date of the last follow-up.
Inflammation-Based Prognostic Scores and Other Variables
To evaluate GPS, laboratory measurements that included CRP and albumin levels were immediately evaluated from blood samples collected within 24 hours prior to first treatment (all patients) and prior to metastasis treatment (metastatic patients) according to the routine clinical practices of SYSUCC. Serum CRP and albumin levels were measured using the Hitachi Auto Analyzer (Hitachi 7600, Hitachi, Tokyo, Japan). The inter- and intra-assay variability of CRP and albumin concentrations were less than 5%, as established by routine quality control procedures.
The relative GPS was constructed as previously reported [23]. In the traditional GPS system (tGPS), patients with both an elevated CRP level (>10 mg/L) and hypoalbuminemia (<35 g/L) are classified into the tGPS2 group. Patients with neither of these abnormalities are classified into tGPS0 group, and patients with only 1 of these 2 biochemical abnormalities are classified into the tGPS1 group. Accordingly, in the modified GPS system 1 (m1GPS), patients with hypoalbuminemia alone are assigned to the m1GPS0 group, while all other aspects of the m1GPS score are the same as with the tGPS system. In the modified GPS system 2 (m2GPS), the cut-off values were changed to 5 mg/L for elevated CRP level and 38 g/L for hypoalbuminemia. All other aspects of the m2GPS system are the same as with the tGPS system (Table 1). We then evaluated the relationships between each GPS system and the clinicopathological characteristics of the patient cohort, including prognosis and treatment procedures for metastases.
Inflammation-Based Prognostic Scores.
| Scoring system | Score |
|---|---|
| tGPS | |
| CRP(≤10mg/L) and hypoalbuminemia(≥35g/L) | 0 |
| CRP(≤10mg/L) and hypoalbuminemia(<35g/L) | 1 |
| CRP(> 10mg/L) and hypoalbuminemia(≥35g/L) | 1 |
| CRP (> 10mg/L) and hypoalbuminemia (<35g/L) | 2 |
| m1GPS | |
| CRP(≤10mg/L)and hypoalbuminemia(≥35g/L) | 0 |
| CRP(> 10mg/L) and hypoalbuminemia(≥35g/L) | 0 |
| CRP(≤10mg/L)and hypoalbuminemia(<35g/L) | 1 |
| CRP (> 10mg/L) and hypoalbuminemia (<35g/L) | 2 |
| m2GPS | |
| CRP(≤5mg/L) and hypoalbuminemia(≥38g/L) | 0 |
| CRP(≤5mg/L)and hypoalbuminemia(<38g/L) | 1 |
| CRP(> 5mg/L) and hypoalbuminemia(≥38g/L) | 1 |
| CRP (>5mg/L) and hypoalbuminemia (<38g/L) | 2 |
Statistical Analysis
The data are presented as the number (%) or median (range) unless otherwise stated. The Pearson χ2 test and Fisher's exact test were used to analyze categorical data, and an independent sample t-test or the Mann-Whitney U test was used to analyze numerical data. Survival curves were calculated using the Kaplan-Meier method and compared by the log-rank test. Univariate and multivariate survival analyses were performed by Cox proportional hazards regression model. All models for survival analyses were adjusted for age at diagnosis. P < 0.05 was considered significant in all statistical analyses. Data analysis was performed using the SPSS 18.0 software (PASW Statistics 18) for Windows (SPSS Inc., Chicago, IL).
Result
A total of 165 STS patients were eligible for analysis. Among 165 patients, the mean age was 47.0 years (range: 5-80, median 49.0); 72 patients were male (43.6%) and 93 were female (56.4%); the mean primary tumor size was 6.2 cm (range: 0.3-17.4, median 5.5); and 36 patients (21.8%) had superficial tumors while 129 patients (78.2%) had deep tumors. The tumor pathological subtypes included fibrohistiocytic tumors in 41 patients (24.8%), undifferentiated sarcomas in 93 (56.4%), smooth muscle tumors in 10 (6.1%), fibroblastic/m yofibroblastic tumors in 1 (0.6%), skeletal muscle tumors in 17 (10.3%) and adipocytic tumors in 3 patients (1.8%). In addition, the mean follow-up periods of March 2015 was 73.7 months (range: 17.2-533.8, median 62.4).
Of the 165 patients, 97 presented with metastases either at the time of the first diagnosis or after the first treatment. Clinicopathological correlation of with or without local treatment in patients with metastatic STS is listed in Table 2.
Clinicopathological correlation of with or without local treatment in patients with metastatic soft tissue sarcoma (data shifted, need to reformat).
| Characteristic | All (n=97) | With Local Treatment (n=49) | Without Local Treatment (n=48) | P | |
|---|---|---|---|---|---|
| Age, yrs | 50.0† (range: 5-79) | 50.0† (range: 5-72) | 50.5† (range: 16-79) | 0.869 | |
| Sex (%) | 0.312 | ||||
| Male | 48 | 49.5% | 27 | 21 | |
| Female | 49 | 50.5% | 22 | 27 | |
| Primary Tumor Size (cm) | 5.5† (range: 0.3-17.4) | 5.5† (range: 0.3-17.4) | 5.5† (range: 1.0-15.2) | 0.761 | |
| Primary Tumor Depth (%) | 0.803 | ||||
| Superficial | 19 | 19.6% | 9 | 10 | |
| Deep | 78 | 80.4% | 40 | 38 | |
| Pathological Subtypes (%) | 0.952 | ||||
| So-called Fibrohistiocytic Tumors | 26 | 26.8% | 14 | 12 | |
| Undifferentiated Sarcomas | 52 | 53.6% | 25 | 27 | |
| Smooth Muscle Tumors | 4 | 4.1% | 2 | 2 | |
| Fibroblastic/Myofibroblastic Tumors | 1 | 1.0% | 1 | 0 | |
| Skeletal Muscle Tumors | 13 | 13.4% | 6 | 7 | |
| Adipocytictumors | 1 | 1.0% | 1 | 0 | |
| Pathological Grade (%) | 0.687 | ||||
| 1 | 12 | 12.4% | 7 | 5 | |
| 2 | 5 | 5.2% | 2 | 3 | |
| 3 | 80 | 82.4% | 40 | 40 | |
| Follow-up (months) | 0.179 | ||||
| Median | 66.7 | 75.6 | 62.1 | ||
| Range | 19.4-533.8 | 19.4-533.8 | 19.4-420.4 | ||
| Mean | 83.6 | 104.4 | 62.5 |
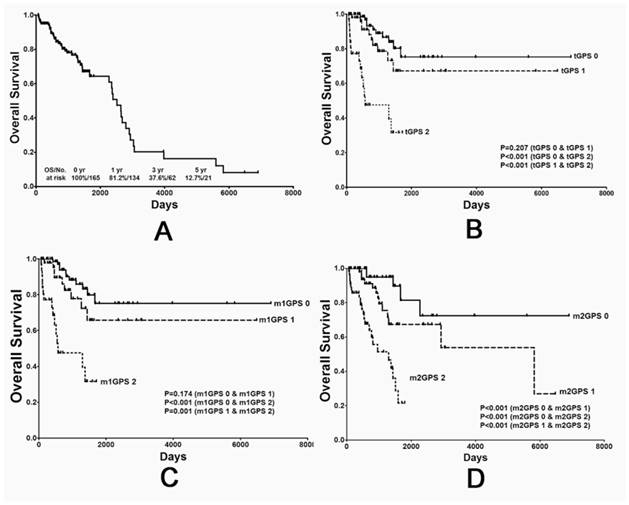
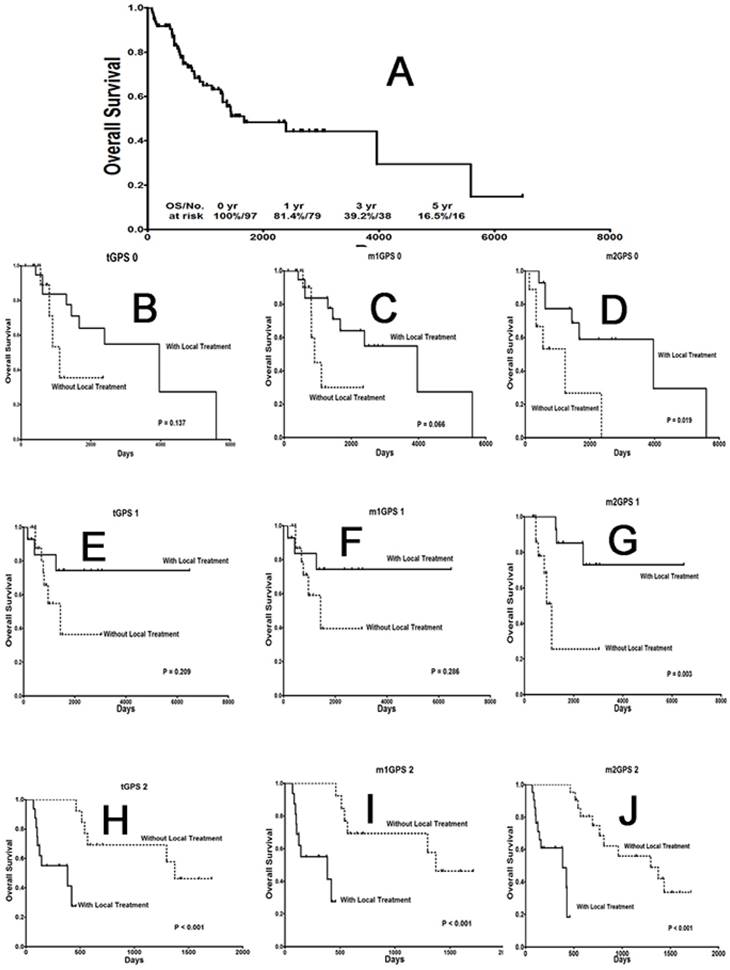
The median OS of the entire cohort was 2,581 days, and the overall 1-, 3- and 5-year OS rates were 81.2%, 37.6% and 12.7%, respectively (Fig. 1A). In addition, the median OS1 rate for the 97 patients with metastases was 1,667 days, and the overall 1-, 3- and 5-year OS1 rates were 81.4%, 39.2% and 16.5%, respectively (Fig. 3A).
The value of different GPS systems in predicting overall survival (OS) in STS patients. (A) OS curve for all 165 patients, and (B) OS curves stratified by traditional GPS, (C) modified GPS system 1 and (D) modified GPS system 2 scores. GPS: Glasgow prognostic score; STS: soft tissue sarcoma.
The effect of local treatment on STS patients with different GPS scores on OS. (A) OS curve for metastatic cancer patients. (B), (E), (H) OS curves for patients with a traditional GPS system score of 0, 1 or 2; (C), (F), (I) a modified GPS system 1 score of 0, 1 or 2; and (D), (G), (J) a modified GPS system 2 score of 0, 1 or 2. GPS: Glasgow prognostic score; STS: soft tissue sarcoma.
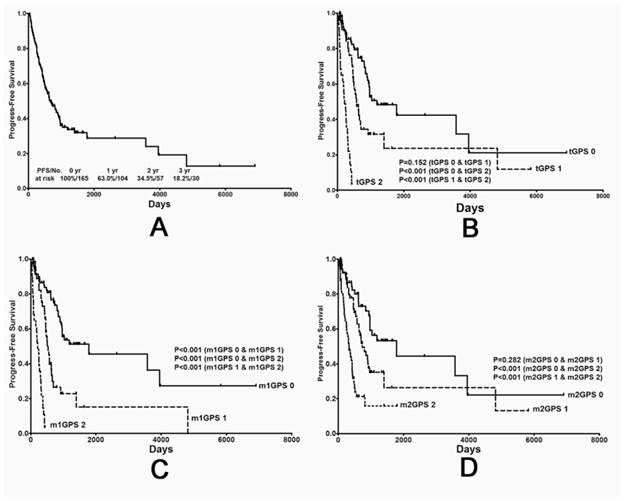
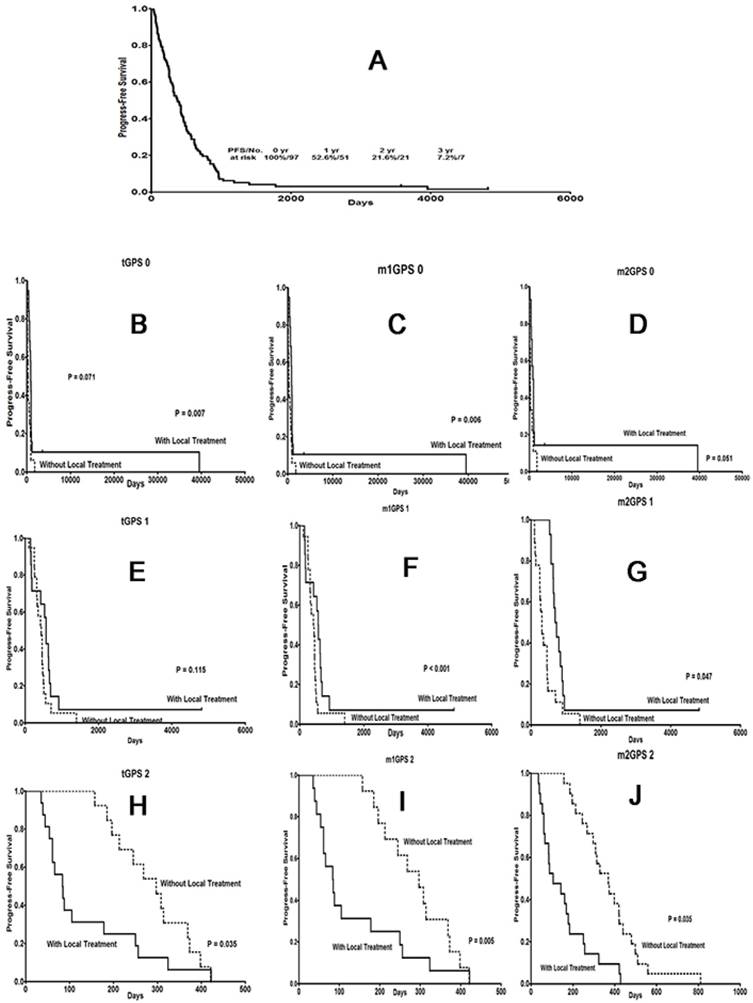
The median PFS of the entire cohort was 662 days, and the overall 1-, 2- and 3-year PFS rates were 63.0%, 34.5% and 18.2%, respectively (Fig. 2A). In addition, the median PFS1 rate for the 97 patients with metastases was 373 days, and the overall 1-, 2- and 3-year PFS1 rates were 52.6%, 21.6% and 7.2%, respectively (Fig. 4A).
The value of different GPS systems in predicting progression-free survival (PFS) in STS patients. (A) PFS curve for all 165 patients and (B) the PFS curves stratified by traditional GPS (C) modified GPS system 1 and (D) modified GPS system 2 scores. GPS: Glasgow prognostic score; STS: soft tissue sarcoma.
Effect of local treatment on STS patients with different GPS scores with respect to PFS. (A) PFS curve for metastatic patients. (B), (E), (H) PFS curves for patients with a traditional GPS system score of 0, 1 or 2; (C), (F), (I) a modified GPS system 1 score of 0, 1 or 2; and (D), (G), (J) a modified GPS system 2 score of 0, 1 or 2. GPS: Glasgow prognostic score; STS: soft tissue sarcoma.
Consistent with previously observed trends, patients in the score 0 group were associated with the most favorable OS and PFS rates, while patients in the score 2 group were associated with the poorest rates. These results were consistent between the tGPS (Fig. 1B and 2B), m1GPS (Fig. 1C and 2C) and m2GPS systems (Fig. 1D and 2D). The results of the univariate analysis are shown in Table 3 and 5. The variables (tGPS m1GPS and m2GPS, age, pathological grade, Primary Tumor Depth) were examined by multivariate analysis. Multivariate analysis revealed that the m1GPS [hazard ratio (HR) 9.932; p=0.024] was independently associated with PFS, and the m2GPS [hazard ratio (HR) 2.228; p=0.044] was independently associated with OS1 (Table 4 and 6).
Univariate analysis of prognostic factors for OS† and PFS† in patients with soft tissue sarcoma.
| Variables | OS† | PFS† | ||||
|---|---|---|---|---|---|---|
| HR | 95%CI | P value | HR | 95%CI | P value | |
| Age | 2.242 | 1.115-4.508 | 0.023* | 1.563 | 1.046-2.338 | 0.029* |
| Sex | 1.835 | 0.942-3.575 | 0.074 | 1.449 | 0.968-2.167 | 0.071 |
| primary tumor size | 1.239 | 0.629-2.441 | 0.536 | 1.005 | 1-1.011 | 0.069 |
| pathological subtypes | 0.984 | 0.739-1.310 | 0.912 | 1.040 | 0.88-1.228 | 0.647 |
| pathological grade | 1.186 | 0.547-2.571 | 0.666 | 0.655 | 0.468-0.917 | 0.014* |
| Primary Tumor Depth | 3.557 | 1.088-11.626 | 0.036* | 1.327 | 0.801-2.196 | 0.272 |
| tGPS | 2.856 | 1.842-4.426 | <0.001* | 3.367 | 2.449-4.630 | < 0.001 |
| m1GPS | 2.797 | 1.836-4.263 | <0.001* | 3.831 | 2.796-5.250 | < 0.001 |
| m2GPS | 3.022 | 1.845-4.951 | <0.001* | 2.167 | 1.645-2.855 | < 0.001 |
* P<0.05
Univariate analysis of prognostic factors for OS1 and PFS1 in patients with metastatic soft tissue sarcoma.
| Variables | OS† | PFS† | ||||
|---|---|---|---|---|---|---|
| HR | 95%CI | P value | HR | 95%CI | P value | |
| Age | 1.136 | 1.064-4.287 | 0.033* | 1.401 | 0.925-2.121 | 0.111 |
| Sex | 1.437 | 0.758-2.724 | 0.266 | 1.196 | 0.797-1.794 | 0.387 |
| primary tumor size | 1.051 | 0.541-2.041 | 0.884 | 0.910 | 0.597-1.387 | 0.662 |
| pathological subtypes | 0.947 | 0.714-1.256 | 0.707 | 1.037 | 0.878-1.226 | 0.667 |
| pathological grade | 1.671 | 0.743-3.757 | 0.214 | 0.819 | 0.577-1.163 | 0.265 |
| Primary Tumor Depth | 3.564 | 1.091-11.64 | 0.035* | 1.318 | 0.795-2.185 | 0.285 |
| tGPS | 1.816 | 1.185-2.784 | 0.006 | 2.579 | 1.859-3.576 | < 0.001 |
| m1GPS | 1.748 | 1.146-2.668 | 0.010 | 2.584 | 1.869-3.572 | < 0.001 |
| m2GPS | 2.367 | 1.445-3.876 | 0.001 | 2.364 | 1.708-3.270 | < 0.001 |
* P<0.05
Multivariable analysis of prognostic factors for OS† and PFS† in patients with soft tissue sarcoma.
| Variables | OS† | PFS† | ||||
|---|---|---|---|---|---|---|
| HR | 95%CI | P value | HR | 95%CI | P value | |
| Age | 1.801 | 0.874-3.711 | 0.111 | 1.185 | 0.731-1.919 | 0.491 |
| Sex | ||||||
| primary tumor size | ||||||
| pathological subtypes | ||||||
| pathological grade | 0.844 | 0.593-1.203 | 0.349 | |||
| Primary Tumor Depth | 2.825 | 0.823-9.692 | 0.099 | |||
| tGPS | 0.941 | 0.117-7.585 | 0.954 | 0.312 | 0.047-2.664 | 0.353 |
| m1GPS | 1.660 | 0.22-12.534 | 0.623 | 9.932 | 1.357-72.716 | 0.024* |
| m2GPS | 1.920 | 0.904-4.080 | 0.09 | 0.907 | 0.537-1.531 | 0.715 |
* P<0.05
Multivariable analyses of prognostic factors for OS1 and PFS1 in patients with metastatic soft tissue sarcoma.
| Variables | OS† | PFS† | ||||
|---|---|---|---|---|---|---|
| HR | 95%CI | P value | HR | 95%CI | P value | |
| Age | 1.731 | 0.815-3.674 | 0.153 | |||
| Sex | ||||||
| primary tumor size | ||||||
| pathological subtypes | ||||||
| pathological grade | ||||||
| Primary Tumor Depth | 2.903 | 0.878-9.604 | 0.081 | |||
| tGPS | 4.202 | 0.488-36.219 | 0.191 | 0.978 | 0.131-7.287 | 0.983 |
| m1GPS | 0.221 | 0.028-1.777 | 0.156 | 1.922 | 0.263-14.021 | 0.519 |
| m2GPS | 2.228 | 1.023-4.852 | 0.044* | 1.551 | 0.968-2.484 | 0.068 |
* P<0.05
Meanwhile, the m1GPS system was associated with the greatest accuracy in predicting OS and PFS. Receiver operating characteristic curves (ROC) was performed for the survival status of OS and PFS examinations. The discrimination ability of each inflammation-based prognostic score was compared by Area under the ROC curve (AUC)(Table 7; Fig.5A and 5B). The m1GPS had higher AUC values at PFS (AUC=0.779, P<0.001) and OS (AUC=0.659, P<0.001) compared with the tGPS (PFS: AUC=0.757, P<0.001,OS: AUC=0.644, P=0.001), m2GPS (PFS: AUC=0.717, P<0.001,OS: AUC=0.645, P< 0.0 01).
Comparison of the areas under the curves for the three inflammation-based prognostic scores.
| Period | AUC | 95 % CI | P value |
|---|---|---|---|
| OS | |||
| tGPS | 0.644 | 0.560-0.728 | 0.001 |
| m1GPS | 0.659 | 0.576-0.742 | <0.001 |
| m2GPS | 0.645 | 0.560-0.730 | 0.001 |
| PFS | |||
| tGPS | 0.757 | 0.683-0.831 | <0.001 |
| m1GPS | 0.779 | 0.707-0.851 | <0.001 |
| m2GPS | 0.717 | 0.638-0.797 | <0.001 |
| OS1 | |||
| tGPS | 0.663 | 0.554-0.772 | 0.006 |
| m1GPS | 0.669 | 0.560-0.777 | 0.004 |
| m2GPS | 0.657 | 0.547-0.767 | 0.008 |
| PFS1 | |||
| tGPS | 0.732 | 0.630-0.834 | <0.001 |
| m1GPS | 0.737 | 0.636-0.838 | <0.001 |
| m2GPS | 0.696 | 0.590-0.802 | 0.001 |
Comparison of the areas under the receiver operating curves for outcome prediction among the four inflammation-based prognostic scores. (A)OS, (B)PFS, (3)OS1, (4)PFS1.
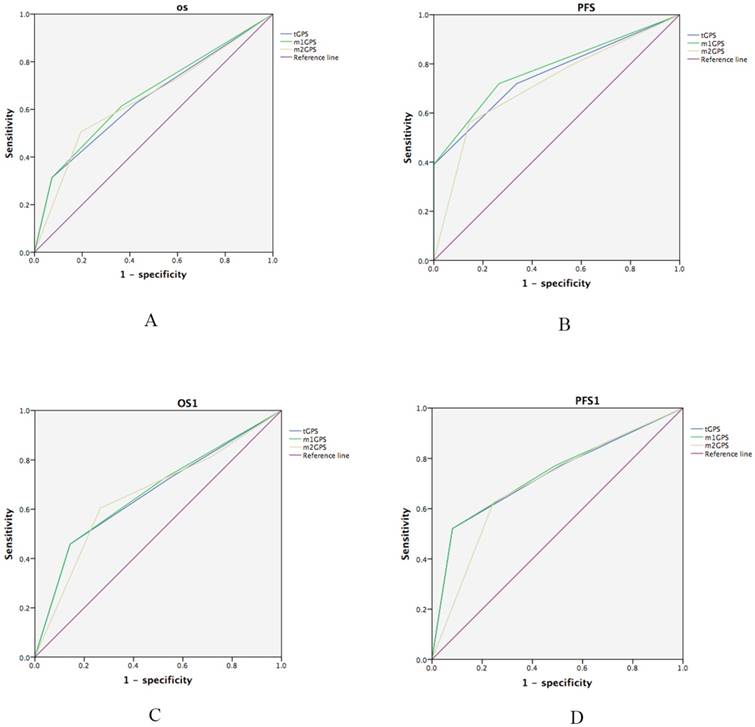
Consistent with these results, the superiority of m1GPS scores to predict OS and PFS were also observed in a separate analysis restricted to patients suffering from metastasis. The most significant associations observed were between OS1, PFS1 and the m1GPS system (Table 7, Fig.5C and 5D). The m1GPS had higher AUC values at PFS1 (AUC=0.737, P<0.001) and OS1 (AUC=0.669, P=0.004) compared with the tGPS (PFS: AUC=0.732, P<0.001,OS1: AUC=0.663,P=0.006), m2GPS (PFS: AUC=0.696, P=0.001,OS1: AUC= 0.657,P=0.008).
Interestingly and remarkably, local treatment provided OS1 (Fig. 3B-G) and PFS1 (Fig. 4B-G) benefits only to patients with a score of 0, regardless of the scoring system used. For patients with a score of 2 according to any of the 3 systems, local treatment resulted in poorer OS1 (Fig. 3H-J) and PFS1 rates (Fig. 4H-J).
Discussion
The present retrospective cohort study, which utilized clinical data, evaluated and compared the prognostic capability of 3 GPS systems in patients with STS and analyzed the value of these systems in determining the appropriate treatment strategy for patients with metastatic STS.
Recent breakthroughs in immunotherapy have led to a major focus on exploring the relationship between the immune response and cancer [24]. Precise and concise markers for assaying the immune response to cancer are proving to be critical factors in cancer research [25]. Circulating CRP levels, mediated by interleukin (IL)-6, are produced locally by tumor cells in response to proinflammatory cytokines [26]. Studies have indisputably reported that elevated CRP is a sensitive, specific, and precise prognostic factor associated with poor survival in various types of cancer [27]. Decreased levels of albumin, a factor associated with the systemic immune response, have also been observed in various cancers and function as a negative prognostic indicator in cancer patients [5]. Consequently, the GPS system was established to evaluate the relationship between elevated CRP and decreased albumin. The GPS system is recommended in routine clinical as an objective and rational approach based on its simple, well-standardized and widely available assays and due to its well-validated prognostic value in cancer patients [9].
Current investigations indicate that the GPS immunological-based prognostic score should be viewed as a comprehensive measure of cancer-associated systemic immunity and malnutrition [28]. In clinical practice, the GPS has been used to predict the prognosis of patients with multiple types of neoplasms [29]. As GPS is a simple, minimally invasively and low cost assay, it has the potential to serve as a routine, cost-effective and easily accessible tool for predicting outcomes in cancer patients [5]. Although GPS has been utilized as a prognostic indicator in patients with various neoplasms, investigators are still paying considerable attention to improving its prognostic value. The cutoff values defining abnormal serum albumin and CRP levels were firstly set at 35 g/L and 10 mg/L, respectively [23]. Other studies subsequently indicated that modified cutoff values of 38 g/L for hypoalbuminemia and 10 mg/L for elevated CRP provided greater accuracy in predicting prognosis [13]. Other studies recommended an additional modification of the GPS score in which patients with hypoalbuminemia but normal CRP are allocated to the GPS 0 group [14]. In previous report, Nakamura et [30] have reported that the high-sensitivity modified Glasgow prognostic score (Hs-mGPS) could predict the disease-specific survival and oncological outcome in adult patients with non-metastatic soft-tissue sarcoma before treatment. Patients with a score of 2 before treatment had a poorer disease-specific survival and event-free survival than those with a score of 0. Different from our GPS systems, they indicated that modified cutoff values of 35 g/L for hypoalbuminemia and 3mg/L for elevated CRP in predicting prognosis. To systematically evaluate the prognostic value of these 3 GPS systems, we analyzed data from patients with soft tissue sarcoma using all 3 systems. Both the Kaplan-Meier method and Cox proportional hazards regression demonstrated that incorporating the modified cut-off values of hypoalbuminemia and elevated CRP level provided superior predictive power with respect to OS, and that omitting hypoalbuminemia from the risk score provided superior predictive power with respect to PFS.
With respect to metastases management, a high GPS was significantly associated with aggressive disease and a poor prognosis [27]. Moreover, the GPS reflected the physical status of cancer patients with respect to the systemic immune response and nutritional imbalances. We also found that although patients with metastasis might benefit from local treatment, this does not appear to be the case with elderly patients (unpublished). Similar to elderly patients, patients with a severe systemic immune response and malnutrition are less likely to benefit from local treatment [14]. After validating the prognostic value of the GPS systems in the patient cohort as a whole, we evaluated the strength of the 3 systems in identifying the appropriate treatment strategy for patients with metastasis. This analysis demonstrated that patients with a GPS of 2 according to any of the 3 systems were not likely to benefit from local treatment. In addition, the modified GPS systems provided greater accuracy in predicting prognosis in the cohort of patients with metastasis.
Despite the fact that institutes around the world have reported the prognostic value of GPS in predicting outcomes in various cancers of epithelial origin, there have been few reports describing the value of GPS in STS. As highlighted in this study, the GPS might represent a novel and simple biomarker in patients with STS and potentially lead to improved clinical outcomes. For example, patients with a GPS of 2 exhibited very poor survival rates and did not benefit from local treatment after the development of metastases. These findings indicate that chemotherapy might provide greater clinical benefits in patients with a GPS of 2. In addition, a higher GPS indicates a more intense immune response and/or more severe malnutrition. In this context, immunotherapy or nutritional support might improve outcomes. Moreover, the m2GPS, which employs the modified cut-off values of enhanced serum CRP and hypoalbuminemia, might provide a more accurate assessment of OS, whereas the m1GPS that omits hypoalbuminemia as an independent prognostic factor might provide a more accurate assessment of PFS.
Although reports have indicated that other immunological markers, including monocyte counts, the neutrophil to lymphocyte ratio, and levels of IL-2, IL-4, IL-6, IL-10, tumor necrosis factor (TNF) and to interferon-gamma are independent prognosticators of cancer patient outcomes, GPS has proven to be superior to these markers in a wide variety of cancers [31]. One notable strength of this study was that we evaluated the clinical utility of GPS in a cohort. However, multiple advances in treatment approaches were developed over this time. Thus, we evaluated local treatment as a single entity rather than stratifying patients by individual treatment regimens. We acknowledge that the reliability and consistency of the GPS system might be enhanced by evaluating individual treatment regimens separately.
In the current study, GPS was identified as a prognostic marker and indicator for determining the appropriate treatment strategy in patients with metastatic STS. In addition, we found that the modified GPS provided greater prognostic value compared with the traditional GPS. Our findings indicate that patients with metastatic disease and a GPS of 2 are more likely to benefit from systemic treatment compared with local treatment, although dynamic changes in the GPS over the course of therapy should be evaluated in future prospective studies to further clarify the clinical significance of the GPS system. In addition, studies designed to determine which high-risk patients are appropriate candidates for more aggressive multimodal treatment regimens and more intensive follow-up will provide further insight into the utility of the GPS system.
Competing Interests
The authors have declared that no competing interest exists.
References
1. Brahmer JR, Tykodi SS, Chow LQ. et al. Safety and activity of anti-PD-L1 antibody in patients with advanced cancer. N Engl J Med. 2012;366(26):2455-2465
2. Hanahan D, Weinberg RA. Hallmarks of cancer: the next generation. Cell. 2011;144(5):646-674
3. Boffetta P. Exploring a cancer biomarker: the example of C-reactive protein. J Natl Cancer Inst. 2010;102(3):142-143
4. McMillan DC. An inflammation-based prognostic score and its role in the nutrition-based management of patients with cancer. Proc Nutr Soc. 2008;67(3):257-262
5. Deans DA, Tan BH, Wigmore SJ. et al. The influence of systemic inflammation, dietary intake and stage of disease on rate of weight loss in patients with gastro-oesophageal cancer. Br J Cancer. 2009;100(1):63-69
6. Coffelt SB, de Visser KE. Cancer: Inflammation lights the way to metastasis. Nature. 2014;507(7490):48-49
7. Karakiewicz PI, Hutterer GC, Trinh QD. et al. C-reactive protein is an informative predictor of renal cell carcinoma-specific mortality: a European study of 313 patients. Cancer. 2007;110(6):1241-1247
8. Onate-Ocana LF, Aiello-Crocifoglio V, Gallardo-Rincon D. et al. Serum albumin as a significant prognostic factor for patients with gastric carcinoma. Ann Surg Oncol. 2007;14(2):381-389
9. Forrest LM, McMillan DC, McArdle CS, Angerson WJ, Dunlop DJ. Comparison of an inflammation-based prognostic score (GPS) with performance status (ECOG) in patients receiving platinum-based chemotherapy for inoperable non-small-cell lung cancer. Br J Cancer. 2004;90(9):1704-1706
10. Koch A, Fohlin H, Sorenson S. Prognostic significance of C-reactive protein and smoking in patients with advanced non-small cell lung cancer treated with first-line palliative chemotherapy. J Thorac Oncol. 2009;4(3):326-332
11. Shedda S, Kosmider S, Faragher I, Jones I, Gibbs P. A critical review of the Glasgow Prognostic Score for colorectal cancer. Ann Surg. 2008;247(6):1087-1088 1088
12. Lamb GW, Aitchison M, Ramsey S, Housley SL, McMillan DC. Clinical utility of the Glasgow Prognostic Score in patients undergoing curative nephrectomy for renal clear cell cancer: basis of new prognostic scoring systems. Br J Cancer. 2012;106(2):279-283
13. Hirashima K, Watanabe M, Shigaki H. et al. Prognostic significance of the modified Glasgow prognostic score in elderly patients with gastric cancer. J Gastroenterol. 2014;49(6):1040-1046
14. Shafique K, Proctor MJ, McMillan DC. et al. The modified Glasgow prognostic score in prostate cancer: results from a retrospective clinical series of 744 patients. BMC Cancer. 2013;13:292
15. Douglas E, McMillan DC. Towards a simple objective framework for the investigation and treatment of cancer cachexia: the Glasgow Prognostic Score. Cancer Treat Rev. 2014;40(6):685-691
16. McMillan DC, Crozier JE, Canna K, Angerson WJ, McArdle CS. Evaluation of an inflammation-based prognostic score (GPS) in patients undergoing resection for colon and rectal cancer. Int J Colorectal Dis. 2007;22(8):881-886
17. Lamb GW, McMillan DC, Ramsey S, Aitchison M. The relationship between the preoperative systemic inflammatory response and cancer-specific survival in patients undergoing potentially curative resection for renal clear cell cancer. Br J Cancer. 2006;94(6):781-784
18. Hara M, Matsuzaki Y, Shimuzu T. et al. Preoperative serum C-reactive protein level in non-small cell lung cancer. Anticancer Res. 2007;27(4C):3001-3004
19. Siegel RL, Miller KD, Jemal A. Cancer statistics, 2015. CA Cancer J Clin. 2015;65(1):5-29
20. Kempf-Bielack B, Bielack SS, Jurgens H. et al. Osteosarcoma relapse after combined modality therapy: an analysis of unselected patients in the Cooperative Osteosarcoma Study Group (COSS). J Clin Oncol. 2005;23(3):559-568
21. Tsuchiya H, Kanazawa Y, Abdel-Wanis ME. et al. Effect of timing of pulmonary metastases identification on prognosis of patients with osteosarcoma: the Japanese Musculoskeletal Oncology Group study. J Clin Oncol. 2002;20(16):3470-3477
22. Mumm JB, Oft M. Cytokine-based transformation of immune surveillance into tumor-promoting inflammation. Oncogene. 2008;27(45):5913-5919
23. Ramsey S, Lamb GW, Aitchison M, Graham J, McMillan DC. Evaluation of an inflammation-based prognostic score in patients with metastatic renal cancer. Cancer. 2007;109(2):205-212
24. Mantovani A, Allavena P, Sica A, Balkwill F. Cancer-related inflammation. Nature. 2008;454(7203):436-444
25. La Torre M, Nigri G, Cavallini M, Mercantini P, Ziparo V, Ramacciato G. The glasgow prognostic score as a predictor of survival in patients with potentially resectable pancreatic adenocarcinoma. Ann Surg Oncol. 2012;19(9):2917-2923
26. Lien YC, Hsieh CC, Wu YC. et al. Preoperative serum albumin level is a prognostic indicator for adenocarcinoma of the gastric cardia. J Gastrointest Surg. 2004;8(8):1041-1048
27. Bromwich EJ, McArdle PA, Canna K. et al. The relationship between T-lymphocyte infiltration, stage, tumour grade and survival in patients undergoing curative surgery for renal cell cancer. Br J Cancer. 2003;89(10):1906-1908
28. Ishizuka M, Nagata H, Takagi K, Horie T, Kubota K. Inflammation-based prognostic score is a novel predictor of postoperative outcome in patients with colorectal cancer. Ann Surg. 2007;246(6):1047-1051
29. Sharma R, Hook J, Kumar M, Gabra H. Evaluation of an inflammation-based prognostic score in patients with advanced ovarian cancer. Eur J Cancer. 2008;44(2):251-256
30. Nakamura T, Matsumine A, Asanuma K. et al. The value of the high-sensitivity modified Glasgow prognostic score in predicting the survival of patients with a soft-tissue sarcoma. Bone Joint J. 2015Jun;97B(6):847-52
31. Jiang L, Jiang S, Situ D. et al. Prognostic value of monocyte and neutrophils to lymphocytes ratio in patients with metastatic soft tissue sarcoma. Oncotarget. 2015Apr20;6(11):9542-50
Author contact
![]() Corresponding author: Jian-Chuan Xia, PhD. Address: Sun Yat-sen University Cancer Center, 651 Dongfeng Road East, Guangzhou 510060, P. R. China. Tel.: +86-459-5910834; Fax: +86-459-5910834; Email: xiajchsysu.edu.cn.
Corresponding author: Jian-Chuan Xia, PhD. Address: Sun Yat-sen University Cancer Center, 651 Dongfeng Road East, Guangzhou 510060, P. R. China. Tel.: +86-459-5910834; Fax: +86-459-5910834; Email: xiajchsysu.edu.cn.