Impact Factor ISSN: 1837-9664

 Global reach, higher impact
J Cancer 2018; 9(18):3316-3325. doi:10.7150/jca.25729 This issue Cite
Research Paper
Impact of body mass index on long-term survival outcome in Asian populations with solid cancer who underwent curative-intent surgery: A six-year multicenter observational cohort study
Chia-Yen Hung1,2, Cheng-Chou Lai3, Ping-Tsung Chen4, Chang-Hsien Lu4, Pei-Hung Chang5, Kun-Yun Yeh5, Shau-Hsuan Li6, Keng-Hao Liu7, Yu-Shin Hung1, Jen-Shi Chen1, Yung-Chang Lin1, Wen-Chi Chou1,8, ![]()
1. Department of Hematology-Oncology, Chang Gung Memorial Hospital at Linkou and Chang Gung University College of Medicine, Taoyaun, Taiwan
2. Division of Hema-Oncology, Department of Internal Medicine, Mackay Memorial Hospital, Taipei, Taiwan
3. Department of Colon and Rectal Surgery Chang Gung Memorial Hospital at Linkou and Chang Gung University College of Medicine, Taoyaun, Taiwan
4. Departments of Medical Oncology, Chang Gung Memorial Hospital at Chiayi, Chiayi, Taiwan
5. Department of Medical Oncology, Chang Gung Memorial Hospital at Keelung, Keelung, Taiwan
6. Department of Medical Oncology, Chang Gung Memorial Hospital at Kaohsiung, Kaohsiung, Taiwan
7. Department of Surgery, Chang Gung Memorial Hospital at Linkou and Chang Gung University College of Medicine, Taoyaun, Taiwan
8. Graduate Institute of Clinical Medical Sciences, College of Medicine, Chang Gung University, Taoyuan, Taiwan
Received 2018-2-25; Accepted 2018-7-23; Published 2018-9-7
Abstract
Purpose: Being elevated body mass index (BMI) has been considered a poor prognostic factor in patients with cancer. However, studies about the impact of elevated BMI on the survival outcome after cancer surgery have conflicting results. This study aimed to evaluate the impact of BMI on long-term postoperative survival outcome in a large cohort of Asian population with solid cancers.
Methods: A total of 33,551 patients who underwent curative-intent surgery for solid cancers between January 2007 and December 2012 at four hospitals in Taiwan were included. BMI was analyzed using univariate and multivariate regression analyses to determine its association with survival outcome.
Results: With a median follow-up of 43.8 (range, 1-91) months, the rate of all-cause mortality was 21.7% (n=7264 patients), while that of cancer-related mortality was 13.4% (n=4499 patients). BMI was a significant prognostic factor in multivariate analysis for overall survival (OS) and cancer-specific survival (CSS). The adjusted hazard ratio (HR) per kg/m2 was 0.922 (95% confidence interval [CI], 0.916-0.929; P<0.001) and 0.932 (95% CI, 0.924-0.940; P<0.001) for OS and CSS, respectively. Patients with BMI <17 kg/m2 had the highest postoperative mortality risk, with a hazard ratio of 3.8-fold higher for OS and 5.0-fold higher for CSS than those with BMI >35 kg/m2.
Conclusions: This study showed that BMI was positively associated with survival outcome in patients with cancer who underwent radical surgery. BMI was an independent prognostic factor and can be used to risk stratify patients in Asians with solid cancers.
Keywords: body mass index, solid cancer, cancer surgery, outcome
Introduction
Body mass index (BMI), calculated as body weight divided by the square of height, is a simple formula to quantify the amount of tissue mass in an individual 1. In the healthy population, BMI is used as an indicator for predicting the risk for various metabolic diseases, cardiovascular events, and malignant diseases 2. The association between BMI and mortality was frequently described as a U curve, with the lowest mortality rate in the population with normal weight and highest mortality rate among those who are extremely underweight and overweight3. Elevated BMI, defined as >25kg/m2, is frequently associated with comorbidities, particularly metabolic disease; as such, it has long been considered a risk factor for poor outcomes in the general population 4, 5. Furthermore, elevated BMI are an emergent public health issue because the prevalence of being elevated BMI has been rapidly increasing to up to 40% in the general population in developed countries 6, 7 and because of an almost 3-fold increase in the last four decades globally 8.
In the general population, elevated BMI has been considered a poor prognostic factor in various surgical procedures in cancer treatment 9. The death rates among patients with cancer whose BMI is ≥40 kg/m2 has been reported to be up to 50%-60% than those with normal weight 9. However, recent studies reported that the impact of elevated BMI on survival outcome varies among different cancer types. For example, elevated BMI is associated with poor survival outcome in patients with gastrointestinal cancer 9 and prostate cancer 10, while it had a protective effect in lung cancer 11.
The poor outcome of elevated BMI patients was hypothesized to be associated with a high risk of postoperative complications and physical stress after extensive surgery 12, 13, 14. One national study from Japan that included 30,765 patients who underwent surgery for gastrointestinal cancer reported that elevated BMI patients had more postoperative complications and greater postoperative cost than those with normal weight 14. However, another multi-institute study from the United States that included 2,258 patients who underwent major intra-abdominal cancer surgery reported that only underweight, and not elevated BMI, was an independent risk factor for postoperative mortality or major complications 15. Recently, an increasing number of studies from the Western populations supported the phenomenon of “obesity paradox” in patients with cancer after radical surgery, that is, elevated BMI patients with cancer had a favorable outcome after surgery 16, 17.
The prevalence of elevated BMI and obesity in Asian populations is significantly different from that in Western counties 18, 19. Even at the same BMI, the Asian population frequently presents with higher amount of body fat and greater risk of developing metabolic disease than the Western population 20. Reports on the association of BMI and survival outcome in Asian patients with cancer are relatively rare 14, 21. Moreover, whether the phenomenon of “obesity paradox” observed in the Western population can be generalized in the Asian population after cancer surgery remains unknown. This study aimed to evaluate the impact of BMI on long-term postoperative survival outcome in a large cohort of patients with solid cancers.
Materials and Methods
Patient selection
A total of 37,288 patients who underwent surgery for solid cancers between January 2007 and December 2012 at four hospitals affiliated with the Chang Gung Memorial Hospital system (CGMH) (namely, The Linkou, Keelung, Chiayi, and Kaohsiung branches of the CGMH) were included in this study. All patients with either pathologically or radiographically diagnosed malignancies underwent radical resection of their primary cancers with a curative intent. Patients who underwent palliative resection or bypass surgery, were less than 20 years old, with incomplete record for body weight or height within 7 days before cancer surgery, and with non-melanoma skin cancers or superficial urinary bladder cancers were excluded (n=3,737). Finally, 33,551 patients were included and were categorized according to BMI for survival analysis. This study was approved by the institutional review boards of all the CGMH branches and has been conducted in compliance with the Helsinki Declaration (1996).
Data collection
The patient's demographic and clinical data including age, sex, body weight, body height, Eastern Cooperative Oncology Group (ECOG) performance status, mode of admission (outpatient or emergency department), cancer history, pre-existing comorbidities, anatomic location of the primary cancer, histological grade, and clinical stage were recorded by primary care clinicians preoperatively using a prospectively formulated electronic data form from our previous study 22, 23. The tumor stage was classified as localized, regional, advanced, and unclassified in compliance with the Surveillance, Epidemiology, and End Results summary staging program 24. Comorbidity was calculated via Charlson comorbidity index (CCI) using tabulated electronic record forms in compliance with The International Classification of Diseases (Ninth Revision) coding 25. A modified CCI excluding the scores for patient age and cancer type was used in this study. All included patients were followed until death or June 30, 2014. Overall survival (OS) and cancer-specific survival (CSS) were calculated from the time of surgery until the date of death from any cause and due to cancer, respectively. All dates of death were obtained from either the Institutional Cancer Registry or the National Registry of Death database in Taiwan.
Statistical analysis
All patients were initially categorized according to the World Health Organization (WHO) BMI criteria 1 for intergroup comparison. Due to the unequal distribution of patients among the WHO BMI subgroups, all patients were further stratified into BMI subgroup by kg/m2 for survival analysis. The survival time was calculated using the Kaplan-Meier method. Clinical variables for OS and CSS after cancer surgery were examined via univariate and multivariate logistic regression analyses. The effect of BMI on survival was examined using Cox's proportional hazards model. Adjusted hazard ratios (HRs) for BMI groups were estimated using multivariate Cox regression after adjusting for sex, age, ECOG performance status, CCI, admission type, primary cancer site, tumor stage, and tumor grade. These eight clinicopathologic variables were chosen according to our previous study 22 to minimize the confounding of postoperative outcome after cancer surgery. In our previous publication, we created 5 cancer groups that showed similar post-operative survival22. We used the same stratification to adjust for innate OS differences in various cancers. The SPSS 17.0 software (SPSS Inc., Chicago, IL, USA) was used for statistical analysis. All statistical assessments were two sided, and a p-value less than 0.05 was considered statistically significant.
Results
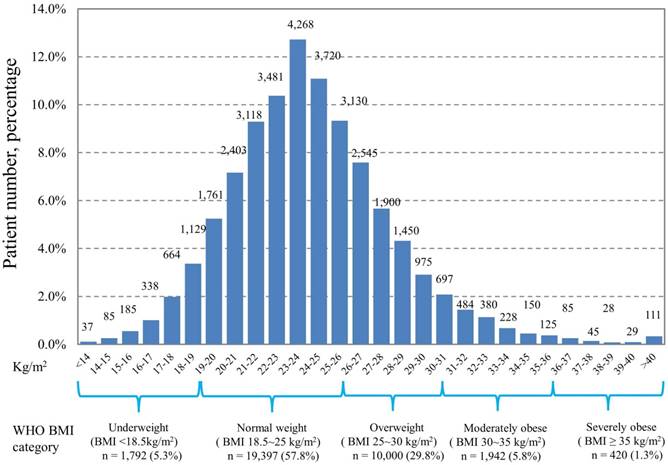
Of the 33,551 patients, the percentages of underweight (BMI <18.5 kg/m2), normal weight (BMI 18.5-25 kg/m2), overweight (BMI 25-30 kg/m2), moderately obese (BMI 30-35 kg/m2), and severely obese (BMI ≥35 kg/m2) as classified according to the WHO criteria were 5.3%, 57.8%, 29.8%, 5.8%, and 1.3%, respectively. The baseline characteristics of the patients included in the study are shown in Table 1. An increase in the number of young age, female sex, primary tumors originating from the thyroid or breast, well-differentiated tumor grade, localized tumor stage, better ECOG performance status, admission from outpatient department, and high numbers of comorbidities was observed in patients with increasing WHO BMI categories (all p value <0.001). The distribution of patients according to the BMI subgroup categorized by kg/m2 is shown in Figure 1. The distribution ranged widely from less than 14 kg/m2 to more than 40 kg/m2 in our patient cohort, with the highest number of patients (n=4,268, 12.7%) distributed in 23-24 kg/m2 subgroup.
Patient's demographic data according to BMI category
| Variable | Category | Overall, n (%) | Underweight (BMI <18.5 kg/m2) | Normal (BMI 18.5-25 kg/m2) | Overweight (BMI 25-30 kg/m2) | Moderately obese (BMI 30-35 kg/m2) | Severely obese (BMI >35 kg/m2) | p value |
|---|---|---|---|---|---|---|---|---|
| Overall | No (%) | 33551 (100) | 1792 (5.3) | 19397 (57.8) | 10000 (29.8) | 1942 (5.8) | 420 (1.3) | |
| Age | median (IQR) | 58 (49-68) | 56 (45-70) | 57 (48-68) | 59 (50-68) | 56 (48-66) | 50 (42-59) | <0.001 |
| Sex | male | 17595 (52.4) | 969 (54.1) | 10514 (54.2) | 5082 (44.9) | 872 (44.9) | 158 (37.6) | <0.001 |
| female | 15956 (47.6) | 823 (45.9) | 8883 (45.8) | 4918 (55.1) | 1070 (55.1) | 262 (62.4) | ||
| Primary site of cancer | breast + thyroid | 5512 (16.4) | 182 (10.2) | 3040 (15.7) | 1777 (17.8) | 420 (21.6) | 93 (22.1) | <0.001 |
| CRC+GYN+GU | 14224 (42.4) | 672 (37.5) | 8149 (42.0) | 4365 (43.7) | 842 (43.4) | 196 (46.7) | ||
| HN, esophagus, thorax, and others | 7949 (23.7) | 560 (31.3) | 4608 (23.8) | 2268 (22.7) | 429 (22.1) | 84 (20) | ||
| HPB, stomach, and small bowel | 5310 (15.8) | 347 (19.4) | 3251 (16.8) | 1444 (14.4) | 228 (11.7) | 40 (9.5) | ||
| CNS | 556 (1.7) | 31 (1.7) | 349 (1.8) | 146 (1.5) | 23 (1.2) | 7 (1.7) | ||
| Tumor grade | Well | 4845 (14.4) | 227 (12.7) | 2727 (14.1) | 1503 (15.0) | 314 (16.2) | 74 (17.6) | <0.001 |
| Moderate | 15288 (45.6) | 860 (48.0) | 8874 (45.7) | 4520 (45.2) | 847 (43.6) | 187 (44.5) | ||
| Poor | 7687 (22.9) | 438 (24.4) | 4521 (23.3) | 2210 (22.1) | 422 (21.7) | 96 (22.9) | ||
| Unclassified | 5731 (17.1) | 267 (14.9) | 3275 (16.9) | 1767 (17.7) | 359 (18.5) | 63 (15.0) | ||
| Tumor stage | Local | 18131 (54.0) | 786 (43.9) | 10384 (53.5) | 5625 (56.3) | 1101 (56.7) | 235 (56.0) | <0.001 |
| Regional | 13203 (39.4) | 858 (47.9) | 7692 (39.7) | 3755 (37.6) | 734 (37.8) | 164 (39.0) | ||
| Advanced | 997 (3.0) | 83 (4.6) | 601 (3.1) | 260 (2.6) | 42 (2.2) | 11 (2.6) | ||
| Unclassified | 1220 (3.6) | 65 (3.6) | 720 (3.7) | 360 (3.6) | 65 (3.3) | 10 2.4) | ||
| ECOG performance status | 0 | 13866(41.3) | 665 (37.1) | 7935 (40.9) | 4212 (42.1) | 861 (44.3) | 193 (46.0) | <0.001 |
| 1 | 13589 (40.5) | 735 (41.0) | 7910 (40.8) | 4074 (40.7) | 719 (37.0) | 151 (36.0) | ||
| 2 | 4416 (13.2) | 286 (16.0) | 2612 (13.5) | 1214 (12.1) | 245 (12.6) | 59 (14.0) | ||
| 3 or 4 | 1680 (5.0) | 106 (5.9) | 940 (4.8) | 500 (5.0) | 117 (6.0) | 17 (4.0) | ||
| Admission type | Emergency department | 4205 (12.5) | 326 (18.2) | 2660 (13.7) | 1028 (10.3) | 165 (8.5) | 26 (6.2) | <0.001 |
| Outpatient department | 29346 (87.5) | 1466 (81.8) | 16737 (86.3) | 8972 (89.7) | 1777 (91.5) | 394 (93.8) | ||
| CCI | 0 | 23269 (69.4) | 1321 (73.7) | 13773 (71.0) | 6673 (66.7) | 1236 (63.6) | 266 (63.3) | <0.001 |
| 1 | 7189 (21.4) | 336 (18.8) | 3918 (20.2) | 2344 (23.4) | 483 (24.9) | 108 (25.7) | ||
| 2 | 2128 (6.3) | 98 (5.5) | 1155 (6.0) | 698 (7.0) | 150 (7.7) | 7 (6.4) | ||
| ≥3 | 965 (2.9) | 37 (2.0) | 551 (2.8) | 285 (2.9) | 73 (3.8) | 19 (4.5) |
IQR, interquartile range; CRC, colorectal cancer; GYN, gynecology; GU, genitourinary; HN, head and neck; HPB, hepato-biliary-pancreatic; CNS, central nervous system; ECOG, Eastern Cooperative Oncology Group; CCI, Charlson comorbidity index
Distribution of patients according to body mass index
With a median follow-up of 43.8 (range, 1-91) months, the rate of all-cause death was 21.7% (n=7,264) and that of cancer-related death was 13.4% (n=4,499). The results of univariate and multivariate analyses for the clinical variables associated with OS and CSS are presented in Table 2. Univariate analysis showed that all the 9 preselected variables, namely, age, comorbidity, ECOG performance status, primary tumor type, admission mode, tumor stage, histological grade, sex, and BMI, statistically significantly affected OS and CSS. In the multivariate analysis, BMI remained the independent prognostic factor with the adjusted HR per kg/m2 of 0.922 (95% confidence interval [CI], 0.916-0.929; p<0.001) and 0.932 (95% CI, 0.924-0.940; p<0.001) for OS and CSS, respectively. Using the patients with BMI 24-25 kg/m2 as the reference group, the crude and adjusted HR for postoperative survival time among the different BMI subgroups are shown in Figure 2. In general, patients with low BMI had significantly short postoperative survival time in terms of OS and CSS than those with high BMI. The significant difference in OS and CSS persisted after adjusting for other independent clinical variables relevant to the survival outcome. The HR was 3.8-fold higher for OS and 5.0-fold higher for CSS when compared those with BMI ≤ 17 kg/m2 and those with >35 kg/m2.
Univariate and multivariate analysis for overall and cancer-specific survival
| Variable | Category | Overall survival | Cancer-specific survival | |||||||
|---|---|---|---|---|---|---|---|---|---|---|
| Univariate | Multivariate | Univariate | Multivariate | |||||||
| HR (95% CI) | P | Adjusted HR (95% CI) | P | HR (95% CI) | P | Adjusted HR (95% CI) | P | |||
| Age | Per year | 1.027 (1.026-1.029) | <0.001 | 1.018 (1.017-1.020) | <0.001 | 1.019 (1.017-1.021) | <0.001 | 1.006 (1.004-1.008) | <0.001 | |
| CCI | Per scale | 1.338 (1.309-1.368) | <0.001 | 1.064 (1.035-1.093) | <0.001 | 1.252 (1.214-1.291) | <0.001 | 1.029 (0.994-1.065) | 0.11 | |
| ECOG | Per scale | 1.637 (1.598-1.677) | <0.001 | 1.321 (1.24-1.359) | <0.001 | 3.060 (2.923-3.204) | <0.001 | 2.346 (2.228-2.470) | <0.001 | |
| Primary tumor site | Breast or thyroid | 1 | 1 | 1 | 1 | |||||
| CRC + GYN +GU | 2.827 (2.537-3.151) | <0.001 | 1.916 (1.712-2.146) | <0.001 | 2.843 (2.466-3.279) | <0.001 | 2.168 (1.876-2.507) | <0.001 | ||
| HN, esophagus, thorax, and others | 6.078 (5.437-6.794) | <0.001 | 4.139 (3.679-4.657) | <0.001 | 5.289 (4.585-6.101) | <0.001 | 5.275 (4.563-6.098) | <0.001 | ||
| HBP, stomach, Small bowel | 4.866 (4.362-5.428) | <0.001 | 4.157 (3.693-4.680) | <0.001 | 7.022 (6.076-8.115) | <0.001 | 5.959 (5.144-6.904) | <0.001 | ||
| CNS | 12.09 (10.39-14.05) | <0.001 | 7.687 (6.563-9.003) | <0.001 | 11.99 (9.831-14.62) | <0.001 | 9.781 (7.984-11.98) | <0.001 | ||
| Admission mode | Outpatient department | 1 | 1 | 1 | 1 | |||||
| Emergency department | 2.130 (2.014-2.252) | <0.001 | 1.371 (1.294-1.453) | <0.001 | 2.093 (1.949-2.248) | <0.001 | 1.195 (1.109-1.288) | <0.001 | ||
| Tumor stage | Local | 1 | 1 | 1 | 1 | |||||
| Regional (localized) | 2.266 (2.156-2.382) | <0.001 | 2.282 (2.169-2.401) | <0.001 | 2.623 (2.458-2.799) | <0.001 | 2.730 (2.556-2.917) | <0.001 | ||
| Distant metastases | 3.779-4.616 | <0.001 | 4.181 (3.777-4.629) | <0.001 | 5.303 (4.701-5.983) | <0.001 | 5.315 (4.702-6.009) | <0.001 | ||
| Unclassified | 1.935 (1.729-2.165) | <0.001 | 2.197 (1.956-2.467) | <0.001 | 2.096 (1.812-2.425) | <0.001 | 2.073 (1.786-2.408) | <0.001 | ||
| Tumor grade | Well | 1 | 1 | 1 | 1 | |||||
| Moderately | 1.522 (1.403-1.651) | <0.001 | 1.536 (1.413-1.670) | <0.001 | 1.729 (1.551-1.927) | <0.001 | 1.782 (1.596-1.991) | <0.001 | ||
| Poorly or undifferentiated | 2.306 (2.120-2.509) | <0.001 | 2.350 (2.152-2.566) | <0.001 | 2.652 (2.372-2.966) | <0.001 | 2.554 (2.274-2.87) | <0.001 | ||
| Unclassified | 1.289 (1.172-1.418) | <0.001 | 1.379 (1.247-1.525) | <0.001 | 1.430 (1.261-1.622) | <0.001 | 1.484 (1.301-1.694) | <0.001 | ||
| Sex | Female | 1 | 1 | 1 | 1 | |||||
| Male | 1.893 (1.804-1.987) | <0.001 | 1.178 (1.148-1.208) | <0.001 | 1.380 (1.339-1.424) | <0.001 | 1.174 (1.137-1.212) | <0.001 | ||
| BMI | Per kg/m2 | 0.907 (0.901-0.913) | <0.001 | 0.922 (0.916-0.929) | <0.001 | 0.906 (0.899-0.914) | <0.001 | 0.932 (0.924-0.940) | <0.001 | |
CCI, Charlson comorbidity index; ECOG, Eastern Cooperative Oncology Group; CRC, colorectal cancer; GYN, gynecology; GU, genitourinary; HN, head and neck; HPB, hepato-biliary-pancreatic; CNS, central nervous system; BMI, body mass index
Crude and adjusted hazard ratio for cancer-specific survival (CSS) (2A) and overall survival (OS) (2B) according to body mass index (patients with BMI 24-25kg/m2 were used as the reference group)
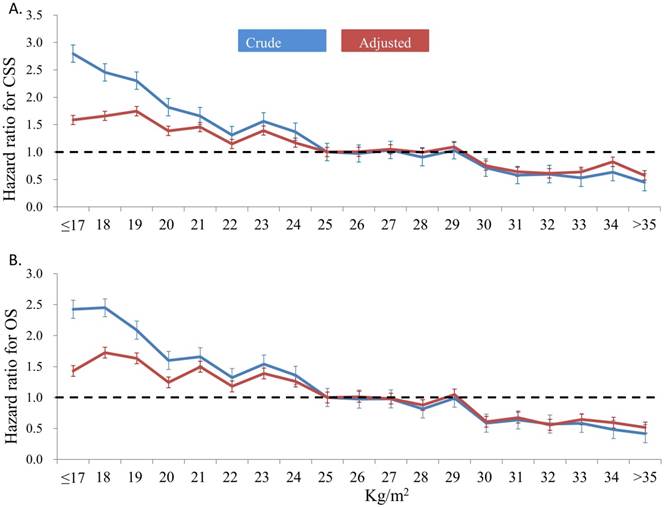
Figure 3 shows the mortality rates (3A) and tumor recurrent rates (3B) among the patients according to the BMI subgroups. The postoperative 1-year, 2-year, and 3-year overall mortality rate and cancer-specific mortality rate of all patients were 6.8%, 14.3%, and 22.3% and 4.4%, 8.1%, and 10.6%, respectively. Patients with BMI <17 kg/m2 had the highest postoperative 1-year (12.0%), 2-year (32.6%), and 3-year (51.4%) mortality rate, while the low postoperative mortality rates were noted among those with high BMI subgroups. Similarly, patients with BMI <17 kg/m2 had the highest postoperative 1-year (19.4%), 2-year (33.9%), and 3-year (45.7%) recurrent rate, while the low postoperative recurrent rates were noted among those with high BMI subgroups.
Postoperative 1-year, 2-year, and 3-year overall mortality rate (3A) and tumor recurrent rate (3B) according to body mass index
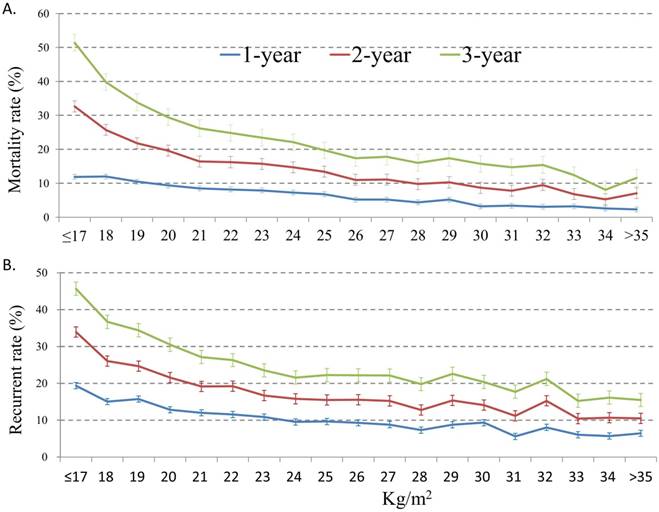
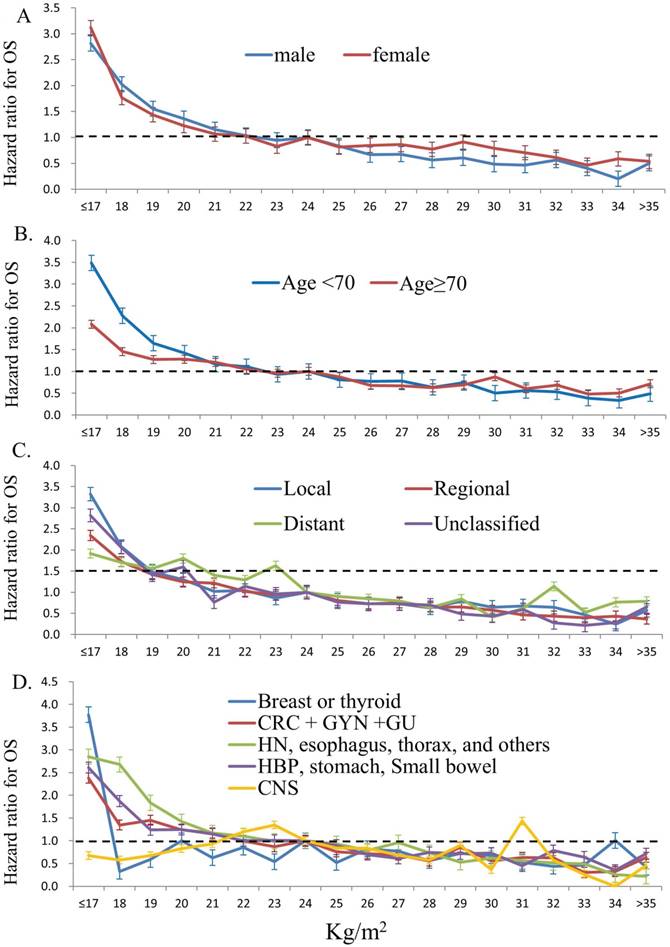
Figure 4 show the impact of BMI on overall survival (OS) in different patient groups stratified by gender (4A), age (4B), tumor stage (4C), and tumor subtypes (4D). Overall, patients with lower BMI had poorer OS compared to those of higher BMI, independent of gender, age, and tumor stages. Furthermore, patients of lower BMI with cancers of head and neck, intra-thoracic and intra-abdominal origins had poorer OS; however, those of lower BMI with breast, thyroid and central nervous system cancers did not show such impact. The detail HRs for overall survival and different patient groups stratified by gender, age, tumor stage, and tumor sites according to WHO body mass index are show in Table 3.
The impact of body mass index on overall survival (OS) in different patient groups stratified by gender (4A), age (4B), tumor stage (4C), and tumor subtypes (4D) (patients with BMI 24-25kg/m2 were used as the reference group)
Hazard ratio for overall survival and different patient groups stratified by gender, age, tumor stage, and tumor sites according to WHO body mass index (patients with normal weight were used as the reference group)
| Category, HR (95% CI) | Underweight (BMI <18.5 kg/m2) | Normal weight (BMI 18.5~25 kg/m2) | Overweight (BMI 25-30 kg/m2) | Moderately obese (BMI 30~35 kg/m2) | Severely obese (BMI > 35 kg/m2) |
|---|---|---|---|---|---|
| Overall cohort | 2.19 (2.03-2.36)** | 1 | 0.68 (0.64-0.72)** | 0.48 (0.42-0.55)** | 0.48 (0.36-0.63)** |
| Male | 2.16 (1.97-2.37)** | 1 | 0.61 (0.56-0.65)** | 0.43 (0.36-0.52)** | 0.55 (0.37-0.80)* |
| Female | 2.31 (2.02-2.63)** | 1 | 0.87 (0.80-0.95)* | 0.63 (0.52-0.77)** | 0.53 (0.35-0.80)* |
| Age <70 | 2.49 (2.28-2.72)** | 1 | 0.69 (0.64-0.74)** | 0.46 (0.39-0.54)** | 0.51 (0.37-0.70)** |
| Age ≥70 | 1.74 (1.47-2.06)** | 1 | 0.64 (0.57-0.72)** | 0.58 (0.44-0.75)** | 0.74 (0.39-1.43) |
| Tumor stage: Local | 2.40 (2.12-2.71)** | 1 | 0.71 (0.65-0.78)** | 0.58 (0.48-0.70)** | 0.49 (0.32-0.74)* |
| Tumor stage: Regional | 1.98 (1.76-2.24)** | 1 | 0.68 (0.61-0.74)** | 0.39 (0.31-0.50)** | 0.45 (0.26-0.77)* |
| Tumor stage: Distant | 1.62 (1.32-1.98)** | 1 | 0.73 (0.61-0.86)** | 0.59 (0.40-0.87)* | 0.55 (0.25-1.23) |
| Tumor stage: Unclassified | 1.49 (1.17-1.90)* | 1 | 0.67 (0.57-0.79)** | 0.37 (0.24-0.58)** | 0.77 (0.37-1.62) |
| Tumor site: Breast or thyroid | 1.51 (0.92-2.48) | 1 | 0.99 (0.80-1.25) | 0.73 (0.46-1.14) | 0.66 (0.24-1.76) |
| Tumor site: CRC + GYN +GU | 1.85 (1.60-2.13)** | 1 | 0.70 (0.64-0.77)** | 0.54 (0.44-0.67)** | 0.71 (0.49-1.04) |
| Tumor site: HN, esophagus, thorax, and others | 2.34 (2.07-2.64)** | 1 | 0.69 (0.62-0.76)** | 0.44 (0.34-0.57)** | 0.19 (0.08-0.45)** |
| Tumor site: HBP, stomach, Small bowel | 2.05 (1.77-2.37)** | 1 | 0.67 (0.59-0.75)** | 0.55 (0.41-0.74)** | 0.70 (0.38-1.31) |
| Tumor site: CNS | 0.67 (0.40-1.13) | 1 | 0.67 (0.51-0.88)* | 0.57 (0.29-1.11) | 0.37 (0.09-1.48) |
CRC, colorectal cancer; GYN, gynecology; GU, genitourinary; HN, head and neck; HPB, hepato-biliary-pancreatic; CNS, central nervous system; BMI, body mass index
(* indicated P<0.01, ** indicated P<0.001)
Discussion
This multi-center study included a large patient cohort with various types of solid cancer during a 6-year period. BMI was identified as an independent prognostic factor for OS and CSS after cancer surgery. Moreover, we found a positive association between BMI and long-term survival outcome, with the worse outcome in underweight patients and best outcome in elevated BMI patients. Notably, a 3.8-fold increased risk of overall mortality and a 5-fold increased risk of cancer-specific mortality was observed in patients with BMI ≤17 kg/m2 compared to those with BMI >35 kg/m2. In line with the phenomenon of “obesity paradox” reported from Western countries 16, 17, we confirmed that BMI had a protective effect on long-term survival outcomes in Asian population after cancer surgery.
Radical surgery is the optimal curative modality for patients with solid cancers. However, such intensive treatment modality leads to high morbidity and mortality rate in patients with cancer, particularly in those who are medically unfit or frail 22, 26-28. Elevated BMI and obesity is frequently associated with several medical comorbidities; as such, obesity had long been considered a poor prognostic factor for cancer surgery 9. By contrast, our study identified elevated BMI as a positive prognostic variable for patients who underwent cancer surgery. In addition to BMI, our study also identified that the surgical outcome of patients with cancer was influenced by multiple factors such as patient's characteristics (age, sex, comorbidity, performance, and admission mode) and tumor features (primary tumor location, stage, and grade). Patients with high BMI in our patient cohort were more likely to present with other good prognostic factors, including young age, female sex, well-differentiated tumor grade, localized tumor stage, better ECOG performance status, and admission from outpatient department as compared to those patients with low BMI. A selection bias regarding which elevated BMI patients were offered the radical surgery might partially explain the difference of patient distribution in terms of clinical presentation. However, the BMI remained an important independent prognostic factor after adjustment for other confounding factors in the multivariate model in our study.
Studies regarding the impact of the BMI on survival outcome after cancer surgery have reported conflicting results. Early studies showed that obesity was associated with high risk for postoperative complications after surgery for urologic 29, gastric 30, and pancreatic cancer 31. Several prospective studies subsequently demonstrated that obesity alone is not a risk factor for perioperative morbidity or mortality 15, 32-33. This concept was further confirmed by another large-scale study that included 529,955 patients who underwent major cancer resection from the American College of Surgeons National Surgical Quality Improvement Program database during 2005-2012 34. Consistent with previously published reports, our study showed that obesity was not a negative prognostic factor for postoperative mortality. Inversely, elevated BMI was significantly associated with lower postoperative mortality rate than those with underweight. As such, obese patients should be treated with the aim for standard oncologic procedure without being hindered by a misleading perception of prohibitively increased postoperative morbidity or mortality 17.
Patients who are extremely underweight undergoing cancer surgery had the poorest survival outcome compared with extremely obese patients. The underweight status represented the underlying malnourish state 15, a recent significantly body weight loss due to advanced tumor burden, and loss of skeletal mass due to muscle wasting 35, 36, all of which are well-known risk factors for adverse surgical outcomes and poor reserve for antitumor treatment 37. Furthermore, the malnourished state might lead to impaired immunologic response and compromised antitumor response 38. Conversely, obese patients might have a better nutritional reserve to cope with the stress of cancer and antitumor treatment. After the first article published in 1999 describing the phenomenon of the “obesity paradox,” which suggested a survival advantage for obese patients undergoing hemodialysis 39, increasing number of studies supported that elevated BMI is “protective” factor for mortality and other adverse events in patients with respiratory failure 40, congestive heart failure 41, and coronary artery disease undergoing percutaneous coronary intervention 42. Thus, the “obesity paradox” appears to be a common phenomenon in several diseases. Patients with better nutrition, excessive fat, and surplus calories might have better tolerance for antitumor therapy, therefore partially conferring some survival advantage 43. However, the real reason for the phenomenon is still uncertain.
The association between survival outcome and BMI is frequently reported as reverse “J” shape 14 or “U” shape 3 and indicates a higher mortality rate among patients with extreme obesity compared with those with normal weight. Patients with extreme obesity are more likely to present with more advanced tumor stage that directly affects the survival outcome but did not increase the rate of postoperative complications 44. Furthermore, the prevalence of obesity was significantly different between Western and Asian population. For example, nearly 1 in every 3 adults is obese (BMI >30 kg/m2) and 1 in every 20 adults is morbidly obese (BMI >40 kg/m2) in the general population in the United States. In our patient cohort, the majority of patients (87.6%) was categorized as normal or overweight (BMI, 18.5-30 kg/m2), while only 6.7% and 0.3% of our patients were categorized as obese and morbidly obese, respectively. Due to the relative rarity of morbidly obese patients, we were unable to demonstrate the association of survival outcome and BMI with a reverse “J” shape or “U” shape in our patient cohort as that in Western countries. A “U shape” survival curve association between BMI and all-cause mortality had been reported among elderly population in Korea45. Small numbers of patients with obese in our patient cohort might the main reason for the absence of U shape survival curve in our study. Our result is insufficient to draw conclusion in the morbid obese group because of a lack of sufficient number of cases. The impact of morbid obesity (BMI >40 kg/m2) on survival outcome after cancer surgery in the Asian population still needs further studies.
This observational cohort study evaluated the impact of BMI on OS and CSS outcomes after cancer surgery. The other important clinicopathologic variables that potentially influence postoperative outcome were prospectively identified and adjusted to minimize the confounding factors for the survival analysis in our study. The strength of our study included the large number of patients from multiple institutions across Taiwan within a 6-year period. However, this study also has several limitations as follows. First, selection bias might exist as this was a retrospective study and high BMI was associated with young age, excellent ECOG status, and better prognostic characteristics of tumor than those in the low BMI. Radical cancer surgery might be deferred among extremely obese patients to avoid postoperative complication; therefore, the true postoperative mortality risk may be underestimated in such patient group. Second, the short-term postoperative complication might influence the survival outcome in patients who underwent cancer surgery. Unfortunately, we were unable to demonstrate the associations between perioperative morbidity and BMI because these complications were not included at the time of data analysis. Third, the survival outcome might be influenced by the efficacy and toxicity of postoperative adjuvant treatment. Because we did not include postoperative chemotherapy in our analysis, we therefore listed this as one possible limitation in our study even though lower doses46 and poorer tolerance47 of the patients with elevated BMI may suggest poorer outcome. Forth, the smoking status of our patient cohort, which possible impact survival outcome, was not available. Finally, the use of single BMI assessment at the time before cancer surgery might not properly represent the patient's constant BMI, whereas BMI plus the percentage of recent weight loss might better enhance the clinical value than BMI alone in determining the prognosis of patients with cancer 37. A prospective, comprehensive study would be helpful to address these issues.
In conclusion, this study showed a positive association of BMI and long-term survival outcome in patients with cancer who underwent radical surgery. BMI was found to be an independent prognostic factor and can be used to risk stratify patients in Asians with solid cancers.
Acknowledgements
The authors would like to thank Ms. Vengi Ho and all members of the Chang Gung Memorial Hospital Cancer Center for their help in data collection.
Competing Interests
The authors have declared that no competing interest exists.
References
1. World Health Organization (WHO). Obesity and overweight: Fact sheet. 2015. Available from: www.who.int/mediacentre/factsheets/fs311/en/. Accessed on Dec 12. 2017
2. Kyrgiou M, Kalliala I, Markozannes G, Gunter MJ, Paraskevaidis E, Gabra H. et al. Adiposity and cancer at major anatomical sites: umbrella review of the literature. BMJ. 2017;356:j477
3. Global BMI Mortality Collaboration, Di Angelantonio E, Bhupathiraju ShN, Wormser D, Gao P, Kaptoge S. et al. Body-mass index and all-cause mortality: individual-participant-data meta-analysis of 239 prospective studies in four continents. Lancet. 2016;388(10046):776-786
4. Adams KF, Schatzkin A, Harris TB, Kipnis V, Mouw T, Ballard-Barbash R. et al. Overweight, obesity, and mortality in a large prospective cohort of persons 50 to 71 years old. N Engl J Med. 2006;355(8):763-778
5. Calle EE, Thun MJ, Petrelli JM, Rodriguez C, Heath CW Jr. Body-mass index and mortality in a prospective cohort of U.S. adults. N Engl J Med. 1999;341(15):1097-1105
6. Parikh NI, Pencina MJ, Wang TJ, Lanier KJ, Fox CS, D'Agostino RB. et al. Increasing trends in incidence of overweight and obesity over 5 decades. Am J Med. 2007;120(3):242-250
7. Reas DL, Nygard JF, Svensson E, Sorensen T, Sandanger I. Changes in body mass index by age, gender, and socio-economic status among a cohort of Norwegian men and women (1990-2001). BMC Public Health. 2007;7:269
8. NCD Risk Factor Collaboration (NCD-RisC). Trends in adult body-mass index in 200 countries from 1975 to 2014: a pooled analysis of 1698 population-based measurement studies with 19.2 million participants. Lancet. 2016;387(10026):1377-1396
9. Calle EE, Rodriguez C, Walker-Thurmond K, Thun MJ. Overweight, obesity, and mortality from cancer in a prospectively studied cohort of U.S. adults. N Engl J Med. 2003;348(17):1625-1638
10. Zhao R, Cheng G, Wang B, Qin C, Liu Y, Pan Y. et al. BMI and serum lipid parameters predict increasing risk and aggressive prostate cancer in Chinese people. Oncotarget. 2017;8(39):66051-66060
11. Sepesi B, Gold KA, Correa AM, Heymach JV, Vaporciyan AA, Roszik J. et al. The Influence of body mass index on overall survival following surgical resection of non-small cell lung cancer. J Thorac Oncol. 2017;12(8):1280-1287
12. Hussan H, Gray DM 2nd, Hinton A, Krishna SG, Conwell DL, Stanich PP. Morbid obesity is associated with increased mortality, surgical complications, and incremental health care utilization in the peri-operative period of colorectal cancer surgery. World J Surg. 2016;40(4):987-994
13. You L, Zhao W, Hong X, Ma L, Ren X, Shao Q. et al. The effect of body mass index on surgical outcomes in patients undergoing pancreatic resection: A Systematic Review and Meta-Analysis. Pancreas. 2016;45(6):796-805
14. Yasunaga H, Horiguchi H, Matsuda S, Fushimi K, Hashimoto H, Ayanian JZ. Body mass index and outcomes following gastrointestinal cancer surgery in Japan. Br J Surg. 2013;100(10):1335-1343
15. Mullen JT, Davenport DL, Hutter MM, Hosokawa PW, Henderson WG, Khuri SF. et al. Impact of body mass index on perioperative outcomes in patients undergoing major intra-abdominal cancer surgery. Ann Surg Oncol. 2008;15(8):2164-2172
16. Attaran S, McShane J, Whittle I, Poullis M, Shackcloth M. A propensity- matched comparison of survival after lung resection in patients with a high versus low body mass index. Eur J Cardiothorac Surg. 2012:42 (4);653-658
17. Mullen JT, Moorman DW, Davenport DL. The obesity paradox: body mass index and outcomes in patients undergoing nonbariatric general surgery. Ann Surg. 2009;250(1):166-172
18. The percentage of the population aged 18, over who overweight or obese by years 200-2013. Health Promotion Administration. Ministry of Health and Welfare, Taiwan. http://data.hpa.gov.tw/dataset/143023274404/resource/a8fd7d74-611f-4838-9cf6-3c1784b93fc9. Accessed on Dec 12. 2017
19. WHO Expert Consultation. Appropriate body-mass index for Asian populations and its implications for policy and intervention strategies. Lancet. 2004;363(9403):157-163
20. Chan JC, Malik V, Jia W, Kadowaki T, Yajnik CS, Yoon KH. et al. Diabetes in Asia: epidemiology, risk factors, and pathophysiology. JAMA. 2009;301(20):2129-2140
21. Yi SW, Ohrr H, Shin SA, Yi JJ. Sex-age-specific association of body mass index with all-cause mortality among 12.8 million Korean adults: a prospective cohort study. Int J Epidemiol. 2015;44(5):1696-1705
22. Chou WC, Wang F, Cheng YF, Chen MF, Lu CH, Wang CH. et al. A simple risk stratification model that predicts 1-year postoperative mortality rate in patients with solid-organ cancer. Cancer Med. 2015;4(11):1687-1696
23. Chou WC, Liu KH, Lu CH, Hung YS, Chen MF, Cheng YF. et al. To operate or not: prediction of 3-month postoperative mortality in geriatric cancer patients. J Cancer. 2016;7(1):14-21
24. Young JL Jr, Roffers SD, Ries LAG, Fritz AG, Hurlbut AA. SEER Summary Staging Manual: Codes and Coding Instructions, National Cancer Institute, NIH Pub. No. 01-4969. 2001 Bethesda, MD
25. Newschaffer CJ, Bush TL, Penberthy LE, Bellantoni M, Helzlsour K, Diener- West M. Does comorbid disease interact with cancer? An epidemiologic analysis of mortality in a cohort of elderly breast cancer patients. J Gerontol A Biol Sci Med Sci. 1998;53(5):M372-378
26. Korc-Grodzicki B, Downey RJ, Shahrokni A, Kingham TP, Patel SG, Audisio RA. Surgical considerations in older adults with cancer. J Clin Oncol. 2014;32(24):2647-2653
27. Powell HA, Tata LJ, Baldwin DR, Stanley RA, Khakwani A, Hubbard RB. Early mortality after surgical resection for lung cancer: An analysis of the English National Lung cancer audit. Thorax. 2013;68(9):826-834
28. Iversen LH, Ingeholm P, Go¨genur I, Laurberg S. Major reduction in 30-day mortality after elective colorectal cancer surgery: a nationwide population-based study in Denmark 2001-2011. Ann Surg Oncol. 2014;21(7):2267-2273
29. Lee CT, Dunn RL, Chen BT, Joshi DP, Sheffield J, Montie JE. Impact of body mass index on radical cystectomy. J Urol. 2004;172(4Pt 1):1281-1285
30. Kodera Y, Ito S, Yamamura Y, Mochizuki Y, Fujiwara M, Hibi K. et al. Obesity and outcome of distal gastrectomy with D2 lymphadenectomy for carcinoma. Hepatogastroenterology. 2004;51(58):1225-1228
31. House MG, Fong Y, Arnaoutakis DJ, Sharma R, Winston CB, Protic M. et al. Preoperative predictors for complications after pancreaticoduodenectomy: impact of BMI and body fat distribution. J Gastrointest Surg. 2008;12(2):270-278
32. Dindo D, Muller MK, Weber M, Clavien PA. Obesity in general elective surgery. Lancet. 2003;361(9374):2032-2035
33. Tjeertes EK, Hoeks SE, Beks SB, Valentijn TM, Hoofwijk AG, Stolker RJ. Obesity-a risk factor for postoperative complications in general surgery? BMC Anesthesiol. 2015;15:112
34. Zogg CK, Mungo B, Lidor AO, Stem M, Rios Diaz AJ, Haider AH. et al. Influence of body mass index on outcomes after major resection for cancer. Surgery. 2015;158(2):472-485
35. Chuang SY, Chang HY, Lee MS, Chia-Yu Chen R, Pan WH. Skeletal muscle mass and risk of death in an elderly population. Nutr Metab Cardiovasc Dis. 2014;24(7):784-791
36. Chuang SY, Hsu YY, Chen RC, Liu WL, Pan WH. Abdominal obesity and low skeletal muscle mass jointly predict total mortality and cardiovascular mortality in an elderly Asian population. J Gerontol A Biol Sci Med Sci. 2016;71(8):1049-1055
37. Martin L, Senesse P, Gioulbasanis I, Antoun S, Bozzetti F, Deans C. et al. Diagnostic criteria for the classification of cancer-associated weight loss. J Clin Oncol. 2015;33(1):90-99
38. Flint TR, Fearon DT, Janowitz T. Connecting the metabolic and immune responses to cancer. Trends Mol Med. 2017;23(5):451-464
39. Fleischmann E, Teal N, Dudley J, May W, Bower J, Salahudeen A. Influence of excess weight on mortality and hospital stay in 1346 hemodialysis patients. Kidney Int. 1999;55(4):1560-1567
40. O'Brien JM Jr, Phillips GS, Ali NA, Lucarelli M, Marsh CB, Lemeshow S. Body mass index is independently associated with hospital mortality in mechanically ventilated adults with acute lung injury. Crit Care Med. 2006;34(3):738-744
41. Curtis JP, Selter JG, Wang Y, Rathore SS, Jovin IS, Jadbabaie F. et al. The obesity paradox: body mass index and outcomes in patients with heart failure. Arch Intern Med. 2005;165(1):55-61
42. Gruberg L, Weissman NJ, Waksman R, Fuchs S, Deible R, Pinnow EE. et al. The impact of obesity on the short-term and long-term outcomes after percutaneous coronary intervention: the obesity paradox? J Am Coll Cardiol. 2002;39(4):578-584
43. Schmidt DS, Salahudeen AK. Obesity-survival paradox-still a controversy? Semin Dial. 2007;20(6):486-492
44. Fleming JB, Gonzalez RJ, Petzel MQ, Lin E, Morris JS, Gomez H. et al. Influence of obesity on cancer-related outcomes after pancreatectomy to treat pancreatic adenocarcinoma. Arch Surg. 2009;144(3):216-221
45. Hong S, Yi SW, Sull JW, Hong JS, Jee Sh, Ohrr H. Body mass index and mortality among Korean elderly in rural communities. Kangwha Cohort Study. PLoS One. 2015:26 10(2): e0117731
46. Carroll JP, Protani MM, Nguyen L, Cheng ME, Fay M, Saleem M. et al. Toxicity and tolerability of adjuvant breast cancer chemotherapy in obese women. Med Oncol. 2014;31(4):881
47. Furlanetto J, Eiermann W, Marmé F, Reimer T, Reinisch M, Schmatloch S. et al. Higher rate of severe toxicities in obese patients receiving dose-dense (dd) chemotherapy according to unadjusted body surface area: results of the prospectively randomized GAIN study. Ann Oncol. 2016;27(11):2053-2059
Author contact
![]() Corresponding author: Wen-Chi Chou, MD., Department of Medical Oncology, Chang Gung Memorial Hospital, 5 Fu-Hsing Street, Kwei-Shan Shiang, Taoyuan, Taiwan. Tel: 886-3281200 Ext 2517 Fax: 886-3-3285818; E-mail: wenchi3992com.tw
Corresponding author: Wen-Chi Chou, MD., Department of Medical Oncology, Chang Gung Memorial Hospital, 5 Fu-Hsing Street, Kwei-Shan Shiang, Taoyuan, Taiwan. Tel: 886-3281200 Ext 2517 Fax: 886-3-3285818; E-mail: wenchi3992com.tw