Impact Factor ISSN: 1837-9664

 Global reach, higher impact
J Cancer 2018; 9(18):3382-3393. doi:10.7150/jca.25136 This issue Cite
Research Paper
Compound Fuling Granule Suppresses Ovarian Cancer Development and Progression by disrupting mitochondrial function, galactose and fatty acid metabolism
Shanming Ruan1,#, Zhiqian Zhang2,3,#, Xinxin Tian2,4,#, Dawei Huang5,#, Wenhong Liu6, Bo Yang7, Minhe Shen1, Fangfang Tao6, ![]()
1. Department of Medical Oncology, First Affiliated Hospital of Zhejiang Chinese Medical University, Hangzhou 310003, Zhejiang, China
2. Tianjin International Joint Academy of Biomedicine (TJAB), Tianjin 300457, People's Republic of China.
3. State Key Laboratory of Medicinal Chemical Biology, Nankai University, Tianjin 300071, People's Republic of China.
4. Department of Biochemistry and Biophysics, Texas A&M University and Texas AgriLife Research, College Station, TX 77843-2128, USA.
5. Department of Chinese Medicine, First Affiliated Hospital of Zhejiang Chinese Medical University, Hangzhou 310003, Zhejiang, China
6. Department of Immunology and Microbiology, Basic Medical College, Zhejiang Chinese Medical University, Hangzhou, Zhejiang, China
7. School of Pharmacy, Zhejiang Chinese Medical University, Hangzhou, Zhejiang, China
# These authors contributed equally to this work and should be considered as co-first authors.
Received 2018-1-25; Accepted 2018-7-23; Published 2018-9-8
Abstract
Our previous studies have demonstrated that the compound fuling granule (CFG), a traditional Chinese medicine, suppresses ovarian cancer cell growth, migration and metastasis. However, the underlying mechanisms remain to be fully elucidated. In this study, we found that CFG could induce mitochondrial fragmentation, mitochondrial membrane potential reduction and cytochrome c release in ovarian SKOV3 cancer cells. In addition, both metabolomics and transcriptomics approaches were applied to illustrate the systemic mechanism of CFG on ovarian cancer formation and progression. To this end, we established two tumor-bearing mice models with subcutaneous injection or tail intravenous injection. Functionally, administration of CFG suppresses in situ tumor growth and distant lung metastasis. Subsequently, gas chromatography-mass spectrometry (GC-MS) was applied to determine the metabolic alterations among the plasma samples from these in vivo models. In the subcutaneous injection model, 26 distinguishable metabolites were identified and 12 metabolic pathways were reprogrammed. Meanwhile, 19 metabolites involved in 7 metabolic pathways showed significant differences in the tail intravenous injection model. Importantly, integrative metabolomics and transcriptomics analysis showed these metabolites were highly associated with galactose metabolism and fatty acid metabolism. This study suggests that CFG may suppress ovarian cancer cell proliferation and metastasis by regulating mitochondrion-related energy metabolisms.
Keywords: Compound fuling granule, Mitochondrion, Ovarian cancer, Galactose metabolism, Fatty acid metabolism
1. Introduction
As the most common gynecological malignancies, ovarian cancer is one of the greatest causes of tumor-associated death in women partially due to its insidious pathogenesis and late stage at diagnosis in most patients [1]. The incidence rate of ovarian cancer has been increasing gradually in these years and the current standard of care for ovarian cancer is an optimal cytoreductive surgery, followed by a chemotherapeutic management with a combination of paclitaxol and taxane [1]. However, due to the side effects of these medicines and the increasing tolerance of ovarian cancer, the efficacy of chemotherapy is limited. Therefore, it is necessary to identify more effective therapeutic methods for ovarian cancer.
Traditional Chinese medicine (TCM) has been clinically used in the treatment of cancer in China for a long time. During the treatment of cancer, TCM emphasizes the overall efficacy by inhibiting tumor cell as well as tumor environment to suppress tumor development and recurrence [2]. For advanced cancer patients or in those for whom radiotherapy and chemotherapy are unsuitable, TCM has its advantages. For instance, TCM can stabilize tumor lesions, enhance the quality of life, and prolong survival time with slight adverse reactions [3].
In previous study, we have developed a traditional Chinese medicine compound fuling granule (CFG) for the treatment of ovarian cancer. Clinically, the CFG can increase chemotherapy efficacy, reduce the incidence of distant metastasis and drug resistance and improve the quality of life. In vitro, we also found that CFG can suppress ovarian cancer cell proliferation and EMT. Meanwhile, the in vivo animal experiments also revealed that administration of CFG inhibits tumor growth and metastasis to lung [4]. However, the underlying mechanism remains poorly understood.
Mitochondrion is one of double-membrane cellular organelles responsible for producing the majority of energy, which is essential for cell survival [5-7]. The dysfunction of mitochondrion is widely recognized as an important tumor initiator and promoter [8-10]. A large body of studies has demonstrated that disruption of mitochondrial homoeostasis, including membrane fragmentation and metabolic disorder could promote tumor growth and progression. Particularly, mitochondrion has emerged as a critical regulator of metastatic competence in disparate tumors [11-14].
Metabolomics has been applied to explore altered metabolite profiles in disease and identify candidate metabolic biomarkers closely related to various pathological processes, which can help us to discover the mechanism of disease formation and progression [15]. Some metabolomics studies have been applied to ovarian cancer. For example, Xie et al. performed a metabolic analysis of 98 plasma samples of ovarian cancer patients based on the ultra-performance liquid chromatography mass spectrometry (UPLC/MS) systems and four metabolites (Kynurenine, Acetylcarnitine, PC (42:11), and LPE(22:0/0:0)) were selected as potential predictive biomarkers [16]. Zhang et al. collected pre-treatment plasma samples from 38 patients with stage III or IV epithelial ovarian cancer (EOC) and performed metabolic profiling by ultra-performance liquid chromatography mass spectrometry, which yielded five metabolites that were potential biomarkers for EOC recurrence: l-tryptophan, kynurenine, bilirubin, LysoPC (14 : 0) and LysoPE (18 : 2) [17].
In this study, we aimed to elucidate the role of mitochondrion dysfunction and altered serum metabolites and metabolic pathways in the regulatory effect of CFG on ovarian cancers. The purpose of this integrative metabolomics and transcriptomics analysis was to identify the possible mechanisms underlying CFG against ovarian cancer development and progression.
2. Materials and Methods
2.1 Cell culture
HEY-T30 and SKOV3 cell lines were obtained from American Type Culture Collection (ATCC, Manassas, VA, USA) and cultured as described.
2.2 Preparation of CFG
The preparation method of CFG has been mentioned in our previous publication [4]. Briefly, herbs were supplied by Zhejiang Provincial Hospital of TCM (Zhejiang, China), and identified by Associate Professor Hong Wang, College of Pharmaceutical Sciences, Zhejiang Chinese Medical University. Their Chinese names, English names, Latin names, family, part used, place of origin, voucher number and daily adult doses (g) are presented in the Table 1 of this publication. Briefly, the four constituent herbs were combined in the ratio of 1:1:1:1, and extracted with 75% ethanol (1:10, w/w) twice, 1 h each time.
List of differential metabolites extracted from serum samples in the CFG administrated groups compared to controls with the s.c. injection of SKOV3 cells.
| match | name | VIP | mz | rt | t-test | Fold change [Log2(CFG/Control)] |
|---|---|---|---|---|---|---|
| 941 | 1,4-Benzenedicarboxylic acid | 1.804 | 310.1418 | 24.393 | 0.001 | -0.548 |
| 935 | Propanoic acid | 1.469 | 66.0999 | 9.478 | 0.016 | -1.005 |
| 918 | Silanol | 1.600 | 317.1196 | 16.487 | 0.007 | 0.505 |
| 914 | Cholesterol trimethylsilyl ether | 1.407 | 354.3511 | 41.168 | 0.022 | -1.175 |
| 906 | Butanoic acid | 1.829 | 233.1683 | 12.799 | 0.001 | -0.596 |
| 902 | Octadecanoic acid | 1.877 | 355.3621 | 32.602 | 0.001 | -0.845 |
| 892 | Hexadecanoic acid | 1.686 | 83.1227 | 29.518 | 0.004 | -0.925 |
| 888 | Pentasiloxane | 1.292 | 370.1511 | 13.170 | 0.039 | -0.421 |
| 885 | Linoleic acid | 1.607 | 93.1055 | 32.151 | 0.007 | -0.637 |
| 877 | L-Proline | 1.623 | 156.1665 | 20.861 | 0.006 | -0.425 |
| 876 | Tetrasiloxane | 1.494 | 127.2066 | 9.315 | 0.014 | -0.782 |
| 862 | Oleic acid | 1.823 | 264.3039 | 32.232 | 0.001 | -1.130 |
| 859 | Hexadecane | 1.555 | 99.2021 | 20.443 | 0.010 | -1.029 |
| 857 | Heptadecane | 1.435 | 71.1308 | 23.242 | 0.019 | -0.851 |
| 833 | Tetradecanoic acid | 1.403 | 285.2766 | 25.328 | 0.023 | -0.827 |
| 824 | D-Glucose | 1.442 | 263.4401 | 28.440 | 0.003 | -0.417 |
| 819 | Myo-Inositol | 1.665 | 318.1939 | 34.472 | 0.005 | -0.496 |
| 805 | d-Galactose | 1.358 | 228.1927 | 26.155 | 0.029 | -0.513 |
| 798 | Acetamide | 1.285 | 101.0211 | 5.635 | 0.040 | 0.403 |
| 762 | Heptadecanoic acid | 1.536 | 327.2898 | 31.197 | 0.011 | -0.460 |
| 748 | Creatinine | 1.309 | 329.1995 | 21.303 | 0.036 | 0.573 |
| 747 | Cyclotrisiloxane | 1.239 | 249.1651 | 13.901 | 0.050 | -0.591 |
| 736 | Methylenebis(2,4,6-triisopropylphenylphosphine) | 1.315 | 443.3269 | 44.674 | 0.035 | -0.670 |
| 735 | Glycerol | 1.295 | 205.1869 | 16.498 | 0.039 | -0.809 |
| 712 | Methyl 2-[2-(4-chlorophenyl)-5-methyl-1H-imidazol-1-yl]dithiobenzoate | 1.359 | 311.1299 | 10.206 | 0.029 | -1.091 |
| 702 | 2H,8H-Benzo[1,2-b:5,4-b']dipyran-2-one | 1.591 | 311.2746 | 29.027 | 0.008 | -0.486 |
2.3 Clonogenic formation assay
HEY-T30 and SKOV3 cells were treated with different concentrations of CFG treatment (0, 1.5 and 3 mg/ml) for 24 h. Then the treated cells (100 cells/well) were placed into 6-well plates and incubated at 37°C for 2 weeks, fixed and stained with crystal violet. The mean ±SD number of colonies was counted under a microscope (Zeiss, Jena, Germany) from three independent replicates.
2.4 Transwell migration and invasion assays
For the cell migration assay, HEY-T30 and SKOV3 cells were treated with different concentrations of CFG treatment (0, 1.5 and 3 mg/ml) for 24 h. Then the treated cells (5×10⁴ cells per insert) were suspended in 200 µl of basic medium and seeded into the upper chamber of each insert. Then, 500 µl of culture medium containing 10% FBS (Gibco, Carlsbad, CA, USA) was added to a 24-well plate. After incubation at 37°C for 24 h, the cells that migrated were fixed and stained for 15 min in a 0.25% Crystal Violet solution (Sigma, Shanghai, China) in PBS. For cell invasion assay, chambers were pre-coated with 50 µl of Matrigel (BD Bioscience, Bedford, MA, USA) diluted with 3 volumes of DMEM (Gibco) and incubated at 37°C for 30 min. Then, 5×10⁴ cells were suspended in 200 µl of basic medium and seeded in the upper chambers, and 500 µl of culture medium containing 10% FBS was added to the lower chamber. After incubation at 37°C for 36 h, the cells were fixed and stained.
2.5 Transmission electron microscope
SKOV3 cells were treated with 3.0 mg/ml of CFG treatment for 24 h. Then the treated cells were washed with warm PBS and prefixed in 0.2% paraformaldehyde and 0.25% glutaraldehyde for 15 min at room temperature. Prefixed cells were centrifuged and resuspended in ice-cold 2% paraformaldehyde and 2.5% glutaraldehyde overnight. Cells pellets were washed with 0.1 M Sorensen's sodium phosphate buffer (SPB), pH 7.4 for 15 min at room temperature. Post-fixing was carried out in 1% OsO4 and 1.5% K4Fe(CN) in SPB for 1 h. After dehydration an ascending alcohol (70%, 80%, 95% and 100%), the cells were embedded in Poly/Bed 812 resin (Pelco), polymerized, and observed under a JEOL JEM-1230 transmission electron microscope (Peabody, MA, USA).
2.6 Determination of mitochondrial transmembrane potential
SKOV3 cells were treated with 3.0 mg/ml of CFG treatment for 24 h. Then the treated cells (5000 cells/well) were seeded into 24-well plates with round glass coverslips and incubated with JC-1 stain (Beyotime, Shanghai, China) and incubated for 30 min. For taking images of JC-1 monomers, the live cell bioimager (BD Biosciences) was set at 514 nm excitation and 529 nm emission wavelengths, and for J- aggregates, the wavelengths were set at 585 nm excitation and 590 nm emission.
2.7 Immunofluorescence staining and confocal imaging
SKOV3 cells were treated with 3.0 mg/ml of CFG treatment for 24 h. Then the treated cells were incubated with 20 nM Mitotraker Red (Beyotime) for 30 min at 37 °C, fixed with 4% paraformaldehyde for 2 h, and permeabilized with 0.2% Triton X-100 for 10 min. After blocked with 10% bovine serum albumin (BSA; Beyotime) for 2 h, cells were incubated with cytochrome c primary antibody (Byeotime) at 4 °C overnight and incubated with FITC-conjugated secondary antibodies (Beyotime). Locations of mitochondria and Cytochrome c were visualized by a confocal microscope (LSM 700; Zeiss, Jena, Germany).
2.8 Gene expression profiling and analysis
The microarray was performed as previously described [4]. Briefly, total RNA was extracted from 3 mg/ml CFG-treated SKOV3 cells and DMSO-treated control cells using trizol reagent (Invitrogen, Carlsbad, San Diego, USA) following the manufacturer's protocol. The amplified RNA was prepared with the GeneChip 3' IVT Express Kit (Affymetrix Inc., Santa Clara, CA, USA). The amplified transcripts were then hybridized to an Affymetrix 901838 GeneChip PrimeView Human Gene Expression Array for 16 h in a GeneChip Hybridization Oven. Arrays were washed and stained by a GeneChip Fluidics Station 450 and scanned by a GeneChip Scanner 3000. All the raw data were imported into GeneSpring GX 11.0.1 and analyzed. Unsupervised hierarchical clustering of genes was applied and heatmaps were constructed by the freely available MeV software: multiExperiments Viewer, which is a part of the TM4 Microarray Software Suite (http://www.tm4.org/mev/). The microarray data has been submitted to GEO database and the GEO ID is GSE79454.
2.9 Animals and treatment
All animal experiments were performed with the approval of local ethical committee of Zhejiang Chinese Medical University and conducted in accordance with the relevant guidelines of Animal Center of Zhejiang Chinese Medical University. The BALB/c (nu/nu) mice were maintained in a specific pathogen free laboratory under standard conditions of humidity and temperature in a 12 h light/12 h dark cycle and fed food and water ad libitum. The mice (female, 6 weeks old) were purchased from Beijing Vital River Laboratories (Beijing, China) and maintained in our laboratory for one week. Mice were randomly divided into 4 groups, 8 animals for each group. (1) Control group with subcutaneous injection of SKOV3 cells. 100 μl PBS was administered by intragatric gavage daily for 44 days. 1×10⁷ SKOV3 cells were inguinal subcutaneous injected once in the 15th day. (2) CFG group with subcutaneous injection. 30 mg/kg CFG was administered by intragastric gavage daily for 44 days. 1×10⁷ SKOV3 cells were inguinal subcutaneous injected once in the 15th day. (3) Control group with tail intravenous injection of SKOV3 cells. 100 μl PBS was administered by intragatric gavage daily for 44 days. 1×10⁷ SKOV3 cells were tail intravenous injected in the 15th day. (4) CFG group with tail intravenous injection. 30 mg/kg CFG was administered by intragastric gavage daily for 44 days. 1×10⁷ SKOV3 cells were tail intravenous injected in the 15th day. To alleviate pain, all mice were anesthetized with isoflurane (5% for induction and 2% for maintenance) before injection with tumor cells. At the euthanasia procedure, the mice were anesthetized by i.p. injection of 100 mg/kg pentobarbital sodium.
2.10 Monitoring of the tumor growth
Sizes of tumor from subcutaneously injected mice were measured in two dimensions with external calipers every two days from the day 10 post SKOV3 injection. Tumor volumes were calculated from calipers measurements with the formula of tumor volume = (W2×L) ×1/2 as W is the minor dimension and L is the major dimension of the tumor size. Mice were euthanized, and lungs as well as solid tumors were collected for further examination.
2.11 Terminal deoxynucleotidyl transferase dUTP nick end labeling (TUNEL)
The TUNEL assay was performed on tumor tissue as a measurement of in situ apoptosis. Sectioned and fixed tumor samples were processed using the In Situ Apoptosis Detection Kit (Takara Bio Inc., Shiga, Japan) according to manufacturer's instructions. Negative controls were also obtained for each sample by omission of incubation with the TUNEL reaction mixture. The image and photographs were obtained under a light microscopy.
2.12 Calculation of metastases in lung tissues
At the 44th day, lung tissues were harvested and fixed with 10% formalin. The fixed tissues were then sectioned (8μm) and stained with H&E. The number of metastases in each of five fields was counted and added together as the number of metastases per lung section.
2.13 Serum sample collection
Mouse serum samples were collected from the retro-orbital sinus from anesthetized mice with sterile tubes. Then the fresh blood samples were stayed at 4 °C for 30 min and centrifuged at 3000 rpm for 15 min. Supernatant was collected into fresh tubes and stored at -80°C until further analysis. For the GC-MS analysis, 1 ml of pre-cooled methanol was added to 100 μl of serum samples and gently mixed for 30 s. Ten μl of L-Phenylalanine was added as an internal standard. The sample mixture was then centrifuged at 3000 rpm for 15 min at 4°C. 200 μl of supernatant was blown to dryness under a gentle nitrogen flow. Then, samples were derivatized by 30 μl methoxyamine hydrochloride (20 mg/ml in pyridine, 2 h, 37°C) and 30 μl N,O-Bis(trimethylsilyl)-trifluoroacetamide (MSTFA) (1% N-Trimethysilylimidazole included, 1 h, 70°C), for GC-MS analysis.
2.14 GC-MS analysis of CRC serum samples
One microliter of each sample was injected into the GC (Agilent 7890A /5975C) system in the splitless mode. GC separation was conducted on a capillary column HP-5MS (30 m × 0.25 mm × 0.25 μm, Agilent J&W Scientific, USA). The injector temperature was controlled at 280 °C and the split rate of the injector was 1:50. Helium was used as a carrier gas at a constant flow rate of 1.0 ml/min. The initial column temperature was kept at 80 °C for 2 min, and then, the temperature was increased to 320 °C at a rate of 10 °C/min held there for 6 min. The ion-source temperature was controlled at 230 °C. Mass spectra were recorded from m/z 50 to 550 at a rate of 2 s in full scan mode, and the solvent delay time was 3 min.
2.15 Data processing and multivariate data analysis
The GC-MS data was processed using the automatic mass spectral deconvolution and identification system (AMDIS, version 2.71) and the metabolomics ion-based data extraction algorithm (MET-IDEA, version 2.08). Multivariate data analysis was achieved on the normalized GC-MS datasets with software package SIMCA-P (version 13.0, Umetrics, Sweden). The Variable Importance in the Projection (VIP) value (VIP > 1) was used to evaluate the variable contribution and identify the potential biomarkers. The metabolite set enrichment and integrated metabolic pathway analyses were performed by using online software MetaboAnalyst (http://www.metaboanalyst.ca/).
2.16 Isolation of mitochondria and determination of d-Glucose, Galactose and free fatty acids
The mitochondria of treated HEY-T30 and SKOV3 cells were isolated by using the Cell Mitochondria Isolation Kit (Beyotime). The d-Glucose, Galactose and free fatty acids concentrations of isolated mitochondria were determined by using the Glucose Detection Kit (Leagene, Beijing, China), Galactose Assay Kit (Biovision, San Francisco, USA), Free fatty acid Detection Kit (Solarbio, Beijing, China) respectively.
2.17 Statistical analysis
The univariate statistical analysis was performed by SPSS 19.0 for further identification of potential biomarkers, including box figure analysis and analysis of variance (ANOVA), and p-value was set as 0.05 for statistical significance.
3. Results
3.1 CFG significantly suppresses ovarian cancer initiation and progression both in vitro and in vivo
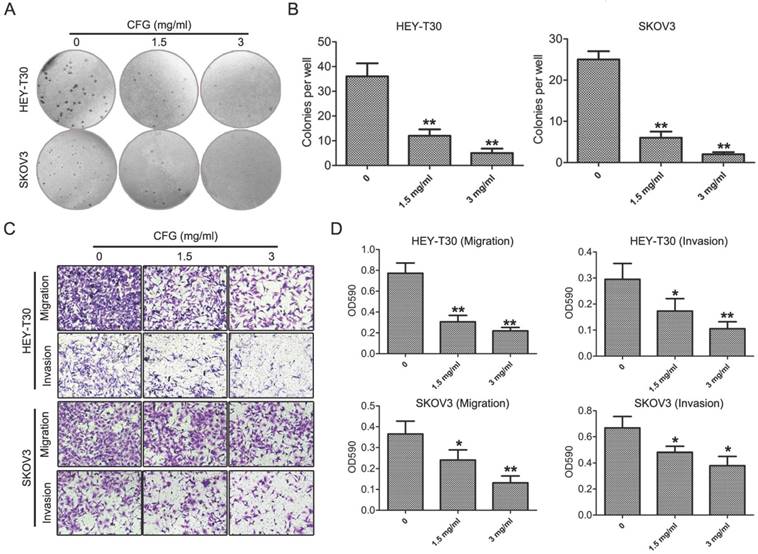
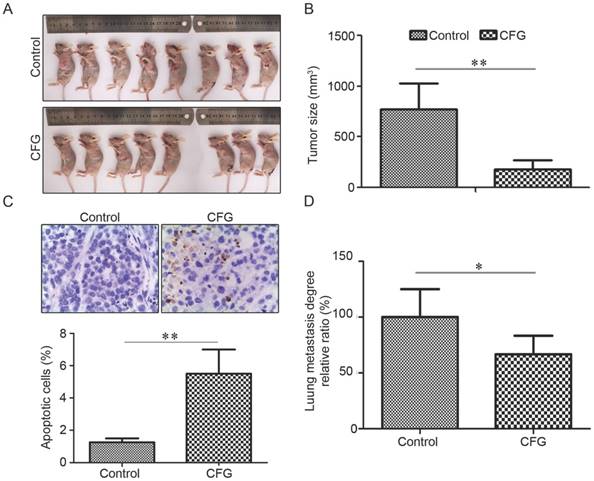
Firstly, to confirm the inhibitory effect of CFG on ovarian cancer formation and development. Clonogenic formation, migration and invasion assays were performed in HEY-T30 and SKOV3 cells with different concentrations of CFG treatment (0, 1.5 and 3 mg/ml). As expected, CFG treated obviously suppressed cellular colony formation and invasion and migration abilities in a dose-dependent manner (Fig. 1A-D). In vivo, SKOV3 cells were subcutaneously or tail intravenously injected into the BALB/c (nu/nu) mice. The images of the tumor-bearing mice in Fig. 2A were taken from the animal subcutaneously injected with ovarian cancer SKOV3 with aforementioned treatment and get euthanasia at the 44th day. Fig. 2B showed the tumor sizes in the 44th day. Both of them confirmed that CFG reduced ovarian tumor xenograft growth in vivo. Meanwhile, we determined the apoptotic rates of these tumors with TUNEL staining and revealed that CFG significantly promoted tumor cell apoptosis in vivo (Fig. 2C). Tail intravenously injection of SKOV3 cells with aforementioned treatment into nude mice also showed less metastases in the CFG-treated mice (Fig. 2D). Totally, these results prove that CFG significantly suppresses ovarian cancer initiation and progression both in vitro and in vivo and suggest our models have been successfully established and the serum samples is able to be applied for metabolomics analysis in the next step.
CFG suppresses cellular clony formation, invasion and migration in vitro. (A and B) HEY-T30 and SKOV3 cells were treated with CFG for 24 h (0, 1.5 and 3 mg/ml) and subjected to clonogenic assay (A) and the numbers of colonies were measured (B). *, p<0.05. **, p<0.05. (C and D) Migration and invasion abilities of CFG-treated HEY-T30 and SKOV3 cells were measured with the Boyden chamber assay (C). Cell migration and invasion toward the lower face of the filter were quantified (D). *, p<0.05. **, p<0.05.
CFG administration ameliorates the growth and metastasis of ovarian cancer cells in vivo. (A) Representative images of tumor formation in control and CFG administrated SKOV3 tumor-bearing mice with s.c. injection. The mice were euthanized on the 44th day with injection of SKOV3 cells and aforementioned treatment. (B) The tumor sizes of different groups at the 44th day with aforementioned treatment (*p<0.05, **p<0.01). (C) TUNEL assay to show the apoptotic cells in the tumor tissues with indicated treatment at 400× magnification. Lower layer shows the percentage of apoptotic cells in each group. (D) Relative ratio of incidence of lung metastasis in the i.v. injection model was compared using chi-square analysis. *, p<0.05.
3.2 CFG induces mitochondrial dysfunction in ovarian SKOV3 cancer cells
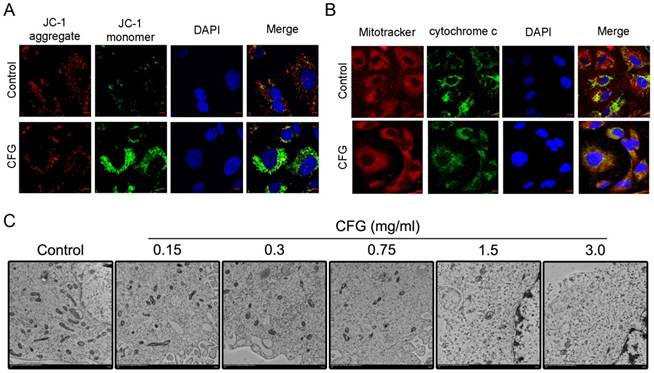
To determine whether CFG regulate mitochondrial function, we examined the mitochondrial transmembrane potential change of CFG-treated SKOV3 cells (3 mg/ml) with JC-1 staining. Significantly, increased amounts of JC-1 monomers (green fluorescence) demonstrated that CFG cells exhibited depolarized ΔΨm (Fig. 3A). In addition, we also examined the cytochrome c distributions in CFG-treated cells (3 mg/ml). Immunostaining showed that there was increased cytochrome c release into cytosol in CFG-treated cells compared with the wild type SKOV3 cells (Fig. 3B). Importantly, Transmission electron microscope also demonstrated mitochondria degradation with CFG-treatment in SKOV3 cells (Fig. 3C).
Mitochondrial dysfunction in CFG-treated SKOV3 cells. (A) Photograph showing JC-1 red, JC-1 green and merge image to demonstrate the effect of CFG on mitochondrial transmembrane potential in SKOV3. Scale bars, 20 µm. (B) Confocal microscopy to show the Cytochrome c distribution in CFG-treated cells. Scale bars, 20 µm. (C) Representative TEM images to show the mitochondrial shape. Scale bars, 500 nm.
To evaluate the function of mitochondria on ovarian cancer cell development and progression, we treated the ovarian cancer HEY-T30 and SKOV3 cells with 10 µM of mitochondrial division inhibitor 1 (mdivi-1) for 16 h. We found that mdivi-1 treatment significantly inhibited colony formation (Fig. S1A-B), cell proliferation (Fig. S1C-D) and migration (Fig. S1E-F) in HEY-T30 and SKOV3 cells, suggesting that mitochondria dysfunction impairs ovarian cancer initiation and progression in vitro.
3.3 Multivariate analysis of GC-MS results of Serum: Discrimination between control and CFG-administrated groups
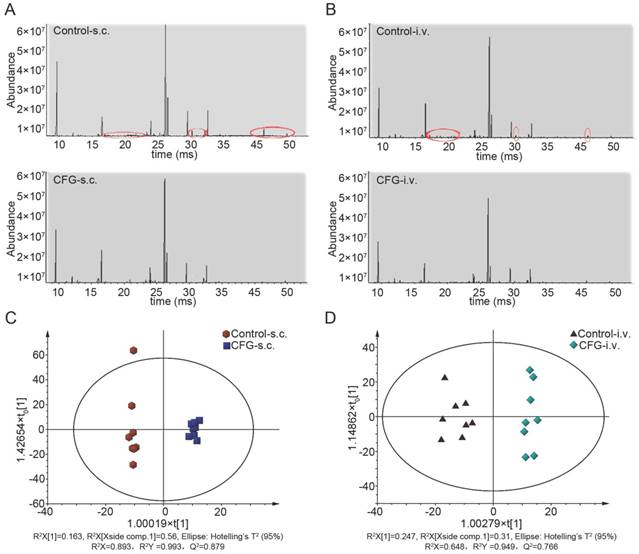
The representative TIC chromatograms of serum samples derived from the control tumor-bearing mice and CFG-administrated tumor-bearing mice were shown in Fig. 4A and 4B (Fig. 4A: subcutaneous injection; Fig. 4B: tail intravenous injection). The peaks of 26 distinguishable compounds in the s.c. injection model and 19 compounds in the i.v. injection model were identified by the spectrums of the known standards (red ellipses labelled). The GC-MS results for serum samples were then subjected to multivariate data analysis to unravel changes in the serum metabolic profiles in tumor-bearing mice with administration of CFG compared to tumor-bearing controls. The scores of orthogonal partial least-squares discriminant analysis (OPLS-DA) for all groups were obtained and presented in Fig. 4C (s.c. model) and Fig. 4D (i. v. model). The scattered score plot of OPLS-DA revealed that controls were well distinguishable from CFG-administrated groups.
Representative serum GC/MS TIC chromatograms and the scores plots of OPLS-DA. (A and B) The representative serum GC/MS TIC chromatogram of control and CFG administrated SKOV3 tumor-bearing mice with s.c. injection (A) or with i.v. injection (B); (C and D) OPLS-DA scores plots of control and CFG administrated SKOV3 tumor-bearing mice with s.c. injection (C) or with i.v. injection (D). The red circles indicated the peak of metabolites which was decreased in the CFG treatment group compared with the control group.
3.4 Metabolite sets enrichment analysis to identify common alteration of metabolites and metabolic pathways in subcutaneous injection model and those in tail intravenous injection model
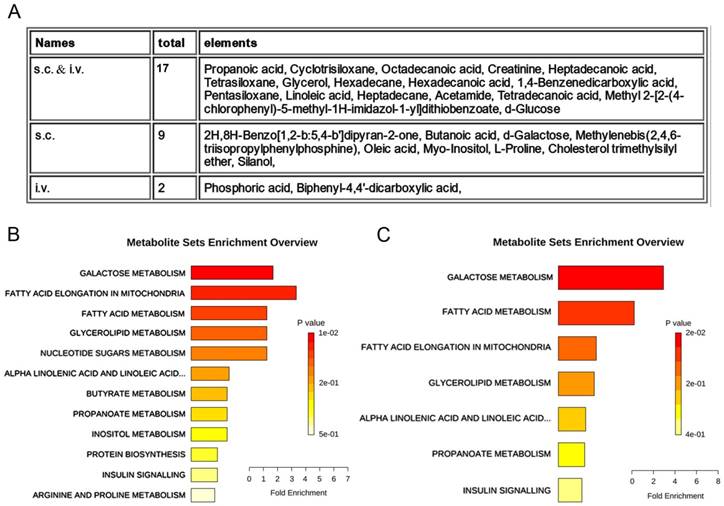
We further compared the distinguishable compounds in the s.c. injection model with those in the i.v. injection model. These differential metabolites could be divided into three categories, i.e., 18 common metabolites screened out in both s.c. and i.v. injection models, 9 metabolites screened out especially in the s.c. injection model and only 2 metabolites characteristically screened out in the i.v. injection model (Fig. 5A, Table 1 and 2). Pathway enrichment analysis using these deregulated metabolites showed that CFG induced alteration of 12 metabolic pathways in the s.c. injection model and 7 metabolic pathways in the i.v. injection model (Fig. 5B and 5C). Particularly, galactose metabolism and fatty acid metabolism were the most enriched pathways both in the s.c. injection model and in the i.v. injection model (Fig. 5B and 5C), indicating these pathways may participate in regulating ovarian tumor cell proliferation and metastasis by CFG.
Differential serum metabolites and metabolic pathways between control and CFG administrated SKOV3 tumor-bearing mice with s.c. injection or with i.v. injection. (A) metabolomics analysis to identify metabolites responsible for the differences between control and control and CFG administrated SKOV3 tumor-bearing mice, in which, 17 common metabolites screened out in both s.c. and i.v. models, 9 metabolites screened out especially in the s.c. injection model and only 2 metabolites characteristically screened out in the i.v. injection model. (B and C) Enrichment by pathway-associated metabolite sets determined from VIP significant and t test significant metabolites identified. Significance was determined as p<0.05.
List of differential metabolites extracted from serum samples in the CFG administrated groups compared to controls with the i.v. injection of SKOV3 cells.
| match | name | VIP | mz | rt | t-test | Fold change [Log2(CFG/Control)] |
|---|---|---|---|---|---|---|
| 941 | 1,4-Benzenedicarboxylic acid | 1.794 | 295.1034 | 24.393 | 0.000 | -0.483 |
| 935 | Propanoic acid | 1.381 | 55.0993 | 9.471 | 0.005 | -0.397 |
| 915 | Phosphoric acid | 1.139 | 315.1044 | 23.928 | 0.027 | -0.520 |
| 914 | Acetamide | 1.453 | 221.1215 | 5.860 | 0.002 | -0.497 |
| 909 | Glycerol | 1.170 | 71.1337 | 16.523 | 0.023 | -0.380 |
| 902 | Octadecanoic acid | 1.715 | 145.1010 | 32.599 | 0.000 | -0.281 |
| 892 | Hexadecanoic acid | 1.638 | 98.1138 | 29.520 | 0.000 | -0.386 |
| 888 | Pentasiloxane | 1.325 | 281.0984 | 13.166 | 0.008 | -0.238 |
| 885 | Linoleic acid | 1.232 | 93.1055 | 32.151 | 0.015 | -0.539 |
| 876 | Tetrasiloxane | 1.830 | 207.0890 | 9.313 | 0.000 | -0.458 |
| 859 | Hexadecane | 1.636 | 85.2001 | 20.447 | 0.000 | -0.503 |
| 857 | Heptadecane | 1.210 | 71.1308 | 23.242 | 0.017 | -0.274 |
| 833 | Tetradecanoic acid | 1.153 | 285.2766 | 25.328 | 0.025 | -0.541 |
| 824 | D-Glucose | 1.331 | 263.4401 | 28.440 | 0.014 | -0.251 |
| 781 | Biphenyl-4,4'-dicarboxylic acid | 1.229 | 371.3141 | 36.157 | 0.015 | -0.330 |
| 762 | Heptadecanoic acid | 1.353 | 327.2898 | 31.197 | 0.006 | -0.540 |
| 748 | Creatinine | 1.072 | 329.1995 | 21.303 | 0.040 | -0.602 |
| 747 | Cyclotrisiloxane | 1.460 | 249.1651 | 13.901 | 0.002 | -0.365 |
| 712 | Methyl 2-[2-(4-chlorophenyl)-5-methyl-1H-imidazol-1-yl]dithiobenzoate | 1.617 | 311.1299 | 10.206 | 0.000 | -0.812 |
3.5 Comprehensive metabolomics and transcriptomics analysis reveals that CFG inhibits ovarian cancer cells proliferation and metastasis may through regulating the function of mitochondria
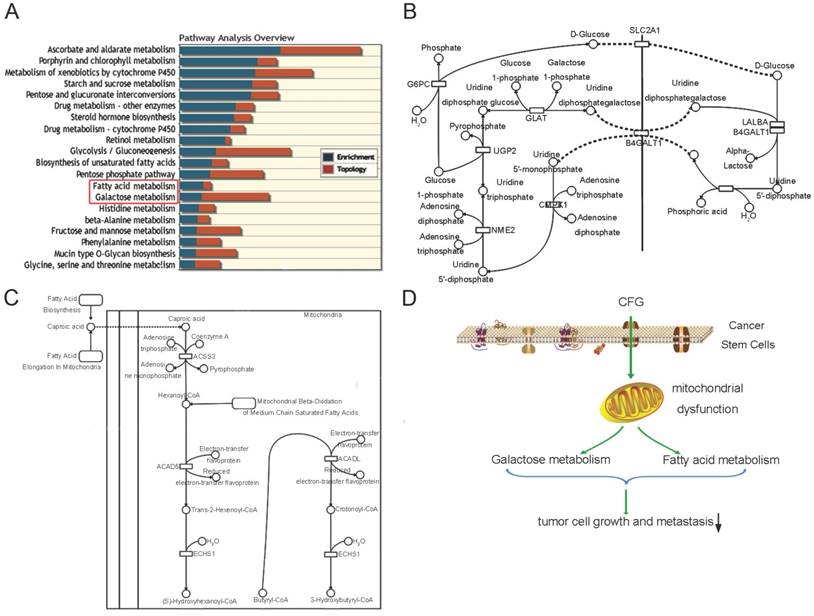
Metabolites and genes in the same pathways were always dysregulated together, so we next carried out an integrative analysis by combining the metabolomics data with the microarray results reported in our previous study (Fig. 6A). In that literature, we performed a microarray data analysis to identify differentially expressed genes in CFG-treated SKOV3 cells compared with wild type SKOV3 cells. The comprehensive analysis results also showed that the reprogrammed pathways were mainly involved in carbohydrate metabolism (including metabolisms of sucrose, fructose, galactose (Fig. 6B) and glycolysis), fatty acid metabolism (including biosynthesis of unsaturated fatty acids and saturated fatty acids (Fig. 6C)). Although, the metabolomics and transcriptomics study were generated from different samples and technology platforms, a lot of metabolites and genes in the same pathways were found differentially in the network of these pathways. This result can further increase the credibility of our selected metabolites and pathways. These complementary studies provide insights into mechanisms supporting the suppressive role of CFG in ovarian tumor formation and progression (Fig. 6D).
An comprehesive metabolomics and transcriptomics study to identify metabolic pathway alterations in CFG treatment of ovarian tumor-bearing mice in vivo. (A) Integrative co-analysis of metabolomics and transcriptomics. Significance was determined as p<0.05. (B) Pathway illustration of galactose metabolism. (C) Pathway illustration of fatty acid elongation, oxidation and metabolism. (D) A Schematic to show the differential metabolic pathways involved in CFG treatment of ovarian cancer.
To determine the metabolites such as galactose and fatty acid are derived the mitochondria of ovarian cancer cells, and the effect of CFG on the metabolism of galactose and fatty acid in mitochondria, we isolated the mitochondria of HEY-T30 and SKOV3 cells treated with 3 mg/ml CFG and detected the content of d-Glucose, Galactose and free fatty acids in these samples. The results demonstrated that CFG treatment significantly suppressed the expression of d-Glucose, Galactose and free fatty acids in the mitochondria of these ovarian cancer cells (Fig. S2), which is consistent with the GC-MS results in vivo.
4. Discussion
Traditional Chinese Medicine (TCM) and Western Medicine are two different forms of healing art that use different methods of treating and eradicating diseases, including cancer. In contrast to western medicine, TCM does not specially target a single target but to emphasize on the integrity of the human body and the relationship between the human and the social and natural environments [18]. Recent studies suggest that several of the traditional Chinese medicines and medical therapies are very effective for the treatment or supportive care of tumor patients [19]. TCM therapy, which has been effective in treating ovarian cancer and improving patient quality of life, is characterized by treatment based on “syndrome differentiation” (also named ZHENG). Correct TCM syndrome differentiation is the most important principle guiding the prescription of Chinese herbal formulae, and incorrect classification may result in serious consequences [20, 21]. In these years, metabolic profiling is widely used in TCM syndrome differentiation. For instance, Wu et al. reported that deregulation of glucose metabolism in diabetic individuals, which might help in DM diagnosis and TCM syndrome differentiation [22]. Our previous studies also identified a series of unique metabolic biomarkers in ovarian cancer patients with Yin deficiency or Qi deficiency compare with patients with no deficiency (data not shown). In the present study, several distinguishable metabolites and reprogrammed pathways were identified in CFG treatment of ovarian cancer. It is believed that these metabolites and pathways may play a critical role in improving syndromes of ovarian cancer by CFG.
In this article, we employed plasma metabolomics with GC-MS to distinguish CFG administrated ovarian tumor mice from non-treated control mice. A good separation between these two groups was achieved, in which 26 up- or down-regulated metabolites were identified in the s.c. injection model and 19 compounds were identified in the i.v. injection model. Very interestingly, we observed that 9 metabolites screened out especially in the s.c. injection model and only 2 metabolites characteristically screened out in the i.v. injection model. These data showed that increased alteration occurred in the s.c. injection model compared with those in the i.v. injection model.
Based on our results, we can easily infer these significant changes, related to energy metabolism in the mitochondrion. Among them, carbohydrate metabolism and fatty acid metabolism were the most enriched pathways. Multiple studies have been demonstrated that both carbohydrate metabolism and fatty acid metabolism are related to ovarian cancer. For instance, certain genetic or biochemical features of galactose metabolism may influence disease risk for particular types of ovarian cancer based on a case-control study [23]. One of fundamental properties of cancer cells is that they underwent metabolic reprogramming from oxidative phosphorylation to aerobic glycolysis during carcinogenesis [24, 25]. In this article, we found that the activities of both galactose metabolism and glycolysis were decreased in the tumor-bearing mice with administration of CFG. These results are in accordance with previous studies mentioned above.
Saturated fatty acids were reported to be possible important metabolites for epithelial ovarian cancer based on the free and esterified fatty acid profiles determined by GC-MS analysis [26]. Fatty acid synthase (FASN), the enzyme responsible for de novo lipogenesis, is overexpressed in tumors including ovarian cancer and is considered a useful tumor marker. Our study demonstrates that both fatty acid elongation in mitochondria and fatty acid metabolism are regulated by CFG, which indicated that the decrease of fatty acids may be a specific biomarker for the efficacy of CFG in treatment of ovarian cancer.
On the other hand, the concentration of CFG for the in vitro study is 1.5 and 3 mg/ml, while the dose 30 mg/kg was applied for the in vivo study. Actually, we have tried orally administrate the CFG with 1.5 mg/ml or 3 mg/ml into the ovarian cancer-bearing mice. However, the results demonstrated that CFG has little effect on the majority of mice. We suppose that cell lines should be more sensitive to drug treatment than mice. Therefore, we determined to increase the drug concentration for the in vivo experiment. In addition, to eliminate the effect of weight differences of mice, we calculated the dose unit as milligram per kilogram of mice (mg/kg). After several cycles of preliminary experiments with administration of CFG into mice at different doses, we found that the dose 30 mg/kg is the appropriate concentration for the in vivo experiment.
Supplementary Material
Supplementary figures.
Acknowledgements
Program for the Cultivation of Youth talents in China Association of Chinese Medicine (Shanming Ruan, no. QNRC2-C08, http://www.cacm.org.cn/); Zhejiang Provincial Program for the Cultivation of High-Level Innovative Health Talents (Shanming Ruan, no.2015-43, http://www.zjwjw.gov.cn/); Zhejiang Provincial Program for the Cultivation of the Young and Middle-Aged Academic Leaders in Colleges and Universities (Shanming Ruan, no.2017-248, http://www.zjedu.gov.cn/); Zhejiang Provincial Project for the key discipline of traditional Chinese Medicine (Yong Guo,no,2017-XK-A09, http://www.zjwjw.gov.cn/); China Postdoctoral Science Foundation Grant (2015M581292, 2018M630694).
Author contributions
F. T. designed the study. S. R., Z. Z., X. T., D. H., B. Y. and M. S. performed the in vitro and in vivo experiments in Figure S1 and S2. Z. Z., X. T. and B. Y. conducted the TEM and confocal in Figure 1. S. R. and Z. Z. performed the in metabolomics study in Figure 2, 3 and 4. Z. Z. drew the schematic image in Figure 4D.
Competing Interests
The authors have declared that no competing interest exists.
References
1. Suh DH, Kim M, Kim K, Kim HJ, Lee KH, Kim JW. Major clinical research advances in gynecologic cancer in 2016: 10-year special edition. Journal of gynecologic oncology. 2017;28:e45
2. Ma L, Wang B, Long Y, Li H. Effect of traditional Chinese medicine combined with Western therapy on primary hepatic carcinoma: a systematic review with meta-analysis. Frontiers of medicine. 2017
3. He YH. General survey of traditional Chinese medicine and Western medicine researches on tumor metastasis. Chinese journal of integrative medicine. 2006;12:75-80
4. Tao F, Ruan S, Liu W, Wang L, Xiong Y, Shen M. Fuling Granule, a Traditional Chinese Medicine Compound, Suppresses Cell Proliferation and TGFbeta-Induced EMT in Ovarian Cancer. PLoS One. 2016;11:e0168892
5. Tokarz P, Blasiak J. Role of mitochondria in carcinogenesis. Acta Biochim Pol. 2014;61:671-8
6. Eirin A, Lerman A, Lerman LO. Mitochondria: a pathogenic paradigm in hypertensive renal disease. Hypertension. 2015;65:264-70
7. Kasahara A, Scorrano L. Mitochondria: from cell death executioners to regulators of cell differentiation. Trends Cell Biol. 2014;24:761-70
8. Giampazolias E, Tait SW. Mitochondria and the hallmarks of cancer. FEBS J. 2016;283:803-14
9. Chen ZP, Li M, Zhang LJ, He JY, Wu L, Xiao YY. et al. Mitochondria-targeted drug delivery system for cancer treatment. J Drug Target. 2016;24:492-502
10. Argiles JM, Lopez-Soriano FJ, Busquets S. Muscle wasting in cancer: the role of mitochondria. Curr Opin Clin Nutr Metab Care. 2015;18:221-5
11. Verschoor ML, Ungard R, Harbottle A, Jakupciak JP, Parr RL, Singh G. Mitochondria and cancer: past, present, and future. Biomed Res Int. 2013;2013:612369
12. Roberts ER, Thomas KJ. The role of mitochondria in the development and progression of lung cancer. Comput Struct Biotechnol J. 2013;6:e201303019
13. Wen S, Zhu D, Huang P. Targeting cancer cell mitochondria as a therapeutic approach. Future Med Chem. 2013;5:53-67
14. Neuzil J, Dong LF, Rohlena J, Truksa J, Ralph SJ. Classification of mitocans, anti-cancer drugs acting on mitochondria. Mitochondrion. 2013;13:199-208
15. Lima AR, Bastos Mde L, Carvalho M, Guedes de Pinho P. Biomarker Discovery in Human Prostate Cancer: an Update in Metabolomics Studies. Translational oncology. 2016;9:357-70
16. Xie H, Hou Y, Cheng J, Openkova MS, Xia B, Wang W. et al. Metabolic profiling and novel plasma biomarkers for predicting survival in epithelial ovarian cancer. Oncotarget. 2017
17. Zhang H, Ge T, Cui X, Hou Y, Ke C, Yang M. et al. Prediction of advanced ovarian cancer recurrence by plasma metabolic profiling. Molecular bioSystems. 2015;11:516-21
18. Pon D, Wang Z, Le KN, Chow MS. Harnessing traditional Chinese medicine to improve cancer therapy: issues for future development. Therapeutic delivery. 2010;1:335-44
19. Efferth T, Fu YJ, Zu YG, Schwarz G, Konkimalla VS, Wink M. Molecular target-guided tumor therapy with natural products derived from traditional Chinese medicine. Current medicinal chemistry. 2007;14:2024-32
20. Su SB, Lu A, Li S, Jia W. Evidence-Based ZHENG: A Traditional Chinese Medicine Syndrome. Evidence-based complementary and alternative medicine: eCAM. 2012;2012:246538
21. Chen Z, Wang P. Clinical Distribution and Molecular Basis of Traditional Chinese Medicine ZHENG in Cancer. Evidence-based complementary and alternative medicine: eCAM. 2012;2012:783923
22. Wu T, Yang M, Wei HF, He SH, Wang SC, Ji G. Application of metabolomics in traditional chinese medicine differentiation of deficiency and excess syndromes in patients with diabetes mellitus. Evidence-based complementary and alternative medicine: eCAM. 2012;2012:968083
23. Cramer DW, Greenberg ER, Titus-Ernstoff L, Liberman RF, Welch WR, Li E. et al. A case-control study of galactose consumption and metabolism in relation to ovarian cancer. Cancer epidemiology, biomarkers & prevention: a publication of the American Association for Cancer Research, cosponsored by the American Society of Preventive Oncology. 2000;9:95-101
24. Wu H, Ying M, Hu X. Lactic acidosis switches cancer cells from aerobic glycolysis back to dominant oxidative phosphorylation. Oncotarget. 2016;7:40621-9
25. Robinson GL, Dinsdale D, Macfarlane M, Cain K. Switching from aerobic glycolysis to oxidative phosphorylation modulates the sensitivity of mantle cell lymphoma cells to TRAIL. Oncogene. 2012;31:4996-5006
26. Yin R, Yang T, Su H, Ying L, Liu L, Sun C. Saturated fatty acids as possible important metabolites for epithelial ovarian cancer based on the free and esterified fatty acid profiles determined by GC-MS analysis. Cancer biomarkers: section A of Disease markers. 2016;17:259-69
Author contact
![]() Corresponding author: Department of Immunology and Microbiology, Basic Medical College, Zhejiang Chinese Medical University, Hangzhou, Zhejiang, China. Email: taoffedu.cn
Corresponding author: Department of Immunology and Microbiology, Basic Medical College, Zhejiang Chinese Medical University, Hangzhou, Zhejiang, China. Email: taoffedu.cn