Impact Factor ISSN: 1837-9664

 Global reach, higher impact
J Cancer 2019; 10(1):112-119. doi:10.7150/jca.27729 This issue Cite
Research Paper
Prognostic Value of the Nutritional Risk Screening 2002 Scale in Metastatic Gastric Cancer: A Large-Scale Cohort Study
Yuan-Fang Li1#, Run-Cong Nie1#, Ting Wu1#, Shu-Man Li1#, Shi Chen2, Wei Wang1, Xiao-Jiang Chen1, Guo-Ming Chen1, Ying-Bo Chen1, Zhi-Wei Zhou1 ![]() *, Shu-Qiang Yuan1
*, Shu-Qiang Yuan1 ![]() *
*
1. Sun Yat-sen University Cancer Center; State Key Laboratory of Oncology in South China; Collaborative Innovation Center for Cancer Medicine, Guangzhou, China
2. Department of Gastric Surgery, The 6th Affiliated Hospital, Sun Yat-sen University, Guangzhou, China
# These authors contributed equally to this study.
*These authors contributed equally to this study.
Received 2018-6-7; Accepted 2018-10-5; Published 2019-1-1
Abstract
Background: The prognostic value of the nutritional risk screening 2002 (NRS 2002) scale in metastatic gastric cancer remains unclear. We aimed to explore the role of NRS 2002 in metastatic gastric cancer.
Methods: In this study, 1664 metastatic gastric cancer patients at our institution between 2000 and 2015 were retrospectively analyzed. The characteristics and clinical outcomes of the included patients were analyzed.
Results: Receiver operating characteristic (ROC) curves showed that the regrouping NRS 2002 scale (≤ 3 vs. > 3) provided a similar risk stratification predicting 2-year overall survival (OS) (area under the curves [AUCs]: 0.563 vs. 0.564, P > 0.05) but a better stratification predicting the risk of complications of palliative surgery (AUCs: 0.563 vs. 0.522, P = 0.050) than the original NRS 2002 scale (< 3 vs. ≥ 3). Patients with NRS 2002 > 3 tended to have higher postoperative morbidity (13.3% vs. 8.5%, P = 0.027) and mortality (5.3% vs. 2.0%, P = 0.013) and shorter progression-free survival (PFS) (median PFS: 6.70 vs. 7.70 months, P = 0.002) and overall survival (OS) (median OS: 9.03 vs. 12.63 months, P < 0.001) than those with NRS 2002 ≤ 3. Multivariable analysis demonstrated that the regrouping NRS 2002 scale was the independent prognostic factor for PFS (hazard ratio [HR]: 1.16, P = 0.028) and OS (HR: 1.29, P < 0.001).
Conclusions: The present study indicated that the NRS 2002 scale (regrouping scale) was an independent prognostic factor to predict the morbidity, mortality and survival outcomes for metastatic gastric cancer.
Keywords: nutritional risk screening 2002 (NRS 2002), gastric cancer, survival, prognosis
Introduction
In 2012, gastric cancer caused more than 723,100 deaths, remaining as the third leading cause of cancer deaths worldwide [1]. Owing to the increased use of endoscopies, standard D2 lymphadenectomy [2] and adjuvant chemotherapy [3, 4], the overall survival of resectable gastric cancer is increasing. Unfortunately, the overall survival of gastric cancer patients in China has remained dismal due to the advanced stage of the patients at the time of their first visit.
In spite of the development of chemotherapy, the survival time of metastatic gastric cancer patients has remained unsatisfactory, with a median survival time of approximate 12 months [5-8]. Both tumor-related and host-related factors can predict the prognosis of cancer patients [9]. Advanced gastric cancer patients are often accompanied with large tumor burdens and suffer from oral intake deficiency, outlet obstruction, tumor bleeding and ascites, which debilitates the nutrition of the patients [10]. The malnutrition, in return, accelerates the development of the tumor by suppressing the immunity of the patients [11]. Previous studies have reported that various nutritional indexes are associated with the prognosis of gastric cancer [10, 12-14]. Among them, nutritional risk screening 2002 (NRS 2002) is an easily applied and reproducible tool to predict the nutritional risk for in hospital patients [15]. After the first introduction in 2002, NRS 2002 was widely used to identify the risk for surgical complications [16-20] and survival outcome [21]. The European Society for Clinical Nutrition and Metabolism (ESPEN) also recommends the application of NRS 2002 for cancer patients [22] and surgery patients [23]. However, the prognostic value of NRS 2002 in metastatic gastric cancer remains unknown.
Therefore, our study aimed to explore the prognostic value of NRS 2002 in metastatic gastric cancer patients, including the patients who received palliative surgery.
Methods and patients
Patients
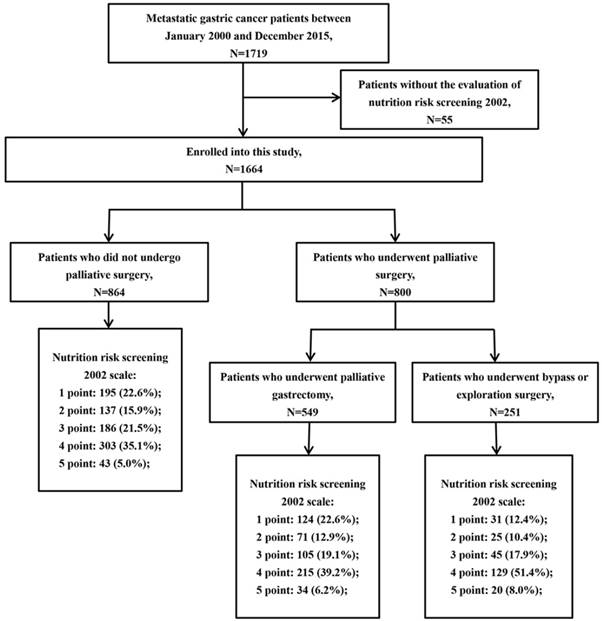
This study was approved by the institutional review board of Sun Yat-sen University Cancer Center. A total of 1719 patients diagnosed with metastatic gastric cancer at our institution between January 2000 and December 2015 were enrolled in this study. Patients were included if they had pathologically confirmed gastric adenocarcinoma with distant metastatic lesions, such as peritoneal dissemination, liver metastasis, lung metastasis, para-aortic lymph node (PAN) metastasis, and/or other distant metastases. Patients were excluded if the NRS 2002 score of the patient could not be assessed. Finally, 1664 patients were included in the present study (Fig 1). The following patient characteristics were collected: gender, age, Eastern Cooperative Oncology Group (ECOG) performance status (PS), tumor location, tumor size, histological type, NRS 2002 score, serum carcinoembryonic antigen (CEA), serum carbohydrate antigen 19-9 (CA19-9), serum albumin, palliative surgery, first-line chemotherapy, complications of palliative surgery and survival outcome. In this study, palliative surgery included palliative gastrectomy, bypass surgery and laparotomy/laparoscopic exploration. Postoperative morbidity was defined as higher than grade II complications according to the Clavien-Dindo classification [24, 25]. Postoperative mortality was defined as deaths that occurred either in hospital or within one month after palliative surgery.
Flowchart of patient enrollment.
Nutritional risk screening 2002
NRS 2002 was first introduced by Kondrup et al. [15] and is evaluated by three components: impaired nutritional status (0-3 points), severity of disease (0-3 points) and age (0-1 points). The total NRS 2002 score ranges from 0 to 7 (Table S1). Previously, patients with NRS 2002 < 3 and ≥ 3 (original scale) were classified as “no nutritional risk” and “nutritional risk,” respectively. In the present study, the NRS 2002 score of the included patients was assessed by two trained dietitians who reviewed the electronic medical records retrospectively.
Statistical analysis
Categorical variables are presented as numbers with percentages and compared using the χ2 test or Fisher's exact test. Overall survival (OS) was calculated from the date of initial diagnosis to death from any cause or date of last follow-up. Progression-free survival (PFS) was measured from the date of initial diagnosis to the date of progression or death. The survival difference was compared by Kaplan-Meier curves using log-rank test. Receiver operating characteristic (ROC) curves were used to verify the efficacy of NRS 2002 to predict the 2-year OS, and the risk of postoperative complications of palliative surgery. The performance of the ROC curves was evaluated using the areas under the curve (AUC). The cut-off value for NRS 2002 was determined by the highest Youden index in the ROC curves. Then, the NRS 2002 was regrouped by the new cut-off value (regrouping scale). Variables with P < 0.05 in the univariable analysis were entered into the multivariate Cox regression. All tests were two-tailed, and P < 0.05 was considered significant. All statistical analyses were performed using SPSS software version 23.0 (IBM Inc., Armonk, NY, USA).
Results
A total of 1664 subjects were included in the present study, with a median age of 56 (46-64) years; 1052 (63.2%) patients were male, and 800 (48.1%) patients received palliative surgery. The median BMI was 20.6 (18.6-22.9) kg/m2. In this sample, 254 (15.3%) patients had lost more than 15% of their bodyweight in 3 months. The NRS 2002 score varied from 1 to 5, and the number of patients with an NRS 2002 score at 1, 2, 3, 4 and 5 points were 350 (21.0%), 234 (14.1%), 336 (20.2%), 647 (38.9%) and 97 (5.8%), respectively (Fig 1).
ROC curves predicting 2-year OS and the risk of complication
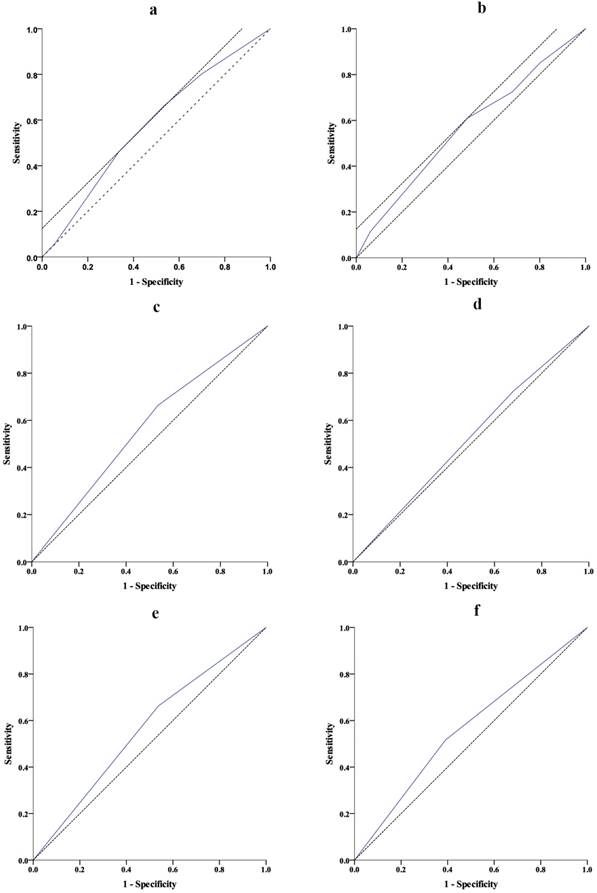
The AUCs of ROC curves predicting 2-year OS and the risk of complication are summarized in Table 1. Regarding the ROC curve predicting 2-year OS, the AUC was 0.578 (95% CI: 0.534-0.621, P < 0.001) for NRS 2002 score, and the optimal cut-off value was 3.5 with sensitivity at 46.2% and specificity at 66.3% (Fig 2a). Regarding the ROC curve for the risk of complication, the AUC was 0.567 (95% CI: 0.501-0.632, P = 0.042) for NRS 2002 score, and the optimal cut-off value was 3.5 with sensitivity at 60.9% and specificity at 51.6% (Fig 2b). Therefore, we regrouped patients into groups with NRS 2002 score ≤ and > 3 (regrouping scale). ROC curves (Fig 2c-f, Table 1) showed that, compared with the original scale (NRS 2002 < and ≥ 3), the regrouping scale provided similar risk stratification predicting 2-year OS (AUC: 0.563 vs. 0.564, P > 0.05) but better stratification for the prediction of the risk of complication of palliative surgery (AUC: 0.563 vs. 0.522, P = 0.050).
Summary of the ROC curves predicting 2-year OS and the risk of complication
| Group | 2-year OS | Risk of complication | |||
|---|---|---|---|---|---|
| AUC (95% CI) | P value | AUC (95% CI) | P value | ||
| NRS 2002 | 0.578 (0.534-0.621) | < 0.001 | 0.567 (0.501-0.632) | 0.042 | |
| NRS 2002 < and ≥ 3 | 0.564 (0.521-0.608) | 0.003 | 0.522 (0.459-0.585) | 0.503 | |
| NRS 2002 ≤ and > 3 | 0.563 (0.521-0.64) | 0.004 | 0.563 (0.500-0.626) | 0.050 | |
ROC receiver operating characteristic; OS overall survival; AUC area under the curve; NRS 2002 nutritional risk screening 2002.
Receiver operating characteristic (ROC) curves predicting 2-year overall survival (OS) and risk of complication. a. Nutritional risk screening (NRS) 2002 score predicting 2-year OS (P< 0.001); b. Nutritional risk screening (NRS) 2002 score predicting the risk of complication (P = 0.042); c. NRS 2002 < and ≥ 3 (original scale) predicting 2-year OS (P= 0.003); d. NRS 2002 < 3 and ≥ 3 (original scale) predicting the risk of complication (P= 0.503). e. NRS 2002 ≤ 3 and > 3 (regrouped scale) predicting 2-year OS (P= 0.004); f. NRS 2002 ≤ 3 and > 3 (regrouped scale) predicting the risk of complication (P= 0.050).
Characteristic of patients according to the regrouping scale
As shown in Table 2, the number of patients with NRS 2002 ≤ and > 3 were 920 and 744, respectively. Patients with NRS 2002 > 3 tended to have worse PS (P < 0.001), larger tumor size (P < 0.001), lower serum albumin (P = 0.010), more palliative surgery (P < 0.001), and less first-line chemotherapy (P < 0.001). For the 800 patients that received palliative surgery, patients with NRS 2002 > 3 had higher postoperative morbidity (13.3% vs. 8.5%, P = 0.027) and mortality (5.3% vs. 2.0%, P = 0.013) than those with NRS 2002 ≤ 3.
Clinicopathological characteristics of 1664 metastatic gastric cancer patients according to the regrouping NRS 2002 scale
| Characteristics | NRS 2002 ≤ 3 | NRS 2002 > 3 | P-value |
|---|---|---|---|
| No. of patients | 920 | 744 | |
| Sex, n | 0.583 | ||
| Male | 587 (63.8) | 465(62.5) | |
| Female | 333 (36.2) | 279 (37.5) | |
| Age | < 0.001 | ||
| < 70 years | 848 (92.4) | 602 (81.0) | |
| ≥ 70 years | 70 (7.6) | 141 (19.0) | |
| Performance status, n | < 0.001 | ||
| < 2 | 833 (90.5) | 602 (81.0) | |
| ≥ 2 | 87 (9.5) | 141 (19.0) | |
| Tumor location | 0.092 | ||
| Entire stomach | 40 (4.4) | 46 (6.2) | |
| Non-entire stomach | 879 (95.6) | 697 (93.8) | |
| Size | < 0.001 | ||
| < 5 cm | 346 (42.5) | 201 (30.6) | |
| 5-10 cm | 382 (46.9) | 352 (53.6) | |
| > 10 cm | 87 (10.7) | 104 (15.8) | |
| Histological type | 0.326 | ||
| Well differentiated | 131 (14.7) | 92 (13.0) | |
| Poorly differentiated | 761 (85.3) | 617 (87.0) | |
| CEA (ng/ml) | 0.885 | ||
| < 5 | 496 (58.8) | 402 (59.2) | |
| ≥ 5 | 347 (41.2) | 277 (40.8) | |
| CA19-9 (U/ml) | 0.525 | ||
| < 35 | 476 (59.5) | 376 (57.8) | |
| ≥ 35 | 324 (40.5) | 274 (42.2) | |
| Serum albumin | 0.010 | ||
| < 3.0 g/dl | 20 (2.3) | 33 (4.6) | |
| ≥ 3.0 g/dl | 850 (97.7) | 95.4 (95.4) | |
| Palliative surgery* | < 0.001 | ||
| Yes | 402 (43.7) | 398 (53.5) | |
| No | 518 (56.3) | 346 (46.5) | |
| First-line chemotherapy | < 0.001 | ||
| Yes | 700 (76.2) | 465 (62.7) | |
| No | 23.8 (23.8) | 277 (37.3) | |
| Morbidity | 0.027 | ||
| Yes | 34 (8.5) | 53 (13.3) | |
| No | 368 (91.5) | 345 (86.7) | |
| Mortality | 0.013 | ||
| Yes | 8 (2.0) | 21 (5.3) | |
| No | 394 (98.0) | 377 (94.7) |
NRS 2002 nutritional risk screening 2002; CEA baseline carcinoembryonic antigen; CA19-9 baseline carbohydrate antigen 19-9; * Palliative surgery included palliative gastrectomy, bypass surgery and laparotomy/laparoscopic exploration.
Survival
The median OS for patients with NRS 2002 ≤ and > 3 were 12.63 (95% CI: 11.63-13.64) months and 9.03 (95% CI: 8.26-9.81) months, respectively (Fig 3a), and the OS difference was significant (P < 0.001). Patients with NRS 2002 > 3 had a shorter PFS than those with NRS 2002 ≤ 3 (median PFS: 6.70 [95% CI: 6.25-7.15] vs. 7.70 [95% CI: 7.11-8.29], P = 0.002) (Fig 3b).
Kaplan-Meier estimates of overall survival and progression-free survival in (a, b) all patients, (c, d) patients who received palliative surgery and (e, f) patients who did not receive palliative surgery between NRS 2002 ≤ 3 and > 3 groups. a P < 0.001, b P = 0.002, c P < 0.001, d P < 0.001, e P< 0.001, f P = 0.011.
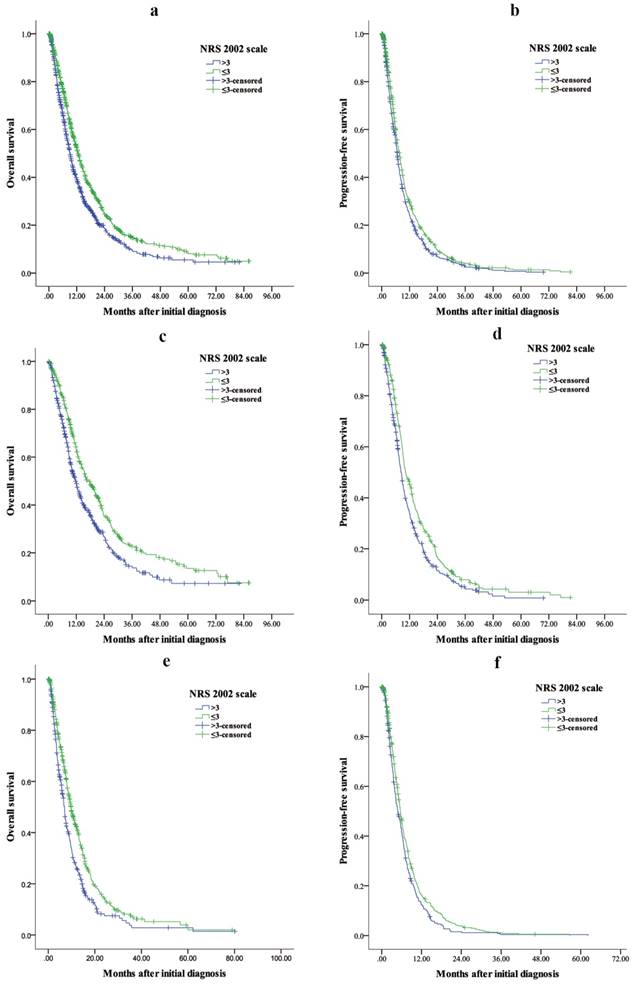
For patients receiving palliative surgery, patients with NRS 2002 > 3 had a shorter OS (median OS: 11.77 [95% CI: 10.12-13.42] vs. 17.30 [95% CI: 14.42-20.18], P < 0.001) (Fig 3c) and PFS (median PFS: 8.37 [95% CI: 7.51-9.22] vs. 10.23 [95% CI: 8.75-9.91], P < 0.001) (Fig 3d) than those with NRS 2002 ≤ 3.
For patients who did not receive palliative surgery, patients with NRS 2002 > 3 had a shorter OS (median OS: 6.93 [95% CI: 6.17-7.70] vs. 9.73 [95% CI: 8.66-10.81], P < 0.001) (Fig 3e) and PFS (median PFS: 4.83 [95% CI: 4.01-5.66] vs. 5.63 [95% CI: 5.14-6.12], P = 0.011) (Fig 3f) than those with NRS 2002 ≤ 3.
In the multivariable analysis of OS, PS (P = 0.001), tumor size (P = 0.001), histological type (P = 0.001), serum CEA (P = 0.007), CA19-9 (P < 0.001), palliative surgery (P < 0.001), first-line chemotherapy (P < 0.001) and regrouping NRS 2002 scale (P < 0.001) were the independent prognostic factors (Table 3). In the multivariable analysis of PFS, the regrouping NRS 2002 scale (P = 0.028) remained the independent prognostication (Table 4).
Univariable analysis and multivariable analysis of overall survival for 1664 metastatic gastric cancer patients
| Variables | Univariate analysis | Multivariate analysis | ||
|---|---|---|---|---|
| HR (95% CI) | P-value | HR (95% CI) | P-value | |
| Sex | 0.098 | |||
| Male | 1 | |||
| Female | 0.90 (0.80-1.02) | |||
| Age | 0.034 | |||
| < 70 years | 1 | |||
| ≥ 70 years | 1.20 (1.01-1.42) | |||
| Performance status, n | < 0.001 | < 0.001 | ||
| < 2 | 1 | 1 | ||
| ≥ 2 | 1.48 (1.26-1.73) | 1.39 (1.16-1.67) | ||
| Tumor location | 0.101 | |||
| Entire stomach | 1 | |||
| Non-entire stomach | 0.80 (0.61-1.04) | |||
| Size | < 0.001 | 0.001 | ||
| < 5 cm | 1 | 1 | ||
| 5-10 cm | 1.32 (1.15-1.50) | < 0.001 | 1.28 (1.10-1.49) | 0.001 |
| > 10 cm | 1.71 (1.41-2.08) | < 0.001 | 1.41 (1.13-1.74) | 0.002 |
| Histological type | 0.003 | 0.001 | ||
| Well differentiated | 1 | 1 | ||
| Poorly differentiated | 1.29 (1.09-1.53) | 1.40 (1.14-1.71) | ||
| CEA (ng/ml) | < 0.001 | 0.007 | ||
| < 5 | 1 | 1 | ||
| ≥ 5 | 1.39 (1.23-1.57) | 1.22 (1.06-1.41) | ||
| CA19-9 (U/ml) | < 0.001 | < 0.001 | ||
| < 35 | 1 | 1 | ||
| ≥ 35 | 1.38 (1.21-1.56) | 1.33 (1.16-1.41) | ||
| Serum albumin | 0.004 | |||
| < 3.0 g/dl | 1.61 (1.16-2.22) | |||
| ≥ 3.0 g/dl | 1 | |||
| Palliative surgery* | < 0.001 | < 0.001 | ||
| No | 1 | 1 | ||
| Yes | 0.55 (0.49-0.62) | 0.48 (0.42-0.55) | ||
| First-line chemotherapy | < 0.001 | < 0.001 | ||
| Yes | 0.34 (0.30-0.38) | 0.30 (0.26-0.34) | ||
| No | 1 | 1 | ||
| NRS 2002 scale | < 0.001 | < 0.001 | ||
| ≤ 3 | 1 | 1 | ||
| > 3 | 1.34 (1.19-1.51) | 1.29 (1.12-1.48) | ||
NRS 2002 nutritional risk screening 2002; CEA baseline carcinoembryonic antigen; CA19-9 baseline carbohydrate antigen 19-9; * Palliative surgery included palliative gastrectomy, bypass surgery and laparotomy/laparoscopic exploration.
Univariable analysis and multivariable analysis of progression-free survival for 1664 metastatic gastric cancer patients
| Variables | Univariate analysis | Multivariate analysis | ||
|---|---|---|---|---|
| HR (95% CI) | P-value | HR (95% CI) | P-value | |
| Sex | 0.027 | |||
| Male | 1 | |||
| Female | 0.88 (0.79-0.99) | |||
| Age | 0.928 | |||
| < 70 years | 1 | |||
| ≥ 70 years | 1.01 (0.86-1.18) | |||
| Performance status, n | 0.001 | 0.001 | ||
| < 2 | 1 | 1 | ||
| ≥ 2 | 1.30 (1.12-1.51) | 1.33 (1.12-1.59) | ||
| Tumor location | 0.024 | |||
| Entire stomach | 1 | |||
| Non-entire stomach | 0.75 (0.69-0.96) | |||
| Size | < 0.001 | |||
| < 5 cm | 1 | 1 | 0.013 | |
| 5-10 cm | 1.21 (1.07-1.37) | 0.002 | 1.18 (1.03-1.36) | |
| > 10 cm | 1.54 (1.28-1.85) | < 0.001 | 1.30 (1.06-1.59) | |
| Histological type | < 0.001 | < 0.001 | ||
| Well differentiated | 1 | 1 | ||
| Poorly differentiated | 1.36 (1.16-1.59) | 1.56 (1.30-1.89) | ||
| CEA (ng/ml) | < 0.001 | 0.002 | ||
| < 5 | 1 | 1 | ||
| ≥ 5 | 1.37 (1.22-1.53) | 1.23 (1.08-1.71) | ||
| CA19-9 (U/ml) | < 0.001 | < 0.001 | ||
| < 35 | 1 | 1 | ||
| ≥ 35 | 1.48 (1.32-1.66) | 1.50 (1.32-1.71) | ||
| Serum albumin | 0.001 | |||
| < 3.0 g/dl | 1.66 (1.23-2.26) | |||
| ≥ 3.0 g/dl | 1 | |||
| Palliative surgery* | < 0.001 | < 0.001 | ||
| No | 1 | 1 | ||
| Yes | 0.50 (0.45-0.56) | 0.43 (0.38-0.49) | ||
| First-line chemotherapy | < 0.001 | < 0.001 | ||
| Yes | 0.52 (0.46-0.58) | 0.47 (0.41-0.54) | ||
| No | 1 | 1 | ||
| NRS 2002 scale | 0.002 | 0.028 | ||
| ≤ 3 | 1 | 1 | ||
| > 3 | 1.18 (1.06-1.31) | 1.16 (1.02-1.31) | ||
NRS 2002 nutritional risk screening 2002; CEA baseline carcinoembryonic antigen; CA19-9 baseline carbohydrate antigen 19-9; * Palliative surgery included palliative gastrectomy, bypass surgery and laparotomy/laparoscopic exploration.
Discussion
Based on the analysis of 128 randomized clinical studies, Kondrup et al. [15] introduced a useful screening tool, NRS 2002, to identify patients who are likely to benefit from nutritional support. Several studies also reported an association between NRS 2002 and clinical outcomes in cancer patients [18, 26, 27], including gastric cancer patients [16, 21]. In the present study, our results demonstrated that NRS 2002 was an independent factor that predicted the PFS and OS for metastatic gastric cancer. Moreover, for patients who received palliative surgery, the regrouping NRS 2002 scale (NRS 2002 ≤ and > 3) could effectively predict postoperative morbidity and mortality.
Gastric cancer patients often have a higher prevalence of nutritional risk than other disease. Previous studies showed that 32.4-50.7% of gastric cancer patients had an NRS 2002 score ≥ 3 [16, 20, 21, 28], which indicated a high nutritional risk for gastric cancer patients. In the present study, our results demonstrated that the percentage of metastatic gastric cancer patients with NRS 2002 score ≥ 3 was 64.9%, which is higher than that of previous studies. In addition, for patients who were supposed to receive palliative surgery, the percentage of patients with NRS 2002 ≥ 3 was 68.6%. This difference was mainly due to the older age, greater disease severity and more comorbidity for metastatic gastric cancer patients. For example, metastatic gastric cancer patients often suffered from outlet obstruction or massive ascites, which would lead to a higher NRS 2002 score.
Malnutrition had been reported as an independent factor associated with postoperative complications [16, 20, 29] and survival outcomes [21, 30]. Serum albumin was a useful biomedical factor to identify the nutritional status of the patients. Lien et al. [31] reported that gastric cancer patients with lower preoperative serum albumin levels were associated with worse survival. Our data revealed that metastatic gastric cancer patients with NRS 2002 > 3 were highly correlated with hypoalbuminemia, larger tumor size and worse performance status. Moreover, our results showed that patients with NRS 2002 > 3 had shorter OS and PFS than those patients with NRS 2002 ≤ 3, which indicated that NRS 2002 scale was not only a simple tool to distinguish the nutritional status and tumor burden of the patients but also a practical tool to predict the survival outcome for metastatic gastric cancer patients.
Although palliative gastrectomy did not show the survival benefit for metastatic gastric cancer [32], palliative surgery could relieve the cancer-related symptoms, such as tumor bleeding, outlet obstruction and perforation. Our data revealed that the regrouping NRS 2002 scale (NRS 2002 ≤ and > 3) could predict the risk of complications and postoperative mortality for metastatic gastric cancer patients. Therefore, metastatic gastric cancer patients with NRS 2002 > 3 should receive interventions with nutritional supplement to correct immunonutritional disorders. Qiu et al. reported that advanced gastric cancer patients could benefit from nutrition improvement after nutrition support [21]. However, only 30.3% of advanced gastric cancer patients had nutrition improvement after nutrition support. Therefore, whether malnutrition is a cause or a consequence of tumor progression remains unclear. Moreover, for patients who receive palliative surgery, whether the preoperative nutrition support could reduce the risk of postoperative morbidity and mortality is still uncertain.
There were several limitations in our study. First, this was a substantial retrospective study from a single center. Second, the study time span was 15 years. Third, because the external validation by an independent cohort was not available in the present study, the results of our study should be interpreted cautiously. Therefore, in the future, large-scale and well-designed prospective trials are needed to verify the results.
Conclusions
In conclusion, the present study indicated that the NRS 2002 scale (regrouping scale) was an independent prognostic factor to predict the morbidity, mortality and survival outcomes for metastatic gastric cancer.
Supplementary Material
Supplementary table S1.
Acknowledgements
This work was supported in part by a grant from National Natural Science Foundation of China (81302144) and the Guangdong Science and Technology Department (No2012B061700087).
Competing Interests
The authors have declared that no competing interest exists.
References
1. Torre LA, Bray F, Siegel RL. et al. Global cancer statistics, 2012. CA Cancer J Clin. 2015;65:87-108
2. Songun I, Putter H, Kranenbarg EM. et al. Surgical treatment of gastric cancer: 15-year follow-up results of the randomised nationwide Dutch D1D2 trial. Lancet Oncol. 2010;11:439-449
3. Bang Y-J, Kim Y-W, Yang H-K. et al. Adjuvant capecitabine and oxaliplatin for gastric cancer after D2 gastrectomy (CLASSIC): a phase 3 open-label, randomised controlled trial. The Lancet. 2012;379:315-321
4. Sasako M, Sakuramoto S, Katai H. et al. Five-year outcomes of a randomized phase III trial comparing adjuvant chemotherapy with S-1 versus surgery alone in stage II or III gastric cancer. J Clin Oncol. 2011;29:4387-4393
5. Van Cutsem E, Moiseyenko VM, Tjulandin S. et al. Phase III study of docetaxel and cisplatin plus fluorouracil compared with cisplatin and fluorouracil as first-line therapy for advanced gastric cancer: a report of the V325 Study Group. J Clin Oncol. 2006;24:4991-4997
6. Koizumi W, Narahara H, Hara T. et al. S-1 plus cisplatin versus S-1 alone for first-line treatment of advanced gastric cancer (SPIRITS trial): a phase III trial. The Lancet Oncology. 2008;9:215-221
7. Bang YJ, Van Cutsem E, Feyereislova A. et al. Trastuzumab in combination with chemotherapy versus chemotherapy alone for treatment of HER2-positive advanced gastric or gastro-oesophageal junction cancer (ToGA): a phase 3, open-label, randomised controlled trial. Lancet. 2010;376:687-697
8. Okines AF, Ashley SE, Cunningham D. et al. Epirubicin, oxaliplatin, and capecitabine with or without panitumumab for advanced esophagogastric cancer: dose-finding study for the prospective multicenter, randomized, phase II/III REAL-3 trial. J Clin Oncol. 2010;28:3945-3950
9. Mohri Y, Tanaka K, Ohi M. et al. Prognostic significance of host- and tumor-related factors in patients with gastric cancer. World J Surg. 2010;34:285-290
10. Nie R, Yuan S, Chen S. et al. Prognostic nutritional index is an independent prognostic factor for gastric cancer patients with peritoneal dissemination. Chin J Cancer Res. 2016;28:570-578
11. Kanda M, Fujii T, Kodera Y. et al. Nutritional predictors of postoperative outcome in pancreatic cancer. Br J Surg. 2011;98:268-274
12. Yuan SQ, Nie RC, Chen YM. et al. Glasgow Prognostic Score is superior to ECOG PS as a prognostic factor in patients with gastric cancer with peritoneal seeding. Oncol Lett. 2018;15:4193-4200
13. Sakurai K, Ohira M, Tamura T. et al. Predictive Potential of Preoperative Nutritional Status in Long-Term Outcome Projections for Patients with Gastric Cancer. Ann Surg Oncol. 2016;23:525-533
14. Eo WK, Chang HJ, Suh J. et al. The Prognostic Nutritional Index Predicts Survival and Identifies Aggressiveness of Gastric Cancer. Nutr Cancer. 2015;67:1260-1267
15. Kondrup J. Nutritional risk screening (NRS 2002): a new method based on an analysis of controlled clinical trials. Clinical Nutrition. 2003;22:321-336
16. Guo W, Ou G, Li X. et al. Screening of the nutritional risk of patients with gastric carcinoma before operation by NRS 2002 and its relationship with postoperative results. J Gastroenterol Hepatol. 2010;25:800-803
17. Kuppinger D, Hartl WH, Bertok M. et al. Nutritional screening for risk prediction in patients scheduled for abdominal operations. Br J Surg. 2012;99:728-737
18. Kwag SJ, Kim JG, Kang WK. et al. The nutritional risk is a independent factor for postoperative morbidity in surgery for colorectal cancer. Ann Surg Treat Res. 2014;86:206-211
19. Lee SY, Jung MR, Kim CH. et al. Nutritional risk screening score is an independent predictive factor of anastomotic leakage after rectal cancer surgery. Eur J Clin Nutr. 2018;72:489-495
20. Zhuang CL, Wang SL, Huang DD. et al. Risk factors for hospital readmission after radical gastrectomy for gastric cancer: a prospective study. PLoS One. 2015;10:e0125572
21. Qiu M, Zhou YX, Jin Y. et al. Nutrition support can bring survival benefit to high nutrition risk gastric cancer patients who received chemotherapy. Support Care Cancer. 2015;23:1933-1939
22. Arends J, Bachmann P, Baracos V. et al. ESPEN guidelines on nutrition in cancer patients. Clinical Nutrition. 2017;36:11-48
23. Weimann A, Braga M, Carli F. et al. ESPEN guideline: Clinical nutrition in surgery. Clin Nutr. 2017;36:623-650
24. Dindo D, Demartines N, Clavien PA. Classification of surgical complications: a new proposal with evaluation in a cohort of 6336 patients and results of a survey. Ann Surg. 2004;240:205-213
25. Clavien PA, Barkun J, de Oliveira ML. et al. The Clavien-Dindo classification of surgical complications: five-year experience. Ann Surg. 2009;250:187-196
26. Wang JY, Hong X, Chen GH. et al. Clinical application of the fast track surgery model based on preoperative nutritional risk screening in patients with esophageal cancer. Asia Pac J Clin Nutr. 2015;24:206-211
27. Schiesser M, Muller S, Kirchhoff P. et al. Assessment of a novel screening score for nutritional risk in predicting complications in gastro-intestinal surgery. Clin Nutr. 2008;27:565-570
28. Jia ZY, Yang J, Tong DN. et al. Screening of nutritional risk and nutritional support in general surgery patients: a survey from Shanghai, China. Int Surg. 2015;100:841-848
29. Schneider SM, Veyres P, Pivot X. et al. Malnutrition is an independent factor associated with nosocomial infections. Br J Nutr. 2004;92:105-111
30. Jiang N, Deng JY, Ding XW. et al. Prognostic nutritional index predicts postoperative complications and long-term outcomes of gastric cancer. World J Gastroenterol. 2014;20:10537-10544
31. Lien YC, Hsieh CC, Wu YC. et al. Preoperative serum albumin level is a prognostic indicator for adenocarcinoma of the gastric cardia. J Gastrointest Surg. 2004;8:1041-1048
32. Fujitani K, Yang H-K, Mizusawa J. et al. Gastrectomy plus chemotherapy versus chemotherapy alone for advanced gastric cancer with a single non-curable factor (REGATTA): a phase 3, randomised controlled trial. The Lancet Oncology. 2016;17:309-318
Author contact
![]() Corresponding authors: Zhi-Wei Zhou: Sun Yat-sen University Cancer Center, State Key Laboratory of Oncology in South China, Collaborative Innovation Center for Cancer Medicine, 651 E Dongfeng Road, Guangzhou, Guangdong, 510060, China. Tel: +86-020-87343626; E-mail: zhouzhworg.cn and Shu-Qiang Yuan: Sun Yat-sen University Cancer Center; State Key Laboratory of Oncology in South China; Collaborative Innovation Center for Cancer Medicine, 651 E Dongfeng Road, Guangzhou, Guangdong, 510060, China. Tel: +86-020-87343625; E-mail: yuanshqorg.cn
Corresponding authors: Zhi-Wei Zhou: Sun Yat-sen University Cancer Center, State Key Laboratory of Oncology in South China, Collaborative Innovation Center for Cancer Medicine, 651 E Dongfeng Road, Guangzhou, Guangdong, 510060, China. Tel: +86-020-87343626; E-mail: zhouzhworg.cn and Shu-Qiang Yuan: Sun Yat-sen University Cancer Center; State Key Laboratory of Oncology in South China; Collaborative Innovation Center for Cancer Medicine, 651 E Dongfeng Road, Guangzhou, Guangdong, 510060, China. Tel: +86-020-87343625; E-mail: yuanshqorg.cn