Impact Factor ISSN: 1837-9664

 Global reach, higher impact
J Cancer 2019; 10(14):3267-3283. doi:10.7150/jca.29986 This issue Cite
Research Paper
Integrated analysis of competing endogenous RNA network revealing potential prognostic biomarkers of hepatocellular carcinoma
Xiwen Liao1, Xiangkun Wang1, Ketuan Huang1, Chuangye Han1, Jianlong Deng1,2, Tingdong Yu1, Chengkun Yang1, Rui Huang3, Xiaoguang Liu1,4, Long Yu1,5, Guangzhi Zhu1, Hao Su1, Wei Qin1, Xianmin Zeng1, Bowen Han1, Quanfa Han1, Zhengqian Liu1, Xin Zhou1, Yizhen Gong6,7, Zhengtao Liu1,8,9, Jianlv Huang1,10, Cheryl A Winkler11, Stephen J. O'Brien12,13, Xinping Ye1, Tao Peng1 ![]()
1. Department of Hepatobiliary Surgery, The First Affiliated Hospital of Guangxi Medical University, Nanning, 530021, Guangxi Zhuang Autonomous Region, People's Republic of China
2. Department of Hepatobiliary Surgery, The Sixth Affiliated Hospital of Guangxi Medical University, Yulin, 537000, Guangxi Zhuang Autonomous Region, People's Republic of China
3. Department of Hematology, The First Affiliated Hospital of Guangxi Medical University, Nanning, 530021, Guangxi Zhuang Autonomous Region, People's Republic of China
4. Department of Hepatobiliary Surgery, Affiliated Hospital of Guangdong Medical University, Zhanjiang, 524001, Guangdong Province, China;
5. Department of Hepatobiliary and Pancreatic Surgery, The First Affiliated Hospital of Zhengzhou University, Zhengzhou, 450000, Henan Province, China;
6. Department of Colorectal and Anal Surgery, The First Affiliated Hospital of Guangxi Medical University, Nanning, 530021, Guangxi Zhuang Autonomous Region, People's Republic of China.
7. Department of Evidence-based Medicine, The First Affiliated Hospital of Guangxi Medical University, Nanning, 530021, Guangxi Zhuang Autonomous Region, People's Republic of China
8. Key Laboratory of Combined Multi-Organ Transplantation, Ministry of Public Health and Key Laboratory of Organ Transplantation of Zhejiang Province, Hangzhou, 310003, Zhejiang Province, People's Republic of China.
9. Science for Life Laboratory, KTH-Royal Institute of Technology, Stockholm, SE-171 21, Sweden.
10. Department of Hepatobiliary Surgery, The Third Affiliated Hospital of Guangxi Medical University, Nanning 530031, Guangxi Zhuang Autonomous Region, People's Republic of China.
11. Basic Research Laboratory, CCR, NCI and Leidos Biomedical Research, Frederick National Laboratory, Frederick MD. 21702, USA.
12. Theodosius Dobzhansky Center for Genome Bioinformatics, Saint-Petersburg State University, Saint-Petersburg, 199004, Russia.
13. Oceanographic Center, Nova Southeastern University, Ft Lauderdale, 33004, FL, USA.
Received 2018-9-16; Accepted 2019-4-3; Published 2019-6-2
Abstract
Objective: The goal of our study is to identify a competing endogenous RNA (ceRNA) network using dysregulated RNAs between HCC tumors and the adjacent normal liver tissues from The Cancer Genome Atlas (TCGA) datasets, and to investigate underlying prognostic indicators in hepatocellular carcinoma (HCC) patients.
Methods: All of the RNA- and miRNA-sequencing datasets of HCC were obtained from TCGA, and dysregulated RNAs between HCC tumors and the adjacent normal liver tissues were investigated by DESeq and edgeR algorithm. Survival analysis was used to confirm underlying prognostic indicators.
Results: In the present study, we constructed a ceRNA network based on 16 differentially expressed genes (DEGs), 7 differentially expressed microRNAs and 34 differentially expressed long non-coding RNAs (DELs). Among these dysregulated RNAs, three DELs (AP002478.1, HTR2A-AS1, and ERVMER61-1) and six DEGs (enhancer of zeste homolog 2 [EZH2], kinesin family member 23 [KIF23], chromobox 2 [CBX2], centrosomal protein 55 [CEP55], cell division cycle 25A [CDC25A], and claspin [CLSPN]) were used for construct a prognostic signature for HCC overall survival (OS), and performed well in HCC OS (adjusted P<0.0001, adjusted hazard ratio = 2.761, 95% confidence interval = 1.838-4.147). Comprehensive survival analysis demonstrated that this prognostic signature may be act as an independent prognostic indicator of HCC OS. Functional assessment of these dysregulated DEGs in the ceRNA network and gene set enrichment of this prognostic signature suggest that both were enriched in the biological processes and pathways of the cell cycle, cell division and cell proliferation.
Conclusions: Our current study constructed a ceRNA network for HCC, and developed a prognostic signature that may act as an independent indicator for HCC OS.
Keywords: competing endogenous RNA, hepatocellular carcinoma, bioinformatics, prognosis, TCGA.
Introduction
Liver cancer (LC) is the second main reason of cancer related death worldwide of males, and is more common in developing countries. It is estimated that about 782,500 new LC cases and 745,500 deaths occurred worldwide during 2012, and more than half of them were from China [1]. However, the incidence of LC ranks third in China in cancers in males, and is becoming the third main reason of cancer related death in China in both males and females [2]. Due to the universal childhood HBV vaccination program, and improved hygiene and sanitation, the incidence of LC in China is showing a decreasing trend and mortality rate [1, 2]. However, the 5-year survival rate of LC is still generally low [3]. The histological type of most LCs is hepatocellular carcinoma (HCC) [4].
The rapid development of RNA-sequencing approach has led to the discovery of thousands of non-coding RNA (ncRNA) genes [5]. Non-coding RNAs, i.e. RNAs that cannot encode proteins, mainly include small RNAs and long-chain RNAs, and play extensive regulatory functions in many organisms such as bacteria, fungi, and mammals [6]. With the continuous development of RNA research, it has been found that mutations or the abnormal expression of non-coding RNAs are closely related to the occurrence of many diseases, and non-coding RNAs are also attracting more and more attention [7]. MicroRNAs (miRNAs) are small, short ncRNA molecules that regulate gene expression post-transcriptionally, whereas long non-coding RNAs (lncRNAs) are long ncRNAs that have also been identified as being involved in transcription regulation and the translation of target genes [7]. Numerous studies have reported that alterations of ncRNAs, including miRNAs and lncRNAs, are involved in tumorigenesis, progression, and metastasis of human cancers, as well as being therapeutic targets, and can also serve as diagnostic and prognostic biomarkers of cancer, including HCC [8-11]. LncRNAs or pseudogenes can serve as competing endogenous RNAs (ceRNAs), which can interact with miRNAs through miRNA response elements (MREs) to influence miRNA-induced targeted gene silencing [12]. The Cancer Genome Atlas (TCGA) is an open access database that includes 33 types of cancers and genome-wide sequencing datasets for more than 10,000 tumor samples, including HCC [13]. With such a comprehensive genome-wide sequencing dataset for HCC, how to deep-mine these data remains a huge challenge. With the proposed of ceRNA hypothesis, it is necessary to construct a HCC ceRNA network using the dysregulated genes of TCGA hepatocellular carcinoma database, and develop diagnostic and prognostic biomarkers for HCC. The goal of our current study was to identify a ceRNA network using these genes which are dysregulated between HCC tumors and the adjacent normal liver tissues from TCGA datasets, and to investigate underlying prognostic indicators for predicting overall survival (OS) in HCC patients.
Materials and Methods
TCGA data source
The expression of human RNA-sequencing (RNA-Seq; including lncRNAs and mRNAs) and miRNA-sequencing (miRNA-Seq) datasets were got from the TCGA website (https://portal.gdc.cancer.gov/, accessed November 5, 2017) [14], and the corresponding patients' clinical parameters were obtain from the University of California, Santa Cruz Xena browser (UCSC Xena, http://xena.ucsc.edu/, accessed November 5, 2017). Patients with complete clinical prognostic parameters who received RNA-Seq or miRNA-Seq were included in the corresponding subsequent prognostic analysis. Patients who do not meet these criteria are respectively excluded from corresponding differentially expressed RNAs survival analysis. All of the above data were sourced from the TCGA database, and the use and acquisition of these data are according to TCGA data access policies and publication guidelines (https://cancergenome.nih.gov/publications/publicationguidelines). Therefore, the present study did not require additional ethics committee approval.
Identification of differentially expressed RNAs in HCC samples
All the HCC primary tumor and adjacent normal liver tissues of RNA-sequencing dataset were used for differentially expressed RNAs screening, and the recurrent tumor tissues were excluded from differential RNAs screening. The level 3 raw count data of RNA-Seq and miRNA-Seq datasets were both normalized by the DESeq [15] and edgeR [16] package in the R platform; each RNA with a mean value greater than 1 was included in the further analysis. The differentially expressed RNAs were screened by the DESeq and edgeR package using the R platform, and any RNAs overlapping between DESeq and edgeR were regarded as differentially expressed RNAs. Filter parameters of differentially expressed RNAs between HCC tumor and adjacent normal liver tissues were set as follows: a false discovery rate (FDR) <0.05; and a |log2 Fold Change (log2 FC)| > 2. A normalization dataset by DESeq was used for further analysis.
Competing endogenous RNA network construction and functional assessment
The ceRNA networks were constructed by differentially expressed genes (DEGs), differentially expressed miRNAs (DEMs), and differentially expressed lncRNAs (DELs) between HCC tumor and adjacent normal liver tissues. The lncRNA-miRNA interactions were identified by miRcode (http://www.mircode.org/, accessed November 5, 2017), which is a comprehensive searchable map of putative miRNA target sites across the complete GENCODE annotated transcriptome [17]. Whereas the potential target genes of DEMs were identified by TargetScan (http://www.targetscan.org/, accessed November 5, 2017) [18], miRDB (http://www.mirdb.org/, accessed November 5, 2017) [19] and miRTarBase (http://mirtarbase.mbc.nctu.edu.tw/, accessed November 5, 2017) [20]; the target genes overlapping in the three online tools were considered as DEM-targeted genes. Then, the overlapping of these miRNA-mRNA and lncRNA-miRNA interactions with DEGs, DEMs and DELs, respectively, were included in further ceRNA network constructions. The flow chart of the ceRNA network construction is shown in Figure S1. To further understand the potential biological processes and pathways of these DEGs in ceRNA network, functional assessment was performed by the Database for Annotation, Visualization, and Integrated Discovery v6.8 (DAVID v6.8, https://david.ncifcrf.gov/home.jsp; accessed December 14, 2017), which consists of an integrated biological knowledge base and analytical tools aimed at systematically extracting biological meaning from large gene/protein lists [21, 22]. The directed acyclic graph of Gene Ontology (GO) terms was drawn by the Biological Networks Gene Ontology tool (BiNGO) in Cytoscape_v3.4.0 [23]. Gene-gene and protein-protein interactions of these DEGs in the ceRNA network were constructed by GeneMANIA (http://www.genemania.org/, accessed December 15, 2017) [24, 25] and the Search Tool for the Retrieval of Interacting Genes/Proteins (STRING, https://string-db.org/, accessed December 15, 2017) [26, 27], respectively.
Construction of the HCC-specific differentially expressed RNA-based prognostic signature
Further univariate Cox proportional hazards regression models were used to investigate the potential prognostic applications of these differentially expressed RNAs in the ceRNA network. Afterwards, these differentially expressed RNAs, which were significantly related to HCC overall survival (OS), were fitted into the optimal combination screening using a "step" function and used for further prognostic signature construction. These prognostic differentially expressed RNAs were included into the multivariate Cox regression model as dependent variables to calculate the relative contribution of these differentially expressed RNAs in a prognostic signature, and the weight of each differentially expressed RNA was assessed by the regression coefficient (β), which was generated from the multivariate Cox regression model. The HCC OS predicted risk score was calculated as follows: Risk score = ExpRNA1 × βRNA1 + ExpRNA2×βRNA2 + … ExpRNA × βRNAn (Exp: expression level) [28-33]. The prediction accuracy of prognostic signature in HCC OS was evaluated through the survivalROC package in R platform. Furthermore, we also identified the underlying application of prognostic signature in distinguishing different clinical parameters. In order to test the potential application value of prognostic signature in HCC OS, we also implemented a comprehensive survival analysis to evaluate the prognostic signatures, including stratified survival analysis, nomogram, and joint effect survival analysis.
Gene set enrichment analysis
To understand the underlying mechanism between different risk scores, gene set enrichment analysis (GSEA, http://software.broadinstitute.org/gsea/index.jsp, accessed December 14, 2017) was employed to identify underlying mechanisms with different Molecular Signatures Database (MSigDB) gene sets, in which the c2 gene set (c2.all.v6.1.symbols.gmt) consisted of online pathway databases and the c5 gene set (c5.all.v6.1.symbols.gmt) consisted of genes annotated by Gene Ontology (GO) terms [34-36]. These enrichment results were at a significance level of P-value <0.05 and FDR <0.25 [34].
Statistical analysis
Kaplan-Meier survival curves were applied to assess the prognosis between two groups with a log-rank test; those clinical parameters with a P-value <0.05 were fitted into the multivariate Cox proportional hazards regression model as the adjustment variables. The comparison of gene expression levels between different subgroups was performed using the independent sample t-test. The diagnostic value of different RNAs was assessed by receiver operating characteristic (ROC) curves, with area under curve (AUC) and 95% confidence interval (CI) used to evaluate the accuracy of ROC curves. The volcano plots and heat maps were draw by the ggplot2 package in the R platform. P-value <0.05 was considered reached the statistically significant. All data statistical were conducted by SPSS version 20.0 (IBM Corporation, Armonk, NY, USA) and R3.3.1.
Results
Data source and differentially expressed RNAs screening
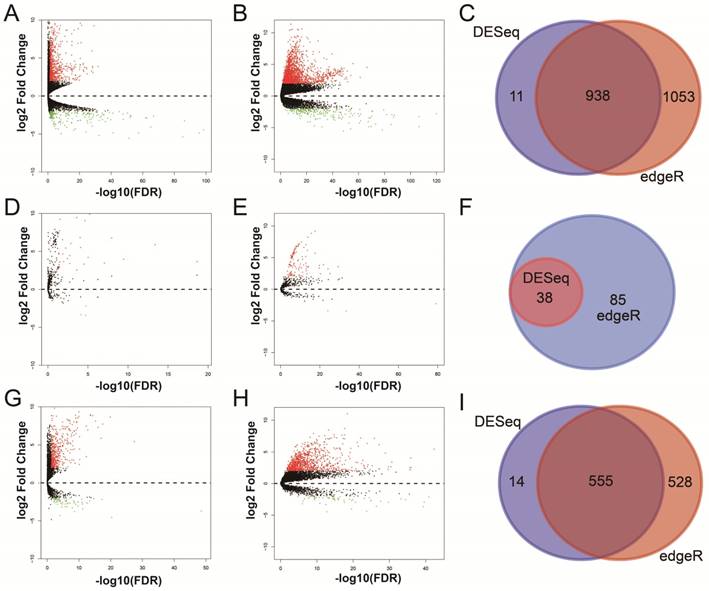
For RNA-Seq dataset, we excluded 3 recurrent tumor tissues from DEG and DEL screening, then, a total of 371 HCC patients' primary tumor and 50 adjacent normal liver tissues RNA-Seq dataset were used for DEG and DEL screening. Whereas, for miRNA-Seq dataset, we also excluded 3 recurrent tumor tissues from DEM screening, then, there were 372 HCC patients' primary tumor and 50 adjacent normal liver tissues miRNA-Seq dataset were used for DEM screening. By performed the DESeq and edgeR in the R platform, a total of 938 genes (Table S1, Figure 1A-C, Figure S2), 38 miRNAs (Table S2, Figure 1D-F, Figure S3) and 555 lncRNAs (Table S3, Figure 1G-I, Figure S4) were identified as DEGs, DEMs and DELs, respectively. Then, a total of 370 HCC patients with complete clinical prognostic parameters, and received RNA-Seq were included in further DEGs and DELs survival analysis; the baseline information for these patients is summarized in Table S4 [32]. A total of 371 HCC patients with complete clinical prognostic parameters, and received miRNA-Seq were included in further DEMs survival analysis; the baseline information for these patients is summarized in Table S5 [30]. Survival analysis of clinical parameters suggests that tumor stage and radical resections were markedly correlate to HCC OS in the present study (both log-rank P<0.05, Table S4 and S5), and should be fitted into the multivariate Cox proportional hazards regression model as the adjustment variables.
Differentially expressed RNAs analysis of TCGA HCC dataset. Notes: (A) DEGs identified using the DESeq package; (B) DEGs identified using the edgeR package; (C) Overlapping DEGs. (D) DEMs identified using the DESeq package; (E) DEMs identified using the edgeR package; (F) Overlapping DEMs. (G) DELs identified using the DESeq package; (H) DELs identified using the edgeR package; (I) Overlapping DELs.
Construction of the ceRNA network and functional assessment
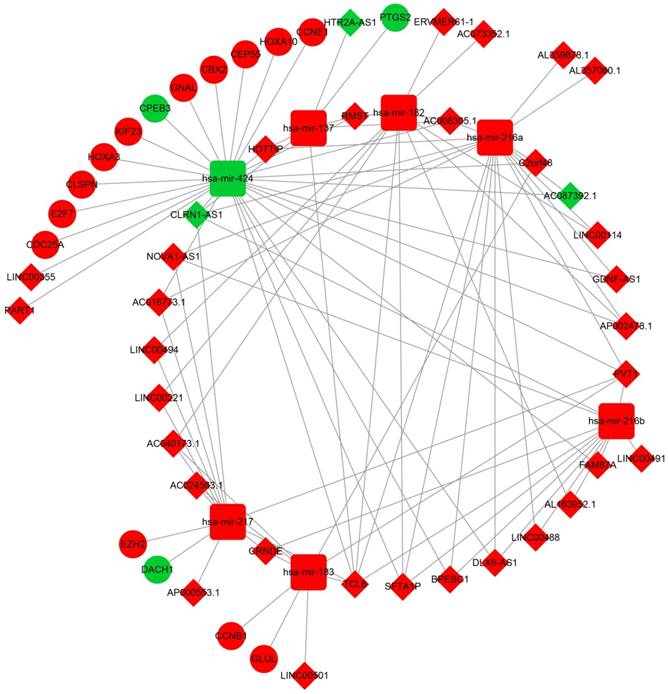
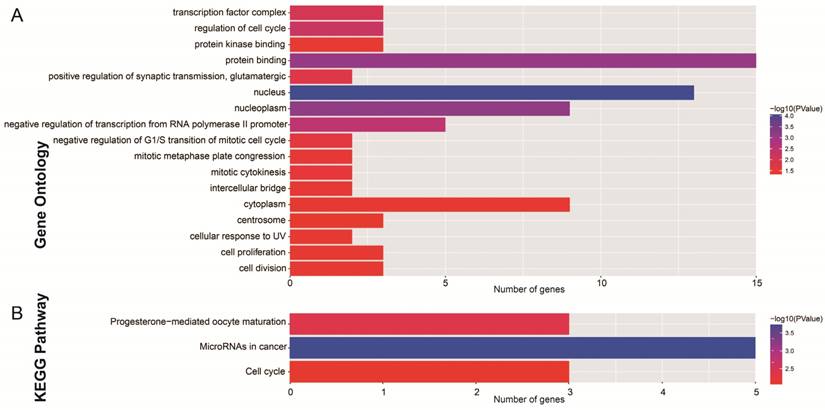
After the miRcode analysis was used for identify the lncRNA-miRNA interactions between DEMs and DELs, we obtained 83 DEL-DEM interactions for further ceRNA network construction. Meanwhile, target genes of DEMs were also investigated by three online tools (TargetScan, miRDB and miRTarBase), and 16 DEM-DEG interactions were used for further ceRNA network construction. The ceRNA network was constructed based on these 99 interactions and is shown in Figure 2; this included 16 DEGs, 7 DEMs and 34 DELs. We also investigated the potential function of these DEGs in the ceRNA network using DAVID v6.8, and found that these DEGs were mainly involved in cell cycle, cell proliferation, and cell division biological processes (Figure 3A). Whereas these DEGs were mainly involved in the cell cycle, microRNAs in cancer signaling pathways (Figure 3B). The directed acyclic graph of these genes also showed that these DEGs were significantly enriched in cell cycle biological processes (Figure S5, highlighted in red). Network investigation by GeneMANIA and STRING suggest that these DEGs form a complex interaction with each other, in particular co-expression interactions (Figure S6A-B).
The lncRNA-miRNA-mRNA ceRNA network. Diamonds represent DELs; balls represent DEGs; squares represent DEMs; red represent up-regulated; green represent down-regulated.
Functional assessment of the DEGs in ceRNA network. Notes: (A) GO term enrichment results of DEGs; (B) KEGG enrichment results of DEGs.
Construction of the HCC-specific differentially expressed RNAs-based prognostic signature
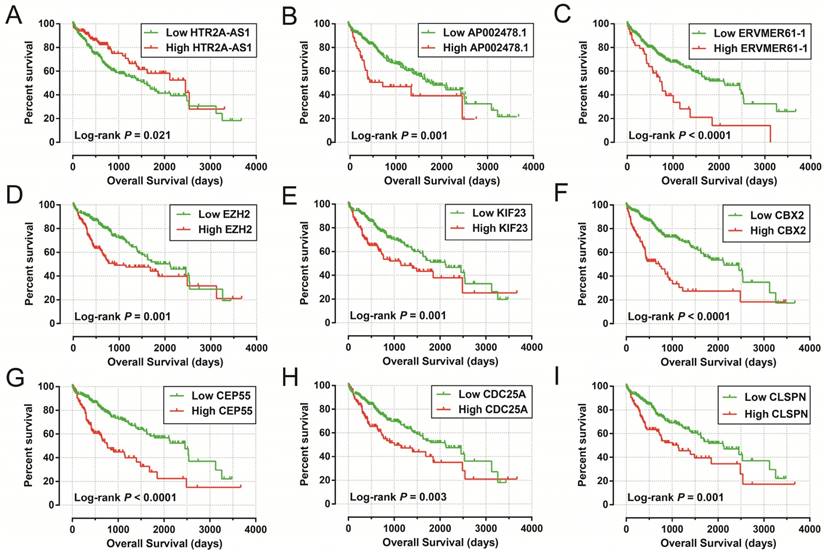
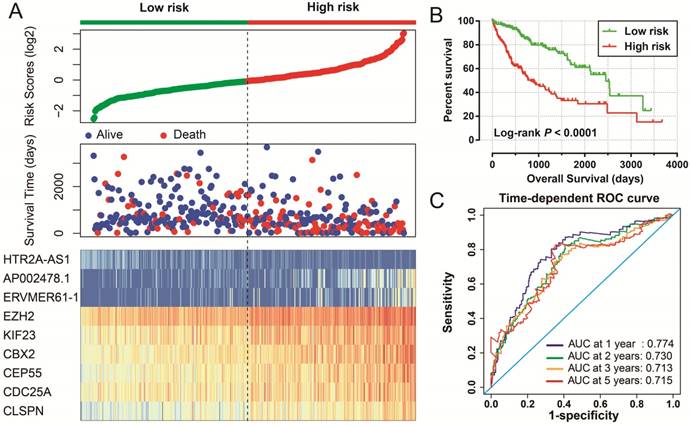
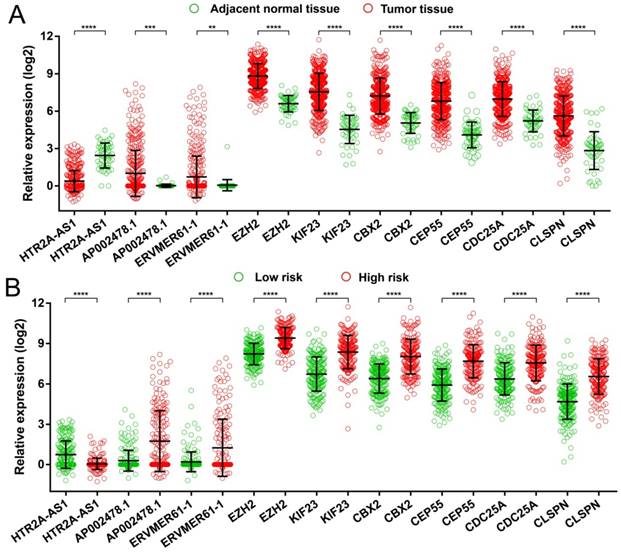
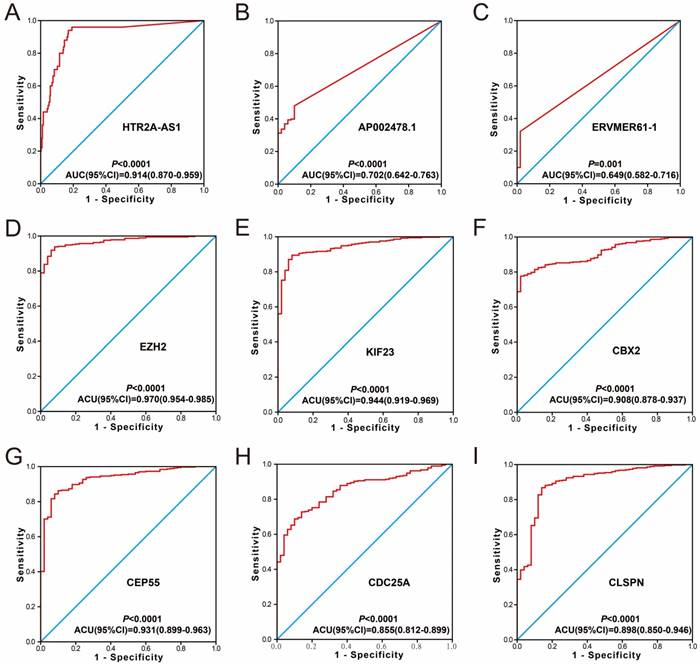
To further identify the prognostic values of these genes in the ceRNA network, we first used an univariate Cox proportional hazards regression model to evaluate the relationship between these RNAs and HCC OS. There were 24 RNAs which were significantly associated with HCC OS, including nine DEGs, one DEM (Figure 4A-C), and 14 DELs (Table S6). Due to the miRNA-Seq and RNA-Seq dataset from TCGA possibly having a batch effect in data merge and as there was only one miRNA correlated to HCC OS in the present study, we only used nine DEGs and 14 DELs for further prognostic signature construction. Therefore, these 23 RNAs were next screening by step function to investigate the optimal combination for HCC OS prediction; a combination consisting of three DELs (AP002478.1, HTR2A-AS1, and ERVMER61-1; Figure 5A-C) and six DEGs (enhancer of zeste homolog 2 [EZH2], kinesin family member 23 [KIF23], chromobox 2 [CBX2], centrosomal protein 55 [CEP55], cell division cycle 25A [CDC25A], and claspin [CLSPN]; Figure 5D-I) were considered the best combinations with the most significant P-value for HCC OS. Co-expression analysis revealed that these RNAs show a weak or moderate intensity of co-expression interactions, which were evaluated by the Pearson correlation coefficient (Figure S7). Afterwards, a multivariate Cox proportional hazards regression model was used for evaluate the relative weight for these genes in risk scores. The formula of the risk score was showed as follows: Risk score = expAP002478.1 × (0.1163) + expHTR2A-AS1 × (-0.1743) + expERVMER61-1 × (0.0839) + expEZH2 × (0.3437) + expKIF23 × (-0.2723) + expCBX2 × (0.1396) + expCEP55 × (0.2400) + expCDC25A × (-0.2002) + expCLSPN × (0.1522). Patients were grouped into two groups on the basis of the median value of risk score; those patients with a risk score less than the median value were defined as low risk, otherwise they were considered high risk. Survival analysis suggests that high risk patients were at a markedly increased risk of death in HCC (adjusted P<0.0001, adjusted HR = 2.761, 95% CI = 1.838-4.147), and with a shorter OS (837 vs. 2456 days for high risk vs. low risk, Table S4, Figure 6A-B). The accuracy of this prognostic signature in HCC long-term OS predictions was evaluated by a time-dependent ROC curve, and indicated that this prognostic signature showed a good performance in HCC long-term OS prediction with an AUC of 0.774, 0.730, 0.713, and 0.715 for 1-, 2-, 3-, and 5-year survival, respectively (Figure 6C). We also observed that the expression distribution of these nine RNAs were marked dysregulation between HCC tumors and adjacent normal liver tissues (Figure 7A), as well as between low risk and high risk groups' tumor tissues (Figure 7B). The ROC curve confirmed that these dysregulated RNAs in the prognostic signature may have potential diagnostic value in distinguishing HCC tumors from adjacent normal liver tissues (Figure 8A-I). The prognostic signature constructed in our current study also show a good performance in predicting HCC clinical parameters (Figure 9A-G), such as tumor stage (P=0.01, AUC = 0.591, 95%CI = 0.521-0.661; Figure 9A), histological grade (P<0.0001, AUC = 0.661, 95% CI = 0.604-0.718; Figure 9B), α-fetoprotein (AFP, P=0.048, AUC = 0.581, 95%CI = 0.504-0.659; Figure 9C), and radical resection (P=0.023, AUC = 0.610, 95%CI = 0.512-0.708; Figure 9G).
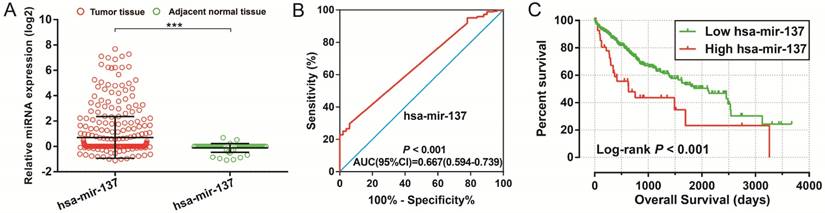
Diagnostic and prognostic value of hsa-mir-137 in TCGA HCC cohort. Notes:(A) Scatter plot of hsa-mir-137 expression level between HCC tumor and adjacent normal liver tissues; *** P<0.001. (B) Diagnosis ROC curve for hsa-mir-137. (C) The Kaplan-Meier curves for hsa-mir-137.
The Kaplan-Meier curves of prognostic signature RNAs in prognostic signature. Notes: The order of Kaplan-Meier curves of prognostic signature RNAs were as follow: (A) HTR2A-AS1, (B) AP002478.1, (C) ERVMER61-1, (D) EZH2, (E) KIF23, (F) CBX2, (G) CEP55, (H) CDC25A, (I) CLSPN.
Prognostic risk score model in HCC patients. Notes: (A) From top to bottom are the risk score, patients' survival status distribution, and 9 prognostic signature RNAs expression heat map between low- and high-risk groups. (B) Kaplan-Meier curves for low- and high-risk groups. (C) ROC curve for predicting survival in HCC patients by the risk score.
Expression distribution of 9 prognostic signature RNAs between HCC tumor and adjacent normal liver tissues, and low- and high-risk groups. Notes: (A) Scatter plot of 9 prognostic signature RNAs expression level between HCC tumor and adjacent normal liver tissues. (B) Scatter plot of 9 prognostic signature RNAs expression level between low- and high-risk groups.
Diagnosis ROC curve of 9 prognostic signature RNAs between HCC tumor and adjacent normal liver tissues. Notes: The order of ROC curves of 9 prognostic signature RNAs were as follow: (A) HTR2A-AS1, (B) AP002478.1, (C) ERVMER61-1, (D) EZH2, (E) KIF23, (F) CBX2, (G) CEP55, (H) CDC25A, (I) CLSPN.
The predictive values of the risk score for the HCC clinical features. Notes: ROC curve of risk score for clinical features: (A) tumor stage, (B) histological grade, (C) serum AFP, (D) MVI, (E) Child-Pugh score. (F) ishak fibrosis score, (G) radical resection.

Comprehensive survival analysis of the differentially expressed RNA-based prognostic signature
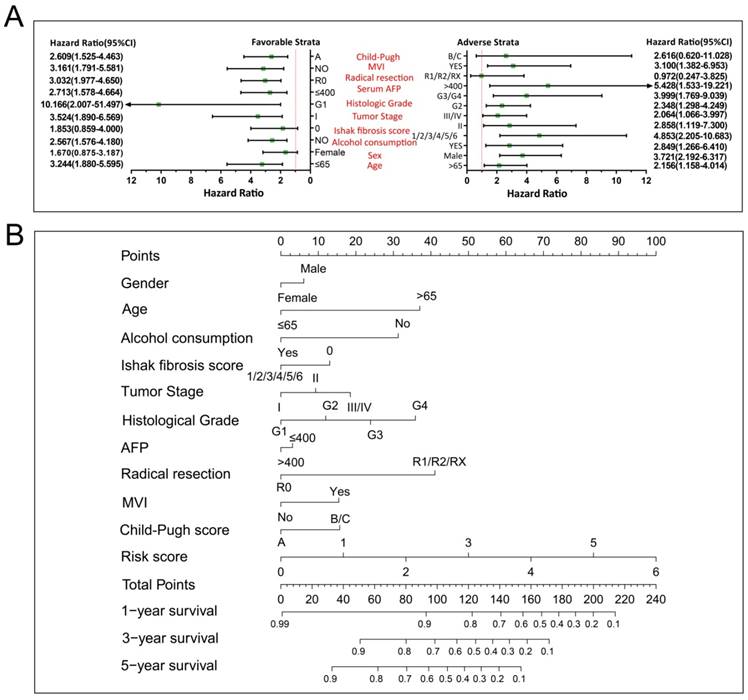
We further investigated the effect of this prognostic signature on HCC OS by using a stratified analysis after adjusting for tumor stage and radical resection in multivariate Cox proportional hazards regression model. As shown in Figure 10A, we observed that this prognostic signature notably increased the risk of death in all favorable and adverse strata, excluding in patients with Child-Pugh B/C stage, without hepatic fibrosis and radical resection, and female HCC patients. These results indicate that this prognostic signature may act as an independent prognostic risk factor for HCC prognosis. The nomogram also supported the stratified analysis results, and suggests that the risk score contributed the most risk points to HCC prognosis (range 0-100, Figure 10B) compared to other clinical parameters.
The relationship between risk score and clinical features. Notes: (A) Stratified analysis results of risk score in HCC OS. (B) Nomogram for predicting the 1-,3- and 5-year event (death) with risk score and clinical features.
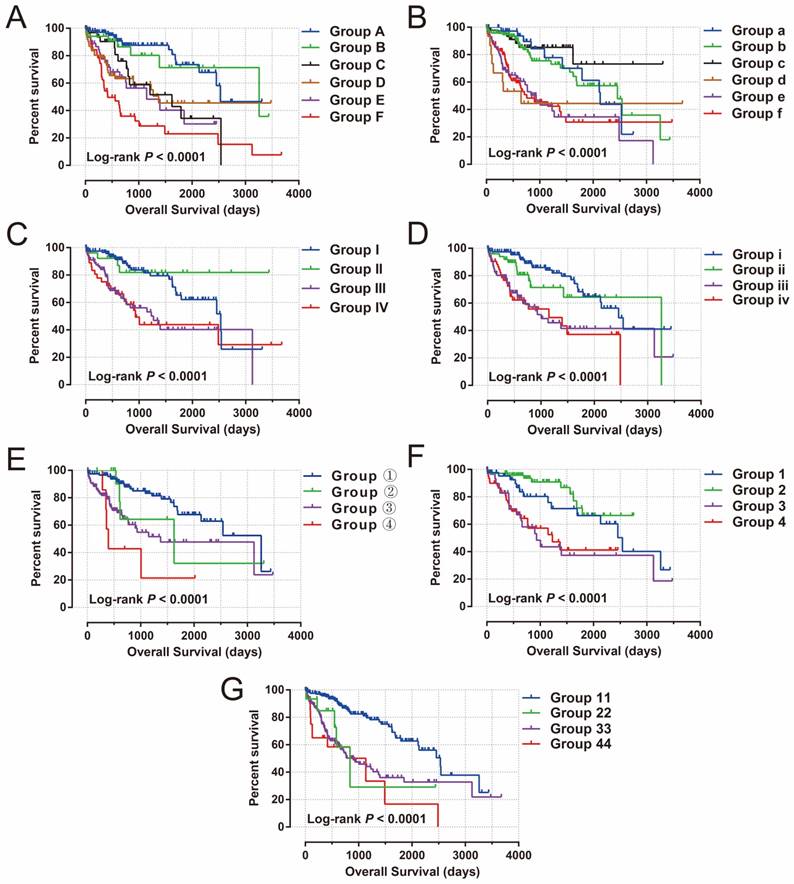
To further assess the combined effects of this prognostic signature and clinical features in HCC OS, joint effects survival analysis demonstrated that the combination of clinical features and prognostic signatures can significantly improve the value of these traditional clinical parameters in HCC OS prediction (all log-rank P<0.0001, Figure 11A-G, Table 1).
Joint effects survival analysis of OS stratified by risk score and HCC clinical features. Notes: Joint effects analysis stratified by risk score and following clinical features: (A) tumor stage, (B) histological grade, (C) serum AFP, (D) MVI, (E) Child-Pugh score. (F) ishak fibrosis score, (G) radical resection.
Joint effects survival analysis of clinical features and the prognostic signature with OS in HCC patients
| Group | Risk Score | Variables | Events/total(n=370) | MST (days) | Crude HR (95% CI) | Crude P | Adjusted HR (95% CI) | Adjusted P£ |
|---|---|---|---|---|---|---|---|---|
| Tumor Stage c | ||||||||
| A | Low risk | Stage I | 17/106 | 2532 | 1 | 1 | ||
| B | Low risk | Stage II | 7/34 | 3258 | 1.273(0.527-3.075) | 0.592 | 1.283(0.531-3.104) | 0.58 |
| C | Low risk | Stage III+IV | 13/33 | 1622 | 2.916(1.416-6.008) | 0.004 | 2.894(1.405-5.936) | 0.004 |
| D | High risk | Stage I | 25/65 | 1372 | 3.473(1.872-6.442) | <0.0001 | 3.446(1.857-6.393) | <0.0001 |
| E | High risk | Stage II | 19/51 | 1149 | 3.853(1.996-7.439) | <0.0001 | 3.812(1.974-7.362) | <0.0001 |
| F | High risk | Stage III+IV | 35/57 | 419 | 6.419(3.577-11.520) | <0.0001 | 5.839(3.211-10.617) | <0.0001 |
| Histological Grade d | ||||||||
| a | Low risk | G1 | 10/39 | 2131 | 1 | 1 | ||
| b | Low risk | G2 | 25/97 | 2456 | 1.045(0.501-2.177) | 0.907 | 1.388(0.563-3.424) | 0.476 |
| c | Low risk | G3+G4 | 7/46 | NA | 0.582(0.221-1.530) | 0.272 | 0.830(0.278-2.476) | 0.738 |
| d | High risk | G1 | 8/16 | 649 | 2.894(1.132-7.398) | 0.026 | 3.186(1.034-9.819) | 0.044 |
| e | High risk | G2 | 35/80 | 931 | 2.923(1.444-5.918) | 0.003 | 3.209(1.318-7.813) | 0.01 |
| f | High risk | G3+G4 | 41/87 | 757 | 2.814(1.406-5.633) | 0.003 | 3.346(1.407-7.962) | 0.006 |
| Serum AFP e | ||||||||
| I | Low risk | ≤400 | 25/118 | 2532 | 1 | 1 | ||
| II | Low risk | >400 | 4/26 | NA | 0.651(0.226-1.873) | 0.426 | 0.544(0.163-1.815) | 0.322 |
| III | High risk | ≤400 | 37/95 | 1271 | 2.735(1.641-4.558) | 0.00011 | 2.702(1.578-4.628) | 0.0003 |
| IV | High risk | >400 | 18/38 | 931 | 2.630(1.427-4.850) | 0.002 | 2.435(1.265-4.688) | 0.008 |
| MVI g | ||||||||
| i | Low risk | NO | 39/168 | 2532 | 1 | 1 | ||
| ii | Low risk | YES | 5/15 | 837 | 1.433(0.715-2.872) | 0.311 | 1.165(0.523-2.5950 | 0.708 |
| iii | High risk | NO | 71/155 | 899 | 3.162(1.878-5.323) | <0.0001 | 3.034(1.742-5.284) | <0.0001 |
| iv | High risk | YES | 12/25 | 1135 | 3.347(1.891-5.925) | <0.0001 | 2.686(1.334-5.407) | 0.006 |
| Child-Pugh score h | ||||||||
| ① | Low risk | A | 24/118 | 3258 | 1 | 1 | ||
| ② | Low risk | B+C | 4/14 | 1624 | 1.582(0.543-4.602) | 0.4 | 1.636(0.560-4.776) | 0.368 |
| ③ | High risk | A | 35/98 | 1372 | 2.713(1.607-4.582) | 0.0002 | 2.635(1.542-4.5030 | 0.0004 |
| ④ | High risk | B+C | 5/8 | 394 | 5.261(1.998-13.856) | 0.001 | 4.825(1.791-13.000) | 0.002 |
| Ishak fibrosis score b | ||||||||
| 1 | Low risk | 0 | 14/45 | 2542 | 1 | 1 | ||
| 2 | Low risk | 1/2/3/4/5/6 | 10/72 | NA | 0.510(0.224-1.162) | 0.109 | 0.538(0.225-1.283) | 0.162 |
| 3 | High risk | 0 | 16/29 | 931 | 2.203(1.071-4.523) | 0.032 | 1.903(0.893-4.054) | 0.095 |
| 4 | High risk | 1/2/3/4/5/6 | 24/65 | 1229 | 2.264(1.143-4.485) | 0.019 | 2.640(1.288-5.411) | 0.008 |
| Residual tumor f | ||||||||
| 11 | Low risk | R0 | 24/115 | 2456 | 1 | 1 | ||
| 22 | Low risk | R1+R2+RX | 12/50 | 3258 | 2.696(1.057-6.876) | 0.038 | 2.579(0.904-7.355) | 0.076 |
| 33 | High risk | R0 | 36/91 | 1005 | 3.075(2.074-4.558) | <0.0001 | 2.982(1.946-4.570) | <0.0001 |
| 44 | High risk | R1+R2+RX | 24/58 | 1149 | 4.286(2.235-8.221) | <0.0001 | 3.316(1.558-7.057) | 0.002 |
Notes: b Information of ishak fibrosis score was unavailable in 159 patients; c Information of tumor stage was unavailable in 24 patients; d Information of histological grade was unavailable in 5 patients; e Information of serum AFP was unavailable in 93 patients; f Information of radical resection was unavailable in 7 patients; g Information of micro vascular invasion was unavailable in 56 patients; h Information of Child-Pugh score was unavailable in 132 patients; £Adjusted for tumor stage and radical resection.
Abbreviations: OS, overall survival; HCC, hepatocellular carcinoma; MST, median survival time; HR, hazard ratio; CI, confidence interval; AFP, α-fetoprotein; MVI, micro vascular invasion.
GSEA
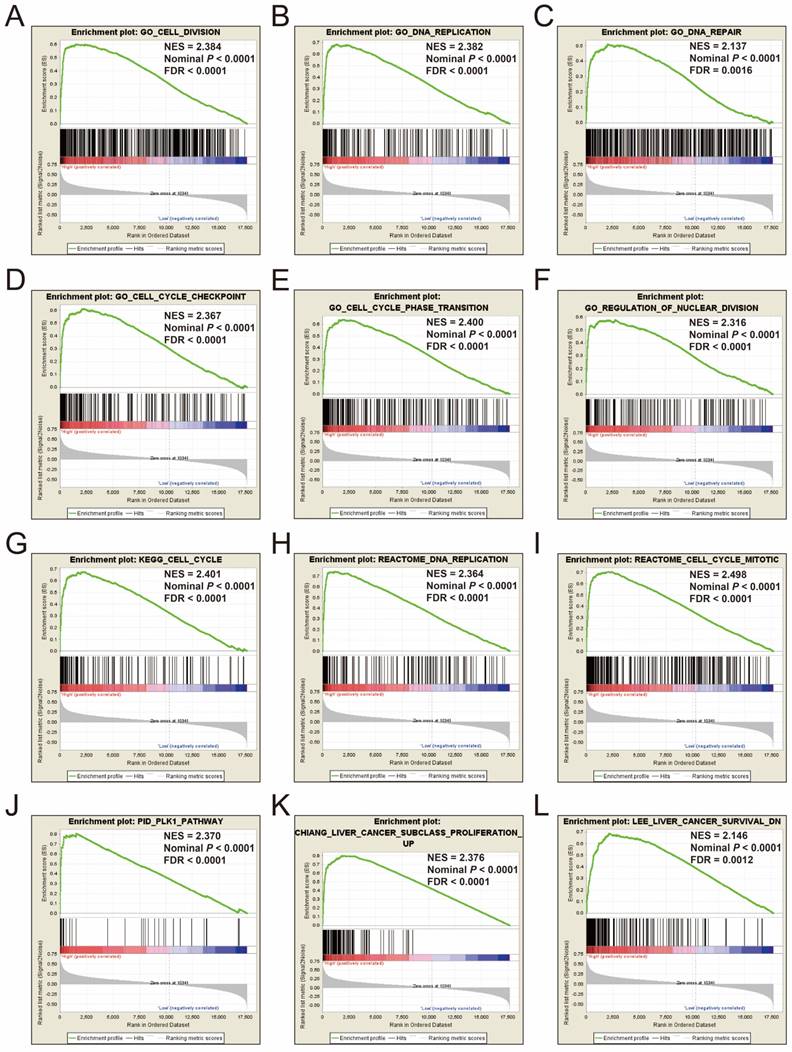
To explore the mechanisms between different risk score groups, the GSEA approach was used for identify the potential biological processes and pathways between low risk and high risk HCC patients. GSEA analysis results of the c5 gene set reveal that the phenotype of high risk may through involved in cell cycle, cell division, DNA repair and replication biological processes (Figure 12A-F, Table S7), whereas the results of the c2 gene set suggest that the phenotype of high risk may through involved in cell cycle, DNA replication, PLK1, liver cancer proliferation and survival signaling pathways (Figure 12G-L, Table S8). These results are consistent with the functional enrichment results of DEGs in the ceRNA network by DAVID. It is suggested that the genes in this prognostic signature may cause differences between different risk phenotypes of HCC by affecting the basic state of cells, thus affecting the prognosis of HCC.
GSEA results of c5 and c2 reference gene sets in high-risk groups. Notes: GSEA results for c5 reference gene sets (A-F) and c2 reference gene sets (G-L).
Discussion
The ceRNA hypothesis was considered to be a novel regulatory mechanism that works through miRNA competition [12, 37]. With further study of ceRNA crosstalk, previous studies have shown that ceRNA genes were mediated by miRNA in complex ceRNA networks, as well as miRNA interacted with lncRNA [38]. Since TCGA has complete RNA and miRNA sequencing data, it is most appropriate to use this database for ceRNA and prognostic biomarker mining. Extensive studies have used part of the TCGA database to investigate the ceRNA network for multiple types of cancer, including HCC [39], lung cancer [40, 41], colon cancer [42, 43], bladder cancer [44], gastric cancer (GC) [45], papillary thyroid cancer [46] and pancreatic cancer (PC) [47]. A previous study by Zhang et al. identified a ceRNA network by using TCGA HCC dataset; however, the fold change of RNAs in their study was set as 3, which was not a conventional and strict criteria for differential expression RNAs [39]. Therefore, the results obtained in their study may not be reliable. The advantage of our current study is that we have set the differential expression RNAs as: |log2 FC|>2 (|FC| > 4), and identified a prognostic signature, which was based on RNAs from the ceRNA network, which may be a potential independent indicator for HCC OS.
The prognostic signature identified in the current study consisted of three DELs and six DEGs. Three DELs in the prognostic signature have not been reported in previous cancer studies, whereas among the six DEGs (EZH2, KIF23, CBX2, CEP55, CDC25A, and CLSPN), most have been reported in cancer prognosis and dysregulated in tumor tissue. Extensive studies have reported that the mRNA or protein expression of EZH2 was markedly increased in HCC tumor tissues [48-52], and that high expression of EZH2 can serve as a poor prognostic indicator in HCC [48, 52]. The results of EZH2 in our study are consistent with previous reports, and suggest that the mRNA expression of EZH2 was significantly up-regulated in HCC tumor tissues and that high expression of EZH2 was associated with unfavorable HCC OS. Cai et al. also reported that the immunohistochemistry of EZH2 may be a promising biomarker in distinguishing between HCC and non-malignant nodules in liver needle biopsies; our current study also confirmed that mRNA expression of EZH2 also has a diagnostic value in distinguishing HCC from the adjacent normal liver tissues, which was consistent with the study of Cai et al [48]. Multiple studies have revealed that EZH2 was the target gene for some non-encoding RNAs, and that altering the expression of them may affect the expression of EZH2, thereby affecting the HCC phenotype, such as cell proliferation and invasion [51, 53, 54]. Similar results can also be observed in other cancers, as the overexpression of EZH2 is significantly associated with aggressive tumor behavior and unfavorable prognosis in Merkel cell carcinoma [55], non-small cell lung cancer (NSCLC) [56], prostate cancer (PCa) [57], osteosarcoma [58], endometrial cancer [59], Luminal A Breast Cancer (BC) [60]. However, the opposite effect of EZH2 has also been reported in colorectal cancer (CRC), suggesting that the overexpression of EZH2 was significantly correlated with a better prognosis and serves as a useful prognostic biomarker for anti-EGFR therapy in CRC [61, 62].
The five remaining DEGs (KIF23, CBX2, CEP55, CDC25A, and CLSPN) in the prognostic signature were rarely reported in HCC. KIF23, which has been observed to be notably increased in tumor tissues and the high expression of KIF23 was correlated with unfavorable prognosis in patients with glioma [63, 64], malignant pleural mesothelioma [65], lung cancer [66] and PC [67]. Functional experiments demonstrated that the knockdown of KIF23 expression can suppress the proliferation of glioma cells in vitro [63]. The results of KIF23 in HCC in the current study are also consistent with previous studies; furthermore, we also investigated the diagnostic value of KIF23 in HCC and suggested that the mRNA expression of KIF23 shows a good ability to distinguish between HCC tumors and adjacent normal liver tissue. A similar effect also can be observed in CBX2; Clermont et al. reported that CBX2 may play an oncogenic role in human neoplasms, and that the high expression of CBX2 was markedly correlated with an unfavorable OS in BC [68]. Another independent study by Liang et al. also validated these results in another independent cohort [69]. Clermont et al. also observed that CBX2 was recurrently up-regulated in metastatic PCa, and that patients with up-regulated expression of CBX2 had a significantly lower disease-free survival [70].
A previous HCC bioinformatics analysis study based on the Gene Expression Omnibus database showed that CEP55 was up-regulated in HCC tumor tissue, and that the increased expression of CEP55 was correlated with a short OS and DFS [71], which were consistent with the results we obtained in current study. The overexpression of CEP55 in tumor tissue has also been reported in PC [72], head and neck squamous cell carcinoma [73], epithelial ovarian carcinoma [74], GC [75], and BC [76]. In addition, CEP55 also served as a poor prognostic indicator in PC [72] and epithelial ovarian carcinoma [74]. Functional investigation suggests that CEP55 may act as an oncogene in cancers, and that the overexpression of CEP55 can promote cancer cell proliferation or invasion in PC [72], epithelial ovarian carcinoma [74], GC [75], and BC [76].
A study by Xu et al. demonstrated that CDC25A was up-regulated in HCC tumor tissue, and showed lower expression in liver cirrhosis and chronic hepatitis tissues [77]. The high expression of CDC25A was correlated with a markedly increased risk of HCC death and early recurrence, and could be serve as an independent prognostic indicator for HCC [77], in another words, the overexpression of CDC25A correlates with a more aggressive disease progression and an unfavorable prognosis in patients with HCC [78], which was in good agreement of our results. Furthermore, Wang et al. also reported that elevated CDC25A expression markedly associated with HCC tumor-node-metastasis staging, as well as venous invasion [79]. Functional exploration confirmed that the antagonism of CDC25A could inhibit the growth and invasion of HCC cells via cell cycle arrest at G0-G1 and suppress MT3-MMP expression, acting as an oncogene in HCC [80]. Similar carcinogenesis functions have also been observed in human gliomas [81]. However, functional investigation of another DEG, CLSPN, in the prognostic signature, demonstrated that CLSPN expression was markedly increased in cancer cell lines and tumor tissues, with a significant positive correlation with Ki-67, and may be a potential proliferation marker for cancers [82].
By analyzing the function of DEGs in the ceRNA network via DAVID, and GSEA analysis between low- and high-risk groups, we found that these DEGs were relevant to cell cycle biological processes and pathways; GSEA analysis also revealed that high-risk scores were also significantly enriched in cell cycle progression. We infer that this ceRNA network and prognostic signature may influence cell homeostasis by regulating the cell cycle, thereby affecting cell proliferation and the invasion of liver cancer, which affects disease progression and prognosis. By reviewing the relative literature, we found that DEGs such as CCNB1 and CCNE1, play key roles in the control of cell cycle phase transition in hepatocytes and HCC cells [83-85]. Among the six DEGs in the prognostic signature, most were also involved in cell cycle processes. The tumor suppressor miR-101 dramatically repressed cell cycle progression in vitro through directly targeting EZH2 in HCC [86], and some non-coding RNAs also take part in HCC cell cycle regulation via targeting CDC25A [87, 88]. Chang et al. demonstrated that CEP55 protein levels are regulated through a p53-Plk1-CEP55 axis, which is related to the mechanisms of p53-mediated repression in cell cycle processes [89]. Also, p53-dependent mechanisms have been reported in KIF23, and may be a principal mechanism for G2/M cell cycle arrest in cancer cells mediated by p53 [90]. The function of CLSPN plays a role in controlling the rates of DNA replication during the normal cell cycle, and is required for normal rates of global replication fork progression [91].
Due to the existence of a moderate intensity co-expression relationship between the above six DEGs, they are similar in terms of gene function, tumorigenesis and prognosis value. In the present study, these DEGs were notably increased in HCC tumor tissue, and the reduced expression of these genes predicted a better survival in patients with HCC, consistent with the previous studies of cancers. As well as in terms of genes function, previous studies reported that these DEGs were involved in cell cycle processes, and our enrichment analysis also indicated that these DEGs were relevant to the cell cycle in HCC.
In the present study, there were some limitations that need to be acknowledged. First, since all of the data in the current study were from TCGA, and the clinical information is incomplete, adjustment of the prognostic signature in the multivariate Cox proportional hazards regression model was not comprehensive, and cannot fully take into account these factors, which may affect HCC prognosis, but were not provided in the TCGA website. Second, as other public databases cannot provide a complete RNA-seq and miRNA-seq dataset in the same cohort of patients at the same time, and these datasets are not suitable to be used for ceRNA network construction; therefore, an additional verification cohort is needed to validate our results in future study.
Despite these limitations, in the present study we identified a large number of DEGs, DEMs and DELs between HCC primary tumor and adjacent normal liver tissues. Also, a ceRNA network of HCC was constructed based on these dysregulated RNAs via the bioinformatics approach, and a prognostic signature for HCC OS was developed. These findings may help to advance the understanding of dysregulated RNAs participating in the hepatocarcinogenesis, development, and prognosis of HCC, and will provide the foundation to develop novel clinical diagnostic and therapeutic biomarkers.
Conclusions
Through the comprehensive analysis of HCC RNA-Seq and miRNA-Seq datasets from TCGA, we constructed a ceRNA network based on 16 DEGs, 7 DEMs and 34 DELs, which may play a critical role in hepatocarcinogenesis. Furthermore, we also investigated a prognostic signature, which included three DELs and six DEGs, as a potential outcome predictor for HCC patients based on the ceRNA network. The potential mechanisms of this prognostic signature may be involved in the regulation of the cells' basic status, thus may affecting the clinical outcome of HCC. However, future functional investigations are still required to verify the mechanisms underlying the roles of these genes in HCC prognosis.
Supplementary Material
Supplementary figures.
Supplementary tables.
Acknowledgements
This work was supported in part by the National Natural Science Foundation of China (No.: 81560535, 81802874, 81072321, 30760243, 30460143 and 30560133), Natural Science Foundation of Guangxi Province of China (Grant No. 2018GXNSFBA138013 and 2018GXNSFAA050119), 2009 Program for New Century Excellent Talents in University (NCET), Guangxi Natural Sciences Foundation (No. GuiKeGong 1104003A-7), and Guangxi Health Ministry Medicine Grant (Key-Scientific Research-Grant Z201018). The present study is also partly supported by Scientific Research Fund of the Health and Family Planning Commission of Guangxi Zhuang Autonomous Region (Z2016318), Key laboratory of High-Incidence-Tumor Prevention & Treatment (Guangxi Medical University), Ministry of Education (GKE2018-01), the Guangxi Key R & D Program (GKEAB18221019), The Basic Ability Improvement Project for Middle-aged and Young Teachers in Colleges and Universities in Guangxi (2018KY0110), Innovation Project of Guangxi Graduate Education (JGY2018037), and 2018 Innovation Project of Guangxi Graduate Education (YCBZ2018036). As well as, the present study is also partly supported by Research Institute of Innovative Think-tank in Guangxi Medical University (The gene-environment interaction in hepatocarcinogenesis in Guangxi HCCs and its translational applications in the HCC prevention). We would also acknowledge the supported by the National Key Clinical Specialty Programs (General Surgery & Oncology) and the Key Laboratory of Early Prevention & Treatment for Regional High-Incidence-Tumor (Guangxi Medical University), Ministry of Education, China. The authors thank the contributors of The Cancer Genome Atlas (https://cancergenome.nih.gov/) and UCSC Xena (http://xena.ucsc.edu/) for sharing the HCC data on open access.
Competing Interests
The authors have declared that no competing interest exists.
References
1. Torre LA, Bray F, Siegel RL, Ferlay J, Lortet-Tieulent J, Jemal A. Global cancer statistics, 2012. CA: a cancer journal for clinicians. 2015;65:87-108
2. Chen W, Zheng R, Baade PD, Zhang S, Zeng H, Bray F. et al. Cancer statistics in China, 2015. CA: a cancer journal for clinicians. 2016;66:115-32
3. Zeng H, Zheng R, Guo Y, Zhang S, Zou X, Wang N. et al. Cancer survival in China, 2003-2005: a population-based study. International journal of cancer. 2015;136:1921-30
4. Tang D, Nagano H, Nakamura M, Wada H, Marubashi S, Miyamoto A. et al. Clinical and pathological features of Allen's type C classification of resected combined hepatocellular and cholangiocarcinoma: a comparative study with hepatocellular carcinoma and cholangiocellular carcinoma. Journal of gastrointestinal surgery: official journal of the Society for Surgery of the Alimentary Tract. 2006;10:987-98
5. Iyer MK, Niknafs YS, Malik R, Singhal U, Sahu A, Hosono Y. et al. The landscape of long noncoding RNAs in the human transcriptome. Nature genetics. 2015;47:199-208
6. Mattick JS, Makunin IV. Non-coding RNA. Human molecular genetics. 2006:15 Spec No 1: R17-29
7. Esteller M. Non-coding RNAs in human disease. Nature reviews Genetics. 2011;12:861-74
8. George J, Patel T. Noncoding RNA as therapeutic targets for hepatocellular carcinoma. Seminars in liver disease. 2015;35:63-74
9. Klingenberg M, Matsuda A, Diederichs S, Patel T. Non-coding RNA in hepatocellular carcinoma: Mechanisms, biomarkers and therapeutic targets. Journal of hepatology. 2017;67:603-18
10. Wang Z, Li X. The role of noncoding RNA in hepatocellular carcinoma. Gland surgery. 2013;2:25-9
11. Shibata C, Otsuka M, Kishikawa T, Ohno M, Yoshikawa T, Takata A. et al. Diagnostic and therapeutic application of noncoding RNAs for hepatocellular carcinoma. World journal of hepatology. 2015;7:1-6
12. Salmena L, Poliseno L, Tay Y, Kats L, Pandolfi PP. A ceRNA hypothesis: the Rosetta Stone of a hidden RNA language? Cell. 2011;146:353-8
13. Tomczak K, Czerwinska P, Wiznerowicz M. The Cancer Genome Atlas (TCGA): an immeasurable source of knowledge. Contemporary oncology. 2015;19:A68-77
14. Cancer Genome Atlas Research Network. Electronic address wbe, Cancer Genome Atlas Research N. Comprehensive and Integrative Genomic Characterization of Hepatocellular Carcinoma. Cell. 2017;169:1327-41 e23
15. Anders S, Huber W. Differential expression analysis for sequence count data. Genome biology. 2010;11:R106
16. Robinson MD, McCarthy DJ, Smyth GK. edgeR: a Bioconductor package for differential expression analysis of digital gene expression data. Bioinformatics. 2010;26:139-40
17. Jeggari A, Marks DS, Larsson E. miRcode: a map of putative microRNA target sites in the long non-coding transcriptome. Bioinformatics. 2012;28:2062-3
18. Agarwal V, Bell GW, Nam JW, Bartel DP. Predicting effective microRNA target sites in mammalian mRNAs. eLife. 2015;4:e05005
19. Wong N, Wang X. miRDB: an online resource for microRNA target prediction and functional annotations. Nucleic acids research. 2015;43:D146-52
20. Chou CH, Shrestha S, Yang CD, Chang NW, Lin YL, Liao KW. et al. miRTarBase update 2018: a resource for experimentally validated microRNA-target interactions. Nucleic acids research. 2018;46:D296-D302
21. Huang da W, Sherman BT, Lempicki RA. Systematic and integrative analysis of large gene lists using DAVID bioinformatics resources. Nature protocols. 2009;4:44-57
22. Huang da W, Sherman BT, Lempicki RA. Bioinformatics enrichment tools: paths toward the comprehensive functional analysis of large gene lists. Nucleic acids research. 2009;37:1-13
23. Maere S, Heymans K, Kuiper M. BiNGO: a Cytoscape plugin to assess overrepresentation of gene ontology categories in biological networks. Bioinformatics. 2005;21:3448-9
24. Warde-Farley D, Donaldson SL, Comes O, Zuberi K, Badrawi R, Chao P. et al. The GeneMANIA prediction server: biological network integration for gene prioritization and predicting gene function. Nucleic acids research. 2010;38:W214-20
25. Mostafavi S, Ray D, Warde-Farley D, Grouios C, Morris Q. GeneMANIA: a real-time multiple association network integration algorithm for predicting gene function. Genome biology. 2008;9(Suppl 1):S4
26. von Mering C, Huynen M, Jaeggi D, Schmidt S, Bork P, Snel B. STRING: a database of predicted functional associations between proteins. Nucleic acids research. 2003;31:258-61
27. Szklarczyk D, Morris JH, Cook H, Kuhn M, Wyder S, Simonovic M. et al. The STRING database in 2017: quality-controlled protein-protein association networks, made broadly accessible. Nucleic acids research. 2017;45:D362-D8
28. Liao X, Huang K, Huang R, Liu X, Han C, Yu L. et al. Genome-scale analysis to identify prognostic markers in patients with early-stage pancreatic ductal adenocarcinoma after pancreaticoduodenectomy. OncoTargets and therapy. 2017;10:4493-506
29. Huang R, Liao X, Li Q. Identification and validation of potential prognostic gene biomarkers for predicting survival in patients with acute myeloid leukemia. OncoTargets and therapy. 2017;10:5243-54
30. Liao X, Zhu G, Huang R, Yang C, Wang X, Huang K. et al. Identification of potential prognostic microRNA biomarkers for predicting survival in patients with hepatocellular carcinoma. Cancer management and research. 2018;10:787-803
31. Liao X, Wang X, Huang K, Yang C, Yu T, Han C. et al. Genome-scale analysis to identify prognostic microRNA biomarkers in patients with early stage pancreatic ductal adenocarcinoma after pancreaticoduodenectomy. Cancer management and research. 2018;10:2537-51
32. Liao X, Yang C, Huang R, Han C, Yu T, Huang K. et al. Identification of Potential Prognostic Long Non-Coding RNA Biomarkers for Predicting Survival in Patients with Hepatocellular Carcinoma. Cellular physiology and biochemistry: international journal of experimental cellular physiology, biochemistry, and pharmacology. 2018;48:1854-69
33. Liao X, Liu X, Yang C, Wang X, Yu T, Han C. et al. Distinct Diagnostic and Prognostic Values of Minichromosome Maintenance Gene Expression in Patients with Hepatocellular Carcinoma. Journal of Cancer. 2018;9:2357-73
34. Subramanian A, Tamayo P, Mootha VK, Mukherjee S, Ebert BL, Gillette MA. et al. Gene set enrichment analysis: a knowledge-based approach for interpreting genome-wide expression profiles. Proceedings of the National Academy of Sciences of the United States of America. 2005;102:15545-50
35. Liberzon A, Birger C, Thorvaldsdottir H, Ghandi M, Mesirov JP, Tamayo P. The Molecular Signatures Database (MSigDB) hallmark gene set collection. Cell systems. 2015;1:417-25
36. Mootha VK, Lindgren CM, Eriksson KF, Subramanian A, Sihag S, Lehar J. et al. PGC-1alpha-responsive genes involved in oxidative phosphorylation are coordinately downregulated in human diabetes. Nature genetics. 2003;34:267-73
37. Tay Y, Rinn J, Pandolfi PP. The multilayered complexity of ceRNA crosstalk and competition. Nature. 2014;505:344-52
38. Karreth FA, Pandolfi PP. ceRNA cross-talk in cancer: when ce-bling rivalries go awry. Cancer discovery. 2013;3:1113-21
39. Zhang J, Fan D, Jian Z, Chen GG, Lai PB. Cancer Specific Long Noncoding RNAs Show Differential Expression Patterns and Competing Endogenous RNA Potential in Hepatocellular Carcinoma. PloS one. 2015;10:e0141042
40. Ning P, Wu Z, Hu A, Li X, He J, Gong X. et al. Integrated genomic analyses of lung squamous cell carcinoma for identification of a possible competitive endogenous RNA network by means of TCGA datasets. PeerJ. 2018;6:e4254
41. Sui J, Xu SY, Han J, Yang SR, Li CY, Yin LH. et al. Integrated analysis of competing endogenous RNA network revealing lncRNAs as potential prognostic biomarkers in human lung squamous cell carcinoma. Oncotarget. 2017;8:65997-6018
42. Li F, Li Q, Wu X. Construction and analysis for differentially expressed long non-coding RNAs and MicroRNAs mediated competing endogenous RNA network in colon cancer. PloS one. 2018;13:e0192494
43. Zhang Z, Wang S, Ji D, Qian W, Wang Q, Li J. et al. Construction of a ceRNA network reveals potential lncRNA biomarkers in rectal adenocarcinoma. Oncology reports. 2018;39:2101-13
44. Wang H, Niu L, Jiang S, Zhai J, Wang P, Kong F. et al. Comprehensive analysis of aberrantly expressed profiles of lncRNAs and miRNAs with associated ceRNA network in muscle-invasive bladder cancer. Oncotarget. 2016;7:86174-85
45. Li CY, Liang GY, Yao WZ, Sui J, Shen X, Zhang YQ. et al. Integrated analysis of long non-coding RNA competing interactions reveals the potential role in progression of human gastric cancer. International journal of oncology. 2016;48:1965-76
46. Zhao Y, Wang H, Wu C, Yan M, Wu H, Wang J. et al. Construction and investigation of lncRNA-associated ceRNA regulatory network in papillary thyroid cancer. Oncology reports. 2018;39:1197-206
47. Yao K, Wang Q, Jia J, Zhao H. A competing endogenous RNA network identifies novel mRNA, miRNA and lncRNA markers for the prognosis of diabetic pancreatic cancer. Tumour biology: the journal of the International Society for Oncodevelopmental Biology and Medicine. 2017;39:1010428317707882
48. Cai MY, Tong ZT, Zheng F, Liao YJ, Wang Y, Rao HL. et al. EZH2 protein: a promising immunomarker for the detection of hepatocellular carcinomas in liver needle biopsies. Gut. 2011;60:967-76
49. Cui S, Sun Y, Liu Y, Liu C, Wang J, Hao G. et al. MicroRNA137 has a suppressive role in liver cancer via targeting EZH2. Molecular medicine reports. 2017;16:9494-502
50. Sudo T, Utsunomiya T, Mimori K, Nagahara H, Ogawa K, Inoue H. et al. Clinicopathological significance of EZH2 mRNA expression in patients with hepatocellular carcinoma. British journal of cancer. 2005;92:1754-8
51. Yang F, Lv LZ, Cai QC, Jiang Y. Potential roles of EZH2, Bmi-1 and miR-203 in cell proliferation and invasion in hepatocellular carcinoma cell line Hep3B. World journal of gastroenterology. 2015;21:13268-76
52. Zhai R, Tang F, Gong J, Zhang J, Lei B, Li B. et al. The relationship between the expression of USP22, BMI1, and EZH2 in hepatocellular carcinoma and their impacts on prognosis. OncoTargets and therapy. 2016;9:6987-98
53. Zhou M, Zhang XY, Yu X. Overexpression of the long non-coding RNA SPRY4-IT1 promotes tumor cell proliferation and invasion by activating EZH2 in hepatocellular carcinoma. Biomedicine & pharmacotherapy = Biomedecine & pharmacotherapie. 2017;85:348-54
54. Zhang JJ, Chen JT, Hua L, Yao KH, Wang CY. miR-98 inhibits hepatocellular carcinoma cell proliferation via targeting EZH2 and suppressing Wnt/beta-catenin signaling pathway. Biomedicine & pharmacotherapy = Biomedecine & pharmacotherapie. 2017;85:472-8
55. Harms KL, Chubb H, Zhao L, Fullen DR, Bichakjian CK, Johnson TM. et al. Increased expression of EZH2 in Merkel cell carcinoma is associated with disease progression and poorer prognosis. Human pathology. 2017;67:78-84
56. Kim NY, Pyo JS. Clinicopathological significance and prognostic role of EZH2 expression in non-small cell lung cancer. Pathology, research and practice. 2017;213:778-82
57. Lobo J, Rodrigues A, Antunes L, Graca I, Ramalho-Carvalho J, Vieira FQ. et al. High immunoexpression of Ki67, EZH2, and SMYD3 in diagnostic prostate biopsies independently predicts outcome in patients with prostate cancer. Urologic oncology. 2018;36:161 e7- e17
58. Sun R, Shen J, Gao Y, Zhou Y, Yu Z, Hornicek F. et al. Overexpression of EZH2 is associated with the poor prognosis in osteosarcoma and function analysis indicates a therapeutic potential. Oncotarget. 2016;7:38333-46
59. Oki S, Sone K, Oda K, Hamamoto R, Ikemura M, Maeda D. et al. Oncogenic histone methyltransferase EZH2: A novel prognostic marker with therapeutic potential in endometrial cancer. Oncotarget. 2017;8:40402-11
60. Jang SH, Lee JE, Oh MH, Lee JH, Cho HD, Kim KJ. et al. High EZH2 Protein Expression Is Associated with Poor Overall Survival in Patients with Luminal A Breast Cancer. Journal of breast cancer. 2016;19:53-60
61. Yamamoto I, Nosho K, Kanno S, Igarashi H, Kurihara H, Ishigami K. et al. EZH2 expression is a prognostic biomarker in patients with colorectal cancer treated with anti-EGFR therapeutics. Oncotarget. 2017;8:17810-8
62. Vilorio-Marques L, Martin V, Diez-Tascon C, Gonzalez-Sevilla MF, Fernandez-Villa T, Honrado E. et al. The role of EZH2 in overall survival of colorectal cancer: a meta-analysis. Scientific reports. 2017;7:13806
63. Takahashi S, Fusaki N, Ohta S, Iwahori Y, Iizuka Y, Inagawa K. et al. Downregulation of KIF23 suppresses glioma proliferation. Journal of neuro-oncology. 2012;106:519-29
64. Sun L, Zhang C, Yang Z, Wu Y, Wang H, Bao Z. et al. KIF23 is an independent prognostic biomarker in glioma, transcriptionally regulated by TCF-4. Oncotarget. 2016;7:24646-55
65. Kato T, Lee D, Wu L, Patel P, Young AJ, Wada H. et al. Kinesin family members KIF11 and KIF23 as potential therapeutic targets in malignant pleural mesothelioma. International journal of oncology. 2016;49:448-56
66. Kato T, Wada H, Patel P, Hu HP, Lee D, Ujiie H. et al. Overexpression of KIF23 predicts clinical outcome in primary lung cancer patients. Lung cancer. 2016;92:53-61
67. Zhou Z, Cheng Y, Jiang Y, Liu S, Zhang M, Liu J. et al. Ten hub genes associated with progression and prognosis of pancreatic carcinoma identified by co-expression analysis. International journal of biological sciences. 2018;14:124-36
68. Clermont PL, Sun L, Crea F, Thu KL, Zhang A, Parolia A. et al. Genotranscriptomic meta-analysis of the Polycomb gene CBX2 in human cancers: initial evidence of an oncogenic role. British journal of cancer. 2014;111:1663-72
69. Liang YK, Lin HY, Chen CF, Zeng. Prognostic values of distinct CBX family members in breast cancer. Oncotarget. 2017;8:92375-87
70. Clermont PL, Crea F, Chiang YT, Lin D, Zhang A, Wang JZ. et al. Identification of the epigenetic reader CBX2 as a potential drug target in advanced prostate cancer. Clinical epigenetics. 2016;8:16
71. Li L, Lei Q, Zhang S, Kong L, Qin B. Screening and identification of key biomarkers in hepatocellular carcinoma: Evidence from bioinformatic analysis. Oncology reports. 2017;38:2607-18
72. Peng T, Zhou W, Guo F, Wu HS, Wang CY, Wang L. et al. Centrosomal protein 55 activates NF-kappaB signalling and promotes pancreatic cancer cells aggressiveness. Scientific reports. 2017;7:5925
73. Waseem A, Ali M, Odell EW, Fortune F, Teh MT. Downstream targets of FOXM1: CEP55 and HELLS are cancer progression markers of head and neck squamous cell carcinoma. Oral oncology. 2010;46:536-42
74. Zhang W, Niu C, He W, Hou T, Sun X, Xu L. et al. Upregulation of centrosomal protein 55 is associated with unfavorable prognosis and tumor invasion in epithelial ovarian carcinoma. Tumour biology: the journal of the International Society for Oncodevelopmental Biology and Medicine. 2016;37:6239-54
75. Tao J, Zhi X, Tian Y, Li Z, Zhu Y, Wang W. et al. CEP55 contributes to human gastric carcinoma by regulating cell proliferation. Tumour biology: the journal of the International Society for Oncodevelopmental Biology and Medicine. 2014;35:4389-99
76. Wang Y, Jin T, Dai X, Xu J. Lentivirus-mediated knockdown of CEP55 suppresses cell proliferation of breast cancer cells. Bioscience trends. 2016;10:67-73
77. Xu X, Yamamoto H, Sakon M, Yasui M, Ngan CY, Fukunaga H. et al. Overexpression of CDC25A phosphatase is associated with hypergrowth activity and poor prognosis of human hepatocellular carcinomas. Clinical cancer research: an official journal of the American Association for Cancer Research. 2003;9:1764-72
78. Boutros R, Lobjois V, Ducommun B. CDC25 phosphatases in cancer cells: key players? Good targets? Nature reviews Cancer. 2007;7:495-507
79. Wang XQ, Zhu YQ, Lui KS, Cai Q, Lu P, Poon RT. Aberrant Polo-like kinase 1-Cdc25A pathway in metastatic hepatocellular carcinoma. Clinical cancer research: an official journal of the American Association for Cancer Research. 2008;14:6813-20
80. Xu X, Yamamoto H, Liu G, Ito Y, Ngan CY, Kondo M. et al. CDC25A inhibition suppresses the growth and invasion of human hepatocellular carcinoma cells. International journal of molecular medicine. 2008;21:145-52
81. Yamashita Y, Kasugai I, Sato M, Tanuma N, Sato I, Nomura M. et al. CDC25A mRNA levels significantly correlate with Ki-67 expression in human glioma samples. Journal of neuro-oncology. 2010;100:43-9
82. Tsimaratou K, Kletsas D, Kastrinakis NG, Tsantoulis PK, Evangelou K, Sideridou M. et al. Evaluation of claspin as a proliferation marker in human cancer and normal tissues. The Journal of pathology. 2007;211:331-9
83. Zschemisch NH, Liedtke C, Dierssen U, Nevzorova YA, Wustefeld T, Borlak J. et al. Expression of a cyclin E1 isoform in mice is correlated with the quiescent cell cycle status of hepatocytes in vivo. Hepatology. 2006;44:164-73
84. Jiang W, Huang H, Ding L, Zhu P, Saiyin H, Ji G. et al. Regulation of cell cycle of hepatocellular carcinoma by NF90 through modulation of cyclin E1 mRNA stability. Oncogene. 2015;34:4460-70
85. Wang B, Xunsun, Liu JY, Yang D, Yang LL, Kong DX. et al. The effect of cell cycle and expression of cyclin B1 and cyclin C protein in hepatocellular carcinoma cell line HepG2 and SMMC-7721 after of silencing beta-catenin gene. Hepato-gastroenterology. 2012;59:515-8
86. Xu L, Beckebaum S, Iacob S, Wu G, Kaiser GM, Radtke A. et al. MicroRNA-101 inhibits human hepatocellular carcinoma progression through EZH2 downregulation and increased cytostatic drug sensitivity. Journal of hepatology. 2014;60:590-8
87. Zhu X, Wu L, Yao J, Jiang H, Wang Q, Yang Z. et al. MicroRNA let-7c Inhibits Cell Proliferation and Induces Cell Cycle Arrest by Targeting CDC25A in Human Hepatocellular Carcinoma. PloS one. 2015;10:e0124266
88. Furuta M, Kozaki K, Tanimoto K, Tanaka S, Arii S, Shimamura T. et al. The tumor-suppressive miR-497-195 cluster targets multiple cell-cycle regulators in hepatocellular carcinoma. PloS one. 2013;8:e60155
89. Chang YC, Wu CH, Yen TC, Ouyang P. Centrosomal protein 55 (Cep55) stability is negatively regulated by p53 protein through Polo-like kinase 1 (Plk1). The Journal of biological chemistry. 2012;287:4376-85
90. Fischer M, Quaas M, Steiner L, Engeland K. The p53-p21-DREAM-CDE/CHR pathway regulates G2/M cell cycle genes. Nucleic acids research. 2016;44:164-74
91. Petermann E, Helleday T, Caldecott KW. Claspin promotes normal replication fork rates in human cells. Molecular biology of the cell. 2008;19:2373-8
Author contact
![]() Corresponding author: Prof. Tao Peng, Department of Hepatobiliary Surgery, The First Affiliated Hospital of Guangxi Medical University, Shuang_Yong Rd. 6#, Nanning, 530021, Guangxi Zhuang Autonomous Region, People's Republic of China. Tel: (+86)-771-5356528. Fax: (+86)-771-5350031. E-mail: pengtaogmucom; pengtaoedu.cn. ORCID ID: http://orcid.org/0000-0001-6133-7078.
Corresponding author: Prof. Tao Peng, Department of Hepatobiliary Surgery, The First Affiliated Hospital of Guangxi Medical University, Shuang_Yong Rd. 6#, Nanning, 530021, Guangxi Zhuang Autonomous Region, People's Republic of China. Tel: (+86)-771-5356528. Fax: (+86)-771-5350031. E-mail: pengtaogmucom; pengtaoedu.cn. ORCID ID: http://orcid.org/0000-0001-6133-7078.