3.2
Impact Factor
ISSN: 1837-9664
J Cancer 2019; 10(18):4368-4379. doi:10.7150/jca.25422 This issue Cite
Research Paper
S-Adenosylmethionine Affects Cell Cycle Pathways and Suppresses Proliferation in Liver Cells
1. Institute of Precision Medicine, The Xiangya Hospital, State Key Laboratory of Medical Genetics, Xiangya Medical School, Central South University, Changsha, Hunan 410078, China
2. NHC Key Laboratory of Cancer Proteomics & Laboratory of Structural Biology, Xiangya Hospital, Central South University, Changsha, Hunan 410008, China
3. Department of Gastroenterology, The Xiangya Hospital, Central South University, Changsha 410008, China
Received 2018-11-13; Accepted 2019-5-21; Published 2019-7-22
Abstract
S-Adenosylmethionine (SAMe) is a kind of common liver-protection medicine. Recent studies have shown that SAMe has the inhibitory effects on hepatocellular carcinoma (HCC). But the specific mechanism has not been elucidated. Here, we examine the effects and relevant mechanisms of SAMe on human hepatocellular carcinoma cell HepG2 and mouse hepatocyte AML12. We applied the technique of RNA sequencing (RNA-Seq) to identify the differentially expressed genes between HepG2 cells which were treated with SAMe or not. And western blot and Quantitative RT-PCR was used to confirm some of these genes. To investigate the response to SAMe treatment, cell proliferation assay (MTS) and flow cytometry-based assays were carried out. A total of 472 SAMe-related genes were identified by RNA-Seq. We found that differentially expressed genes were enriched in cell cycle related signaling pathway significantly by the KEGG and GO Pathway enrichment analysis. Through the construction of protein-protein interaction network, we observed the module associated with cell cycle is in the core of the whole network. All these results implied that cell cycle pathway may be very important in the regulation of SAMe effected on HepG2 cells. Then the RNA-Seq-characterized genes involved in cell cycle (MCM3, MCM4, and E2F1) were confirmed by Western blot and Quantitative RT-PCR in HepG2 and AML12 cells. MTS analysis showed that SAMe could diminish cell proliferation. And flow cytometry-based assays indicated that treatment with SAMe altered cell cycle kinetic S phase cell cycle arrest. Altogether, our data uncovered the evidence of the antiproliferative action of SAMe in liver cells, and SAMe could lead to cell cycle inhibition by up-regulating MCM3, MCM4 and E2F1 expression. It provided an important theoretical basis for the clinical chemoprevention and treatment in HCC of SAMe.
Keywords: S-Adenosylmethionine, Liver cell, Cell cycle, Proliferation
Introduction
Hepatocellular carcinoma (HCC) is one of the most common malignancy worldwide and the second leading global cause of death related to cancer, with over 600,000 people affected [1,2,3]. Although increased focus and research, the clinical treatment of HCC remains a challenge. Only about 15% of patients with early-stage HCC could accept treatments such as hepatic resection and liver transplant which offer relatively good prognosis, but the majority of patients are diagnosed with advanced-stage HCC [4,5,6]. Conventional chemotherapy which is lacking in sensitivity and specificity is rarely used to treat HCC because of its serious toxicity and minimal success rate of 10%-20% [7,8]. One of the most important reasons for the poor prognosis is the lack of curative therapies, especially in the advanced stage. Thus, novel therapeutic methods and agents to HCC are extremely urgent needed.
S-Adenosylmethionine (SAMe) is a naturally occurring compound found in all living cells [9]. And it is a common biological methyl donor involved in methyl group transfer reactions and the intermediary metabolite related to the synthesis of glutathione and cysteine in the liver [10,11]. Chronic liver disease could result declining SAMe levels and hepatic SAMe deficiency is connected with increased oxidative stress[12], abnormal lipid homeostasis[13] and genomic instability[14]. As a kind of common liver-protection medicine, SAMe treatment is well established not only to protect against hepatic acute injury in clinic practice, but also to decrease fibrosis in multiple experimental models [15,16]. And no significant adverse events have been reported by using SAMe in clinical trials so far [17]. In the last few years, several researches have focused on the mechanism of SAMe as a key regulator in different tumors. It has been reported that proliferative response could be inhibited by SAMe in breast and colon cancer cells [18,19,20]. Ilisso CP and his colleagues found that SAMe could induce apoptosis in osteosarcoma cells by affecting ERK1/2 and Stat3 pathways [21]. SAMe could reduce expression of MAFG in response to cholestasis, and the expression of MAFG increases in human cholangiocarcinoma and HCC specimens [22]. And SAMe is pro-apoptotic in HCC by inducing Bcl-xs expression selectively but not in normal hepatocytes [23]. SAMe also exhibited anti-angiogenic properties [24]. Although studies have shown that SAMe has the inhibitory effects on HCC, but the specific mechanism has not been well elucidated.
As the incidence of hepatocellular carcinoma is to accelerate worldwide, chemoprevention which has received little attention must to be an important area [25]. Given SAMe's excellent safety property, it is very necessary to further clarify the mechanisms and efficacy of SAMe in preventing HCC. In this report, the differentially expressed genes between HepG2 cells which were treated with SAMe or not were identified by the technique of RNA sequencing (RNA-Seq). The effects and relevant mechanisms of SAMe on human hepatocellular carcinoma cell HepG2 and mouse hepatocyte AML12 was also analyzed. The aim was to increased knowledge on the treatment of HCC with SAMe.
Materials and methods
Cell lines and culture
Our lab maintained the Human hepatocellular carcinoma HepG2 cells. The cells were cultured in DMEM (Gibco) supplemented with fetal bovine serum (10%, FBS, Gibco). Mouse hepatocyte AML12 cells were kindly provided by Stem Cell Bank, Chinese Academy of Sciences. Here, we used a murine (AML12) rather than a human liver cell line in our experiments is a limitation of the present study. But AML12 is a well-accepted normal liver cell line in the field of hepatology [26,27]. AML12 cells were cultured in DMEM/F-12 (Gibco) with ITS Liquid Media Supplement (1%, Sigma), Dexamethasone (40ng/mL, Sigma) and fetal bovine serum (10%, FBS, Gibco). We cultured the cells at 37 ℃ with 5% CO2.
Cell treatments
SAMe (Sigma) was prepared as 100mM solutions in ddH2O, and then diluted into normal growth media for cell treatments. HepG2 cells were treated with SAMe (0.5mM) for 6 hours before extracted total RNA for RNA sequencing. Different doses of SAMe (0mM, 0.5mM, 1.0mM and 2.0mM) were used to incubated with HepG2 and AML12 cells for 24 hours respectively. After treatment, trypsinization was used to harvest the cells. These cells were used in subsequent experiments.
Identify differential expressed genes by RNA sequencing
TRIzol reagent (Invitrogen) was used to extract the total RNA according to the manufacturer's protocol. We used Qubit Fluorometer (Life Technologies) to quantify the RNA concentrations. Then we evaluated the integrity of the RNA by using Agilent Bioanalyzer 2100 (Agilent Technologies), and the samples with RNA integrity number (RIN)≥7.0 were used for sequencing library construction. Library construction was operated refer to Illumina manufacturer suggestions. Samples were run on a HiseqTM 2000 platform (Illumina) in duplicate. Before mapping the sequencing reads with poly A, adapters and low quality were pre-filtered. Filtered reads were aligned to the hg19 genome using default parameters from TopHat2 [28]. Differentially expressed genes were annotated and analyzed by R package DESeq [29]. And the significant genes were chosen with padj<0.05.
Enrichment
The KEGG pathway [30] annotation was conducted by KOBAS (2.0). GOseq was applied to conduct the gene ontology enrichment analysis (GO, http://www.geneontology.org/) [31]. The enrichment was call differentially enriched if they exhibited a Corrected P-value<0.05. In a final step, we retrieved the interacting genes using STRING database (http://www.string-db.org/). And then, a network analysis was performed using Cytoscape software version 3.0.
Quantitative RT-PCR analysis
To verify the RNA-Seq results, Quantitative RT-PCR analysis was used. The samples used for Quantitative RT-PCR assays were those which were used for RNA-Seq experiments. Reverse transcription was then operated using 1μg RNA and the GoScriptTM Reverse Transcription System (Promega). Quantitative RT-PCR analysis was done on a GoTaq® qPCR Master Mix (Promega), according to manufacturer's specification. We used the following primers:
Primers
| Gene name | Forward | Reverse |
|---|---|---|
| MCM3 (human) | CCTTGGGTAGTGCTGTGGAT | AGTGTTCGGGCTGTAACTGG |
| MCM4 (human) | AGCATGGCACTCATCCACAA | GCACAGCTCGATAGATGCCT |
| E2F1 (human) | AAACAAGGCCCGATCGATGT | TGGGATCTGTGGTGAGGGAT |
| β-Acting (human) | AGGGGCCGGACTCGTCATACT | GGCGGCACCACCATGTACCCT |
| MCM3 (mouse) | CCACCTACGCCAAGCAGTAT | CCTTCCACACAGACCACACA |
| MCM4 (mouse) | CTTGTTTTCCAGCCCTCCTC | CCACTTCTTGGGGTTCCTTC |
| E2F1 (mouse) | ATCACCTCCCTCCACATCC | TGACAGTTGGTCCTCTTCCA |
| β-Acting (mouse) | GGCCAACCGTGAAAAGATGA | CACAGCCTGGATGGCTACGTA |
β-Acting was used as an endogenous control. Experiments were repeated three times and operated in triplicate.
Western blot analysis
We washed the cells using ice-cold PBS and lysed in cell lysis buffer (DingGuo, BeiJing) to extract whole-cell protein. The supernatants of cell lysates were collected after cleared by centrifugation (12,000×g for 15 min, 4 ℃). We determined the protein concentrations by BCA protein assay (DingGuo, BeiJing). 15% SDS-PAGE was used to analyzed the protein samples with 40μg, and the samples were transferred electrophoretically to PVDF film (Millipore). Specific antibodies were probed with the blots and the immunoreactive proteins were detected by an ECL kit (Millipore). The antibodies used to carry out the western blot were as followed: Rabbit anti-MCM3 antibody (Proteintech), Rabbit anti-MCM4 antibody (Proteintech), Rabbit anti-E2F1 antibody (Proteintech), Rabbit anti-β-Acting antibody (CWBIO), Peroxidase-conjugated affinipure goat anti-rabbit IgG (ZSGB-BIO). β-Acting was used as an endogenous control and experiments were repeated three times.
Flow cytometry analysis
Cells were seeded in 10cm dishes and incubated with serum-fee medium for 24 hours. And then the culture medium with different doses of SAMe was used to incubate with these cells for 24 hours at 37 ℃, 5% CO2. We harvested the cells at 70%-80% confluence and fixed them by adding 70% ice-cold ethanol for 24 hours. Then cold phosphate-buffered saline (PBS) was used to wash the fixed cells and 1500μl propidium iodide (PI) solution was added. We used FACS Caliber (Becton-Dickinson) machine to detect the cell cycle. Results were analyzed further using the ModFit LT software. Experiments were repeated three times.
Cell proliferation assay
HepG2 and AML12 cells were seeded in the 96 well assay plate and incubated with the medium in the presence or absence of SAMe for 48 hours. The cell viability was measured by MTS analysis using CellTiter 96 AQueous One Solution Cell Proliferation Assay (Promega). For the MTS analysis, each well of the 96-well plate was added with 100μl of cells in culture medium. After 20μl reagent was pipetted into each well, the plates were incubated for 2 hours (37 ℃, 5% CO2). Finally, the optical density (OD) was observed using a multi-well plate reader (AWARE-NESS) by measuring absorbance at 490nm. The OD at 490 nm was measured for detecting the cell viability. Experiments were repeated three times and operated in triplicate.
Statistical analysis
Statistical analysis was performed with SPSS 13.0 for significance. The analysis of variance and t-test were applied in comparing the intergroup difference of experimental data. A p<0.05 was considered to indicate statistically significant result.
Results
Differentially expressed genes
In this study, we verified a transcriptome profile of the human hepatocellular carcinoma cell line HepG2 with SAMe treatment by RNA sequencing (RNA-Seq). A total of 472 genes were detected for expressed differentially (Supplementary Table S1), including 236 upregulated genes and 236 downregulated genes with fold changes≥2 in SAMe treated group compared with matched control group.
Pathway and functional enrichment analysis for RNA-seq
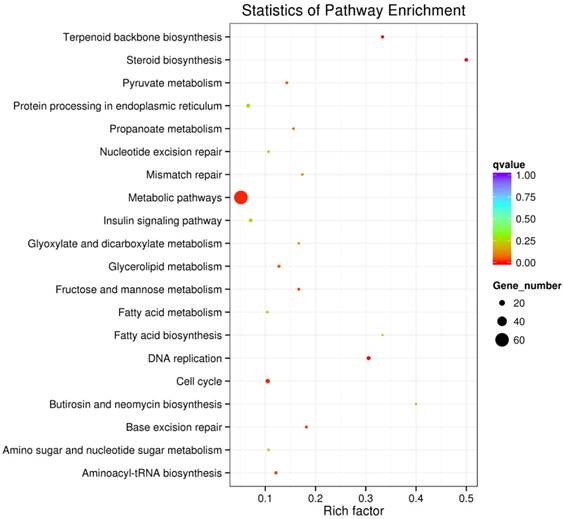
All of the differentially expressed genes were analyzed by KEGG enrichment analysis and they were functionally assigned to 210 KEGG pathways. The majority of the significant pathways were observed in Steroid biosynthesis, DNA replication, Terpenoid backbone biosynthesis and cell cycle. The 20 pathways with the greatest significance in SAMe treatment compared to control are summarized in Figure 1.
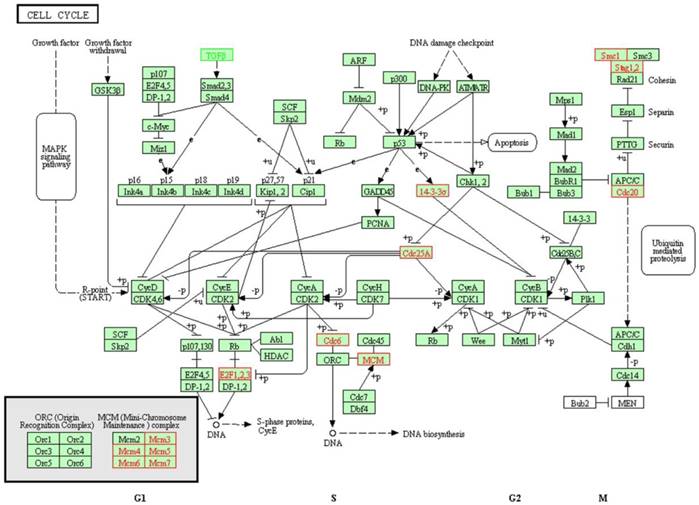
As the dysregulation of cell cycle progression is closely associated with the tumorigenesis, and the differentially expressed genes regulated by SAMe in hepatocellular carcinoma HepG2 cells were enriched in cell cycle pathway obviously, we focused on the further study on cell cycle pathway. There were 13 genes differentially expressed involved in this pathway (Table 1). Except TGFB1 was downregulated, the expression of others was accelerated. Previous studies have confirmed that these genes play very important roles in the cell cycle pathway (Figure 2).
The top 20 pathways in KEGG annotation results. We summarized the 20 pathways with the greatest significance within this experiment. The vertical axis represents the name of pathways, and the horizontal axis represents the rich factor. The size of the dots reflects the number of the differentially expressed genes in the pathway, and the color of them represent the spectrum from week to strong scores of Qvalue.
Differnetial expressed genes associated with cell cycle.
| Gene symbol | Gene title | log2 Fold Change | p value | Adjusted p |
|---|---|---|---|---|
| CDC6 | Cell division cycle 6 | 1.6653 | 4.26E-15 | 5.77E-12 |
| SFN | Stratifin | 1.587 | 1.69E-08 | 0.00000776 |
| E2F1 | E2F transcription factor 1 | 1.1015 | 2.14E-07 | 0.0000693 |
| CDC25A | Cell division cycle 25A | 1.4223 | 0.000001 | 0.00024731 |
| MCM6 | Minichromosome maintenance complex component 6 | 1.384 | 1.59E-06 | 0.00034698 |
| MCM4 | Minichromosome maintenance complex component 4 | 1.3216 | 1.64E-06 | 0.00035229 |
| STAG1 | Stromal antigen 1 | 1.1586 | 4.82E-06 | 0.00086294 |
| TGFB1 | Transforming growth factor beta 1 | -0.76717 | 0.0001565 | 0.014454 |
| MCM3 | Minichromosome maintenance complex component 3 | 1.1317 | 0.000205 | 0.017534 |
| MCM5 | Minichromosome maintenance complex component 5 | 1.017 | 0.0004547 | 0.03076 |
| MCM7 | Minichromosome maintenance complex component 7 | 0.91777 | 0.0007119 | 0.04129 |
| CDC20 | Cell division cycle 20 | 0.69303 | 0.0007335 | 0.042275 |
| SMC1A | Structural maintenance of chromosomes 1A | 0.65421 | 0.0007941 | 0.044867 |
Differentially expressed genes involved in cell cycle pathway. There were 13 genes differentially expressed involved in the cell cycle pathway. Except TGFB1 (marked green) was downregulated, the expression of others (marked red) were accelerated.
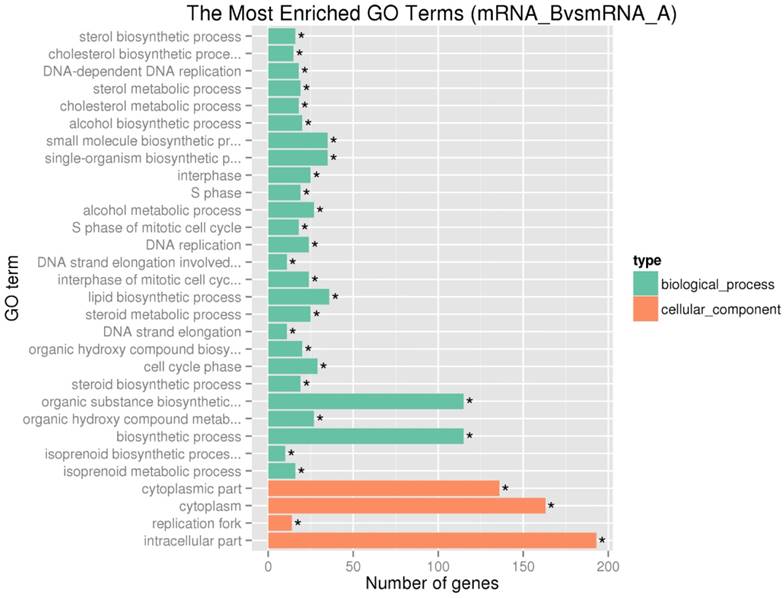
GO enrichment analysis demonstrated that 4049, 451 and 896 terms in the biological process, cellular component and molecular function categories, respectively. The most enriched GO terms in the categories for upregulated genes were included biological process related with cell cycle, such as interphase, S phase and cell cycle phase (Figure 3). The result was in accordance with the pathway enrichment analysis and indicated that SAMe could affect human hepatocellular carcinoma HepG2 cells by regulating the expression of genes related to cell cycle.
Network and module analysis
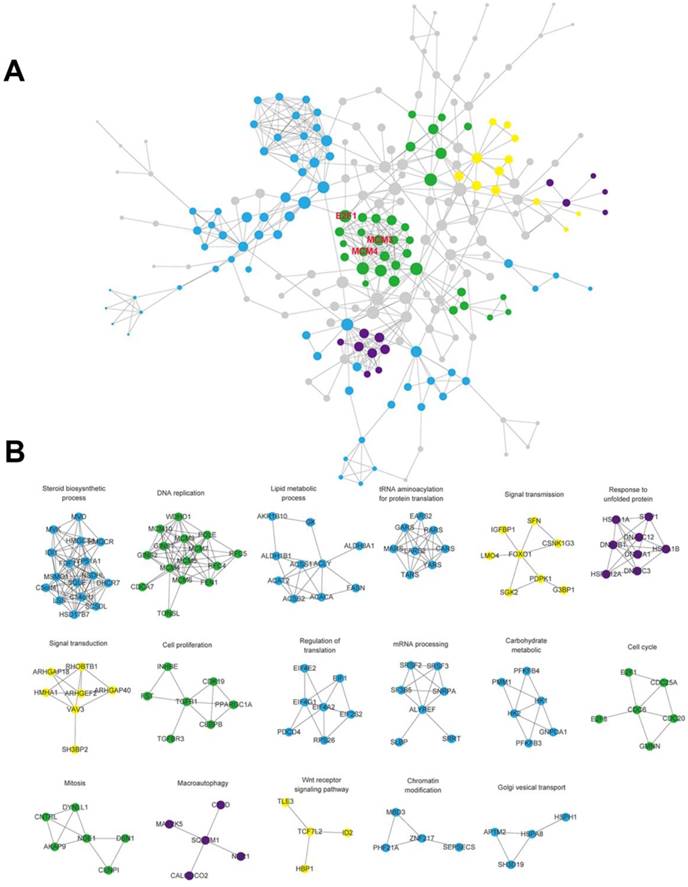
The interaction network between protein and protein was visualized after the interaction of the differentially expressed genes were predicted using the STRING database (Figure 4A). Some genes with similar function were clustered into 17 modules. (Figure 4B). There existed close interactions between these modules, and they may participate in the same biological functions. These modules were divided into four categories according to their biological functions as follows: cell cycle, signal pathway, metabolism of biological macromolecules and autophagy, then marked with green, yellow, blue and purple, respectively. We found the module of cell cycle which connects different parts of the whole network is in the core of the network. It implied that cell cycle pathway may be very important to the regulation of SAMe on HepG2 cells.
Identification of differentially expressed genes in cell cycle pathway
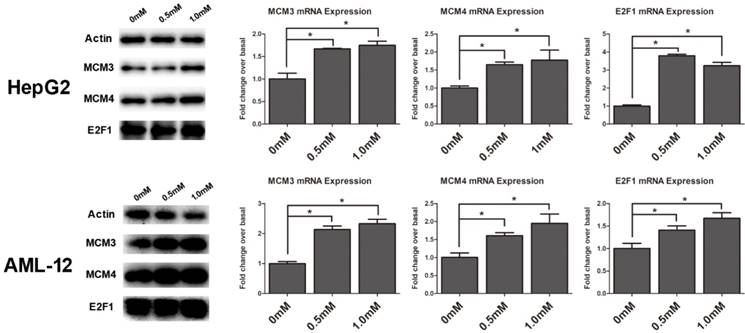
To validate the gene expression profiles detected by RNA-Seq analysis, the RNA and protein expression of the genes were examined by Quantitative RT-PCR and Western blot analysis in HepG2 and AML12 cells, respectively. We found MCM3, MCM4 and E2F1 were obviously upregulated in cell cycle pathway by KEGG analysis and they were within the module in the core of the protein-protein interaction network (Figure 4A), so we chose them to verify. Cells were exposed to SAMe for 24 hours with different doses (0mM, 0.5mM, 1.0mM) and assessed for the genetic expression (Figure 5). MCM3, MCM4 and E2F1 all demonstrated significant induction by SAMe, approximately 2-fold increase in protein level was observed after SAMe treatment both in HepG2 and AML12 cells (p<0.05). And the expression of these proteins obviously accelerated in a dose-dependent manner. Activation of these three genes by SAMe was also probed at the mRNA level (p<0.05). The results confirmed the differentially expressed genes within cell cycle pathway were regulated by SAMe in liver cells.
The top 30 enriched gene ontology terms for upregulated differentially expressed genes. We summarized the most enriched 30 GO terms in the categories for upregulated genes. The vertical axis represents the name of GO terms, and the horizontal axis represents the number of differential expressed genes within this term. *, Corrected P-value<0.05.
SAMe profoundly affects the cell division cycle in HepG2 and AML12 cells
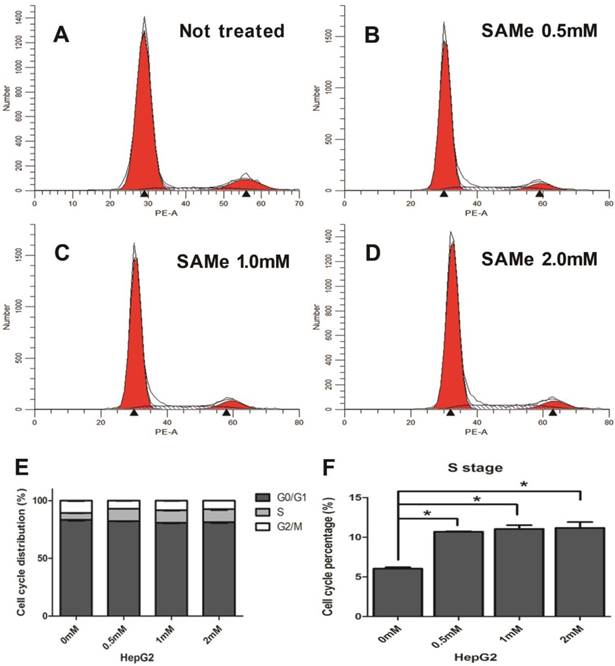
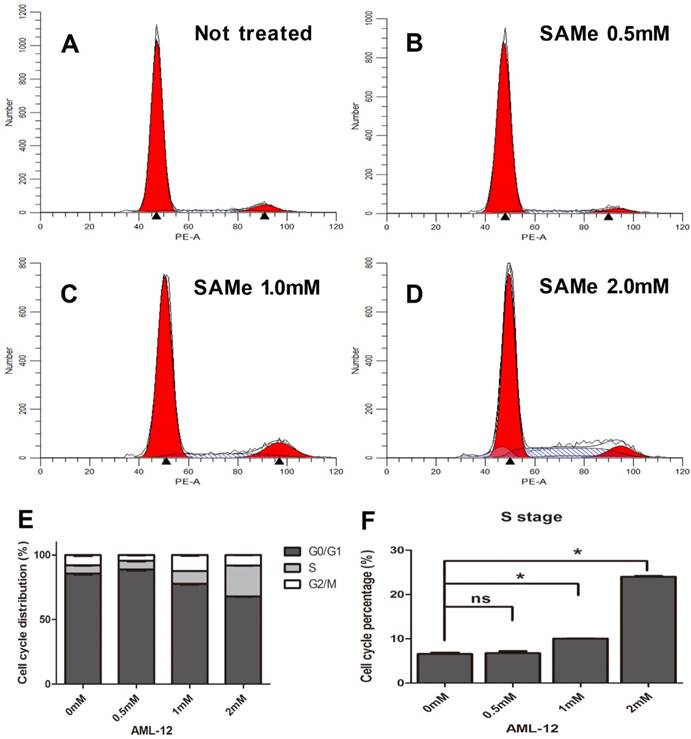
Since SAMe could regulated the expression of genes within cell cycle pathway in liver cells, then we further explore the effects of SAMe on distribution of the cell cycle phases in HepG2 and AML12 cells by flow cytometric analysis. Cells were exposed to SAMe for 24 hours with different doses (0mM, 0.5mM, 1.0mM and 2.0mM) and assessed for the cell cycle phases. Figure 6 shows that at different dose of SAMe (from 0.5mM up to 2.0mM), the percentage of S phase cells in SAMe incubated HepG2 is obviously more than that of control untreated cells.
And the analysis of cell cycle distribution on SAMe treated AML12 cells also demonstrated a significant increase in S phase (from 1.0mM up to 2.0mM) compared to control group of cells (Figure 7). Moreover, the number of S phase cells significantly accelerated in a dose-dependent manner (Figure 6F, 7F). Thus, SAMe not only regulated the expression of genes, but also inhibited the progression of cell cycle through arresting cells at S phase.
SAMe inhibits proliferation of HepG2 and AML12 cells
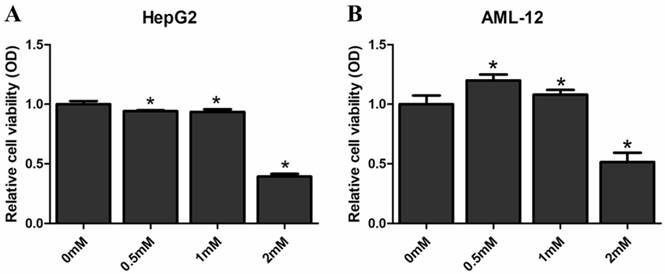
We examined the proliferative impact of SAMe on HepG2 and AML12 cells in order to evaluate the effects of SAMe on the liver cells. Cells were treated with SAMe (0 mM, 0.5 mM, 1.0 mM and 2.0 mM) for 48 hours and then MTS analysis was applied to detected the cell proliferation (Figure 8). SAMe treatment caused a dose-dependent inhibition of HepG2 cell proliferation; SAMe treatment did not inhibit AML12 proliferation at the concentration of 0.5 mM and 1.0 mM, while inhibited AML12 proliferation at the concentration of 2.0 mM. At the concentration of 2mM, the cell viability of AML12 (0.514±0.079) was higher than HepG2 (0.393±0.023). Taken together, our results suggested that SAMe treatment could inhibit the cell proliferation of HepG2 and AML12 cells by slowing-down cell cycle, and this effect is more obvious in HepG2 than AML12 cells.
Constructed protein-protein interaction network for the differentially expressed genes. A. The network included interactions between all of the differential expressed genes. The size of the dots reflects the between centrality of the gene within the network. MCM3, MCM4 and E2F1 which were genes in cell cycle pathway observed within the module in the core of the network. B. Some genes with similar function were clustered into 17 modules. And the modules were divided into four categories according to their biological functions as follows: cell cycle, signal pathway, metabolism of biological macromolecules and autophagy, then marked with green, yellow, blue and purple, respectively.
Discussion
Hepatocellular carcinoma (HCC) is one of the most common gastrointestinal malignancies worldwide. Patients with advanced HCC possess a dismal poor prognosis with their median survival times are generally less than one year [5]. Even the patients could undergo surgery, the 2 year recurrence rate still up to 50% [32]. Conventional chemotherapy is not only proved to be ineffective for HCC, but also exists serious toxicity, and it is rarely used for treatment [33]. Therefore, novel therapeutic approaches and agents to HCC are urgently needed.
SAMe induced up-regulation of MCM3, MCM4 and E2F1 genes and proteins. HepG2 and AML12 cells were treated with SAMe with different does (0mM, 0.5mM, 1.0mM), and replicate cultures were harvested at 24 hours after compound addition. The total protein extracts of cells and detected by Western blot analysis with antibodies against MCM3, MCM4 and E2F1. And the total RNA was extracted for subsequent Quantitative RT-PCR. Relative protein levels and mRNA (bar graphs) were assessed. *, p<0.05.
Effect of SAMe on cell cycle in HepG2 cells. Cells were incubated with medium supplemented or not with SAMe (A. 0mM, B. 0.5mM, C. 1.0mM and D. 2.0mM) for 24 hours. Flow cytometric analysis was performed. E&F. The percentage of S phase cells treated with SAMe is obviously more than that of control untreated cells. *, p<0.05.
Effect of SAMe on cell cycle in AML12 cells. Cells were incubated with medium supplemented or not with SAMe (A. 0mM, B. 0.5mM, C. 1.0mM and D. 2.0mM) for 24 hours. Flow cytometric analysis was performed. E&F. The percentage of S phase cells treated with SAMe is obviously more than that of control untreated cells. *, p<0.05.
Effect of SAMe on the proliferation of HepG2 and AML12 cells. Cells were treated with medium supplemented with SAMe (0mM, 0.5mM, 1.0mM and 2.0mM) for 48 hours. MTS analysis was performed to measure the effect of SAMe on cell proliferation. *, p<0.05 (vs 0 mM).
S-Adenosylmethionine (SAMe) is well known as the principal biological methyl donor. It is importance for regulating multiple hepatic functions [34] and SAMe synthesis is reduced in chronic liver disease [14]. SAMe is also available as a drug in many parts of the world in the treatment of various forms of chronic liver dysfunction such as alcoholic liver injury [35], intrahepatic cholestasis [36], and so on. SAMe at pharmacological doses has no toxic effects toward normal liver cells [37,23]. Recent researches illustrate that SAMe plays an essential role in diverse cellular processes including cell growth and death, even contribute to hepatocarcinogenesis. One important molecular mechanisms about growth inhibitory effect is SAMe can suppress the mitogenic activity of growth factors [38, 39]. Ansorena E [37] have reported that SAMe could induced apoptosis in HCC cells, while it protected against okadaic acid-induced apoptosis in normal hepatocytes. Lu SC and her colleagues proved that SAMe was capable of inhibiting the establishment of HCC model and exhibited anti-angiogenic properties [24]. All of these evidences indicate that SAMe might be effective in preventing HCC. Nevertheless, the efficacy and the mechanisms behind it are not clearly elucidated at present.
Increased SAMe levels could induce genomics alterations in human hepatoma cells. In the current study, we used RNA-Seq to identified 472 differentially expressed genes in SAMe treated HepG2 cells compared to the control untreated cells, including 236 upregulated genes and 236 downregulated genes. To make further understanding of the transcriptome data, KEGG pathway and GO enrichment analysis were applied. The differentially expressed genes were functionally assigned to 210 KEGG pathways, including Steroid biosynthesis, DNA replication, Terpenoid backbone biosynthesis and cell cycle with the greatest significance. And the result of GO enrichment analysis was in accordance with the pathway analysis and demonstrated the most enriched terms in the categories for upregulated genes were included biological process related with cell cycle. Through the construction of protein-protein interaction network, we observed the module associated with cell cycle is in the middle of the whole network. All these results implied that cell cycle pathway may be very important to the regulation of SAMe effected on HepG2 cells.
A normal cell cycle is controlled by numerous mechanisms. And some dysregulations within cell cycle could lead to aberrant cell proliferation and develop to cancer eventually [40]. Considered the differentially expressed genes regulated by SAMe in HepG2 cells were enriched in cell cycle pathway obviously, we inferred adjusting to cell cycle is essential for the potential inhibitory effect of SAMe in hepatoma cells. There were 13 genes differentially expressed involved, and most of them were accelerated except TGFB1. These significant genes have been proved to play very important roles in cell cycle regulation. MCM3, MCM4 and E2F1 were obviously upregulated in cell cycle pathway and they were found in the middle module of the protein-protein interaction network, so we chose them to validate the gene expression profiles detected by RNA-Seq analysis. We found that MCM3, MCM4 and E2F1 all demonstrated significant induction by SAMe at both mRNA and protein levels (p<0.05), which were in accordance with the RNA-Seq result. And the expression of these three genes obviously accelerated in a dose-dependent manner. The results confirmed the differentially expressed genes within cell cycle pathway were regulated by SAMe in liver cells.
Minichromosome maintenance family (MCM) which contains six highly related MCM genes (MCM2-7) is very important to DNA replication [41]. Many researches have reported that MCM genes play essential roles in various tumors [42,43]. But comprehensive analyses of the diagnostic and prognostic values of MCM genes in HCC still not clear. Xiwen Liao[44] observed that the expression of MCM2-7 genes was increased in HCC tissue, but only MCM2, MCM6 and MCM7 were significantly correlated with the HCC overall survival. Nan YL[45] reported the HCC risk was lower in patients with the MCM4. The E2F1 transcription factor has been identified as a tumor-suppressor gene enhancing apoptosis by DNA damage in tumors [46]. Some researchers found that downregulation of E2F1 may be a key factor in the inhibitory effects in HCC [47,48]. In our study, we found MCM3, MCM4 and E2F1 all demonstrated significant induction by SAMe, and inferred that they might be involved in the antiproliferative effect in response to SAMe.
To explore further explain the roles of SAMe on the cell cycle in liver cells, we examined the distribution of the cell cycle phases and the proliferative impact responded to SAMe treatment in HepG2 and AML12 cells. Our study exhibits that SAMe treatment possessed a significant effect on reducing liver cells proliferation and inhibiting the progression of cell cycle through arresting cells at S phase. The number of S phase cells significantly accelerated in a dose-dependent manner. And these effects were more obvious in HepG2 cells than AML-12 cells. Previous investigation found treatment of human colorectal cells SW-620 with SAMe could also decreased cell proliferation but altered cell cycle arrest at G2/M phase [18]. Surabhi Parashar [49] reported that SAMe is effective in inhibiting tumor growth of human osteosarcoma cells and increasing the number of tumor cells in G2/M phase. These results are differed from ours because the effect of SAMe on cell cycle regulation might be cell-type specific. But accumulating evidence shows that SAMe regulates proliferation in various tumors.
Although more studies are required to further understand the involvement of SAMe treatment in HCC, we provide evidence that SAMe plays an important role of antiproliferative action in liver cells, capable of regulating genes involved in cell cycle pathway leading to proliferation inhibition, and can serve as a possible anticancer agent used in hepatocellular carcinoma therapy.
Supplementary Material
Supplementary table S1.
Acknowledgements
This work was supported by Natural Science Foundation of China (81570537 to Y.C.).
Competing Interests
The authors have declared that no competing interest exists.
References
1. Kim JU, Shariff MI, Crossey MM, Gomez-Romero M, Holmes E, Cox IJ. et al. Hepatocellular carcinoma: Review of disease and tumor biomarkers. World J Hepatol. 2016;8:471-484
2. Yi Hou, Chunna Lan, Ying Kong, Chunjiao Zhu, Wenna Peng, Zhichao Huang, Changjie Zhang. Genetic ablation of TAZ induces HepG2 liver cancer cell apoptosis through activating the CaMKII/MIEFI signaling pathway. OncoTargets and Therapy. 2019;12:1765-1779
3. Yu-Kun Huang, Xue-Gong Fan, Fu Qiu. TM4SF1 promotes proliferation, invasion, and metastasis in human liver cancer cells. Int. J. Mol. Sci. 2016;17:661. doi: 10.3390/ijms17050661
4. Llovet JM, Bru C, Bruix J. Prognosis of hepatocellular carcinoma: the BCLC staging classification. Semin Liver Dis. 1999;19:329-338
5. Finn RS. Development of molecularly targeted therapies in hepatocellular carcinoma: where do we go now? Clin Cancer Res. 2010;16:390-397
6. Cho YK, Kim JK, Kim MY, Rhim H, Han JK. Systematic review of randomized trials for hepatocellular carcinoma treated with percutaneous ablation therapies. Hepatology. 2009;49:453-459
7. Deng GL, Zeng S, Shen H. Chemotherapy and target therapy for hepatocellular carcinoma: New advances and challenges. World J Hepatol. 2015;7:787-798
8. Baoxiong Zhuang, Yangde Zhang, Jian Peng, Haowei Zhang, Tiehui Hu, Jie Zeng, Yifan Li. Effect of recombinant plasmid pEGFP-AFP-hTNF on liver cancer cells (HepG2 cells) in vitro when delivered by PEG-PEI/Fe3O4 nanomagnetic fluid. J Formos Med Assoc. 2011;110:326-335
9. Xiujuan Hao, Yan Huang, Ming Qiu, Chunlin Yin, Huiming Ren. et al. Immunoassay of S-adenosylmethionine and S-adenosylhomocysteine: the methylation index as a biomarker for disease and health status. BMC Res Notes. 2016;9:498
10. Mato JM, Lu SC. Role of S-adenosyl-L-methionine in liver health and injury. Hepatology. 2007;45:1306-1312
11. Tabor CW, Tabor H. Methionine adenosyltransferase (S-adenosylmethionine synthetase) and S-adenosylmethionine decarboxylase. Adv Enzymol Relat Areas Mol Biol. 1984;56:251-282
12. Martinez-Chantar ML, Corrales FJ, Martinez-Cruz LA, Garcia-Trevijano ER, Huang ZZ, Chen L. et al. Spontaneous oxidative stress and liver tumors in mice lacking methionine adenosyltransferase 1A. FASEB J. 2002;16:1292-1294
13. Lu SC, Alvarez L, Huang ZZ, Chen L, An W, Corrales FJ. et al. Methionine adenosyltransferase 1A knockout mice are predisposed to liver injury and exhibit increased expression of genes involved in proliferation. Proc Natl Acad Sci U S A. 2001;98:5560-5565
14. Lu SC, Mato JM. S-adenosylmethionine in liver health, injury, and cancer. Physiol Rev. 2012;92:1515-1542
15. Cederbaum AI. Hepatoprotective effects of S-adenosyl-L-methionine against alcohol- and cytochrome P450 2E1-induced liver injury. World J Gastroenterol. 2010;16:1366-1376
16. Yang H, Ramani K, Xia M, Ko KS, Li TW, Oh P. et al. Dysregulation of glutathione synthesis during cholestasis in mice: molecular mechanisms and therapeutic implications. Hepatology. 2009;49:1982-1991
17. Hardy ML, Coulter I, Morton SC, Favreau J, Venuturupalli S, Chiappelli F. et al. S-adenosyl-L-methionine for treatment of depression, osteoarthritis, and liver disease. Evid Rep Technol Assess (Summ). 2003;64:1-3
18. Hussain Z, Khan MI, Shahid M, Almajhdi FN. S-adenosylmethionine, a methyl donor, up regulates tissue inhibitor of metalloproteinase-2 in colorectal cancer. Genet Mol Res. 2013;12:1106-1118
19. Li TW, Yang H, Peng H, Xia M, Mato JM, Lu SC. Effects of S-adenosylmethionine and methylthioadenosine on inflammation-induced colon cancer in mice. Carcinogenesis. 2012;33:427-435
20. Chik F, Machnes Z, Szyf M. Synergistic anti-breast cancer effect of a combined treatment with the methyl donor S-adenosyl methionine and the DNA methylation inhibitor 5-aza-2'-deoxycytidine. Carcinogenesis. 2014;35:138-144
21. Ilisso CP, Sapio L, Delle Cave D, Illiano M, Spina A, Cacciapuoti G. et al. S-Adenosylmethionine Affects ERK1/2 and Stat3 Pathways and Induces Apotosis in Osteosarcoma Cells. J Cell Physiol. 2016;231:428-435
22. Ting Liu, Heping Yang, Wei Fan, Jian Tu, Tony W.H.Li. et al. Mechanisms of MAFG dysregulation in cholestatic liver injury and development of liver cancer. Gastroenterology. 2018;155:557-571
23. Yang H, Sadda MR, Li M, Zeng Y, Chen L, Bae W. et al. S-adenosylmethionine and its metabolite induce apoptosis in HepG2 cells: Role of protein phosphatase 1 and Bcl-x(S). Hepatology. 2004;40:221-231
24. Lu SC, Ramani K, Ou X, Lin M, Yu V, Ko K. et al. S-adenosylmethionine in the chemoprevention and treatment of hepatocellular carcinoma in a rat model. Hepatology. 2009;50:462-471
25. SC L. Where are we in the chemoprevention of hepatocellular carcinoma? Hepatology. 2010;51:734-736
26. Kwang Suk Ko, Maria Lauda Tomasi, Ainhoa lglesias-Ara, Jose M. Mato, Shelly C. Lu, et al. Liver-specific deletion of prohibitin 1 results in spontaneous liver injury, fibrosis, and hepatocellular carcinoma in mice. Hepatology. 2010;52:2096-2108
27. Ramani K, Mavila N, Ko KS, Mato JM, LU SC. Prohibitin 1 regulates the H19-lgf2 axis and proliferation in hepatocytes. Ramani K, Mavila N, Ko KS, Mato JM, Lu SC. J Biol Chem. 2016;291:24148-24159
28. Trapnell C, Pachter L, Salzberg SL. TopHat. discovering splice junctions with RNA-Seq. Bioinformatics. 2009;25:1105-11
29. Anders S, Huber W. Differential expression analysis for sequence count data. Genome Biol. 2010;11:R106
30. Kanehisa M, Goto S, Sato Y, Furumichi M, Tanabe M. KEGG for integration and interpretation of large-scale molecular data sets. Nucleic Acids Res. 2012;40:D109-114
31. Young MD, Wakefield MJ, Smyth GK, Oshlack A. Gene ontology analysis for RNA-seq: accounting for selection bias. Genome Biol. 2010;11:R14
32. Forner A, Llovet JM, Bruix J. Hepatocellular carcinoma. Lancet. 2012;379:1245-1255
33. Llovet JM, Bruix J. Systematic review of randomized trials for unresectable hepatocellular carcinoma: Chemoembolization improves survival. Hepatology. 2003;37:429-442
34. Mato JM, Martinez-Chantar ML, Lu SC. S-adenosylmethionine metabolism and liver disease. Ann Hepatol. 2013;12:183-189
35. Vendemiale G, Altomare E, Trizio T, Le Grazie C, Di Padova C, Salerno MT. et al. Effects of oral S-adenosyl-L-methionine on hepatic glutathione in patients with liver disease. Scand J Gastroenterol. 1989;24:407-415
36. Frezza M, Surrenti C, Manzillo G, Fiaccadori F, Bortolini M, Di Padova C. Oral S-adenosylmethionine in the symptomatic treatment of intrahepatic cholestasis. A double-blind, placebo-controlled study. Gastroenterology. 1990;99:211-215
37. Ansorena E, Garcia-Trevijano ER, Martinez-Chantar ML, Huang ZZ, Chen L, Mato JM. et al. S-adenosylmethionine and methylthioadenosine are antiapoptotic in cultured rat hepatocytes but proapoptotic in human hepatoma cells. Hepatology. 2002;35:274-280
38. Ramani K, Yang H, Xia M, Ara AI, Mato JM, Lu SC. Leptin's mitogenic effect in human liver cancer cells requires induction of both methionine adenosyltransferase 2A and 2beta. Hepatology. 2008;47:521-531
39. Latasa MU, Boukaba A, Garcia-Trevijano ER, Torres L, Rodriguez JL, Caballeria J. et al. Hepatocyte growth factor induces MAT2A expression and histone acetylation in rat hepatocytes: role in liver regeneration. FASEB J. 2001;15:1248-1250
40. Vermeulen K, Van Bockstaele DR, Berneman ZN. The cell cycle: a review of regulation, deregulation and therapeutic targets in cancer. Cell Prolif. 2003;36:131-149
41. Jenkinson ER, Chong JP. Minichromosome maintenance helicase activity is controlled by N- and C-terminal motifs and requires the ATPase domain helix-2 insert. Proceedings of the National Academy of Sciences of the United States of America. 2006;103:7613-7618
42. Dudderidge TJ, Kelly JD, Wollenschlaeger A, Okoturo O, Prevost T, Robson W. et al. Diagnosis of prostate cancer by detection of minichromosome maintenance 5 protein in urine sediments. British journal of cancer. 2010;103:701-707
43. Zhong H, Chen B, Neves H, Xing J, Ye Y, Lin Y. et al. Expression of minichromosome maintenance genes in renal cell carcinoma. Cancer management and research. 2017;9:637-647
44. Xiwen Liao, Xiaoguang Liu, Chengkun Yang. et al. Distinct diagnostic and prognostic values of minichromosome maintenance gene expression in patients with hepatocellular carcinoma. Journal of Cancer. 2018;9:2357-2373
45. Nan YL, Hu YL, Liu ZK, Duan F. et al. Relationships between cell cycle pathway gene polymorphisms and risk of hepatocellular carcinoma. World J Gastroenterol. 2016;28:5558-5567
46. Engelmann D, Knoll S, Ewerth D, Steder M. et al. Functional interplay between E2F1 and chemotherapeutic drugs defines immediate E2F1 target genes crucial for cancer cell death. Cell Mol Life Sci. 2010;67:931-948
47. Liang Ma, Lei Peng, Sheng Fang, Bangguo He, Zi Liu. Celastrol downregulates E2F1 to induce growth inhibitory effects in hepatocellular carcinoma HepG2 cells. 2017; 38:2951-2958.
48. Ye Gu, Xinling Wang, Hong Liu, Guimei Li, Weiping Yu, Qing Ma. SET7/9 promotes hepatocellular carcinoma progression through regulation of E2F1. 2018; 40:1863-1874.
49. Parashar S, Cheishvili D, Arakelian A, Hussain Z, Tanvir I, Khan HA. et al. S-adenosylmethionine blocks osteosarcoma cells proliferation and invasion in vitro and tumor metastasis in vivo: therapeutic and diagnostic clinical applications. Cancer Med. 2015;4:732-744
Author contact
![]() Corresponding author: Dr. Yongheng Chen, NHC Key Laboratory of Cancer Proteomics & Laboratory of Structural Biology, Xiangya Hospital, Central South University, Changsha, Hunan 410008, China. Email: yonghenccom; Tel: +86-0731-84327261 Dr. Zhuohua Zhang, Institute of Precision Medicine, The Xiangya Hospital, State Key Laboratory of Medical Genetics, Xiangya Medical School, Central South University, Changsha, Hunan 410078, China Email: zhangzhuohuaedu.cn; Tel: +86-0731-82650230
Corresponding author: Dr. Yongheng Chen, NHC Key Laboratory of Cancer Proteomics & Laboratory of Structural Biology, Xiangya Hospital, Central South University, Changsha, Hunan 410008, China. Email: yonghenccom; Tel: +86-0731-84327261 Dr. Zhuohua Zhang, Institute of Precision Medicine, The Xiangya Hospital, State Key Laboratory of Medical Genetics, Xiangya Medical School, Central South University, Changsha, Hunan 410078, China Email: zhangzhuohuaedu.cn; Tel: +86-0731-82650230

 Global reach, higher impact