3.2
Impact Factor
ISSN: 1837-9664
J Cancer 2019; 10(23):5689-5704. doi:10.7150/jca.31287 This issue Cite
Research Paper
Comprehensive investigation of key biomarkers and pathways in hepatitis B virus-related hepatocellular carcinoma
1. Department of Hepatobiliary Surgery, The First Affiliated Hospital of Guangxi Medical University, Nanning, 530021, Guangxi Zhuang Autonomous Region, People's Republic of China
2. Department of Hematology, The First Affiliated Hospital of Guangxi Medical University, Nanning, 530021, Guangxi Zhuang Autonomous Region, People's Republic of China
3. Department of Hepatobiliary Surgery, Affiliated Hospital of Guangdong Medical University, Zhanjiang, 524001, Guangdong Province, China;
4. Department of Hepatobiliary and Pancreatic Surgery, The First Affiliated Hospital of Zhengzhou University, Zhengzhou, 450000, Henan Province, China;
5. Department of Hepatobiliary Surgery, The Sixth Affiliated Hospital of Guangxi Medical University, Yulin, 537000, Guangxi Zhuang Autonomous Region, People's Republic of China
6. Department of Colorectal and Anal Surgery, The First Affiliated Hospital of Guangxi Medical University, Nanning, 530021, Guangxi Zhuang Autonomous Region, People's Republic of China.
7. Department of Evidence-based Medicine, The First Affiliated Hospital of Guangxi Medical University, Nanning, 530021, Guangxi Zhuang Autonomous Region, People's Republic of China
8. Key Laboratory of Combined Multi-Organ Transplantation, Ministry of Public Health and Key Laboratory of Organ Transplantation of Zhejiang Province, Hangzhou, 310003, Zhejiang Province, People's Republic of China.
9. Science for Life Laboratory, KTH-Royal Institute of Technology, Stockholm, SE-171 21, Sweden.
10. Department of Hepatobiliary Surgery, The Third Affiliated Hospital of Guangxi Medical University, Nanning 530031, Guangxi Zhuang Autonomous Region, People's Republic of China.
11. Department of General Surgery, Beijing Haidian Hospital, Beijing Haidian Section of Peking University Third Hospital, Beijing, 100080, People's Republic of China.
Received 2018-11-6; Accepted 2019-6-30; Published 2019-9-7
Abstract
Objective: Our study is aim to explore potential key biomarkers and pathways in hepatitis B virus (HBV)-related hepatocellular carcinoma (HCC) using genome-wide expression profile dataset and methods.
Methods: Dataset from the GSE14520 is used as the training cohort and The Cancer Genome Atlas dataset as the validation cohort. Differentially expressed genes (DEGs) screening were performed by the limma package. Gene set enrichment analysis (GSEA), weighted gene co-expression network analysis (WGCNA), gene ontology, the Kyoto Encyclopedia of Genes and Genomes, and risk score model were used for pathway and genes identification.
Results: GSEA revealed that several pathways and biological processes are associated with hepatocarcinogenesis, such as the cell cycle, DNA repair, and p53 pathway. A total of 160 DEGs were identified. The enriched functions and pathways of the DEGs included toxic substance decomposition and metabolism processes, and the P450 and p53 pathways. Eleven of the DEGs were identified as hub DEGs in the WGCNA. In survival analysis of hub DEGs, high expression of PRC1 and TOP2A were significantly associated with poor clinical outcome of HBV-related HCC, and shown a good performance in HBV-related HCC diagnosis. The prognostic signature consisting of PRC1 and TOP2A also doing well in the prediction of HBV-related HCC prognosis. The diagnostic and prognostic values of PRC1 and TOP2A was confirmed in TCGA HCC patients.
Conclusions: Key biomarkers and pathways identified in the present study may enhance the comprehend of the molecular mechanisms underlying hepatocarcinogenesis. Additionally, mRNA expression of PRC1 and TOP2A may serve as potential diagnostic and prognostic biomarkers for HBV-related HCC.
Keywords: hepatitis B virus, hepatocellular carcinoma, DNA topoisomerase II alpha, protein regulator of cytokinesis 1, prognosis
Introduction
Hepatitis B virus (HBV) is prevalent in China and the chronic HBV infection rate in the adult population of this region is between 5% and 10% [1-5]. HBV infection is a major cause of hepatocarcinogenesis and increase the risk of death from HBV-related cirrhosis and liver cancer [6-8]. According to global cancer statistics, more than half of new liver cancer cases and deaths were from China, in 2012 [9]. The latest cancer statistics data from China estimated that there will be ~466,100 newly diagnosed liver cancer cases, and ~ 422,100 will die from liver cancer in 2015 [10]. Liver cancer has become the third major factor of cancer-related death, and with a low 5-year survival rate [10, 11]. The histologic type of most liver cancer cases are hepatocellular carcinoma (HCC) [12].
The occurrence of liver cancer is the result of the interaction between genetic factors and environmental factors [6, 7]. Genomic analysis is a promising approach to screening potential diagnostic and prognostic biomarkers for diseases, including cancer. Recently, numerous studies use the whole-genome dataset to identify the diagnostic and prognostic molecular markers of HCC, especially the HCC dataset from The Cancer Genome Atlas (TCGA) research network and Gene Expression Omnibus (GEO) database [13-15]. The gene expression analyses of human HCCs have led to the successful molecular classification of HCCs on the basis of prognosis, etiology, and intrahepatic recurrence [6]. Further comprehensive genomic analysis of the HCC whole-genome dataset to investigate diagnostic and prognostic biomarkers is urgently needed. The aim of our current study is to investigate potential key genes and pathways in HBV-related HCC using bioinformatics approaches base on genome-wide expression profile array, and explore their potential values in HBV-related HCC diagnosis and prognosis.
Materials and Methods
Microarray data
GSE14520 dataset and corresponding clinical profiles of HBV-related HCC patients were collected from the GEO database (https://www.ncbi.nlm.nih.gov/geo/query/acc.cgi?acc=GSE14520; accessed August 15, 2017) [14, 15]. To avoid a batch effect, the cohort 2 testing group of GSE14520, which was processed on the Affymetrix HT Human Genome U133A Array that consisted of 445 HCC samples, was used for subsequent analysis. Most of these tissues were collected from HBV-related HCC patients. The expression profile array normalization was using limma package [16]. For multiple probe sets of one gene, the average values of these probe sets are considered as the expression value of this gene [17].
Gene set enrichment analysis (GSEA)
Differences in pathways and functions between HBV-related HCC tumor and adjacent normal tissues were investigated by GSEA v2-2.2.3 and Molecular Signatures Database (MSigDB) of c2 (c2.cp.kegg.v5.2.symbols.gmt) and c5 (c5.all.v6.0.symbols.gmt), respectively [18-20]. Single gene GSEA analysis was also used to explore the molecular mechanisms of different gene expression levels in HCC [20, 21]. The parameter of permutations was set at 1,000. The results of significance should meet the criteria of nominal P-value<0.05, false discovery rate (FDR)<0.25[20].
Identification of differentially expressed genes
Differentially expressed genes (DEGs) between HBV-related HCC tumor and adjacent normal tissues needs to satisfy the following criterions: | log2 fold change (FC) | ≥ 2, P-value < 0.05 and FDR < 0.05.
Functional assessment of DEGs
Gene ontology (GO) and Kyoto Encyclopedia of Genes and Genomes pathway (KEGG) functional assessment of DEGs were used the Database for Annotation, Visualization and Integrated Discovery (DAVID; https://david.ncifcrf.gov/home.jsp; accessed August 15, 2017) v6.8, which is a functional annotation tool for specified genes [22, 23]. Enrichment results with P-value < 0.05 was considered achieve statistical significance.
Weighted gene co-expression network analysis (WGCNA)
Co-expression analysis of DEGs and hub DEGs identification were performed by WGCNA [24]. Gene-gene correlation coefficients of WGCNA greater than 0.2 were incorporated into subsequent hub DEG identification and weighted co-expression network mapping. Node degrees represent the power of the connection between the selected node and others in the network are used for hub DEG identification.
Prognostic signature Investigation and validation
We further investigated the potential role of these hub DEGs in HBV-related HCC survival and recurrence. Each hub DEG was assessed by a multivariate Cox proportional hazards regression model that was adjusted for age, gender, cirrhosis, BCLC stage, and serum α-fetoprotein (AFP) level in the GSE14520 cohort. The hub DEGs that correlated with the HBV-related HCC prognosis were applied to constructed prognostic signature and was established on the basis of a prognosis risk score: gene expression value multiplied by a regression coefficient (β), which was generated from a multivariate Cox proportional hazards regression model. The risk score is calculated as below [25-28]: risk score = expression of Gene1 × β1Gene1 + expression of Gene2 × β2Gene2 +… expression of Genen × βnGenen. The time-dependent receiver operating characteristic (ROC) curve was used the survivalROC package (https://CRAN.R-project.org/package=survivalROC) to assess the accuracy of prognostic signature [29]. For validation and to generalize this prognostic signature, HCC patients from TCGA (https://portal.gdc.cancer.gov/; accessed August 15, 2017) were regarded as an independent validation cohort.
Statistical analysis
The test used to compare the expression between two groups was assessed by independent sample t-test. The FDR in DEG screening and GSEA were performed according to the Benjamini-Hochberg procedure [30-32]. Volcano plots, as well as heat maps were constructed with the gplots package. The weighted co-expression networks were drawn by Cytoscape version 3.4.0 (http://www.cytoscape.org/; accessed January 16, 2017) [33]. Univariate survival analysis was assessed by the Kaplan-Meier method with the log-rank test. Hazard ratio (HR) and 95% confidence interval (CI) were derived from the multivariate Cox proportional hazards regression model after data in the GSE14520 was adjusted for age, gender, cirrhosis, BCLC stage, and serum AFP levels, whereas the TCGA cohort data were adjusted for age, gender, and tumor stage. ROC curves were used to assess the sensitivity of DEGs in distinguishing HCC tumor tissue from adjacent normal tissue. P-value < 0.05 was considered achieve statistical significance. SPSS version 20.0 (IBM Corporation, Armonk, NY, USA) and R 3.3.0 were performed the statistical analyses.
Results
Study population
When screening the 445 samples of the GSE14520 Affymetrix HT Human Genome U133A Array dataset, the inclusion criteria were as follows: (i) patients with HBV infection, (ii) patients with complete prognostic information. We excluded the samples from patients without HBV infection or patients with an unavailable HBV infection record in the GSE14520 supplementary material, as well as patients with unavailable prognostic parameters. A total of 212 tumor samples and 204 adjacent normal tissue samples were included for further study. Clinical features of HBV-related HCC patients from the GSE14520 cohort are shown in Table 1.
GSEA between HCC tumor and adjacent normal tissues
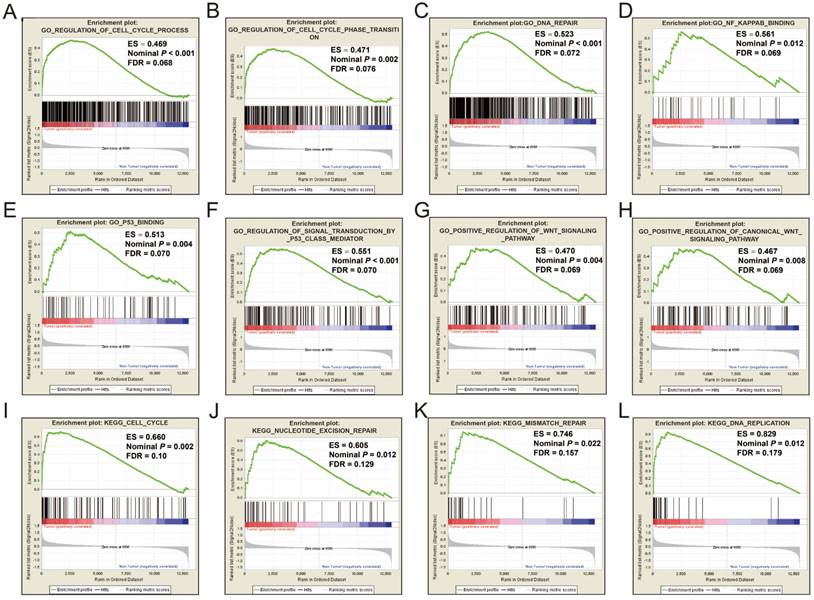
GSEA was performed on the c5 reference gene set (GO gene set), the GO enrichment results demonstrated that cell cycle, DNA repair, nuclear factor-kappa B (NF-κ B), p53, and Wnt signaling pathway were significantly enriched in tumor tissue (Figure 1A-H). Consistent with the c5 reference gene set analysis, the c2 reference gene set (KEGG gene set) GSEA suggests that genes involved in the cell cycle, nucleotide excision repair, mismatch repair and DNA replication pathways were significantly enriched in tumor tissues (Figure 1I-L). All the significant GSEA results from the c2 and c5 reference gene set can be found in Tables S1 and S2, respectively.
Identification of DEGs
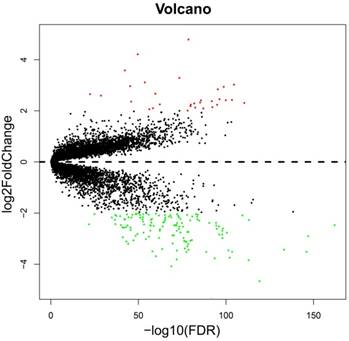
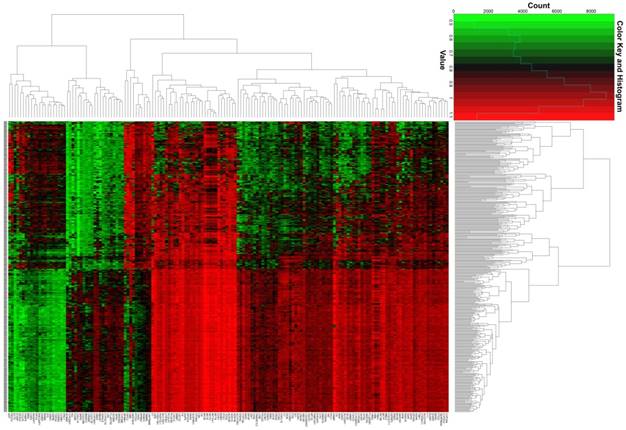
The whole-genome expression profile chip dataset of the 212 tumor and 204 adjacent normal tissue samples were compared in the R platform by using the limma package. There were 160 genes that met the DEG criterion (Table S3), of which 31 were upregulated and 129 were downregulated. Among these DEGs, a well-known biomarker for HCC diagnosis and prognosis, AFP, was identified (log2FC = 2.65 and FDR = 4.87×10⁻²³, Table S3). A volcano plot of the DEGs is shown in Figure 2, and a heat map of the DEGs is shown in Figure 3.
Functional assessment of DEGs
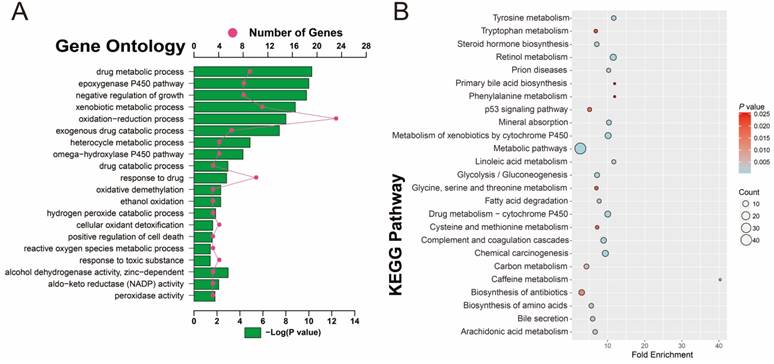
To investigate the potential function and pathways that are associated with HBV-related HCC tumorigenesis, 160 DEGs were analyzed with DAVID. GO term analysis (Table S4 and Figure 4A) indicated that these DEGs were mainly involved in toxic substance decomposition and metabolism-related biological processes, such as drug metabolic and catabolic processes, the P450 pathway, ethanol oxidation, hydrogen peroxide catabolic process, oxidative demethylation, cellular oxidant detoxification, peroxidase and alcohol dehydrogenase activity, oxidation-reduction process, and response to toxic substances, in addition to regulation of cell death and growth. Consistent with the GO term enrichment results, KEGG enrichment results (Table S5 and Figure 4B) also suggest that the DEGs were mainly involved in substance decomposition and metabolism-related biological processes, such as retinol metabolism, drug metabolism, the cytochrome P450 pathway, carbon metabolism, arachidonic acid metabolism, cysteine and methionine metabolism, glycine, serine and threonine metabolism, tryptophan metabolism and phenylalanine metabolism. The p53 signaling pathway, which is associated with the regulation of cell death, was also enriched, as well as the metabolism-related carcinogenic pathway and chemical carcinogenesis.
WGCNA and hub DEGs screening
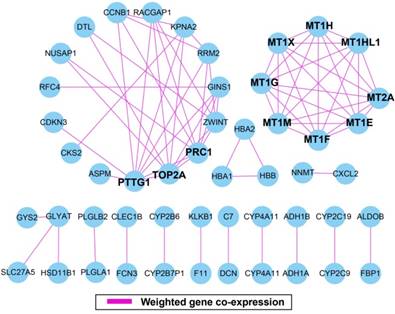
The weighted gene co-expression correlation coefficient between two genes greater than 0.2 was used for weighted gene co-expression network construction. A total of 50 DEGs and 75 edges were exported for final network construction (Figure 5, Table S6). The top-ten degree DEGs of the weighted gene co-expression network were identified as hub DEGs. These hub DEGs included pituitary tumor-transforming 1 (PTTG1), DNA topoisomerase II alpha (TOP2A), protein regulator of cytokinesis 1 (PRC1), metallothionein 2A (MT2A), metallothionein 1X (MT1X), metallothionein 1M (MT1M), metallothionein 1H (MT1H), metallothionein 1G (MT1G), metallothionein 1F (MT1F), metallothionein 1E (MT1E), and metallothionein 1H like 1 (MT1HL1). Among these hub genes, PTTG1 showed the highest node degree, which was 9 (Figure 5).
Construction of a prognostic signature in the GSE14520 cohort
To explore the values of these hub DEGs in HBV-related HCC clinical outcome, we also used the multivariate survival analysis to identify prognostic hub DEGs. Low- and high-expression of a selected gene were group by the median value of this gene. We subsequently used the multivariate Cox proportional hazards regression model analysis in the GSE14520 cohort by adjusting for age, gender, cirrhosis, BCLC stage and serum AFP levels. PRC1and TOP2A were identified as the prognostic hub DEGs and used for further investigation.
aClinical features of HBV-related HCC patients in GSE14520 cohort
| Variables | Patients (n=212) | RFS | OS | |||||||
|---|---|---|---|---|---|---|---|---|---|---|
| No. of events | MRT(months) | HR (95% CI) | P | No. of events | MST(months) | HR (95% CI) | P | |||
| Age | ||||||||||
| ≤60 | 175 | 96 | 45 | 1 | 69 | NA | 1 | |||
| >60 | 37 | 20 | 48 | 0.974(0.602-1.578) | 0.916 | 13 | NA | 0.864(0.478-1.564) | 0.63 | |
| Gender | ||||||||||
| Female | 29 | 10 | NA | 1 | 8 | NA | 1 | |||
| Male | 183 | 106 | 40 | 2.143(1.120-4.100) | 0.021 | 74 | NA | 1.704(0.821-3.534) | 0.152 | |
| Tumor number | ||||||||||
| Single | 167 | 90 | 49 | 1 | 59 | NA | 1 | |||
| Multiple | 45 | 26 | 28 | 1.216(0.785-1.883) | 0.382 | 23 | 47 | 1.607(0.992-2.604) | 0.054 | |
| Tumor Size† | ||||||||||
| ≤5cm | 137 | 73 | 51 | 1 | 46 | NA | 1 | |||
| >5cm | 74 | 43 | 28 | 1.409(0.966-2.056) | 0.075 | 36 | 53 | 1.975(1.274-3.060) | 0.002 | |
| Cirrhosis | ||||||||||
| No | 17 | 5 | NA | 1 | 2 | NA | 1 | |||
| Yes | 195 | 111 | 37 | 2.612(1.066-6.402) | 0.036 | 80 | NA | 4.335(1.065-17.638) | 0.041 | |
| BCLC stage | ||||||||||
| 0 | 20 | 6 | NA | 1 | 2 | NA | 1 | |||
| A | 143 | 74 | 51 | 2.050(2.892-4.711) | 0.091 | 48 | NA | 4.119(1.001-16.951) | 0.05 | |
| B | 22 | 15 | 26 | 4.019(1.550-10.421) | 0.004 | 12 | 46 | 8.992(2.005-40.320) | 0.004 | |
| C | 27 | 21 | 8 | 6.163(2.477-15.333) | <0.001 | 20 | 13 | 18.993(4.419-81.632) | <0.001 | |
| Tumor Stage | ||||||||||
| I | 89 | 35 | NA | 1 | 20 | NA | 1 | |||
| II | 76 | 48 | 28 | 1.995(1.289-3.088) | 0.02 | 32 | NA | 2.214(1.265-3.873) | 0.05 | |
| III | 47 | 33 | 18 | 3.220(1.993-5.204) | <0.001 | 30 | 18 | 5.197(2.930-9.218) | <0.001 | |
| AFP (ng/mL) ‡ | ||||||||||
| ≤300 | 115 | 62 | 48 | 1 | 39 | NA | 1 | |||
| >300 | 94 | 54 | 35 | 1.200(0.833-1.728) | 0.328 | 43 | NA | 1.546(1.002-2.385) | 0.049 | |
Notes: † Information of tumor size was unavailable in 1 patients; ‡ Information of AFP was unavailable in 3 patients; a The data in this table also have been shown in our previous publication (Reference 28). RFS, recurrence-free survival; OS, overall survival; MRT, median recurrence time; MST, median survival time; HR, hazard ratio; CI, confidence interval. BCLC, Barcelona Clinic Liver Cancer; AFP, α-fetoprotein.
GSEA results of tumor and adjacent normal tissue in HBV-related HCC patients of GSE14520 cohort. GSEA result of HBV-related HCC tumor tissue using c2 (A-H) and c5 (I-L) reference gene sets.
Volcano plot of the DEGs. Red dots: up-regulation; green dots: down-regulation; black dots: non-differentially expressed genes.
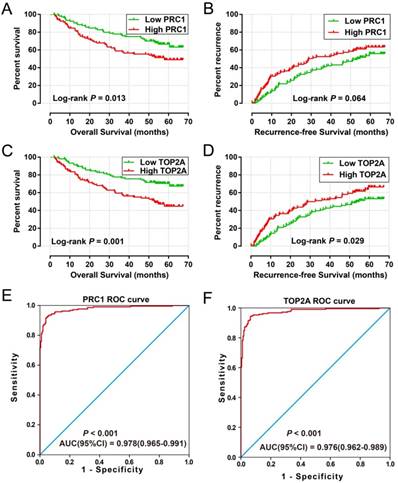
High expression of PRC1 (adjusted P = 0.039, adjusted HR = 1.490, 95% CI = 1.020-2.176 for recurrence-free survival [RFS]; adjusted P = 0.007, adjusted HR = 1.862, 95% CI = 1.188-2.919 for overall survival [OS]; Table 2 and Table 3, Figure 6A-B) and TOP2A (adjusted P = 0.045, adjusted HR = 1.472, 95% CI = 1.009-2.146 for RFS; adjusted P = 0.002, adjusted HR = 2.027, 95% CI = 1.284-3.201 for OS; Table 2 and Table 3, Figure 6C-D) was significantly associated with an increased risk of death and recurrence. ROC curve analysis indicates that PRC1 (P < 0.001, area under curve [AUC] = 0.976, 95%CI = 0.962-0.989) and TOP2A (P < 0.001, AUC = 0.978, 95%CI = 0.965-0.991) performed well in discriminate the HBV-related HCC tumor and adjacent normal tissue.
To investigate the role of PRC1and TOP2A in HCC, the expression distribution of PRC1 and TOP2A in human normal tissue were analyzed using the GTEx Portal website (https://www.gtexportal.org/home/; accessed August 15, 2017) [34]. Both the PRC1 and TOP2A expression level in human normal liver tissue was low compared with other human organs (Figure S1A, B). Furthermore, we also investigate the expression of PRC1and TOP2A between normal liver and HCC tumor tissues by using the Human Protein Atlas website (https://www.proteinatlas.org/; accessed February 2, 2018) [35, 36], and found that both the protein expression of PRC1and TOP2A were upregulated in HCC tumor tissue, which detected by immunohistochemistry (Figure S1C-F). Whereas, the expression of PRC1 and TOP2A in HBV-related HCC tumor tissue was markedly upregulated (Figure S2A) in the GSE14520 cohort, and also up-regulation in advance tumor stage samples (Figure S2B).
Genes that have different expression between normal liver and HCC tumor tissue could potentially be used in HCC diagnosis. ROC analysis suggested that PRC1 and TOP2A performed well in HCC diagnosis. In addition, the co-expression analysis performed by Pearson correlation also suggest that expression of PRC1 and TOP2A had a strong correlation (r = 0.798, P < 0.0001) in both HBV-related HCC tumor tissue and adjacent normal tissue (r =0.565, P <0.0001). Therefore, the combination of PRC1 and TOP2A in HBV-related HCC prognosis are worth further study.
Heat map of the 160 DEGs.
GO and KEGG enrichment results of 160 DEGs. (A) GO term enrichment results. (B) KEGG enrichment results.
Correlation between RFS and 11 hub DEGs expression in HBV-related HCC patients of GSE14520 cohort
| Variables | Patients (n=212) | MRT (months) | No. of events | Crude HR (95% CI) | Crude P | Adjusted HR (95% CI) | Adjusted P§ |
|---|---|---|---|---|---|---|---|
| PTTG1 | |||||||
| Low | 106 | 51 | 56 | 1 | 1 | ||
| High | 106 | 36 | 60 | 0.174(1.288(0.895-1.854) | 0.174 | 1.406(0.961-2.057) | 0.079 |
| PRC1 | |||||||
| Low | 106 | 53 | 55 | 1 | 1 | ||
| High | 106 | 28 | 61 | 1.409(0.978-2.030) | 0.066 | 1.490(1.020-2.176) | 0.039 |
| TOP2A | |||||||
| Low | 106 | 54 | 53 | 1 | 1 | ||
| High | 106 | 32 | 63 | 1.498(1.039-2.160) | 0.03 | 1.472(1.009-2.146) | 0.045 |
| MT2A | |||||||
| Low | 106 | 46 | 58 | 1 | 1 | ||
| High | 106 | 43 | 58 | 0.949(0.659-1.365) | 0.777 | 0.857(0.591-1.244) | 0.418 |
| MT1X | |||||||
| Low | 106 | 40 | 60 | 1 | 1 | ||
| High | 106 | 48 | 56 | 0.856(0.594-1.232) | 0.402 | 0.785(0.540-1.142) | 0.206 |
| MT1M | |||||||
| Low | 106 | 40 | 60 | 1 | 1 | ||
| High | 106 | 48 | 56 | 0.849(0.589-1.222) | 0.377 | 0.779(0.538-1.129) | 0.188 |
| MT1H | |||||||
| Low | 106 | 40 | 60 | 1 | 1 | ||
| High | 106 | 48 | 56 | 0.854(0.593-1.230) | 0.397 | 0.787(0.543-1.141) | 0.207 |
| MT1G | |||||||
| Low | 106 | 45 | 59 | 1 | 1 | ||
| High | 106 | 46 | 57 | 0.865(0.601-1.246) | 0.436 | 0.819(0.566-1.187) | 0.292 |
| MT1F | |||||||
| Low | 106 | 40 | 61 | 1 | 1 | ||
| High | 106 | 51 | 55 | 0.824(0.572-1.187) | 0.299 | 0.817(0.560-1.192) | 0.294 |
| MT1E | |||||||
| Low | 106 | 45 | 59 | 1 | 1 | ||
| High | 106 | 46 | 57 | 0.896(0.622-1.289) | 0.554 | 0.773(0.532-1.123) | 0.177 |
| MT1HL1 | |||||||
| Low | 106 | 37 | 60 | 1 | 1 | ||
| High | 106 | 51 | 56 | 0.836(0.581-1.204) | 0.336 | 0.742(0.512-1.077) | 0.116 |
Notes: §Adjusted for age, gender, cirrhosis, BCLC stage, serum AFP levels; RFS, recurrence-free survival; MRT, median recurrence time; HR, hazard ratio; CI, confidence interval. PTTG1, pituitary tumor-transforming 1; TOP2A, DNA topoisomerase II alpha, PRC1, protein regulator of cytokinesis 1, MT2A, metallothionein 2A, MT1X, metallothionein 1X, MT1M, metallothionein 1M, MT1H, metallothionein 1H, MT1G, metallothionein 1G, MT1F, metallothionein 1F, MT1E, metallothionein 1E, MT1HL1, metallothionein 1H like 1.
Weighted gene co-expression network. Blue circles represent differentially expressed genes.
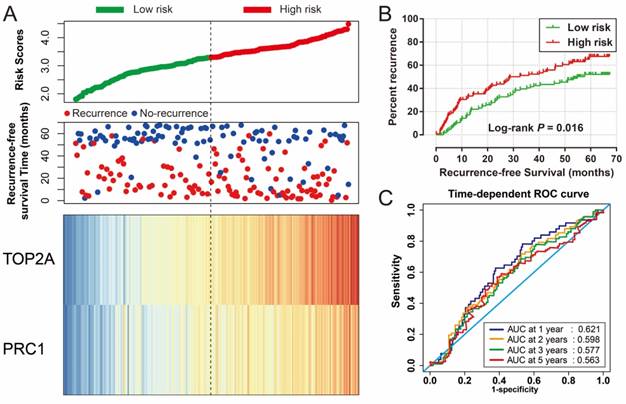
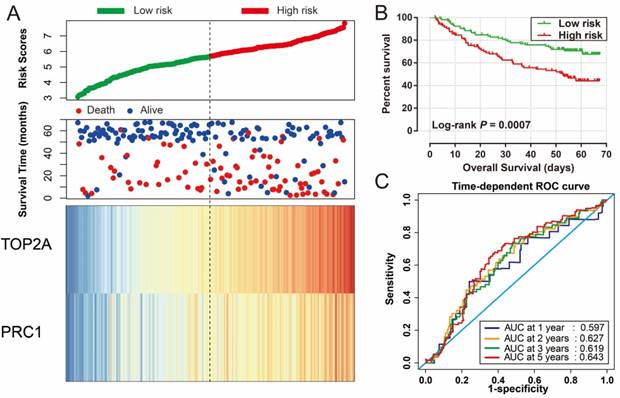
Risk score of HBV-related HCC prognostic signature was consisted of PRC1 and TOP2A expression and weighted by the regression coefficient (β). The formulas of the risk score for RFS and OS were as follows: risk score (RFS) = 0.311 × expression of TOP2A + 0.189 × expression of PRC1; risk score (OS) = 0.628×expression of TOP2A + 0.231×expression of PRC1. Low- and high-risk groups were group by the median value of the risk score. Survival analysis revealed that patients with a high risk score had a higher recurrence (adjusted P = 0.029, adjusted HR = 1.525, 95% CI = 1.045-2.224; Table 4, Figure 7A, B) and death (adjusted P = 0.002, adjusted HR = 2.029, 95% CI = 1.287-3.198; Table 4, Figure 8A, B) risk. Time-dependent ROC analysis revealed that the risk score doing well in HBV-related HCC prognosis, with the AUC of ROC curves were 0.621, 0.598, 0.577 and 0.563 for 1-, 2-, 3- and 5-year recurrence (Figure 7C), respectively. For 1-, 2-, 3- and 5-year survival, the AUC of ROC curves were 0.597, 0.627, 0.619 and 0.643 (Figure 8C), respectively.
Validation of the prognostic signature in TCGA cohort
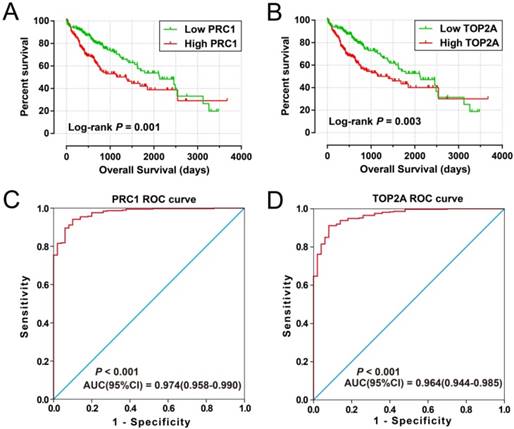
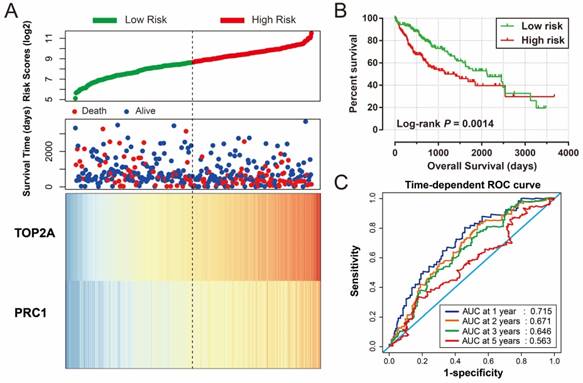
For validation and to generalize the prognostic signature, HCC patients from TCGA were considered as the validation cohort. These patients from the TCGA who received RNA sequencing and with a complete prognostic parameters were included into further survival analysis. The expression of PRC1 and TOP2A also showed a strong correlation in HCC samples from TCGA (r = 0.922, P < 0.0001 for HCC tumor tissues, and r =0.842, P <0.0001 for adjacent normal tissues). Because the clinical features from the TCGA cohort was incomplete, only data concerning the parameters of age, gender, tumor stage, and OS time and status were available from the TCGA website (Table 5). Thus, only the prognostic signature of the OS could be validated in the current study. Survival analysis revealed that both the high expression of PRC1 (adjusted P = 0.002, adjusted HR = 1.817, 95% CI = 1.235-2.673; Table 6, Figure 9A) and TOP2A (adjusted P = 0.015, adjusted HR = 1.619, 95% CI =1.097-2.390; Table 6, Figure 9B) were markedly raise the risk of death, consistent with the results of GSE14520. Similar to the validation of survival analysis, ROC analysis of PRC1 (P < 0.001, AUC = 0.974, 95% CI = 0.958-0.990, Figure 9C) and TOP2A (P < 0.001, AUC = 0.964, 95% CI = 0.944-0.985, Figure 9D) in TCGA also performed well in distinguishing the HCC tumor and adjacent normal tissues. Comparison of gene expression in TCGA cohort HCC samples also showed that PRC1 and TOP2A were significant up-regulation in HCC tumor tissues (Figure S2C) and up-regulation in advance tumor stage tumor tissues (Figure S2D). Survival analysis suggest that patients with high risk score were markedly associated with a higher risk of death (adjusted P = 0.011, adjusted HR = 1.648, 95% CI = 1.120-2.427; Table 6, Figure 10A, B), while survivalROC analysis of risk score also doing well in HCC OS prediction, as the AUC of ROC curves were 0.715, 0.671, 0.646 and 0.563 for 1-, 2-, 3- and 5-year survival (Figure 10C), respectively.
Single gene GSEA of PRC1 and TOP2A
In order to explored the potential molecular mechanisms of different PRC1 and TOP2A gene expression groups in HCC prognosis, therefore, single gene GSEA analysis was used to investigated the potential pathways and biological processes between different gene expression groups in both GSE14520 and TCGA HCC cohorts.
Correlation between OS and 11 hub DEGs expression in HBV-related HCC patients of GSE14520 cohort
| Variables | Patients (n=212) | MST (months) | No. of events | Crude HR (95% CI) | Crude P | Adjusted HR (95% CI) | Adjusted P§ |
|---|---|---|---|---|---|---|---|
| PTTG1 | |||||||
| Low | 106 | NA | 38 | 1 | 1 | ||
| High | 106 | NA | 44 | 1.317(0.853-2.033) | 0.215 | 1.390(0.893-2.166) | 0.145 |
| PRC1 | |||||||
| Low | 106 | NA | 35 | 1 | 1 | ||
| High | 106 | 57 | 47 | 1.731(1.116-2.685) | 0.014 | 1.862(1.188-2.919) | 0.007 |
| TOP2A | |||||||
| Low | 106 | NA | 31 | 1 | 1 | ||
| High | 106 | 53 | 51 | 2.107(1.347-3.296) | 0.001 | 2.027(1.284-3.201) | 0.002 |
| MT2A | |||||||
| Low | 106 | NA | 42 | 1 | 1 | ||
| High | 106 | NA | 40 | 0.943(0.611-1.454) | 0.79 | 0.877(0.562-1.367) | 0.562 |
| MT1X | |||||||
| Low | 106 | NA | 43 | 1 | 1 | ||
| High | 106 | NA | 39 | 0.858(0.556-1.324) | 0.489 | 0.807(0.516-1.262) | 0.347 |
| MT1M | |||||||
| Low | 106 | NA | 44 | 1 | 1 | ||
| High | 106 | NA | 38 | 0.824(0.534-1.273) | 0.384 | 0.785(0.504-1.222) | 0.284 |
| MT1H | |||||||
| Low | 106 | NA | 45 | 1 | 1 | ||
| High | 106 | NA | 37 | 0.769(0.498-1.189) | 0.238 | 0.734(0.470-1.146) | 0.174 |
| MT1G | |||||||
| Low | 106 | NA | 42 | 1 | 1 | ||
| High | 106 | NA | 40 | 0.885(0.574-1.365) | 0.582 | 0.835(0.535-1.302) | 0.426 |
| MT1F | |||||||
| Low | 106 | NA | 45 | 1 | 1 | ||
| High | 106 | NA | 37 | 0.782(0.506-1.209) | 0.269 | 0.825(0.524-1.299) | 0.406 |
| MT1E | |||||||
| Low | 106 | NA | 43 | 1 | 1 | ||
| High | 106 | NA | 39 | 0.863(0.560-1.332) | 0.507 | 0.759(0.486-1.185) | 0.225 |
| MT1HL1 | |||||||
| Low | 106 | NA | 45 | 1 | 1 | ||
| High | 106 | NA | 37 | 0.756(0.489-1.168) | 0.207 | 0.687(0.439-1.074) | 0.1 |
Notes: §Adjusted for age, gender, cirrhosis, BCLC stage, serum AFP levels; OS, overall survival; MRT, median recurrence time; MST, median survival time; HR, hazard ratio; CI, confidence interval. PTTG1, pituitary tumor-transforming 1; TOP2A, DNA topoisomerase II alpha, PRC1, protein regulator of cytokinesis 1, MT2A, metallothionein 2A, MT1X, metallothionein 1X, MT1M, metallothionein 1M, MT1H, metallothionein 1H, MT1G, metallothionein 1G, MT1F, metallothionein 1F, MT1E, metallothionein 1E, MT1HL1, metallothionein 1H like 1.
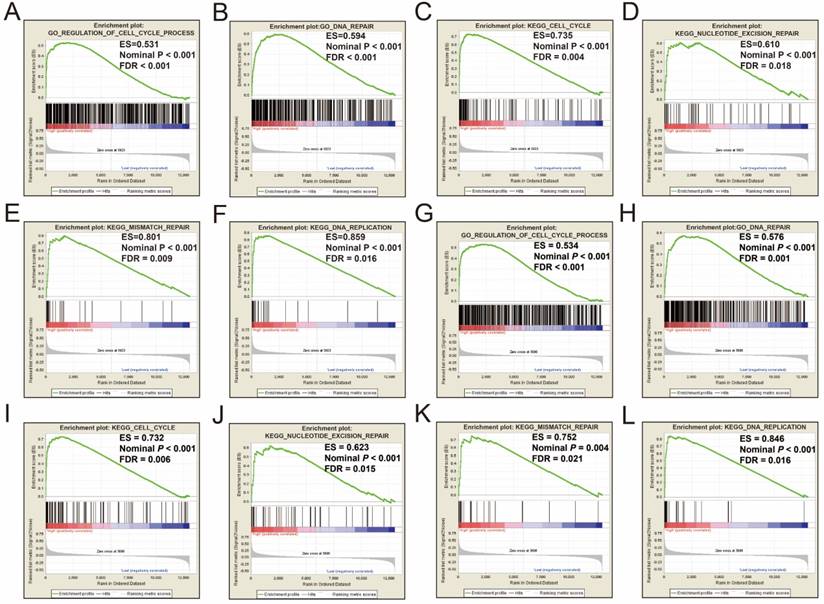
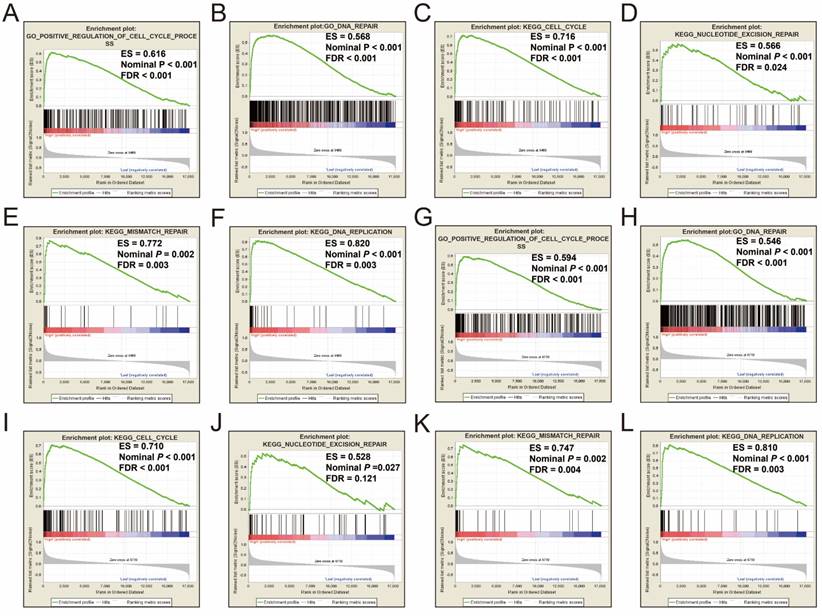
Single gene GSEA analysis suggest that both the high expression of PRC1 and TOP2A were markedly enriched in the cell cycle and DNA repair biological processes in GSE14520 (Figure 11A-L, Table S7-10) and TCGA (Figure 12A-L, Table S11-14) cohorts, which consistent with the GSEA analysis results between HBV-related HCC tumor and adjacent normal tissues in GSE14520.
Discussion
The liver is an organ that metabolites toxic substances. Dysregulation of the genes related to toxic material metabolism will lead to hepatocarcinogenesis. Investigation of hepatocarcinogenesis by GSEA suggest that the cell cycle [37], DNA repair [38], NF-κ B signaling pathway [39], p53 pathway [40] and Wnt signaling pathway [41] were associated with hepatocarcinogenesis, which has already been reported in previous studies. In addition, GO and KEGG enrichment analysis demonstrated that the biological processes of toxic substance decomposition and metabolism processes (including drugs and ethanol), P450 pathway [42, 43], p53 pathway [40], alcohol dehydrogenase activity and cell death regulation in the functional assessment of DEGs have also been reported in previous studies in connection with HCC. These DEGs associated with the organ function of the liver may play a crucial part in the development of hepatocarcinogenesis.
Prognostic and diagnosis value of PRC1 and TOP2A in GSE14520 cohort. Kaplan-Meier curve of PRC1 expression in OS (A) and RFS (B); Kaplan-Meier curve of TOP2A expression in OS (C) and RFS (D); ROC curves of the PRC1 (E) and TOP2A (F) to distinguish HBV-related HCC tissue from adjacent normal tissue.
Prognostic risk score model analysis of PRC1 and TOP2A signature in RFS of GSE14520 cohort. (A) Scatter plots of risk score and survival time, and PRC1 and TOP2A gene expression heat map. (B) Kaplan-Meier curves for low- and high-risk score. (C) Time-dependent ROC curve of risk score.
Prognostic risk score model analysis of PRC1 and TOP2A signature in OS of GSE14520 cohort. (A) Scatter plots of risk score and survival time, and PRC1 and TOP2A gene expression heat map. (B) Kaplan-Meier curves for low- and high-risk score. (C) Time-dependent ROC curve of risk score.
Survival analysis of risk score in HBV-related HCC patients of GSE14520 cohort
| Variables | Patients (n=212) | MRT/MST(months) | No. of events | Crude HR (95% CI) | Crude P | Adjusted HR (95% CI) | Adjusted P§ |
|---|---|---|---|---|---|---|---|
| Risk score (RFS) | |||||||
| Low risk | 106 | 54 | 52 | 1 | 1 | ||
| High risk | 106 | 28 | 64 | 1.562(1.082-2.253) | 0.017 | 1.525(1.045-2.224) | 0.029 |
| Risk score (OS) | |||||||
| Low risk | 106 | NA | 31 | 1 | 1 | ||
| High risk | 106 | 52 | 51 | 2.140(1.367-3.349) | 0.001 | 2.029(1.287-3.198) | 0.002 |
Notes: §Adjusted for age, gender, cirrhosis, BCLC stage, serum AFP levels; RFS, recurrence-free survival; OS, overall survival; MRT, median recurrence time; MST, median survival time; HR, hazard ratio; CI, confidence interval. PRC1, protein regulator of cytokinesis 1; TOP2A, DNA topoisomerase II alpha.
Correlation between OS and clinical features in HCC patients of TCGA cohort
| Variables | Patients (n=370) | MST(days) | No. of events | HR (95% CI) | P |
|---|---|---|---|---|---|
| Age £ | |||||
| ≤60 | 177 | 2532 | 55 | 1 | |
| >60 | 190 | 1622 | 73 | 1.221(0.859-1.734) | 0.265 |
| Gender | |||||
| Female | 121 | 1490 | 51 | 1 | |
| Male | 249 | 2486 | 79 | 0.817(0.573-1.164) | 0.262 |
| Tumor stage& | |||||
| I | 171 | 2532 | 42 | 1 | |
| II | 85 | 1852 | 26 | 1.427(0.874-2.330) | 0.155 |
| III+IV | 90 | 770 | 48 | 2.764(1.823-4.190) | <0.001 |
Notes: £ Information of age was unavailable in 3 patients; & Information of tumor stage was unavailable in 24 patients; MST, median survival time; HR, hazard ratio; CI, confidence interval; TCGA, The Cancer Genome Atlas.
Survival analysis of PRC1, TOP2A and risk score in HCC patients of TCGA cohort
| Variables | Patients (n=370) | MST(days) | No. of events | Crude HR (95% CI) | Crude P | Adjusted HR (95% CI) | Adjusted P ɠ |
|---|---|---|---|---|---|---|---|
| PRC1 level | |||||||
| Low | 185 | 2131 | 56 | 1 | 1 | ||
| High | 185 | 1372 | 74 | 1.753(1.236-2.486) | 0.002 | 1.817(1.235-2.673) | 0.002 |
| TOP2A level | |||||||
| Low | 185 | 2116 | 57 | 1 | 1 | ||
| High | 185 | 1397 | 73 | 1.701(1.200-2.410) | 0.003 | 1.619(1.097-2.390) | 0.015 |
| Risk score (OS) | |||||||
| Low risk | 185 | 2131 | 57 | 1 | 1 | ||
| High risk | 185 | 1397 | 73 | 1.754(1.237-2.486) | 0.002 | 1.648(1.120-2.427) | 0.011 |
Notes: ɠ Adjusted for age, gender, tumor stage; OS, overall survival; MST, median survival time; HR, hazard ratio; CI, confidence interval. PRC1, protein regulator of cytokinesis 1; TOP2A, DNA topoisomerase II alpha.
Prognostic and diagnosis value of PRC1 and TOP2A in TCGA cohort. Kaplan-Meier curve of PRC1 expression in OS (A); Kaplan-Meier curve of TOP2A expression in OS (B); ROC curves of the PRC1 (C) and TOP2A (D) to distinguish HCC tissue from adjacent normal tissue;
Prognostic risk score model analysis of PRC1 and TOP2A signature in OS of TCGA cohort. (A) Scatter plots of risk score and survival time, and PRC1 and TOP2A gene expression heat map. (B) Kaplan-Meier curves for low- and high-risk score. (C) Time-dependent ROC curve of risk score.
Most of the 11 hub DEGs of the WGCNA network have been reported to be related to HCC in previous studies. Work by Tao et al. indicates that the down-regulation of expression in the metallothionein family in HCC may participate in hepatocarcinogenesis and serve as a biomarker for hepatocellular differentiation [44]. Previous studies have substantiated that PTTG1 [45] and MT1M [46] were associated with HCC tumorigenesis, furthermore, MT1H [47], MT1M [48] and MT1G [49] serve as tumor suppressor genes in HCC. In addition, studies also suggest that MT1G promotes sorafenib resistance and is a biomarker for exploring the impact of sorafenib on the redox metabolism of cancer cells [50, 51].
Numerous studies have shown that PRC1 and TOP2A play roles in multiple cancers and extensive studies have shown that PRC1 is involved in cell cycle processes. Studies by Mollinari et al. and Zhu et al. have substantiated that PRC1 is a bundling protein that is essential in maintaining the mitotic spindle midzone and plays a crucial role in midzone formation and cytokinesis [52, 53]. Recent research suggests that PRC1 is down-regulated by p53 in breast cancer cells, genetic variation of PRC1 is associated with breast cancer susceptibility, and PRC1 overexpression predicts poor disease-free survival of patients with breast cancer [54-56]. Consistent with this breast cancer research, previous studies have also indicated that PRC1 was up-regulated in tumor tissue and overexpression in tumor tissue promotes early recurrence in patients with HCC and prostate cancer [57, 58]. Consistent with the previous studies, our current study suggests that PRC1 was up-regulated in HBV-related HCC tumor tissue, and high PRC1 expression promotes a poor OS and RFS. In addition, we also explored the diagnostic value of PRC1 in HBV-related HCC and found that PRC1 is a promising diagnostic biomarker for HCC.
Several studies indicate that altered expression of TOP2A in tumor tissue was a prognostic biomarker for multiple cancers. Previous studies have already substantiated that the high expression of TOP2A was markedly related to poor OS and promotes early recurrence in patients with prostate cancer [59], endometrial cancer [60], non-muscle-invasive bladder cancer [61], and adrenocortical carcinoma [62]. In addition, high TOP2A expression has also been reported in patients with advanced gallbladder carcinoma [63], clear cell renal cell carcinoma [64] and HCC [65] with a significantly increased risk of death. Consistent with the previous studies, our current study also demonstrated that high TOP2A expression significantly increased risk of death and recurrence in patients with HCC. In terms of diagnosis, previous studies also reveal that TOP2A has notably increased expression in HCC tumor tissues [65, 66] compared to the adjacent normal liver tissues. Our current study further validated this finding; moreover, ROC analysis also indicated that TOP2A performed well in HCC diagnosis.
GSEA results between different PRC1 and TOP2A gene expression levels in GSE14520 cohort. GSEA results of high PRC1 expression groups in GSE14520 cohort (A-F); GSEA results of high TOP2A expression groups in GSE14520 cohort (G-L).
GSEA results between different PRC1 and TOP2A gene expression levels in HCC patients of TCGA cohort. GSEA results of high PRC1 expression groups in HCC patients of TCGA cohort (A-F); GSEA results of high TOP2A expression groups in HCC patients of TCGA cohort (G-L).
There were numerous previous studies have identified or summarized the key biomarkers for HBV-related HCC, several of them were also have been identified as DEGs between tumor and adjacent normal tissues, such as AFP, glypican 3 (GPC3), midkine (MDK), karyopherin subunit alpha 2 (KPNA2), cyclin B1 (CCNB1) [67-71]. The advantages and differences between our current study and previously published papers were that the present study was investigated the hepatocarcinogenesis using the GSEA, and the potential mechanism of PRC1 and TOP2A also revealed by the GSEA. The present study was the first investigation into the hepatocarcinogenesis potential mechanism using GSEA. Multiple previous studies also have identified hub DEGs between HCC tumor and non-tumor tissues, however, the hub DEGs identified by them were performed by the Search Tool for the Retrieval of Interacting Genes/Proteins (STRING) online tool, and the database of STRING cannot represent the tissue specificity of HCC [72-74]. So, the hub genes identified by STRING were not real in HCC. The advantages of the hub DEGs in the present study were identified by WGCNA method based on the GSE14520 dataset, and more suitable to exploring the co-expression relationship in HCC tumor tissues then STRING, as well as the results obtained by WGCNA were more reliable then STRING. In addition, due to the strong correlation of PRC1 and TOP2A, we combine the PRC1 and TOP2A through a linear combination method, and then constructed a prognostic signature for HCC prognosis prediction. The prognostic signature of PRC1 and TOP2A combined, doing well in HCC clinical outcome prediction in the GSE14520 cohort and was validated in the cohort from TCGA. ROC analysis of the prognostic signature revealed that the five-year survival rate of HCC OS can be predicted based on the expression of PRC1 and TOP2A through this linear combination method.
The genome-scale dataset provides a promising source for discovering diagnostic and prognostic biomarkers. However, there are still some limitations need statements. First, the clinical features available from the GSE14520 and TCGA database were incomplete. Thus, We evaluate the association between genes and HCC prognosis based on multivariate Cox proportional hazards regression model is only adjusted for age, gender, cirrhosis, BCLC stage, and serum AFP levels in the GSE14520 cohort, whereas, adjusted for age, gender, and tumor stage in TCGA cohort. Second, due to the lack of RFS information in the cohort from TCGA, the present study failed to verify the prognostic signature in HBV-related HCC RFS. And because of the HBV infection status in TCGA are unavailable on the TCGA website, therefore, we failed to identify the DEGs of HBV-related HCC using TCGA HCC cohort. Independent validation cohorts of HCC patients are necessary to evaluate this prognostic signature.
In spite of the limitations, the present study has identified 160 DEGs between HBV-related HCC tumor and adjacent normal tissue, which also include AFP. Bioinformatics analysis by GSEA, GO, KEGG, and the WGCNA network provides an insight into hepatocarcinogenesis and will thus help to develop effective diagnostic and therapeutic strategies. By a comprehensive investigation, we found that both PRC1 and TOP2A may be underlying diagnostic and prognostic biomarkers for HBV-related HCC. Furthermore, the prognostic signature of PRC1 and TOP2A doing well in prognosis prediction of HBV-related HCC. Single gene GSEA analyses indicate that both the high expression of PRC1 and TOP2A were obviously enriched in cell cycle and DNA repair related pathways and biological processes.
Conclusions
The present study aimed to identify DEGs that may be involved in hepatocarcinogenesis using a genome-scale and bioinformatic analysis to investigate the potential pathways and biological processes involved in HBV-related HCC. A total of 160 DEGs and 11 hub DEGs were identified and may be regarded as diagnostic biomarkers for HBV-related HCC. Several pathways and biological processes, such as toxic substances decomposition and metabolism processes, the cell cycle, the P450 pathway and p53 pathway, may play a critical role in hepatocarcinogenesis and are worthy of further study. The mRNA expression of hub DEGs, PRC1 and TOP2A, were regarded as potential diagnostic and prognostic biomarkers for HBV-related HCC. However, further studies are needed to elucidate the biological function of these genes and pathways in HBV-related HCC, and external validation cohorts are necessary to confirm our findings.
Supplementary Material
Supplementary figure and table legends, figures.
Supplementary tables.
Acknowledgements
This work was supported in part by the National Natural Science Foundation of China (No.: 81560535, 81802874, 81072321, 30760243, 30460143 and 30560133), Natural Science Foundation of Guangxi Province of China (Grant No. 2018GXNSFBA138013 and 2018GXNSFAA050119), 2009 Program for New Century Excellent Talents in University (NCET), Guangxi Natural Sciences Foundation (No. GuiKeGong 1104003A-7), and Guangxi Health Ministry Medicine Grant (Key-Scientific Research-Grant Z201018). The present study is also partly supported by Scientific Research Fund of the Health and Family Planning Commission of Guangxi Zhuang Autonomous Region (Z2016318), The project of Key laboratory of High-Incidence-Tumor Prevention & Treatment (Guangxi Medical University ), Ministry of Education (GKE2018-01, GKE2019-11), The Guangxi Key R & D Program (GKEAB18221019), The Basic Ability Improvement Project for Middle-aged and Young Teachers in Colleges and Universities in Guangxi (2018KY0110), Guangxi Key Laboratory for the Prevention and Control of Viral Hepatitis (No.GXCDCKL201902), 2018 Innovation Project of Guangxi Graduate Education (JGY2018037), and 2018 Innovation Project of Guangxi Graduate Education (YCBZ2018036). As well as, the present study is also partly supported by Research Institute of Innovative Think-tank in Guangxi Medical University (The gene-environment interaction in hepatocarcinogenesis in Guangxi HCCs and its translational applications in the HCC prevention). We would also acknowledge the supported by the National Key Clinical Specialty Programs (General Surgery & Oncology) and the Key Laboratory of Early Prevention & Treatment for Regional High-Incidence-Tumor (Guangxi Medical University), Ministry of Education, China. The authors thank the contributors of GSE14520 and TCGA for sharing the HCC dataset on open access. In addition, we also would like to acknowledge the helpful comments on this paper received from our reviewers.
ORCID ID: http://orcid.org/0000-0001-6133-7078.
Competing Interests
The authors have declared that no competing interest exists.
References
1. Schweitzer A, Horn J, Mikolajczyk RT, Krause G, Ott JJ. Estimations of worldwide prevalence of chronic hepatitis B virus infection: a systematic review of data published between 1965 and 2013. Lancet. 2015;386:1546-55
2. Lavanchy D. Hepatitis B virus epidemiology, disease burden, treatment, and current and emerging prevention and control measures. Journal of viral hepatitis. 2004;11:97-107
3. Ott JJ, Stevens GA, Groeger J, Wiersma ST. Global epidemiology of hepatitis B virus infection: new estimates of age-specific HBsAg seroprevalence and endemicity. Vaccine. 2012;30:2212-9
4. Stanaway JD, Flaxman AD, Naghavi M, Fitzmaurice C, Vos T, Abubakar I. et al. The global burden of viral hepatitis from 1990 to 2013: findings from the Global Burden of Disease Study 2013. Lancet. 2016;388:1081-8
5. Te HS, Jensen DM. Epidemiology of hepatitis B and C viruses: a global overview. Clinics in liver disease. 2010;14:1-21 vii
6. Farazi PA, DePinho RA. Hepatocellular carcinoma pathogenesis: from genes to environment. Nature reviews Cancer. 2006;6:674-87
7. Llovet JM, Zucman-Rossi J, Pikarsky E, Sangro B, Schwartz M, Sherman M. et al. Hepatocellular carcinoma. Nature reviews Disease primers. 2016;2:16018
8. Perz JF, Armstrong GL, Farrington LA, Hutin YJ, Bell BP. The contributions of hepatitis B virus and hepatitis C virus infections to cirrhosis and primary liver cancer worldwide. Journal of hepatology. 2006;45:529-38
9. Torre LA, Bray F, Siegel RL, Ferlay J, Lortet-Tieulent J, Jemal A. Global cancer statistics, 2012. CA: a cancer journal for clinicians. 2015;65:87-108
10. Chen W, Zheng R, Baade PD, Zhang S, Zeng H, Bray F. et al. Cancer statistics in China, 2015. CA: a cancer journal for clinicians. 2016;66:115-32
11. Zeng H, Zheng R, Guo Y, Zhang S, Zou X, Wang N. et al. Cancer survival in China, 2003-2005: a population-based study. International journal of cancer. 2015;136:1921-30
12. Tang D, Nagano H, Nakamura M, Wada H, Marubashi S, Miyamoto A. et al. Clinical and pathological features of Allen's type C classification of resected combined hepatocellular and cholangiocarcinoma: a comparative study with hepatocellular carcinoma and cholangiocellular carcinoma. Journal of gastrointestinal surgery: official journal of the Society for Surgery of the Alimentary Tract. 2006;10:987-98
13. Cancer Genome Atlas Research Network. Electronic address wbe, Cancer Genome Atlas Research N. Comprehensive and Integrative Genomic Characterization of Hepatocellular Carcinoma. Cell. 2017;169:1327-41 e23
14. Roessler S, Long EL, Budhu A, Chen Y, Zhao X, Ji J. et al. Integrative genomic identification of genes on 8p associated with hepatocellular carcinoma progression and patient survival. Gastroenterology. 2012;142:957-66 e12
15. Roessler S, Jia HL, Budhu A, Forgues M, Ye QH, Lee JS. et al. A unique metastasis gene signature enables prediction of tumor relapse in early-stage hepatocellular carcinoma patients. Cancer research. 2010;70:10202-12
16. Ritchie ME, Phipson B, Wu D, Hu Y, Law CW, Shi W. et al. limma powers differential expression analyses for RNA-sequencing and microarray studies. Nucleic acids research. 2015;43:e47
17. Zhou M, Zhao H, Wang Z, Cheng L, Yang L, Shi H. et al. Identification and validation of potential prognostic lncRNA biomarkers for predicting survival in patients with multiple myeloma. Journal of experimental & clinical cancer research: CR. 2015;34:102
18. Mootha VK, Lindgren CM, Eriksson KF, Subramanian A, Sihag S, Lehar J. et al. PGC-1alpha-responsive genes involved in oxidative phosphorylation are coordinately downregulated in human diabetes. Nature genetics. 2003;34:267-73
19. Subramanian A, Tamayo P, Mootha VK, Mukherjee S, Ebert BL, Gillette MA. et al. Gene set enrichment analysis: a knowledge-based approach for interpreting genome-wide expression profiles. Proceedings of the National Academy of Sciences of the United States of America. 2005;102:15545-50
20. Liao X, Huang R, Liu X, Han C, Yu L, Wang S. et al. Distinct prognostic values of alcohol dehydrogenase mRNA expression in pancreatic adenocarcinoma. OncoTargets and therapy. 2017;10:3719-32
21. Shang L, Zhu G, Su H, Chen B, Ye X, Chen X. et al. Identification of alcohol dehydrogenase as a potential prognostic marker in HBV-related hepatocellular carcinoma. International Journal of Clinical and Experimental Medicine. 2017;10:4457-72
22. Huang da W, Sherman BT, Lempicki RA. Systematic and integrative analysis of large gene lists using DAVID bioinformatics resources. Nature protocols. 2009;4:44-57
23. Huang da W, Sherman BT, Lempicki RA. Bioinformatics enrichment tools: paths toward the comprehensive functional analysis of large gene lists. Nucleic acids research. 2009;37:1-13
24. Langfelder P, Horvath S. WGCNA: an R package for weighted correlation network analysis. BMC bioinformatics. 2008;9:559
25. Liao X, Zhu G, Huang R, Yang C, Wang X, Huang K. et al. Identification of potential prognostic microRNA biomarkers for predicting survival in patients with hepatocellular carcinoma. Cancer management and research. 2018;10:787-803
26. Liao X, Huang K, Huang R, Liu X, Han C, Yu L. et al. Genome-scale analysis to identify prognostic markers in patients with early-stage pancreatic ductal adenocarcinoma after pancreaticoduodenectomy. OncoTargets and therapy. 2017;10:4493-506
27. Huang R, Liao X, Li Q. Identification and validation of potential prognostic gene biomarkers for predicting survival in patients with acute myeloid leukemia. OncoTargets and therapy. 2017;10:5243-54
28. Liao X, Liu X, Yang C, Wang X, Yu T, Han C. et al. Distinct Diagnostic and Prognostic Values of Minichromosome Maintenance Gene Expression in Patients with Hepatocellular Carcinoma. Journal of Cancer. 2018;9:2357-73
29. Heagerty PJ, Zheng Y. Survival model predictive accuracy and ROC curves. Biometrics. 2005;61:92-105
30. Benjamini Y, Hochberg Y. Controlling the false discovery rate: a practical and powerful approach to multiple testing. Journal of the royal statistical society series b-statistical methodology. 1995;57:289-300
31. Reiner A, Yekutieli D, Benjamini Y. Identifying differentially expressed genes using false discovery rate controlling procedures. Bioinformatics. 2003;19:368-75
32. Benjamini Y, Drai D, Elmer G, Kafkafi N, Golani I. Controlling the false discovery rate in behavior genetics research. Behavioural brain research. 2001;125:279-84
33. Shannon P, Markiel A, Ozier O, Baliga NS, Wang JT, Ramage D. et al. Cytoscape: a software environment for integrated models of biomolecular interaction networks. Genome research. 2003;13:2498-504
34. Consortium GT. The Genotype-Tissue Expression (GTEx) project. Nature genetics. 2013;45:580-5
35. Uhlen M, Zhang C, Lee S, Sjostedt E, Fagerberg L, Bidkhori G. et al. A pathology atlas of the human cancer transcriptome. Science. 2017:357
36. Uhlen M, Fagerberg L, Hallstrom BM, Lindskog C, Oksvold P, Mardinoglu A. et al. Proteomics. Tissue-based map of the human proteome. Science. 2015;347:1260419
37. Yu Z, Gao YQ, Feng H, Lee YY, Li MS, Tian Y. et al. Cell cycle-related kinase mediates viral-host signalling to promote hepatitis B virus-associated hepatocarcinogenesis. Gut. 2014;63:1793-804
38. Chung YL, Wu ML. Promyelocytic leukaemia protein links DNA damage response and repair to hepatitis B virus-related hepatocarcinogenesis. The Journal of pathology. 2013;230:377-87
39. Arsura M, Cavin LG. Nuclear factor-kappaB and liver carcinogenesis. Cancer letters. 2005;229:157-69
40. Staib F, Hussain SP, Hofseth LJ, Wang XW, Harris CC. TP53 and liver carcinogenesis. Human mutation. 2003;21:201-16
41. Guichard C, Amaddeo G, Imbeaud S, Ladeiro Y, Pelletier L, Maad IB. et al. Integrated analysis of somatic mutations and focal copy-number changes identifies key genes and pathways in hepatocellular carcinoma. Nature genetics. 2012;44:694-8
42. Niu Y, Wu Z, Shen Q, Song J, Luo Q, You H. et al. Hepatitis B virus X protein co-activates pregnane X receptor to induce the cytochrome P450 3A4 enzyme, a potential implication in hepatocarcinogenesis. Digestive and liver disease: official journal of the Italian Society of Gastroenterology and the Italian Association for the Study of the Liver. 2013;45:1041-8
43. Kondoh N, Wakatsuki T, Ryo A, Hada A, Aihara T, Horiuchi S. et al. Identification and characterization of genes associated with human hepatocellular carcinogenesis. Cancer research. 1999;59:4990-6
44. Tao X, Zheng JM, Xu AM, Chen XF, Zhang SH. Downregulated expression of metallothionein and its clinicopathological significance in hepatocellular carcinoma. Hepatology research: the official journal of the Japan Society of Hepatology. 2007;37:820-7
45. Molina-Jimenez F, Benedicto I, Murata M, Martin-Vilchez S, Seki T, Antonio Pintor-Toro J. et al. Expression of pituitary tumor-transforming gene 1 (PTTG1)/securin in hepatitis B virus (HBV)-associated liver diseases: evidence for an HBV X protein-mediated inhibition of PTTG1 ubiquitination and degradation. Hepatology. 2010;51:777-87
46. Fu CL, Pan B, Pan JH, Gan MF. Metallothionein 1M suppresses tumorigenesis in hepatocellular carcinoma. Oncotarget. 2017;8:33037-46
47. Zheng Y, Jiang L, Hu Y, Xiao C, Xu N, Zhou J. et al. Metallothionein 1H (MT1H) functions as a tumor suppressor in hepatocellular carcinoma through regulating Wnt/beta-catenin signaling pathway. BMC cancer. 2017;17:161
48. Mao J, Yu H, Wang C, Sun L, Jiang W, Zhang P. et al. Metallothionein MT1M is a tumor suppressor of human hepatocellular carcinomas. Carcinogenesis. 2012;33:2568-77
49. Kanda M, Nomoto S, Okamura Y, Nishikawa Y, Sugimoto H, Kanazumi N. et al. Detection of metallothionein 1G as a methylated tumor suppressor gene in human hepatocellular carcinoma using a novel method of double combination array analysis. International journal of oncology. 2009;35:477-83
50. Houessinon A, Francois C, Sauzay C, Louandre C, Mongelard G, Godin C. et al. Metallothionein-1 as a biomarker of altered redox metabolism in hepatocellular carcinoma cells exposed to sorafenib. Molecular cancer. 2016;15:38
51. Sun X, Niu X, Chen R, He W, Chen D, Kang R. et al. Metallothionein-1G facilitates sorafenib resistance through inhibition of ferroptosis. Hepatology. 2016;64:488-500
52. Mollinari C, Kleman JP, Jiang W, Schoehn G, Hunter T, Margolis RL. PRC1 is a microtubule binding and bundling protein essential to maintain the mitotic spindle midzone. The Journal of cell biology. 2002;157:1175-86
53. Zhu C, Jiang W. Cell cycle-dependent translocation of PRC1 on the spindle by Kif4 is essential for midzone formation and cytokinesis. Proceedings of the National Academy of Sciences of the United States of America. 2005;102:343-8
54. Li C, Lin M, Liu J. Identification of PRC1 as the p53 target gene uncovers a novel function of p53 in the regulation of cytokinesis. Oncogene. 2004;23:9336-47
55. Brynychova V, Ehrlichova M, Hlavac V, Nemcova-Furstova V, Pecha V, Leva J. et al. Genetic and functional analyses do not explain the association of high PRC1 expression with poor survival of breast carcinoma patients. Biomedicine & pharmacotherapy = Biomedecine & pharmacotherapie. 2016;83:857-64
56. Cai Q, Zhang B, Sung H, Low SK, Kweon SS, Lu W. et al. Genome-wide association analysis in East Asians identifies breast cancer susceptibility loci at 1q32.1, 5q14.3 and 15q26.1. Nature genetics. 2014;46:886-90
57. Chen J, Rajasekaran M, Xia H, Zhang X, Kong SN, Sekar K. et al. The microtubule-associated protein PRC1 promotes early recurrence of hepatocellular carcinoma in association with the Wnt/beta-catenin signalling pathway. Gut. 2016;65:1522-34
58. Luo HW, Chen QB, Wan YP, Chen GX, Zhuo YJ, Cai ZD. et al. Protein regulator of cytokinesis 1 overexpression predicts biochemical recurrence in men with prostate cancer. Biomedicine & pharmacotherapy = Biomedecine & pharmacotherapie. 2016;78:116-20
59. Li X, Liu Y, Chen W, Fang Y, Xu H, Zhu HH. et al. TOP2Ahigh is the phenotype of recurrence and metastasis whereas TOP2Aneg cells represent cancer stem cells in prostate cancer. Oncotarget. 2014;5:9498-513
60. Ito F, Furukawa N, Nakai T. Evaluation of TOP2A as a Predictive Marker for Endometrial Cancer With Taxane-Containing Adjuvant Chemotherapy. International journal of gynecological cancer: official journal of the International Gynecological Cancer Society. 2016;26:325-30
61. Kim EJ, Lee YS, Kim YJ, Kim MJ, Ha YS, Jeong P. et al. Clinical implications and prognostic values of topoisomerase-II alpha expression in primary non-muscle-invasive bladder cancer. Urology. 2010;75:1516 e9-13
62. Ip JC, Pang TC, Glover AR, Soon P, Zhao JT, Clarke S. et al. Immunohistochemical validation of overexpressed genes identified by global expression microarrays in adrenocortical carcinoma reveals potential predictive and prognostic biomarkers. The oncologist. 2015;20:247-56
63. Washiro M, Ohtsuka M, Kimura F, Shimizu H, Yoshidome H, Sugimoto T. et al. Upregulation of topoisomerase IIalpha expression in advanced gallbladder carcinoma: a potential chemotherapeutic target. Journal of cancer research and clinical oncology. 2008;134:793-801
64. Parker AS, Eckel-Passow JE, Serie D, Hilton T, Parasramka M, Joseph RW. et al. Higher expression of topoisomerase II alpha is an independent marker of increased risk of cancer-specific death in patients with clear cell renal cell carcinoma. European urology. 2014;66:929-35
65. Wong N, Yeo W, Wong WL, Wong NL, Chan KY, Mo FK. et al. TOP2A overexpression in hepatocellular carcinoma correlates with early age onset, shorter patients survival and chemoresistance. International journal of cancer. 2009;124:644-52
66. Panvichian R, Tantiwetrueangdet A, Angkathunyakul N, Leelaudomlipi S. TOP2A amplification and overexpression in hepatocellular carcinoma tissues. BioMed research international. 2015;2015:381602
67. Li H, Zhao X, Li C, Sheng C, Bai Z. Integrated analysis of lncRNA-associated ceRNA network reveals potential biomarkers for the prognosis of hepatitis B virus-related hepatocellular carcinoma. Cancer management and research. 2019;11:877-97
68. Van Hees S, Michielsen P, Vanwolleghem T. Circulating predictive and diagnostic biomarkers for hepatitis B virus-associated hepatocellular carcinoma. World journal of gastroenterology. 2016;22:8271-82
69. Chauhan R, Lahiri N. Tissue- and Serum-Associated Biomarkers of Hepatocellular Carcinoma. Biomarkers in cancer. 2016;8:37-55
70. Schutte K, Schulz C, Link A, Malfertheiner P. Current biomarkers for hepatocellular carcinoma: Surveillance, diagnosis and prediction of prognosis. World journal of hepatology. 2015;7:139-49
71. Song PP, Xia JF, Inagaki Y, Hasegawa K, Sakamoto Y, Kokudo N. et al. Controversies regarding and perspectives on clinical utility of biomarkers in hepatocellular carcinoma. World journal of gastroenterology. 2016;22:262-74
72. Xing T, Yan T, Zhou Q. Identification of key candidate genes and pathways in hepatocellular carcinoma by integrated bioinformatical analysis. Experimental and therapeutic medicine. 2018;15:4932-42
73. Hu WQ, Wang W, Fang DL, Yin XF. Identification of Biological Targets of Therapeutic Intervention for Hepatocellular Carcinoma by Integrated Bioinformatical Analysis. Medical science monitor: international medical journal of experimental and clinical research. 2018;24:3450-61
74. Wang J, Tian Y, Chen H, Li H, Zheng S. Key signaling pathways, genes and transcription factors associated with hepatocellular carcinoma. Molecular medicine reports. 2018;17:8153-60
Author contact
![]() Corresponding author: Prof. Tao Peng, Department of Hepatobiliary Surgery, The First Affiliated Hospital of Guangxi Medical University, Shuang_Yong Rd. 6#, Nanning, 530021, Guangxi Zhuang Autonomous Region, People's Republic of China. Tel: (+86)-771-5356528. Fax: (+86)-771-5350031. E-mail: pengtaogmucom, pengtaoedu.cn.
Corresponding author: Prof. Tao Peng, Department of Hepatobiliary Surgery, The First Affiliated Hospital of Guangxi Medical University, Shuang_Yong Rd. 6#, Nanning, 530021, Guangxi Zhuang Autonomous Region, People's Republic of China. Tel: (+86)-771-5356528. Fax: (+86)-771-5350031. E-mail: pengtaogmucom, pengtaoedu.cn.

 Global reach, higher impact