Impact Factor ISSN: 1837-9664

 Global reach, higher impact
J Cancer 2020; 11(5):1104-1114. doi:10.7150/jca.36076 This issue Cite
Research Paper
Comparison of different images in gross target volume delineating on VX2 nasopharyngeal transplantation tumor models
Zhang-Qiang Xiang1*, Saber Imani1*, Yue Hu1*, Rui-Lin Ding1*, Hao-Wen Pang1, Yue Chen2, Shao-Zhi Fu1, Fang Xie1, Wen-Feng He1, Qing-Lian Wen1 ![]()
1. Department of Oncology, The Affiliated Hospital of Southwest Medical University, Luzhou, Sichuan, China (Z-QX, SI, YH, R-LD, H-WP, S-ZF, FX, W-FH, Q-LW).
2. Department of Nuclear Medicine, The Affiliated Hospital of Southwest Medical University, Luzhou, Sichuan, China (YC).
*These authors contributed equally to this work.
Received 2019-4-26; Accepted 2019-11-15; Published 2020-1-1
Abstract
Background: To determine the optimum conditions for diagnosis of nasopharyngeal carcinoma, we established VX2 rabbit model to delineate gross target volume (GTV) in different imaging methods.
Methods: The orthotopic nasopharyngeal carcinoma (NPC) was established in sixteen New Zealand rabbits. After 7-days inoculation, the rabbits were examined by CT scanning and then sacrificed for pathological examination. To achieve the best delineation, different GTVs of CT, MRI, 18F-FDG PET/CT, and 18F-FLT PET/CT images were correlated with pathological GTV (GTVp).
Results: We found 45% and 60% of the maximum standardized uptake value (SUVmax) as the optimal SUV threshold for the target volume of NPC in 18F-FDG PET/CT and 18F-FLT PET/CT images, respectively (GTVFDG45% and GTVFLT60%). Moreover, the GTVMRI and GTVCT were significantly higher than the GTVp (P ≤ 0.05), while the GTVFDG45% and especially GTVFLT60% were similar to the GTVp (R = 0.892 and R = 0.902, respectively; P ≤ 0.001).
Conclusions: Notably, the results suggested that 18F-FLT PET/CT could reflect the tumor boundaries more accurately than 18F-FDG PET/CT, MRI and CT, which makes 18F-FLT PET-CT more advantageous for the clinical delineation of the target volume in NPC.
Keywords: Nasopharyngeal carcinoma, Gross tumor volume, Magnetic resonance imaging, Computed tomography, 18F-FLT PET/CT, 18F-FDG PET/CT.
Introduction
Nasopharyngeal carcinoma (NPC) is the most frequently diagnosed cancer in the Southeast Asia, Middle East, and North Africa, with estimated as 20-50 per 100,000 person-years in southern China [1, 2]. According to Surveillance, Epidemiology, and End Results (SEER) program, the overall 5-year survival of NPC was > 80% after the radiotherapy, when diagnosed at the localized stage [2]. Today, the modern radiographic modalities imaging and irradiation techniques, including magnetic resonance imaging (MRI) and computed tomography (CT) are among the more accurate distinction methods of retropharyngeal nodes and adjacent primary tumor of NPC [3-6]. Since the resolution of MRI is higher than CT on soft tissue, the MRI imaging can be first choice for adequate targeting of NPC [7].
The high tumor proliferative rate and aggressive biological behavior of regional lymph nodes of NPC lead to a decrease in sensitivity of early diagnosis [8]. Still, excellent metastases diagnosis of retropharyngeal lymph nodes metastases, cervical lymph nodes metastases, and distant metastases in patients with locoregionally advanced NPC is still poor [6, 9]. Target delineation of the advanced-stage of NPC was routinely performed by the combination of CT and MRI to define the extension of the tumor involvement. It is becoming evident that positron emission tomography (PET) has recently emerged as a sensitive, specific and accurate s morphological imaging which can detect early malignant changes at the molecular level. More recently, functional imaging of PET/CT is widely used for the diagnosis and staging of many types of cancer, including breast cancer, lung cancer, head and neck cancer, and etc. [10-14]. PET and CT combined imaging have reduced the inter- and intra-observer variation in contouring the gross tumor volume (GTV) compared to anatomic imaging techniques. Gradient-based segmentation method is one of the well-evaluated detection methods that have been developed to identify the NPC tumor based on the changes in the levels at the tumor border. The low spatial resolution, poor target delineation of distant metastases, and recurrence disease are among the most limitation in the PET images when enhanced with CT or MRI images [14]. In fact, different imaging agents can produce accurate lesion data from different stages of the tumorigenesis, such as metabolism and proliferation. In this regards, 18F-Fluorothymidine (18F-FLT) and 18F-Fluorodeoxyglucose (18F-FDG) positron are well-adjusted PET/CT imaging techniques that were recombined by the National Comprehensive Cancer Network guideline 2012, for designing lung cancer target volumes [15]. However, by the advent of FDG-PET, the therapeutic effectiveness of radiotherapy and earlier diagnosis of NPC has been improved, enthusiastically [8]. PET-guided GTV delineation methods, 18F-FDG and 18F-FLT PET/CT are refelacted glucose metabolism. This could limit the distinguishing of the proliferation of tumor cells from inflammatory tissue. Also, the accuracy of the delineation using FLT PET/CT is not sufficiently validated according to the pathologic data and tumour type [16, 17].
Due to the notoriously narrow therapeutic margin, the target delineation in NPC is often challengeable. In microscopic imaging, the recognition of highly infiltrative is the first step of accurate delineation of the GTVs in high-risk site [18, 19]. Recent articles indicate that high doses modalities imaging and irradiation techniques are required to achieve optimal levels of tumor control in individual patients [20]. Among many clinical diagnosis and assisting tumor staging methods, 18F-FDG PET/CT and 18F-FLT PET/CT are the most acceptable and non-invasive procedures for the NPC staging and diagnosis [21]. Despite many technological advances, the target GTVs delineation of 18F-FDG PET/CT and 18F-FLT PET/CT in NPC are still controversial.
With these assumptions and foreground, this study was aimed to compare the application value of 18F-FDG PET/CT and 18F- FLT PET/CT in the rabbit VX2 NPC model. Then, we tried to determine the best imaging method to delineate the GTVs of 18F-FDG PET/CT and 18F- FLT PET/CT image in NPC carcinoma.
Materials and methods
Animals and tumor model
Sixteen healthy New Zealand white rabbits, which are 8 females and 8 males, and their body's weight are between 2.8~4.0 kg (age 3-4 months), were obtained by the experimental animal center of Southwest Medical University (license number SCXK (Shanghai) 2013-2017 Shanghai Slack Experimental Animal Co., Ltd; SCXK2013-17). They were housed a standard laboratory cages under 20-22 °C, 50-60% relative humidity and 12 h light/ 12 h dark cycle (starting at 07.00 h and 19.00 h, respectively), with free access to food and water. The VX2 liver tumor-bearing rabbit model was obtained by he Ultrasonic Experimental Center of Chongqing Medical University (Chongqing, China).
Establishment of the VX2 nasopharyngeal transplantation tumor model
Establishment of the rabbit VX2 transplantation model was performed according to the standard method [22, 23]. The VX2 liver tumor-bearing rabbit was anaesthetized with 3% pentobarbital sodium (Solarbio science, Beijing, China) at a dose of 1 ml/kg body weight. The tumor-bearing rabbit was narcotized and fixed in the supine position, and was covered with a sterile drape exposing only the abdominal skin. After one week, the skin was incised and the tumor tissue stripped off into approximately 1.0×1.0 cm in a clean bench by using a sterile scalpel. The samples were placed in Hank's solution and with normal saline and then the tumor suspension were harvested after grinding using a 200-300 mesh sieve homogenizer homogenized with appropriate amount of 1% normal saline. The cell suspension (1-2×10⁷ cells/ml) was collected after centrifugal scrubber at 1500 g, for 5 min, by adding the proper amount of normal saline in the bottom of the cell suspension. Thereafter, suspended cells were cultured in FBS-free RPMI-1640 medium (RPMI, Hyclone, USA) supplemented with 1% penicillin-streptomycin (Sigma-Aldrich, St Louis, MO, USA). Cell cultures were incubated at 37 °C with 5% CO2 in a humidified incubator. The number of viable cells was counted by using the trypan blue exclusion test; the percentage of viable cells was > 93%.
For nasopharyngeal tumor cell implantation, rabbits were narcotized and fixed in the supine position. We selected the midpoint of the hyoid bone as the puncture point. By the guidance of CT, the needle immediately was inserted to reach the nasopharyngeal posterior wall adjacent to clivus. The rabbits received 0.5 ml VX2 cell suspension (1×10⁷ cells/ml) by slow submucosal injection of posterior pharyngeal wall so that the puncture depth was 3-5 mm below the surface of the skull plate. The injection was performed by using 1.0-ml syringe puncture needle (1.2 mm diameter) in duration of 3 minutes. After surgery, 40-60 million units of penicillin were given intramuscularly for 3 days.
After 7 days from implantation, a CT scan was performed to determine the tumor growth. When the mass in the nasopharynx found, the enhanced CT, MRI, 18F-FDG PET/CT, and 18F-FLT PET/CT examination of the rabbits were performed within 96 h. After the scanning, rabbits were immediately sacrificed and the tumor's tissue was fixed for further pathological assays.
Contrast-enhanced CT and MRI imaging protocol
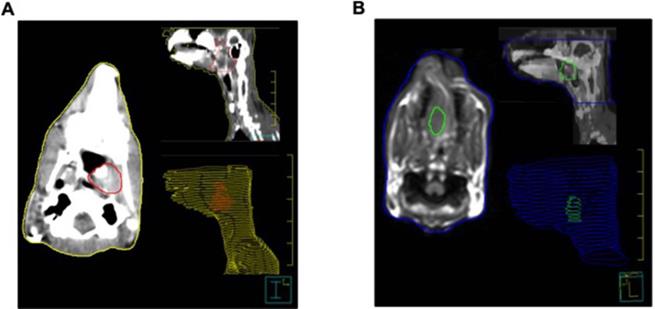
The anesthetized rabbits (n = 10) were fixed in the supine position on the home-made plastic fixing plate, and the head was fixed on a home-made foam holder. The rabbits underwent conventional cross-sectional scan with spiral CT (Light Speed ultra; GE Medical Systems, USA). The CT parameters included 2.5 mm slice thickness and 0.75 pitches were were checked routinely at 5 mm reconstructing interval. For contrast-enhanced CT imaging, 15 ml iohexol (300 mg I/ml, 1.5 ml/kg) was pumped into the rabbit through an ear marginal vein at a rate of 0.5 ml/s. Also, the MRI (Achieva 3.0T, Philips, Netherlands) studies were conducted by a head and neck coil, T1-weighted axial, sagittal scanning (TR2000 ms/TE20 ms with 3 mm slice thickness, 0.3 mm spacing), T2-weighted axial, sagittal scanning (TR3000 ms/TE80 ms with 3 mm slice thickness, 0.3 mm spacing). Post-contrast T1-weighted images were acquired 5 min after magnevist solution injection (Gd1DTPA, 0.1 mmol/kg). All images were transferred to a Pinnacle 8.0 Philips workstation. The GTVs in axial contrast-enhanced CT images (GTVCT, Fig. 1A) and MRI image (GTVMRI, Fig. 1B) were determined by two radiation oncologists (HW.P. and QL.W.). In details, T1-weighted contrast-enhanced MRI images in axial view and sagittal view of the tumor were delineated for the GTVMRI.
Representative images of GTV segmentation on contrast-enhanced CT images (A) and MRI (B) in a VX2 rabbit model with a nasopharyngeal carcinoma. The coronal images of the CT and MRI show GTV segmentation on the cavernous sinus and left orbit. The red zone on the panel A and green zone on panel B indicates the regions of NPC with less than 95% isodose level. Note that all outlines are manually drawn.
PET/CT imaging protocol
The integrated PET and CT images were acquired on a hybrid PET/CT scanner (Gemini TF/16, Philips, Netherlands) at the Department of Nuclear Medicine, the Affiliated Hospital of Southwest Medical University. Before scanning, the rabbits were not given food and water for more than 12 h. Then, they were fixed in the same supine position as mentioned above. Next, 45.4-64.4 Mbq (the radiochemical purity > 95%) of 18F-FDG or 45.4-64.4 Mbq of 18F-FLT was injected intravenously through the ear marginal vein. Sixty min after the injection, the images were acquired. The PET/CT parameters included 120 KV, 80 mAS, 3 min/bed, 0.813 pitches, and a 3.8 mm reconstruction layer thickness. Data were reconstructed using an iterative reconstruction technique and attenuation correction derived from the CT data. The CT, PET, and fused PET/CT images were transmitted to an Extended Brilliance Philips workstation. The PET images were evaluated qualitatively for regions of focally increased metabolism. Increased uptake in the surrounding of the tissue was considered to characterize malignancy. For tumors visualized by PET, the region of interest was placed over the entire FDG- or FLT-avid lesion on all transverse planes in which the tumor appeared. The standardized uptake value (SUV) was calculated using the standard formula: SUV=A/(ID/BW), where, A is the decay-corrected tracer tissue concentration (Bq/g); ID, the injected dose (Bq) and BW, the body weight (g) of the rabbit [24].
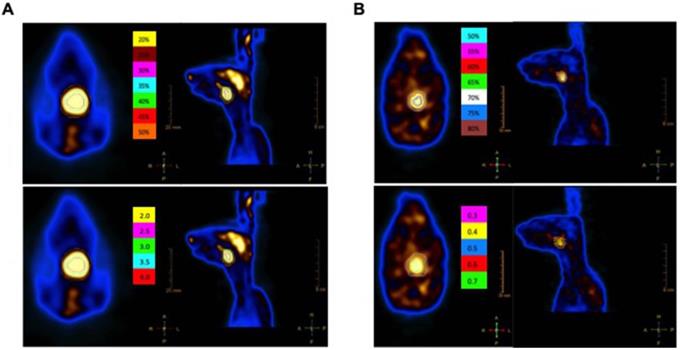
In this study, the different kinds of GTVs were generated for each animal. For the 18F-FDG PET/CT images, GTVFDG2.0, GTVFDG2.5, GTVFDG3.0, GTVFDG3.5, and GTVFDG4.0 were automatically segmented on the PET images using gradient-based methods, fixed threshold values at 2.0, 2.5, 3.0, 3.5, and 4.0 SUV, respectively. GTVFDG20%, GTVFDG25%, GTVFDG30%, GTVFDG35%, GTVFDG40%, GTVFDG45%, and GTVFDG50% were automatically segmented using the same method as above at fixed threshold values: 20, 25, 30, 35, 40, 45, and 50% of SUVmax (Fig. 2A). For the 18F-FLT PET/CT images, the GTVs were delineated in the same way as we described above in different fixed threshold values at 0.3, 0.4, 0.5, 0.6, and 0.7 SUV, respectively. Then, GTVFLT50%, GTVFLT55%, GTVFLT60%, GTVFLT65%, GTVFLT70%, GTVFLT75%, and GTVFLT80% were automatically segmented using the same method as above at fixed threshold values: 50, 55, 60, 65, 70, 75, and 80% of SUVmax (Fig. 2B). The PET/CT images were reviewed by one experienced nuclear medicine physician (Y.C.) and two radiation oncologists (HW.P. and QL.W.).
The GTV automatically segmented based on different SUV threshold values on 18F-FDG PET/CT (A) and 18F-FLT PET/CT (B). The 18F-FDG PET/CT images (Panel A) GTVFDG2.0, GTVFDG2.5, GTVFDG3.0, GTVFDG3.5, and GTVFDG4.0 were automatically segmented on the PET images using gradient-based methods, fixed threshold values at 2.0, 2.5, 3.0, 3.5, and 4.0 SUV, respectively. The axial and coronal images of GTVs segmented based on different SUV threshold values at 50%, 55%, 60%, 65%, 70%, 75%, and 80% of SUVmax. Also, the axial and coronal MRI images of GTVs segmented based on different SUV threshold values at 0.3, 0.4, 0.5, 0.6 and 0.7 SUV, receptively (panel B).
Pathological examination
For the histopathological staining, the rabbits were sacrificed immediately after completing all of the imaging examination. After division the bilateral cervical lymph node, the whole tumor and clivus of the rabbit was dissected. The pathology gross tumor volume (GTVp) was measured by the water immersion method. In this study, the GTVp was defined as the maximum major axis length and minimum minor axis length of the tumor in the target slice visible to the naked eye [22, 23]. VX2 tumors were excised, and then fixed in a neutral formalin solution for 24 h. The specimens were stained by a standard hematoxylin and eosin (H&E) technique and examined by light microscopy. The pathological specimens were fixed with 10% formaldehyde solution, conventional dehydration, followed by paraffin imbedding. The best embedded-samples were cut into 4-µm-thick sections, and then stained the hematoxylin and eosin (H&E) for later light microscopy analysis (Nikon, Tokyo, Japan), linked to computerized image system (Image-Pro Plus V6.0, Silver Spring, MD) at 200x magnification. All procedures of tumours removeing from animals were performed by the same experienced surgical teams. All pathological examinations were assessed by two expert pathologists, independently (RL.D. and Y.H.) and any disagreements were resolved through a discussion.
Statistical analysis
All quantitative data were transferred to Excel and the statistical analyses were computed with SPSS software for Windows (Version 21, SPSS Inc., Chicago, Illinois, USA). Data were presented as means ± Std. Deviation (SD) or median (range). The Wilcoxon signed rank test was used to compare the GTVp with GTVCT, GTVMRI, GTVFDG, and GTVFLT. The Spearman's rank correlation coefficient test was employed to determine the association between two variables. For all tests, P < 0.05 considered statistically significant. All charts were designed by Prism 5.0 (GraphPad, La Jolla, CA, USA).
Results
The establishment of animal model
Sixteen New Zealand white rabbits were used to determine VX2 nasopharyngeal transplantation tumor models. However, one rabbit died of massive hemorrhage due to the piercing of a large blood vessel during the establishment of the tumor model. After 7-day inoculation, the CT images were acquired on the remaining rabbits (n = 15) and nasopharyngeal masses were found in 13 of 15 rabbits (86.67%), which were later confirmed by pathological examinations. In this successful tumor model, 3 rabbits (20%) died from suffocation due to the oversize tumors, airway obstruction, and/or anesthesia-induced respiratory depression. Thus, the remaining 10 animals (76.92%) were eligible for the study to delineate the GTVs. This presentence of mortality during establishment of the VX2 transplantation model is in line with the results of previous studies [22].
VX2 transplantation tumor growth and pathological finding
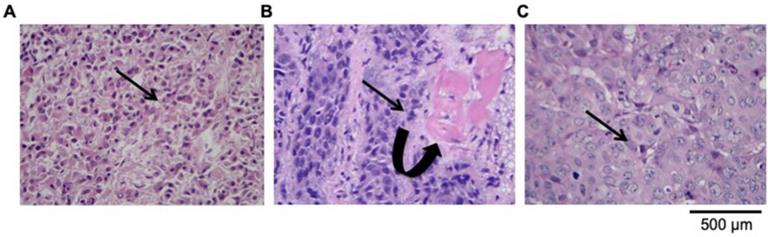
The VX2 tumor is a transplantable rabbit squamous cell carcinoma, characterized by rapid tumor growth and early metastasis. To measure the growth and metastatic pattern, we acquired the CT images during the planning phase: 7, 14, 21, and 28 days after transplantation. On day 7 after inoculation, there was no difference in the tumor volume. However, the tumor's volume increased after 7 days (over time). The distinct morphology and growth pattern of VX2 transplantation cells suggested some differences in their malignant characteristics of the carcinoma cells. At 14 days from transplantation, the mean nasopharyngeal tumor volume reached 5.86 cm3 and the average diameter was 2.83 ± 0.56 cm in all rabbits. Subsequently, imaging examination and autopsy confirmed that the tumor exhibited a local aggressive behavior. To evaluate VX2 nasopharyngeal transplantation tumor metastasis, squamous cell carcinoma sections were stained with H&E and analyzed by using light microscopy. Observation of H&E-staining under a 100× microscope clearly demonstrated the tumor invasion in posterior pharyngeal wall and inflammatory cell infiltration in the necrotic zone. Poorly differentiated squamous cell carcinoma was found in orthotopic NPC, its cervical lymph nodes, metastatic lesions of brain and lung by H&E staining. Deformation of the cell structure and liquefaction necrosis in the GTVp area is the remarkable histological finding (Fig. 3). As the Fig. 3A has shown, VX2 nasopharyngeal tumor poorly differentiated in squamous cell carcinoma structure with intensely stained nuclei, increased cell density, and some cells revealed pathological mitosis. By considering both viables and necrotic tumor tissues, the parapharyngeal space (10/10), clivus (6/10), and oropharynx (1/10) are among the most disoriented and depolarized structural. We found that the cervical lymph node metastasis is the most common metastasis pattern, with more than 60% of the rabbits (6/10; Fig. 3B). Moreover, 2 rabbits were confirmed with pulmonary metastasis (20%, Fig. 3C).
Microscopic pathological image of VX2 nasopharyngeal transplantation tumor metastasis (original magnification: ×400). (A). H&E-stained of poorly differentiated squamous cell carcinoma. (B). Representative image of lymph node metastasis, (C). Representative image of pulmonary metastasis in VX2 nasopharyngeal transplantation tumor model. Microscopic pathology showed that tumor invasion exceeded the GTV visible to the naked eye and the tumor extent shown on the map (The curved arrow indicates the area of CTVP). The infiltrations of leukocytes and destroyed clivus cell were observed around the vessels (arrow pointed) as well.
Relationship between pathological GTV and imaging techniques GTV
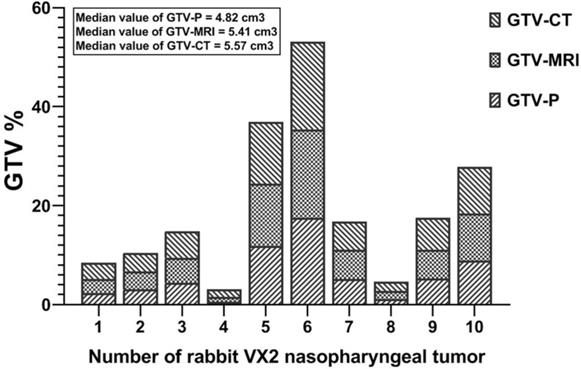
The mean value of GTVp with GTV of MRI (GTVMRI) and CT (GTVCT) imaging are compared in Fig. 4. In details, three rabbit had upper GTV NPC (Case No: 5, 6, and 10), three had middle GTV NPC (Case No: 3, 7, and 9), and four had lower GTV disease (Case No: 1, 2, 4, and 8). The GTVP major ranged from 0.54 to 17.49 cm3 in the 10 rabbit NPC with VX2 tumor and the mean was 6.04 ± 5.04 cm3. Importantly, the GTVMRI and GTVCT showed an increasee in the GTV area; 1.12-fold increasing for GTVMRI and 1.15-fold increasing for GTVCT. The mean value of the GTVCT was 6.77 ± 4.86 cm3; ranged 1.49-17.74 cm3. In GTVMRI images the major value ranged from 1.02-17.91 cm3 and the mean was 6.56 ± 5.04 cm3 (Fig. 4).
Comparison of pathological GTV (GTVp) and GTV of MRI (GTVMRI) and CT (GTVCT) in 10- VX2 nasopharyngeal transplantation rabbit.
Comparison of the 18F-FLT and 18F-FDG uptakes in tumor-bearing rabbits
Table 1 compares the maximal uptake volumes of the 18F-FLT and 18F-FDG created as well as the results of the statistical comparison in the VX2 NPC rabbit. All rabbits with nasopharyngeal mass (n = 10) significantly increased the 18F-FLT and 18F-FDG uptake (P < 0.05). The SUVmax of the FDG was significantly higher than that of FLT (P = 0.004). According to Table 1, SUVmax of the 18F-FDG PET/CT and 18F-FLT PET/CT were 8.22 ± 4.95 (3.27-11.06) and 0.66 ± 0.57 (0.27-1.23), respectively. Furthermore, SUVmin of the FDG was also significantly higher than FLT (3.43 ± 1.70 vs. 0.20 ± 0.16; P = 0.011). Consequently, FLT uptake in regional lymph nodes of NPC is significantly lower than FDG uptake. As shown in Table 1, the pooled specificity was higher in the 18F-FDG PET/CT compared with the 18F-FLT PET/CT (0.769 versus 0.847). The diagnostic sensitivity of both 18F-FLT PET/CT and 18F-FDG PET/CT were 100% (10/10). Meanwhile, the highest sensitivity and specificity of the 18F-FLT PET/CT suggested that the FLT based PET/CT is more accurate and visualized in NPC diagnosis.
The comparison of uptake value between 18F-FLT and 18F-FDG PET/CT in rabbit VX2 NPC model.
| P-value | 18F-FLT | 18F-FDG | Parameters |
|---|---|---|---|
| 0.004 | 0.66 ± 0.57 (0.27-1.23) | 8.22 ± 4.95 (3.27-11.06) | ΣSUVmax |
| 0.011 | 0.20 ± 0.16 (0.04-0.35) | 3.43 ± 1.70 (2.13-5.13) | ΣSUVmin |
| 0.007 | 0.61 ± 0.15 (0.25-0.76) | 6.18 ± 1.25 (3.14-7.38) | ΣSUVmean |
| - | 100 | 100 | Sensitivity (%) |
| 0.062 | 84.7 | 76.9 | Specificity (%) |
Abbreviations: 18F-FLT, 18F-Fluorothymidine; 18F-FDG, 18F-Fluorodeoxyglucose; SUV, standard uptake values; -, not available. 10 VX2 nasopharyngeal transplantation rabbits in each group. All data expressed as mean ± SD.
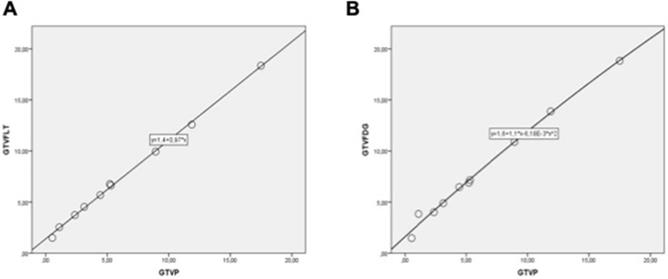
Pooled correlation coefficients between GTVP and imaging techniques (GTVFDG and GTVFLT) are shown in the Fig. 5. Despite of the small size of each sample, we found that the GTVP ratios were strikingly correlated with the GTVFLT (R = 0.902, P = 0.007; Fig. 5A) and GTVFDG (R = 0.892, P = 0.005; Fig. 5B) in 10-VX2 nasopharyngeal transplantation rabbit, regardless of the different acquisition times. Totally, the significant correlation between the GTVp with PET/CT imaging suggested the effective validity of PET/CT techniques for variety of different type of tumors. Conversely, due to the small size of cases, this result must be considered with restraint.
Pooled correlation between GTVp & GTVFLT (A) and GTVp & GTVFDG (B). Data indicate positive associations in phantom models with the Spearman's rank correlation coefficients. The mean of GTV is reported in the cm3. Each circles represents one VX2 nasopharyngeal transplantation rabbit (n = 10).
The optimal SUV threshold of 18F-FDG PET/CT and 18F-FLT PET/CT images for target volume delineation
In order to identify the optimal SUV threshold of the 18F-FDG PET/CT and 18F-FLT PET/CT, different threshold values of GTVFLT and GTVFDG at different SUV were compared with the GTVp, as a standard GTV (Table 2).
Different SUV threshold of 18F-FDG PET/CT and 18F-FLT PET/CT images for target volume delineation.
| Mean ± SD | Median | Min | Max | P-value | ||
|---|---|---|---|---|---|---|
| GTVp | - | 6.04±5.04 | 4.82 | 0.54 | 17.49 | - |
| GTVFDG | FDG 2.0 | 7.83±4.99 | 6.68 | 1.47 | 18.82 | 0.005 |
| FDG 2.5 | 7.56±5.06 | 6.43 | 1.24 | 18.77 | 0.005 | |
| FDG 3.0 | 7.01±5.09 | 5.75 | 1.19 | 18.53 | 0.005 | |
| FDG 3.5 | 6.50±5.04 | 5.29 | 0.87 | 17.86 | 0.005 | |
| FDG 4.0 | 6.10±5.05 | 4.81 | 0.66 | 17.59 | 0.059 | |
| FDG 20% | 7.92±4.93 | 6.61 | 1.87 | 18.72 | 0.005 | |
| FDG 25% | 7.46±5.03 | 6.29 | 1.53 | 18.58 | 0.005 | |
| FDG 30% | 7.08±5.07 | 5.84 | 1.14 | 18.35 | 0.005 | |
| FDG 35% | 6.55±5.10 | 5.27 | 0.87 | 17.72 | 0.005 | |
| FDG 40% | 6.11±5.05 | 4.78 | 0.67 | 17.59 | 0.047 | |
| FDG 45% | 6.09±5.04 | 4.79 | 0.66 | 17.56 | 0.074 | |
| FDG 50% | 5.92±5.02 | 4.44 | 0.61 | 17.34 | 0.059 | |
| GTVFLT | FLT 0.3 | 7.23±4.87 | 6.16 | 1.50 | 18.35 | 0.005 |
| FLT 0.4 | 6.87±4.95 | 5.73 | 1.25 | 18.22 | 0.005 | |
| FLT 0.5 | 6.46±4.96 | 5.36 | 0.88 | 17.84 | 0.005 | |
| FLT 0.6 | 6.05±5.04 | 4.85 | 0.52 | 17.52 | 0.169 | |
| FLT 0.7 | 5.59±5.06 | 4.50 | 0.48 | 17.14 | 0.005 | |
| FLT 50% | 6.58±5.08 | 5.27 | 1.00 | 17.90 | 0.005 | |
| FLT 55% | 6.10±5.00 | 4.91 | 0.52 | 17.33 | 0.241 | |
| FLT 60% | 6.07±4.99 | 4.88 | 0.52 | 17.32 | 0.359 | |
| FLT 65% | 5.66±4.98 | 4.62 | 0.50 | 16.97 | 0.005 | |
| FLT 70% | 5.38±4.97 | 4.19 | 0.44 | 16.76 | 0.005 | |
| FLT 75% | 5.12±4.90 | 3.93 | 0.44 | 16.32 | 0.005 | |
| FLT 80% | 4.92±4.92 | 3.70 | 0.33 | 16.31 | 0.005 |
Abbreviations: 18F-FLT, 18F-Fluorothymidine; 18F-FDG, 18F-Fluorodeoxyglucose; SUV, standard uptake values. All data expressed as mean ± SD (range). The underlined threshold was selected to the future assay, as a best-matched- delineation target of 18F-FLT and 18F-FDG with GTVP. The p-value is measured in compare with the pathological GTV.
According to the Table 2, there are differences between the created GTVs. While the differences between GTVFLT vs. GTVP and GTVFDG vs. GTVP appear to be larger, all the other differences were equal to or smaller than the spatial resolution of the GTVP system (P < 0.05). The GTVFLT0.6, GTVFLT55%, and GTVFLT60% were chosen to be compared with the GTVp, due to having more similarity to the GTVp than the other GTVs (P > 0.05). In other words, the difference between GTVFLT0.6, GTVFLT55%, and GTVFLT60% with the GTVp was not statistically significant either (Figure S1). However, the GTVFLT60% was closer to GTVp, accordingly the 60% of the SUVmax was assumed as the optimal SUV threshold for the 18F-FLT PET/CT images to delineate the target volume of NPC (P = 0.36). In addition, the GTVs delineated on the 18F-FDG PET/CT in different threshold values are compared with GTVp in Figure S2. According the 18F-FDG PET/CT results; we found just three GTVFDG are not significantly different from the GTVp; GTVFDG4.0, GTVFDG45%, and GTVFDG50% (P > 0.05). Nevertheless, the GTVFDG45% was much closer to GTVp, suggesting that 45% of the SUVmax could be used as the optimal SUV threshold for 18F-FDG PET/CT images in the delineation of the NPC target volume (P = 0.074).
Comparison of MRI, CT, 18F-FDG PET/CT and 18F-FLT PET/CT in target volume delineation
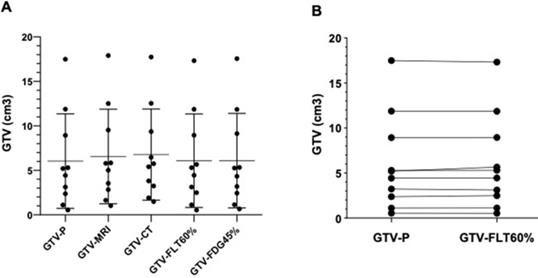
Here, we compared the GTVFDG45%, GTVFLT60%, GTVMRI, and GTVCT with GTVp as a standard GTV (Fig. 6A). These comparisons showed no difference in the GTVFDG45% (6.09 ± 5.04 cm3) and GTVFLT60% (6.07 ± 4.99 cm3) in comparison with GTVp (6.04 ± 5.04 cm3; P = 0.103). These findinges are in line with the relationship between GTVP and other imaging, GTVCT and GTVMRI (see the Fig. 4). In total, these results clearly showed that the PET/CT images were more suitable to delineate the target volume of NPC than the CT and/or MRI images. Furthermore, the difference between GTVFDG45% and GTVFLT60% was not statistically significant (P > 0.05). There was a cloth similarity between GTV numbers, measured in the 18F-FLT PET/CT images, and the pathology samples (mean number of GTVFLT60% 6.078 cm3 vs 6.047 cm3 GTVp, P = 0.989, Fig. 6B). However, this similarity was predominately attributed in samples with very high GTV (> 7 cm3 GTV in both specimen of pathology and 18F-FLT PET/CT). In total, the GTVFLT60% was the closest to the GTVp, suggesting that the 18F-FLT PET/CT images were more useful in target volume delineation of the NPC imaging.
(A). Frequencies of the pathological GTV in comparison with different imaging methods: GTVCT, GTVMRI,GTVFDG, and GTVFLT. (B). Case-by-case comparison between 18F-FLT PET/CT images and pathology methods. The GTVFDG45% and GTVFLT60% segments are selected based on optimal SUV threshold values on 18F-FLT PET/CT and 18F-FDG PET/CT images. Data are representative charts or the percentages of an individual animal. The lines indicate median values for each group.
Discussion
To the best of our knowledge, this is the first report that evaluated accurate tumor volume delineation for the intrinsic character of PET/CT images in the NPC. In this investigation, we tried to determine the best imaging method for delineating the GTV of NPC. These findings indicate that a combination imaging of the PET and CT approach could potentially monitor metastasis in advanced NPC. Notably, our finding shows that GTVFDG45% and GTVFLT60% were a more effective and reasonable threshold value of 18F-FDG PET/CT and 18F-FLT PET/CT for target volume delineation in the VX2 nasopharyngeal transplantation tumor models. Furthermore, distribution of the GTVFLT60% in GTVP suggested that the 18F-FLT PET/CT images were more useful in target volume delineation of the NPC imaging. We established a rabbit VX2 nasopharyngeal transplantation model to replicate human NPC. New Zealand rabbits were relatively large in volume, easy to inoculate by puncturing and to perform experimental observations. We found that the tumors grew rapidly in the rabbit model, and gradually invaded the surrounding tissue; including parapharyngeal space, oropharynx, nasal cavity, and etc. Accordingly, the rabbit VX2 nasopharyngeal tumor model can simulate the whole process of the development of human NPC and provides a reasonable animal model for the follow-up experiments in target volume delineation.
Currently, radiotherapy has been widely accepted as a first-line and standard treatment for advanced NPC, by providing the superior dose of distributions and the better tolerated on NPC patients [25-27]. The more precise the radiation technique becomes the more rigid the requirements are to precisely delineate the tumor. However, the target volume of NPC is so irregular, and the ccurate delineation of target areas is a prerequisite for precise radiotherapy plan. Thus, the delineation of the target volume is the key factor to determine the therapeutic effect as well as the reduction of the side effects of radiotherapy [28-30]. The 18F-FDG, which reflects the of malignancy degree of the cells by glucose metabolism, is an acceptable imaging agent in clinical applications. However, the results are not accurate in FDG imaging, duo to the susceptible physiological activities of the body and also the activity of the lesion.
The 18F-FLT is a kind of thymine isomers, which is transported into cells by Na+ dependent, facilitates the diffusion and passive diffusion. The 18F-FLT PET/CT can show the proliferative activity of malignant tumors; so 18F-FLT imaging is more specifically than the 18F-FDG [29, 30].
Recently findings emphasize that the accuracy of the 18F-FLT PET/CT in distinguishing the tumor lesions and inflammatory is better than 18F-FDG PET/CT. In radiotherapy, the uptake of FLT is related to the proliferating cell nuclear antigen; thus the FLT can evaluate the efficacy of radiotherapy; so, this has more sensitive than FDG [31, 32].
Many semi-quantitative methods are widely used to define the threshold range of the SUV in the PET/CT image [14, 33, 34]. Nevertheless, whether it is 18F-FDG or 18F-FLT PET-CT, the suitable SUV range to delineate the target volume has not yet been clearly defined [35]. Enhanced CT, MRI, 18F-FDG PET/CT, and 18F-FLT PET/CT were separately used to scan the rabbit VX2 nasopharyngeal transplantation tumor model. GTVFDG and GTVFLT under the different setting conditions were delineated in the area of interest on the PET/CT images to compare them with GTVp, GTVMRI, and GTVCT [35]. We found that the optimal SUV thresholds of the 18F-FDG PET/CT and 18F-FLT PET/CT were 45% SUVmax and 60% SUVmax, respectively. Both of them are closer to the GTVp than the GTVMRI and GTVCT. Both the CT and MRI methods are the first imaging choice for the staging of nasopharyngeal carcinoma [34, 36, 37]. The results of many studies show that diagenetic accuracy of CT and MRI are equal in the detection of abdominal lymph node metastasis, intraluminal mass and pericardial effusion [38, 39]. Our finsdings clearly show that both the CT and MRI were large to estimate the size of the lesion, which was consistent with previous findings by Chen et al., (2013) [40]. The present investigation results indicated that there was no significant difference between the GTVFDG45% and GTVFLT60% compared with the GTVp; thus 18F-FDG PET/CT and 18F-FLT PET/CT could both be useful tools for nasopharyngeal tumor target volume delineation under the optimal threshold setting. However, compared with the two methods, 18F-FLT PET/CT is more suitable to reflect the real tumor boundaries, avoiding the delineation of the target area involved in normal tissue, which could help in developing more accurate radiotherapy plans [41, 42]. In this study, we found that the SUVmax and SUVmin of 18F-FLT PET/CT are significantly lower than the SUVmax and SUVmin of 18F-FDG PET/CT, which is consistent with the results of previous studies (Table 1) [43]. These finding are in line with the results by study conducted by Shi et al. (2017) who used the 78% approach for GTV delineation potential to predict tumor regression in NPC patients [21]. The preliminary results of that group reported that parameters of both FDG and FLT PET had medium to strong correlation with NPC tumor response after chemo-radiotherapy; thus this finding avoids the problem of incongruent imaging of tumor motion [21] .
It is accepted that VX2 transplantation rabbits with large and inhomogeneous tumors might be helpful in studies of dose escalation [44]. A possible reason for such results is that the demand of tumor cell in the process of proliferation for thymidine is far lower than the glucose. Moreover, the level of thymine in animal serum is higher than that of human, and endogenous thymine can compete with FLT, as the FLT uptake in animals is lower than that of human beings.
Also, the results of our study suggested a better daignotsis and prognostic value of 18F-FLT than that in 18F-FDG, with a sensitivity of 100% and specificity of 84.7%. Highest sensitivity and specificity validated FLT as a promising PET radiopharmaceutical for early diagnosis, imaging proliferation, and monitoring tumor response of NPC [45]. In this line, Hoshikawa et al., (2011) and Chen et al., (2005) confirmed that the uptake of 18F-FLT in tumor tissue is lower than 18F-FDG, its sensitivity and specificity is much higher than that of 18F-FDG [46, 47].
Although the SUV uptake of 18F-FLT PET/CT is low in our study, the image contrast is high enough to provide a "clean" display of tumor. It has been widely accepted that the brain uptake of 18F-FLT is low. Consequently, high T/N is beneficial for brain tumor imaging [32, 48]. Although the focus of our study is on nasopharyngeal carcinoma, the low 18F-FLT uptake of brain tissue can provide a "clean" display of the background. Tumor tissue and normal brain tissue both have higher rates of glucose metabolism, which can result in unclear demarcation and difficult recognition in the two tissues in FDG PET. In general, FLT imaging can non-invasively reflect tumor proliferation at the molecular level. Additionally, it can distinguish inflammation from cancer, has higher tumor specificity than FDG, and can help in the differential diagnosis of tumor and anti-proliferative treatment efficacy evaluation and prognosis.
We should point out that there are some limitations in this investigation, to reflect whether the integration of FLT PET/CT into radiopharmaceutical of NPC can improve the treatment outcomes or not. Our study limitation includes the small sample size, different grading, and staging of the animal model. It is clear that tracers administered, time, and reconstruction algorithm needs to evaluate for standardization of a cutoff SUV on FLT PET/CT radiotherapy. As another limitation of the present study, the future learning needs to optimize the best SUV threshold of PET/CT with other pathology characterization of human NPC tumors, such as biological characteristic, tumor size, and motions of the lower esophagus. Thus, further researches with more human samples are needed to clarify the validity of our findings in the comprehensive clinical study.
Conclusions
In conclusion, our study founds SUVmax cutoff of 45% on 18F-FDG PET/CT and SUVmax cutoff of 60% on 18F-FLT PET/CT as the closest estimation of GTV length for the target volume delineation in the NPC. Furthermore, 18F-FLT PET/CT by virtue of its ability to reflect the activity of cell proliferation, can use for the accrue delineation of the target area in the NPC. Our studies indicate that 18F-FLT PET/CT may be a promising imaging modality in the diagnosis and treatment of NPC.
Abbreviations
NPC: Nasopharyngeal carcinoma; SEER: Surveillance, epidemiology, and end results; MRI: Magnetic resonance imaging; CT: Computed tomography; PET: Positron emission tomography; GTV: Gross tumor volume; 18F-FLT: 18F-Fluorothymidine; 18F-FDG: 18F-Fluorodeoxyglucose; NIH: National Institutes of Health; SUV: Standardized uptake value; SD: Std. deviation.
Supplementary Material
Supplementary figures.
Acknowledgements
We thank all the colleagues at Southwest Medical University who provided their assistance for this paper. We also thank the anonymous referee for his/her helpful comments, which remarkably improved the quality of this paper.
Ethics Committee Approval and Patient Consent
This study was approved by an Independent Ethics Committee/institutional Review Board at Department of Oncology, Affiliated Hospital of Southwest Medical University, Luzhou, Sichuan, China (No. 201302-06). All animal-related procedures and protocol were approved under the guidelines of the National Institutes of Health (NIH) Animal Care (1995, USA) and the local Ethics Committee guidelines by Institutional Animal Care and Treatment Committee of Southwest Medical University (Luzhou, China).
Authors' contributions
Y.H. and QL.W. were in charge of the idea and designed the study. ZQ.X. and RL.D. were searched and collocated the basic information. HW.P. and Y.C. performed the PET/CT imaging. F.X., WF.H., and SZ.F. were performed the pathology section. S.I. wrote the manuscript and was in charge of language revision. All authors reviewed the manuscript.
Funding
This work was funded by grants of the major project of the Affiliated Hospital of Southwest Medical University, project number 2013-60.
Competing Interests
The authors have declared that no competing interest exists.
References
1. Huang D. Epidemiology of nasopharyngeal carcinoma. Ear Nose Throat J. 1990;69:222-5
2. Chang E, Adami H. The enigmatic epidemiology of nasopharyngeal carcinoma. Cancer Epidemiol Biomarkers Prev. 2006;15:1765-77
3. Popovtzer A, Ibrahim M, Tatro D. et al. MRI to delineate the gross tumor volume of nasopharyngeal cancers: which sequences and planes should be used? Radiol Oncol. 2014;48:323-30
4. Dong J, Tian L, Li S. et al. Differences in extension patterns between adenoid cystic carcinoma of the nasopharynx and nasopharyngeal carcinoma on MRI. Int J Clin Exp Pathol. 2015;8:15960-8
5. Zong J, Lin S, Chen Y. et al. Does MRI-detected cranial nerve involvement affect the prognosis of locally advanced nasopharyngeal carcinoma treated with intensity modulated radiotherapy? PLoS One. 2014;9:e100571
6. Abdel KARA, King A. MRI and CT of nasopharyngeal carcinoma. Ajr American Journal of Roentgenology. 2012;198:11-8
7. Cui C, Liu X. Magnetic resonance imaging of retropharyngeal lymphadenopathy in nasopharyngeal carcinoma. Chin J Clin Oncol. 2007;4:42-7
8. Han D, Yu J, Zhong X. et al. Comparison of the diagnostic value of 3-deoxy-3-18F-fluorothymidine and 18F-fluorodeoxyglucose positron emission tomography/computed tomography in the assessment of regional lymph node in thoracic esophageal squamous cell carcinoma: a pilot study. Dis Esophagus. 2012;25:416-26
9. Chin S, Lin C, Huang B. et al. Pretreatment dynamic contrast-enhanced MRI improves prediction of early distant metastases in patients with nasopharyngeal carcinoma. Medicine (Baltimore). 2016;95:e2567
10. Chu L, Tsai H, Wang H. et al. Posttreatment FDG PET/CT in predicting survival of patients with ovarian carcinoma. Eur J Nucl Med Mol Imaging. 2016;6:42
11. Bird T, Barrington S, Thavaraj S. et al. (18)F-FDG PET/CT to assess response and guide risk-stratified follow-up after chemoradiotherapy for oropharyngeal squamous cell carcinoma. Eur J Nucl Med Mol Imaging. 2016;43:1239-47
12. Teixeira S, Rebolleda J, Koolen B. et al. Evaluation of a hanging-breast PET System for primary tumor visualization in patients with stage I-III breast cancer: comparison with standard PET/CT. AJR Am J Roentgenol. 2016;206:1307-14
13. Lee J, Lee S, Yun M. et al. Prognostic value of volumetric parameters on staging and posttreatment FDG PET/CT in patients with stage IV non-small cell lung cancer. Clin Nucl Med. 2016;41:347-53
14. Subesinghe M, Scarsbrook A, Sourbron S. et al. Alterations in anatomic and functional imaging parameters with repeated FDG PET-CT and MRI during radiotherapy for head and neck cancer: a pilot study. BMC Cancer. 2015;15:137
15. Sun X, Su S, Chen C. et al. Long-term outcomes of intensity-modulated radiotherapy for 868 patients with nasopharyngeal carcinoma: an analysis of survival and treatment toxicities. Radiother Oncol. 2014;110:398-403
16. Wang Y, Hsieh T, Yu C. et al. The clinical application of 4D 18F-FDG PET/CT on gross tumor volume delineation for radiotherapy planning in esophageal squamous cell cancer. J Radiat Res. 2012;53:594-600
17. Liu J, Li C, Hu M. et al. Exploring spatial overlap of high-uptake regions derived from dual tracer positron emission tomography-computer tomography imaging using 18F-fluorodeoxyglucose and 18F-fluorodeoxythymidine in nonsmall cell lung cancer patients: a prospective pilot study. Medicine (Baltimore). 2015;94:e678
18. Lee A, Ng W, Pan J. et al. International guideline for the delineation of the clinical target volumes (CTV) for nasopharyngeal carcinoma. Radiother Oncol. 2018;126:25-36
19. Ng W, Lee M, Chang A. et al. The impact of dosimetric inadequacy on treatment outcome of nasopharyngeal carcinoma with IMRT. Oral Oncol. 2014;50:506-12
20. Haberer G, Touboul E, Huguet F. Intensity modulated radiation therapy in nasopharyngeal carcinoma. Eur Ann Otorhinolaryngol Head Neck Dis. 2015;132:147-51
21. Qi S, Zhongyi Y, Yingjian Z. et al. (18)F-FLT and (18)F-FDG PET/CT in predicting response to chemoradiotherapy in nasopharyngeal carcinoma: preliminary results. Sci Rep. 2017;7:40552
22. Wang C, Zhou Y, Bai J. et al. Application of volumetric modulated arc therapy and simultaneous integrated boost techniques to prepare "safe margin" in the rabbit VX2 limb tumor model. Med Sci Monit. 2015;21:2397-405
23. Sun C, Li C, Yu J. et al. Comparison of 64-slice CT perfusion imaging with contrast-enhanced CT for evaluating the target volume for three-dimensional conformal radiotherapy in the rabbit VX2 brain tumor model. J Radiat Res. 2012;53:454-61
24. Weber W, Grosu A, Czernin J. Technology Insight: advances in molecular imaging and an appraisal of PET/CT scanning. Nat Clin Pract Oncol. 2008;5:160-70
25. Peng H, Chen L, Zhang Y. et al. The tumour response to induction chemotherapy has prognostic value for long-term survival outcomes after intensity-modulated radiation therapy in nasopharyngeal carcinoma. Sci Rep. 2016;6:24835
26. Zhang B, Mo Z, Du W. et al. Intensity-modulated radiation therapy versus 2D-RT or 3D-CRT for the treatment of nasopharyngeal carcinoma: A systematic review and meta-analysis. Oral Oncol. 2015;51:1041-6
27. Lewis G, Holliday E, Kocak-Uzel E. et al. Intensity-modulated proton therapy for nasopharyngeal carcinoma: Decreased radiation dose to normal structures and encouraging clinical outcomes. Head Neck. 2016;38:E1886-95
28. Al-Ibraheem A, Buck A, Krause B. et al. Clinical applications of FDG PET and PET/CT in head and neck cancer. J Oncol. 2009;2009:208725-42
29. Chalkidou A, Landau D, Odell E. et al. Correlation between Ki-67 immunohistochemistry and 18F-fluorothymidine uptake in patients with cancer: A systematic review and meta-analysis. Eur J Cancer. 2012;48:3499-513
30. Wang H, Liu B, Tian J. et al. Evaluation of 18F-FDG and 18F-FLT for monitoring therapeutic responses of colorectal cancer cells to radiotherapy. EUR Radiol. 2013;82:e484-91
31. Yue J, Yu J, Cabrera A. et al. Measuring tumor cell proliferation with 18F-FLT PET during radiotherapy of esophageal squamous cell carcinoma: a pilot clinical study. J Nucl Med. 2010;51:528-34
32. Franco P, Fiandra C, Arcadipane F. et al. Incorporating (18)FDG-PET-defined pelvic active bone marrow in the automatic treatment planning process of anal cancer patients undergoing chemo-radiation. BMC Cancer. 2017;17:710
33. Han D, Yu J, Yu Y. et al. Comparison of 18F-Fluorothymidine and 18F-Fluorodeoxyglucose PET/CT in delineating gross tumor volume by optimal threshold in patients with squamous cell carcinoma of thoracic esophagus. Int J Radiat Oncol Biol Phys. 2009;76:1235-41
34. Malik V, Harmon M, Johnston C. et al. Whole body MRI in the staging of esophageal cancer-a prospective comparison with whole body 18F-FDG PET-CT. Dig Surg. 2015;32:397-408
35. Jensen M, Erichsen K, Johnbeck C. et al. [18F]FDG and [18F]FLT positron emission tomography imaging following treatment with belinostat in human ovary cancer xenografts in mice. BMC Cancer. 2013;13:168
36. Qiu B, Wang D, Yang H. et al. Combined modalities of magnetic resonance imaging, endoscopy and computed tomography in the evaluation of tumor responses to definitive chemoradiotherapy in esophageal squamous cell carcinoma. Radiother Oncol. 2016;121:239-45
37. Kantarci M, Polat P, Alper F. et al. Comparison of CT and MRI for the diagnosis recurrent esophageal carcinoma after operation. Dis Esophagus. 2004;17:32-7
38. Halvorsen R, Magruder-Habib J, Foster W. et al. Esophageal cancer staging by CT: long-term follow-up study. Radio. 1987;161:376-52
39. Wu Z, Deng X, Zeng R. et al. Using CT or MRI to assess locoregional spread to determine the radiotherapy target of hypopharyngeal carcinoma. Asia Pac J Clin Oncol. 2014;10:e21-7
40. Chen H, Hou Y, Ma X. et al. CT and MRI in target delineation in primary hepatocellular carcinoma. Cancer Radiother. 2013;17:750-4
41. Ciernik I, Dizendorf E, Baumert B. et al. Radiation treatment planning with an integrated positron emission and computer tomography (PET/CT): a feasibility study. Int J Radiat Oncol Biol Phys. 2003;57:853-63
42. Guo Y, Li J, Zhang P. et al. Comparative evaluation of target volumes defined by deformable and rigid registration of diagnostic PET/CT to planning CT in primary esophageal cancer. Medicine (Baltimore). 2017;96:e5528
43. Westreenen H, Cobben D, Jager P. et al. Comparison of F-18-FLT PET and F-18-FDG PET in esophageal cancer. J Nucl Med. 2005;46:400-4
44. Rosenzweig K, Amols H, Ling C. New radiotherapy technologies. Semin Surg Oncol. 2003;21:190-5
45. Nakajo M, Kajiya Y, Jinguji M. et al. Current clinical status of (18)F-FLT PET or PET/CT in digestive and abdominal organ oncology. Abdom Radiol (NY). 2017;42:951-61
46. Hoshikawa H, Nishiyama Y, Kishino T. et al. Comparison of FLT-PET and FDG-PET for visualization of head and neck squamous cell cancers. Mol Imaging Biol. 2011;13:172-7
47. Chen W, Cloughesy T, Kamdar N. et al. Imaging proliferation in brain tumors with 18F-FLT PET: comparison with 18F-FDG. J Nucl Med. 2005;46:945-52
48. Miyake K, Shinomiya A, Okada M. et al. Usefulness of FDG, MET and FLT-PET studies for the management of human gliomas. J Biomed Biotechnol. 2012;2012:205818
Author contact
![]() Corresponding author: Qing-Lian Wen, M.D., Ph.D., Department of Oncology, The Affiliated Hospital of Southwest Medical University. Address: No.25, Tai Ping Street, Luzhou, Sichuan, 646000, PR China. Phone: +86-13518388130; E-mail address: wql73115com.
Corresponding author: Qing-Lian Wen, M.D., Ph.D., Department of Oncology, The Affiliated Hospital of Southwest Medical University. Address: No.25, Tai Ping Street, Luzhou, Sichuan, 646000, PR China. Phone: +86-13518388130; E-mail address: wql73115com.