Impact Factor ISSN: 1837-9664

 Global reach, higher impact
J Cancer 2020; 11(7):1712-1726. doi:10.7150/jca.38379 This issue Cite
Research Paper
The Identification of Key Gene Expression Signature and Biological Pathways in Metastatic Renal Cell Carcinoma
Lin Bao1*, Ye Zhao3*, ChenChen Liu1*, Qi Cao1, Yu Huang1, Ke Chen1 ![]() , Zhengshuai Song2
, Zhengshuai Song2 ![]()
1. Department of Urology, Union Hospital, Tongji Medical College, Huazhong University of Science and Technology, Wuhan 430022, China.
2. Department of Urology, The Central Hospital of Wuhan, Tongji Medical College, Huazhong University of Science and Technology.
3. Cancer Center, Union Hospital, Tongji Medical College, Huazhong University of Science and Technology, Wuhan 430022, China.
* These authors contributed equally.
Received 2019-7-13; Accepted 2019-12-2; Published 2020-1-16
Abstract
Purpose: To investigate the potential mechanisms contributing to metastasis of clear cell renal cell carcinoma (ccRCC), screen the hub genes, associated pathways of metastatic ccRCC and identify potential biomarkers.
Methods: The ccRCC metastasis gene expression profile GSE47352 was employed to analyze the differentially expressed genes (DEGs). DAVID was performed to assess Gene ontology (GO) and the Kyoto Encyclopedia of Genes and Genomes (KEGG) analyses. The protein-protein interaction (PPI) network and modules were constructed. The function pathway, prognostic and diagnostic analysis of these hub genes was picked out to estimate their potential effects on metastasis of ccRCC.
Results: A total of 873 DEGs were identified (503 upregulated genes and 370 downregulated genes). Meanwhile, top 20 hub genes were displayed. GO analysis showed that the top 20 hub genes were enriched in regulation of phosphatidylinositol 3-kinase signaling, positive regulation of DNA replication, protein autophosphorylation, protein tyrosine kinase activity, etc. KEGG analysis indicated these hub genes were enriched in the Ras signaling pathway, PI3K-Akt signaling pathway, HIF-1 signaling pathway, Pathways in cancer, etc. The GO and KEGG enrichment analyses for the hub genes disclosed important biological features of metastatic ccRCC. PPI network showed the interaction of top 20 hub genes. Gene Set Enrichment Analysis (GSEA) revealed that some of the hub genes was associated with metastasis, epithelial mesenchymal transition (EMT), hypoxia cancer and adipogenesis of ccRCC. Some top hub genes were distinctive and new discoveries compared with that of the existing associated researches.
Conclusions: Our analysis uncovered that changes in signal pathways such as Ras signaling pathway, PI3K-Akt signaling pathway, etc. may be the main signatures of metastatic ccRCC. We identified several candidate biomarkers related with overall survival (OS) and disease-free survival (DFS) of ccRCC patients. Accordingly, they might be novel therapeutic targets and used as potential biomarkers for diagnosis, prognosis of ccRCC.
Keywords: clear cell renal cell carcinoma, metastasis, biomarker, diagnosis, prognosis.
Introduction
Renal cell carcinoma (RCC) is one of the most frequently malignant tumors in the urinary system. Renal cell carcinomas (RCC) contribute to an evaluated 338,000 new cancer diagnoses and 144,000 tumors related deaths in 2012[1]. Although the pathological types of RCC are diverse, the clear cell renal cell carcinoma is the most common type [2]. Although the treatment of renal cancer had achieved great results, many patients with advanced stage, especially who with metastatic tumors, still have poor prognosis. Metastasis is the leading cause of cancer death [3]. In this respect, intervention at the point of metastasis will be more valuable than at time when ccRCC has advanced to later stages. Thus, it is highly desirable to effectively estimate ccRCC with increased metastasis risk. Identifying effective biomarkers to better predict the diagnostic and prognostic levels of this malignancy is also of vital importance.
The current exploitation of high-throughput gene microarray to analyze normal and tumor tissue samples from patients confers us an opportunity to detect and explore the comprehensive molecular landscapes of tumors at multiple levels ranging from somatic mutations and copy number alteration at the genome level to gene expression changes at transcriptome level [4-6]. While, the use of microarrays in clinic is greatly restricted because of countless genes detected by gene profiling, lack of independent stability, likewise the complex statistical analyses. Meanwhile experimentally identifying key genes in genome-wide is a waste of time and formidable. To apply these expression profiles in clinical practice as soon as possible, it is necessary to develop an optimal method that could be handled by routine detection. Moreover, there is a clear need to improve our ability to discovery ccRCC patients with high risk of metastasis. The challenge of accurately predicting ccRCC metastasis may be partly attributable to an intricate network of pathways that facilitate the disease development.
In present study, we downloaded GSE47352 from the Gene Expression Omnibus (GEO, http://www.ncbi.nlm.nih.gov/ geo/) and perform the GEO2R online tool to systematically measured the differentially expressed genes (DEGs). Then, we established protein-protein interaction (PPI) network of the DEGs and selected the top 20 hub genes by a high degree of connectivity. Furthermore, the GO and KEGG pathways of the 20 hub genes were explored. Meanwhile, overall survival (OS) and disease-free survival (DFS) analysis of the 20 hub genes were operated based on GEPIA (Gene Expression Profiling Interactive Analysis) database. Some of them not only associated with OS but also DFS. Receiver operating characteristic (ROC) curve analysis of the hub genes with both OS and DFS significance was performed. Several genes could adequately distinguish ccRCC from paired normal tissues with an area under the curve (AUC) of 0.9235-0.9451. After that, genes were selected to further evaluate the mRNA expression in normal and tumor sample tissues by TCGA. Finally, we focused our attention on AURKB, a member of the Aurora kinase subfamily that encoded a serine/threonine kinase, and regulated the arrangement and segregation of chromosomes during mitosis and meiosis by correlating with microtubules. Although some of previous studies displayed that AURKB may play a key role in the tumorigenesis and progression of several types of cancer[7-10], the study of this gene in ccRCC had not been elucidated. To acquire further insight into the function of AURKB, we performed GSEA to map into GO analysis and KEGG pathways database. We also found that the expression of AURKB associated with clinical and pathological characteristics of patients with ccRCC and its expression levels were independent prognostic factors for ccRCC. In conclusion, our study identified 20 hub genes, which may play leading roles in ccRCC progression. Some dispensable biological function pathway in metastatic ccRCC was identified. This study also demonstrated that AURKB may be a novel biomarker for predicting the diagnosis and prognosis, and may be an important target for the treatment of metastatic ccRCC.
Materials and methods
Microarray Data
Gene expression profile of GSE47352 was download from the GEO database, which was a free and open available database. The GSE47352 dataset has a total of 9 samples, containing 5 primary ccRCC samples, 4 metastasis ccRCC tissues, according to agilent GPL570 platform (Affymetrix Human Genome U133 Plus 2.0 Array). It includes genome-wide mRNA expression data of this 9 samples.
Identified genes of differential expression
The DEGs between metastasis and non-metastasis ccRCC samples were analyzed using GEO2R https://www.ncbi.nlm.nih.gov/geo/geo2r/, based on R language, which was an online analysis tool for the GEO database. We defined DEGs as differentially expressed with logFC > 2 (upregulated genes) or logFC < - 2 (downregulated genes), according to the criteria [11, 12]. The P value < 0.05 was considered statistically significant, which was utilized to decrease the false positive rate. Then, 503 upregulated genes and 370 downregulated genes were found, and the top 20 genes with a high degree of connectivity were chose as hub genes.
Gene Ontology and KEGG Pathway Analysis of DEGs
Genes could be annotated by Gene ontology (GO) analysis and their functions were classified by biological pathways, molecular function, as well as cellular components [13]. The Kyoto Encyclopedia of Genes and Genomes (KEGG) is a set of databases that could dispose biological pathways and genomes related to diseases and drugs. KEGG substantially is a channel for the overall and deep understanding of biological systems [14]. The cut-off criterion with statistic difference was P < 0.05. Used the DAVID online database (DAVID, http://david.ncifcrf .gov), cellular components, molecular functions, biological processes, and pathways of DEGs were analyzed.
PPI Network Analysis
The protein-protein interaction (PPI) information, like physical and functional associations, was assessed and integrated by The Search Tool for the Retrieval of Interacting Genes (STRING), an online tool. Until now, STRING version 10.0 has covered a total of 9,643,763 proteins from 2031 organisms [15]. To estimate the interactional correlation of these DEGs, DEGs was first drawn by STRING and then the Cytoscape software was used to construct a PPI network and module. Also, STRING was used to map 20 hub genes according to maximum number of interactors ≤ 5 and confidence score ≥ 0.4. GO and KEGG pathway was also utilized to analysis their potential information.
The Hub Gene Expression Level
In this study, the boxplot was employed to visualize the expression of 2 hub genes in 533 ccRCC samples and 72 normal renal samples from TCGA-KIRC (clear cell renal cell carcinoma) dataset. The Human Protein Atlas (HPA, https://www.proteinatlas.org/) is a Swedish-based project, which was launched in 2003 with the goal to map all human proteins in organs, tissues, cells and using the integration of diverse omics technologies [16]. By acquiring immunohistochemical data of patients with or without ccRCC based on HPA, we further confirmed the expression of the two hub genes.
Survival Analysis of Hub Genes
The overall and disease-free survival information was based on GEPIA database. The hazard ratios (HR) with 95% confidence intervals were calculated and P < 0.05 was regarded as statistically significant.
Gene Set Enrichment Analysis (GSEA)
533 ccRCC samples from TCGA were classed into two groups (high versus low) based on the mRNA expression level of AURKB, and the median expression value was believed to be the cut-off point. To explore the potential mechanism of AURKB, GSEA (http:// software.broadinstitute.org/gsea/index.jsp) was operated between the two groups. We selected annotated gene sets c2.cp.kegg. v5.2.symbols.gmt as the reference gene sets. FDR < 0.05 and gene size ≥ 100 were considered as the cut-off criteria.
Tissue samples and Cell culture
Tissue samples and Cell culture executed as previously described [17].
Transient transfection assay
The siRNA targeting AURKB (siAURKB) and the siRNA negative control (si-NC) were chemosynthetic by GenePharma (Shanghai, China). According to the manufacturer's recommendations, AURKB and si-NC with a final concentration of 50 nM were transfected with Lipofectamine® 2000 (Invitrogen, USA).
Cell migration and invasion assays
Migration and invasion assays were implemented as previously described [17].
Statistical Analysis
The values of each group were shown as the mean ± SD. A difference of P < 0.05 was considered statistically significant. The statistical analysis software performed in this study was GraphPad Prism 6.0 (GraphPad Software, Inc., USA) and SPSS 22.0 (IBM SPSS, Chicago, IL). Unpaired t-test was used to evaluate the statistical difference. And Mann-Whitney test was used to analyze the difference of AURKB expression in the ccRCC subgroups. The receiver operator characteristic (ROC) curve was used to analyze diagnostic values of AURKB in different patients with ccRCC. The association between the AURKB expression level and the OS, DFS rate were computed by the Kaplan-Meier curve and log-rank test.
Results
Screening of DEGs
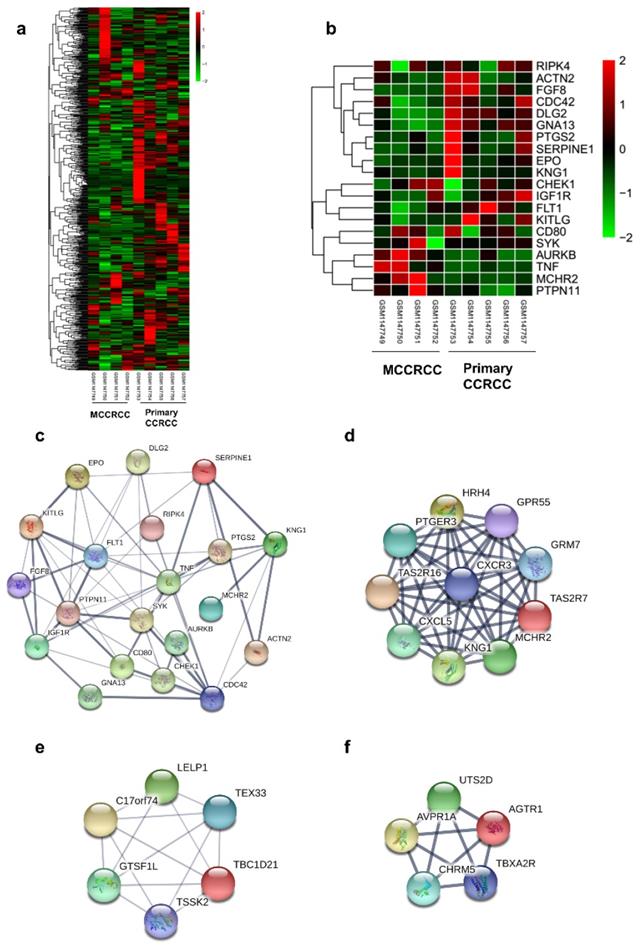
There were 4 metastatic and 5 non-metastatic ccRCC samples in this study. The DEGs were identified by the GEO2R online analysis tool, using P value < 0.05 and |logFC| ≥ 2 as cut-off criteria. A total of 873 DEGs were detected after analyzing GSE47352, 503 of which were upregulated genes while 370 were downregulated (Figure 1a).
Protein-protein interaction network of the top 20 hub genes and modular analysis. (a)The DEGs of GSE47352. (b) The heatmap of 20 hub genes. (c)The PPI network of the top 20 hub genes. (d) module 1 (e) module 2 (f) module 3 of DEGs from PPI network.
Hub Genes Screening from the PPI Network
20 hub genes were identified, according to their degree of connectivity from high to low (Table 1) and the expression of them was presented by the heatmap (Figure 2b). According to the message of the STRING protein query, we built the PPI network of the top 20 hub genes based on the degree of connectivity (Figure 1c). The top 20 hub genes are as follows: RIPK4, TNF, CDC42, KNG1, PTPN11, KITLG, PTGS2, SYK, IGF1R, EPO, SERPINE1, FLT1, AURKB, GNA13, DLG2, ACTN2, CHEK1, FGF8, CD80 and MCHR2. Furthermore, MCODE plugin in Cytoscape was used to identify the top 3 significant modules from the PPI network (Figure 1d-f). Based on GO biological progress analysis, these modules were enriched in inflammatory response, G-protein coupled receptor signaling pathway, positive regulation of cytosolic calcium ion concentration and positive regulation of vasoconstriction (Table 4).
Top 20 hub genes with higher degree of connectivity.
| Gene | Degree of connectivity | Pvalue |
|---|---|---|
| RIPK4 | 52 | 2.11E-02 |
| TNF | 43 | 1.92E-03 |
| CDC42 | 38 | 1.70E-02 |
| KNG1 | 26 | 3.25E-02 |
| PTPN11 | 23 | 3.27E-05 |
| KITLG | 22 | 3.61E-02 |
| PTGS2 | 22 | 4.05E-02 |
| SYK | 22 | 3.12E-02 |
| IGF1R | 20 | 1.00E-02 |
| EPO | 20 | 4.50E-02 |
| SERPINE1 | 17 | 2.64E-02 |
| FLT1 | 17 | 6.29E-03 |
| AURKB | 17 | 6.59E-03 |
| GNA13 | 16 | 1.57E-03 |
| DLG2 | 16 | 8.08E-03 |
| ACTN2 | 16 | 2.87E-02 |
| CHEK1 | 16 | 4.55E-02 |
| FGF8 | 16 | 7.36E-03 |
| CD80 | 15 | 4.21E-02 |
| MCHR2 | 15 | 7.91E-03 |
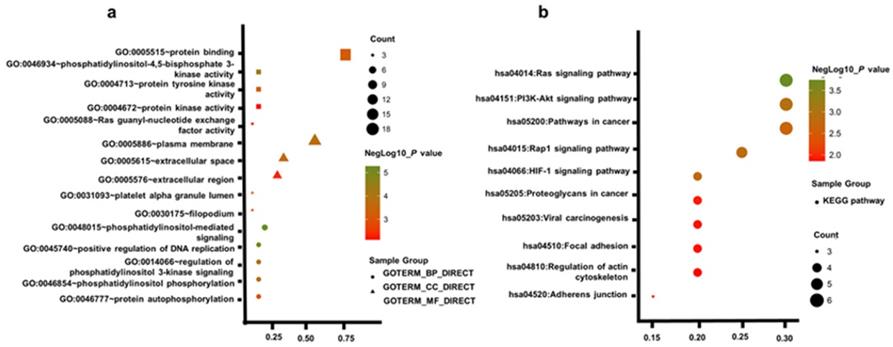
Gene Ontology enrichment analysis and KEGG pathways of top 20 hub genes (a) GO analysis of top 20 hub genes. (b) KEGG pathway of top 20 hub genes.
GO biological progress analysis of Top three significant modules.
| Module | Term | Count | P value | Genes |
|---|---|---|---|---|
| Module1 | GO:0006954~inflammatory response | 5 | 1.66E-05 | KNG1, PTGER3, CXCL5, HRH4, CXCR3 |
| GO:0007186~G-protein coupled receptor signaling pathway | 6 | 2.13E-05 | TAS2R16, PTGER3, CXCL5, GRM7, TAS2R7, CXCR3 | |
| GO:0007204~positive regulation of cytosolic calcium ion concentration | 4 | 2.70E-05 | KNG1, PTGER3, HRH4, CXCR3 | |
| GO:0001580~detection of chemical stimulus involved in sensory perception of bitter taste | 2 | 1.89E-02 | TAS2R16, TAS2R7 | |
| GO:0007200~phospholipase C-activating G-protein coupled receptor signaling pathway | 2 | 3.10E-02 | MCHR2, PTGER3 | |
| Module2 | GO:0007204~positive regulation of cytosolic calcium ion concentration | 3 | 1.89E-04 | AGTR1, AVPR1A, TBXA2R |
| GO:0045907~positive regulation of vasoconstriction | 2 | 5.71E-03 | AVPR1A, TBXA2R | |
| GO:0007186~G-protein coupled receptor signaling pathway | 3 | 8.28E-03 | AGTR1, AVPR1A, TBXA2R | |
| GO:0019722~calcium-mediated signaling | 2 | 9.08E-03 | AGTR1, AVPR1A |
Functional Enrichment Analysis
To acquire a more comprehensive and deep understanding of those chosen hub genes, DAVID was used to analysis GO function and KEGG pathway enrichment. The TOP5 gene ontology categories were shown in Table 1. In biological processes (BP), the hub genes were mainly enriched in phosphatidylinositol-mediated signaling; regulation of phosphatidylinositol 3-kinase signaling; positive regulation of DNA replication; phosphatidylinositol phosphorylation; protein autophosphorylation; And in molecular function (MF), these genes were mainly associated with phosphatidylinositol-4,5-bisphosphate 3-kinase activity, protein tyrosine kinase activity, protein binding, protein kinase activity, Ras guanyl-nucleotide exchange factor activity. In addition, GO cell component (CC) analysis shown that they were principally involving the plasma membrane, extracellular space, platelet alpha granule lumen, filopodium, and extracellular region (Table 2).
Gene ontology analysis of top 20 hub genes associated with ccRCC Metastasis.
| Category | Term | Count | % | P value |
|---|---|---|---|---|
| GOTERM_BP_DIRECT | GO:0048015~phosphatidylinositol-mediated signaling | 5 | 25 | 5.40E-06 |
| GOTERM_BP_DIRECT | GO:0045740~positive regulation of DNA replication | 4 | 20 | 1.37E-05 |
| GOTERM_BP_DIRECT | GO:0014066~regulation of phosphatidylinositol 3-kinase signaling | 4 | 20 | 8.86E-05 |
| GOTERM_BP_DIRECT | GO:0046854~phosphatidylinositol phosphorylation | 4 | 20 | 1.54E-04 |
| GOTERM_BP_DIRECT | GO:0046777~protein autophosphorylation | 4 | 20 | 9.07E-04 |
| GOTERM_CC_DIRECT | GO:0005886~plasma membrane | 13 | 65 | 1.75E-04 |
| GOTERM_CC_DIRECT | GO:0005615~extracellular space | 8 | 40 | 2.71E-04 |
| GOTERM_CC_DIRECT | GO:0031093~platelet alpha granule lumen | 3 | 15 | 1.48E-03 |
| GOTERM_CC_DIRECT | GO:0030175~filopodium | 3 | 15 | 2.45E-03 |
| GOTERM_CC_DIRECT | GO:0005576~extracellular region | 7 | 35 | 4.66E-03 |
| GOTERM_MF_DIRECT | GO:0046934~phosphatidylinositol-4,5-bisphosphate 3-kinase activity | 4 | 20 | 4.38E-05 |
| GOTERM_MF_DIRECT | GO:0004713~protein tyrosine kinase activity | 4 | 20 | 4.22E-04 |
| GOTERM_MF_DIRECT | GO:0005515~protein binding | 18 | 90 | 6.64E-04 |
| GOTERM_MF_DIRECT | GO:0004672~protein kinase activity | 4 | 20 | 7.18E-03 |
| GOTERM_MF_DIRECT | GO:0005088~Ras guanyl-nucleotide exchange factor activity | 3 | 15 | 7.29E-03 |
Table 3 uncovered the most significantly KEGG pathway of the top 20 hub genes. These genes were enriched in Ras signaling pathway, PI3K-Akt signaling pathway, Rap1 signaling pathway, HIF-1 signaling pathway, Pathways in cancer, Proteoglycans in cancer, Adherens junction, Viral carcinogenesis, Focal adhesion, Regulation of actin cytoskeleton. Figure. 2a, b gives a GO and KEGG pathway enrichment plot of these hub genes.
KEGG pathway analysis of top20 hub genes associated with Metastasis ccRCC.
| Term | Count | % | P value |
|---|---|---|---|
| hsa04014:Ras signaling pathway | 6 | 30 | 1.61E-04 |
| hsa04151:PI3K-Akt signaling pathway | 6 | 30 | 1.13E-03 |
| hsa04015:Rap1 signaling pathway | 5 | 25 | 1.44E-03 |
| hsa04066:HIF-1 signaling pathway | 4 | 20 | 1.63E-03 |
| hsa05200:Pathways in cancer | 6 | 30 | 2.03E-03 |
| hsa05205:Proteoglycans in cancer | 4 | 20 | 1.20E-02 |
| hsa04520:Adherens junction | 3 | 15 | 1.28E-02 |
| hsa05203:Viral carcinogenesis | 4 | 20 | 1.29E-02 |
| hsa04510:Focal adhesion | 4 | 20 | 1.30E-02 |
| hsa04810:Regulation of actin cytoskeleton | 4 | 20 | 1.39E-02 |
The Kaplan-Meier survival analysis
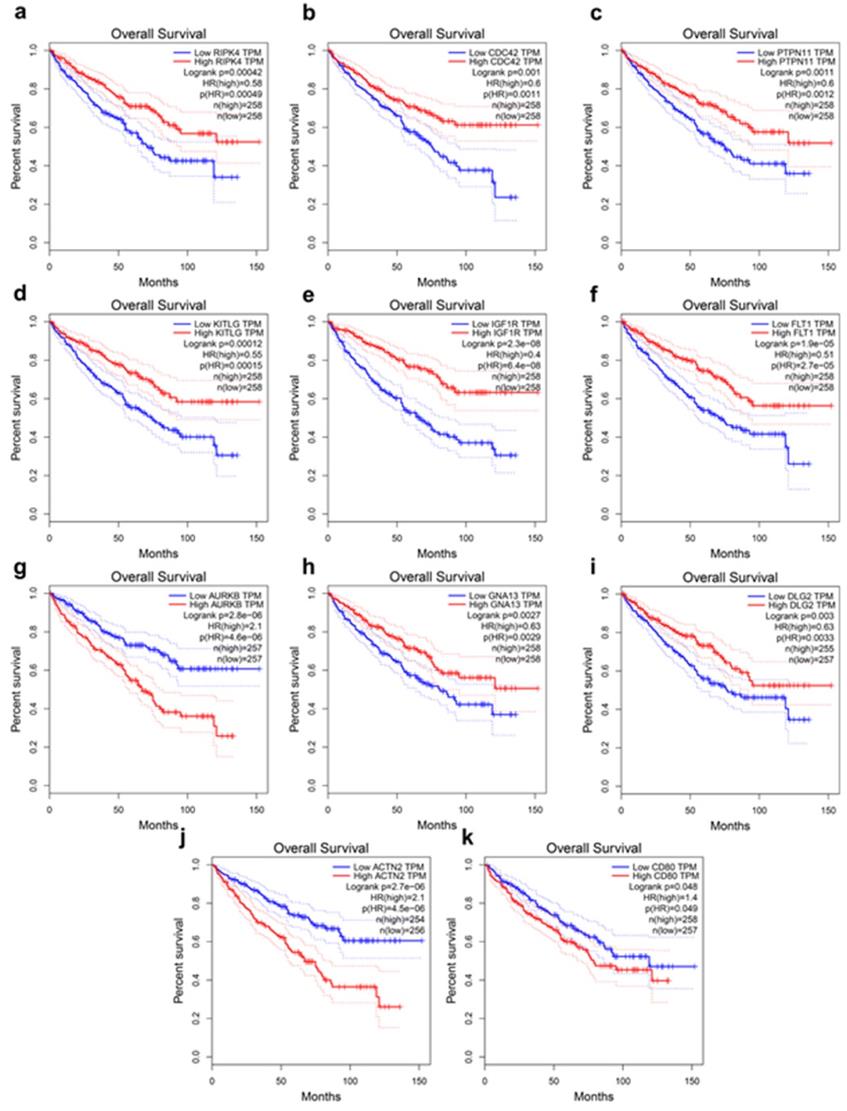
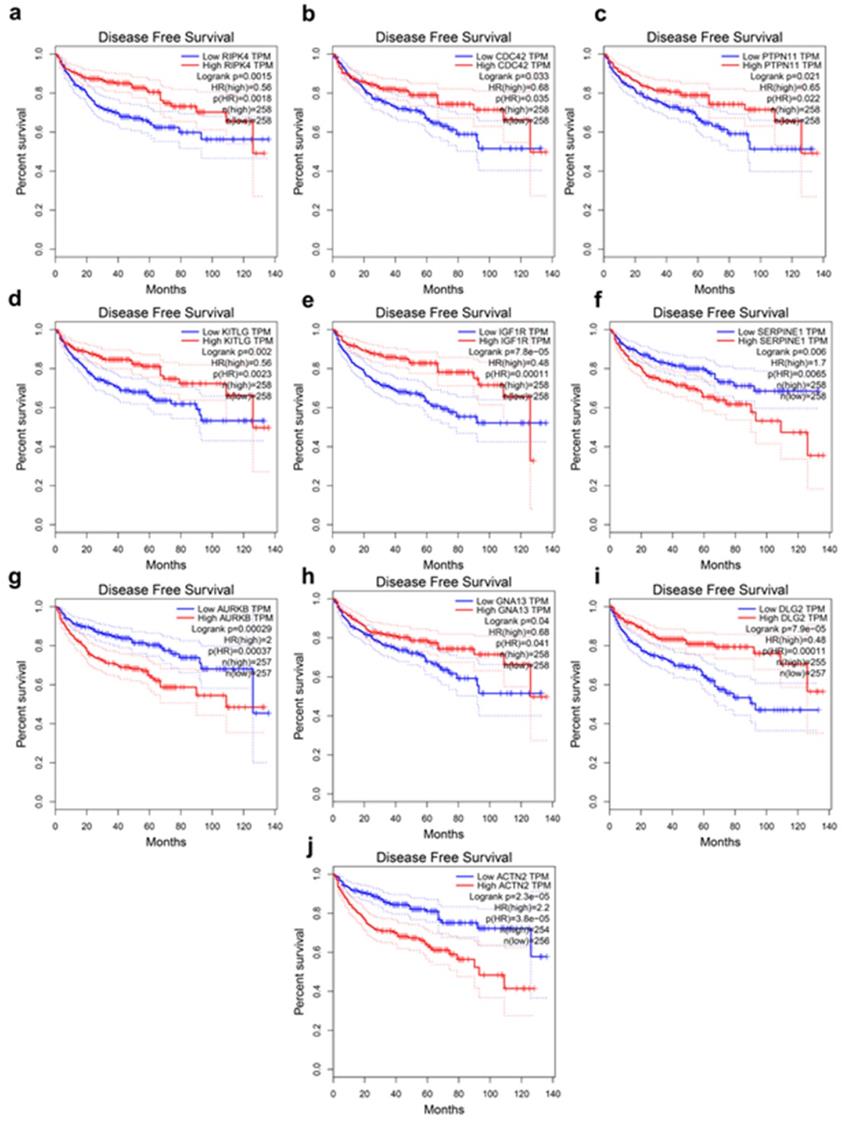
The present study analyzed the association between the top 20 hub gene expression and overall survival (OS), disease-free survival (DFS) of ccRCC patients by Kaplan-Meier analysis. The results shown that expression of RIPK4 (HR=0.58, log-rank P = 0.00042) was correlated with worse OS for ccRCC patients, as well as CDC42(HR=0.6, log-rank P=0.001), PTPN11 (HR=0.6, log-rank P=0.0011), KITLG (HR=0.55, log-rank P=0.00012), IGF1R (HR=0.4, log-rank P = 2.3e-08), FLT1 (HR=0.51, log-rank P=1.9e-05), AURKB (HR=2.1, log-rank P=2.8e-06), GNA13 (HR=0.63, log-rank P=0.0027), DLG2 (HR=0.63, log-rank P=0.0033) (Figure 3a-i). The expression of RIPK4 was correlated with worse DFS for ccRCC patients, as well as CDC42 (HR=0.68, log-rank P=0.033), PTPN11 (HR=0.65, log-rank P=0.021), KITLG (HR=0.56, log-rank P=0.002), IGF1R (HR=0.48, log-rank P=7.8e-05), SERPINE (HR=1.7, log-rank P=0.0065), AURKB (HR=2, log-rank P=0.00029), GNA13 (HR=0.68, log-rank P=0.04), DLG2 (HR=0.48, log-rank P=7.9e-05), ACTN2 (HR=2.2, log-rank P=2.3e-05) (Figure 4a-j).
Hub genes have prognostic value of overall survival. (a) RIPK4 (b) CDC42, (c) PTPN11, (d) KITLG, (e) IGF1R, (f) FLT1, (g) AURKB, (h) GNA13, (i) DLG2, (j) ACTN2, (k) CD80. The overall survival information was based on GEPIA database, P < 0.05 was considered statistically different.
Hub genes have prognostic value of disease-free survival. (a) RIPK4, (b) CDC42, (c) PTPN11, (d) KITLG, (e) IGF1R, (f) SERPINE1, (g) AURKB, (h) GNA13, (i) DLG2, (j) ACTN2. The disease-free survival information was based on GEPIA database, P < 0.05 was considered statistically different.
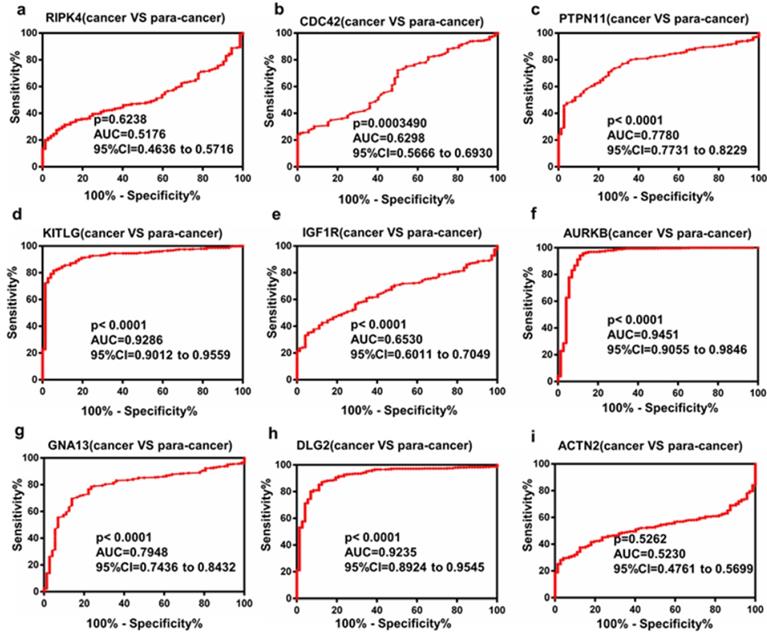
The Receiver Operating Characteristic (ROC) curve analysis of Hub genes
To investigate the diagnostic value of hub genes that may be potential prognostic biomarkers in ccRCC, ROC curves were evaluated. As shown in Figure. 5a-i, several genes could adequately distinguish ccRCC from paired normal tissues with an area under the curve (AUC) of 0.9235-0.9451. The results indicated that these hub genes may be effective diagnostic biomarkers for patients with ccRCC.
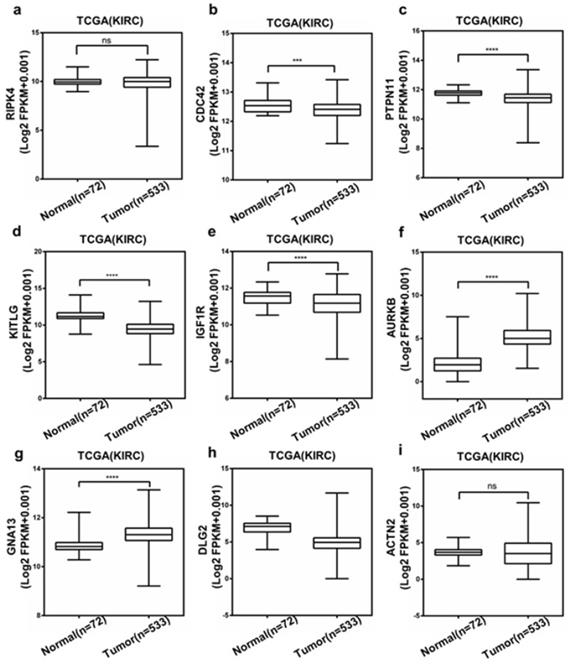
The Expression of Hub Genes
Then, we chose RIPK4, CDC42, PTPN11, KITLG, IGF1R, AURKB, GNA13, DLG2 and ACTN2, which was associated with both OS and DFS, to evaluate the expression level between ccRCC and normal tissue using TCGA database. And as shown in Figure. 6a-i, compared to normal tissue, most of them have significant changes in ccRCC tissue. Only GNA13 and AURKB were elevated in ccRCC patient samples. Based on higher expression fold changes both in GSE47352 and TCGA databases and better diagnostic value, we selected AURKB to operate the further assessment.
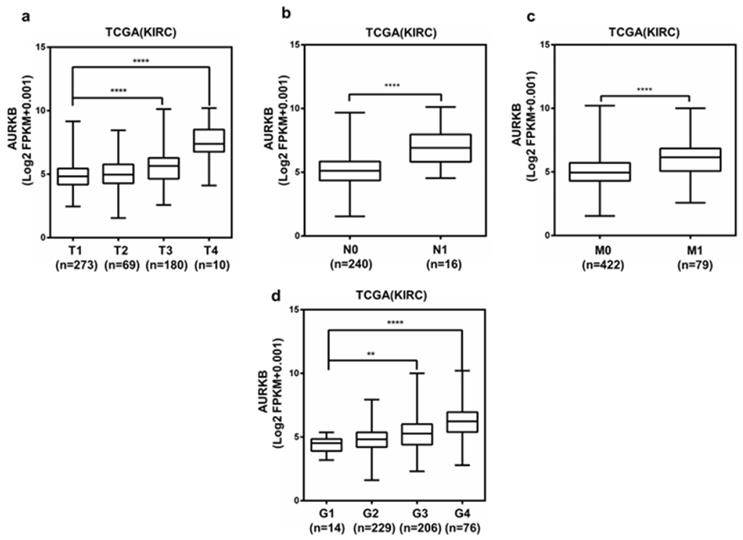
AURKB expression was correlated with various clinicopathological parameters in ccRCC
Analysis of the 533 ccRCC cases in the TCGA database shown that the upregulation of AURKB expression was significantly associated with higher pathological T stage, lymph node metastasis, distant metastasis and grade stage in ccRCC (Figure 7a-d). The expression of AURKB tended to elevate with enhancing tumor T stage and G grade. Clinicopathological information for the 526 ccRCC tissues in TCGA database was shown in Table 5. There was a significant correlation between high AURKB expression and these clinicopathological parameters, which was identical with the aforementioned results. These results indicated that AURKB could promote the progression and metastasis of ccRCC. Patients with high AURKB expression exhibited worse OS and DFS (Figure 3c, Figure 4d). To further explore prognostic value of AURKB, the prognostic value of each clinicopathological parameter, containing AURKB expression status, was estimated for OS (Table 6). Univariate Cox proportion hazard ratio (HR) analysis suggested that age (HR, 1.786; P<0.001), T stage (HR, 3.103; P<0.001), N stage (HR, 3.846; P<0.001), M stage (HR, 4.292; P<0.001), G grade (HR, 2.616; P<0.001) and AURKB expression status (HR, 2.761; P<0.001) were correlated with OS. Furthermore, multivariate analysis revealed that age (HR, 1.591; P=0.004), T stage (HR, 1.502; P=0.030), N stage (HR, 2.145; P=0.017), M stage (HR, 2.466; P<0.001), G grade (HR, 1.531; P=0.023) and AURKB expression (HR, 1.935; P<0.001) could be regarded as independent prognostic indicators of OS.
Diagnostic value of the selected top hub genes.
Expression of the selected top hub genes based on TCGA database.
AURKB is overexpression in ccRCC, and is correlated with various clinicopathological parameters. The high mRNA expression of AURKB was correlated with various clinicopathological parameters: (a) T stage, (b) lymph node metastasis, (c) distant metastases, (d) G stage.
Association between AURKB mRNA expression and clinicopathological parameters of patients with ccRCC.
| AURKB mRNA expression | ||||
|---|---|---|---|---|
| Parameter | Number | Low (n=263) | High (n=263) | P-value |
| Age (years) | ||||
| <60 | 243 | 122 | 121 | |
| ≥60 | 283 | 141 | 142 | 1.000 |
| Gender | ||||
| Female | 185 | 107 | 78 | |
| Male | 341 | 156 | 185 | 0.010 |
| T stage | ||||
| T1 or T2 | 337 | 202 | 135 | |
| T3 or T4 | 189 | 61 | 128 | <0.001 |
| N stage | ||||
| N0 or NX | 510 | 261 | 249 | |
| N1 | 16 | 2 | 14 | 0.004 |
| M stage | ||||
| M0 or MX | 448 | 244 | 204 | |
| M1 | 78 | 19 | 59 | <0.001 |
| G grade | ||||
| G1 or G2 | 246 | 158 | 88 | |
| G3 or G4 | 280 | 105 | 175 | <0.001 |
| TNM stage | ||||
| I + II | 319 | 202 | 135 | |
| III + IV | 207 | 61 | 128 | <0.001 |
Univariate and multivariate analyses of AURKB mRNA expression and patient overall survival.
| Risk factors | Univariate analysis | Multivariate analysisc | ||||
|---|---|---|---|---|---|---|
| Variable | HRa | 95% CIb | P-value | HR | 95% CI | P-value |
| Age (years) | ||||||
| <60 (n=244) | 1.786 | 1.304-2.445 | <0.001 | 1.591 | 1.155-2.190 | 0.004 |
| ≥60 (n=282) | ||||||
| Gender | ||||||
| Female (n=183) | 0.942 | 0.692-1.282 | 0.703 | |||
| Male (n=343) | ||||||
| T stage | ||||||
| T1 or T2 (n=355) | 3.103 | 2.293-4.201 | <0.001 | 1.502 | 1.041-2.167 | 0.030 |
| T3 or T4 (n=191) | ||||||
| N stage | ||||||
| N0 or NX (n=510) | 3.846 | 2.082-7.104 | <0.001 | 2.145 | 1.144-4.023 | 0.017 |
| N1 (n=16) | ||||||
| M stage | ||||||
| M0 or MX (n=447) | 4.292 | 3.147-5.853 | <0.001 | 2.466 | 1.719-3.540 | <0.001 |
| M1 (n=79) | ||||||
| G grade | ||||||
| G1 or G2 (n=246) | 2.616 | 1.867-3.666 | <0.001 | 1.531 | 1.061-2.210 | 0.023 |
| G3 or G4 (n=280) | ||||||
| AURKB | ||||||
| Low (n=263) | 2.761 | 1.987-3.836 | <0.001 | 1.935 | 1.366-2.740 | <0.001 |
| High (n=263) | ||||||
aHR estimated from Cox proportional hazard regression model; bCI of the estimated HR; cMultivariate models were adjusted for T, N, M, G grade classification and age. CI, confidence interval; HR, hazard ratio.
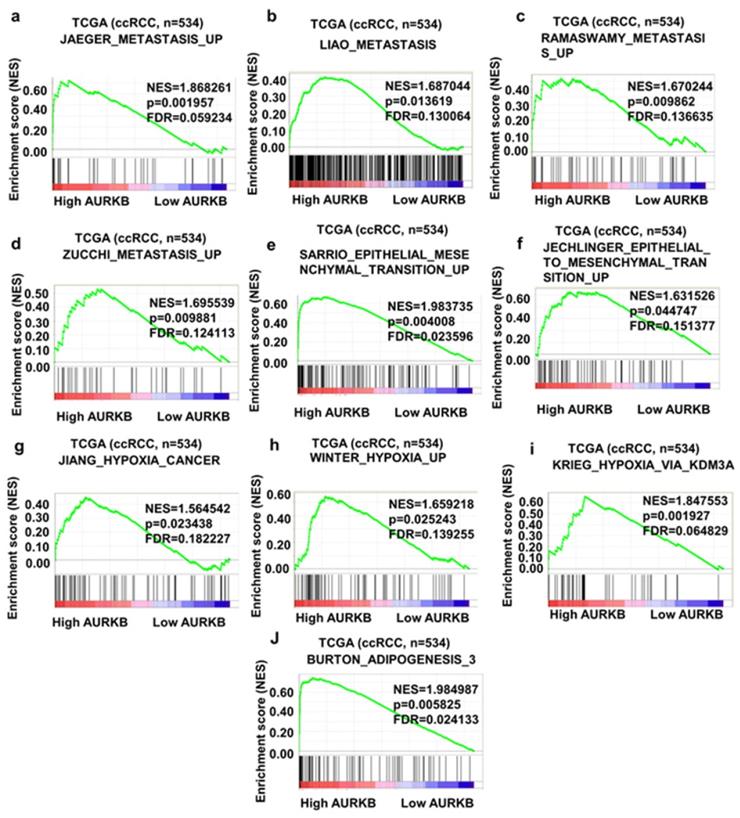
Gene Set Enrichment Analysis
To obtain deeper insight into the function of the AURKB, GSEA was used to map into KEGG pathways and GO analysis database. 10 functional gene sets associated with metastasis or hypoxia pathway were shown, based on the cut-off criteria FDR < 0.05, and gene size ≥ 100, (Figure 8a-j). This result shown that high expression of AURKB was enriched in JAEGER_METASTASIS_UP gene set (NES=1.868261, p=0.001957, FDR=0.059234), LIAO_METASTASIS_UP gene set (NES=1.687044, p=0.013619, FDR=0.130064), RAMASWAMY_METASTASIS_UP (NES=1.670244, p=0.009862, FDR=0.136635) and ZUCCHI_METASTASIS_UP (NES=1.6955399, p=0.009881, FDR=0.124113). Other gene sets which were important pathway for ccRCC progression and metastasis were also associated with AURKB mRNA expression.
Gene set enrichment analysis (GSEA) of AURKB. 10 representative functional gene sets enriched in ccRCC with AURKB highly expressed were listed.
AURKB expression and Biological function in ccRCC
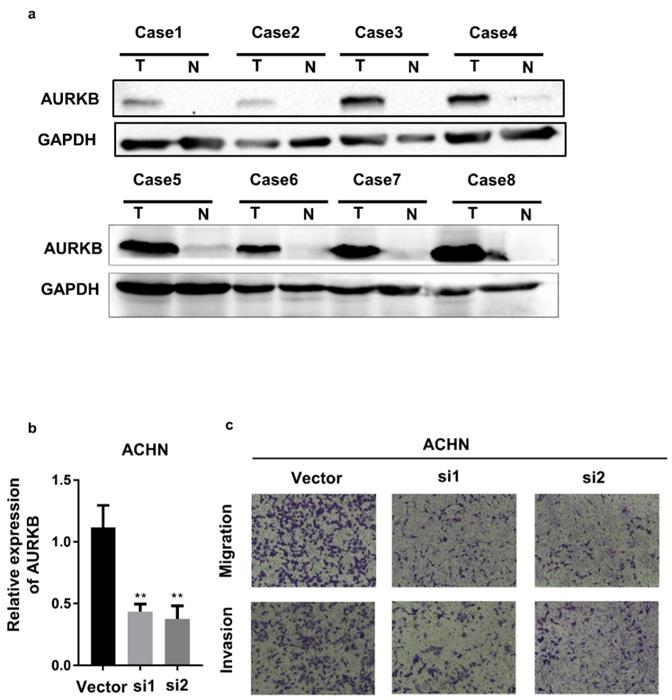
AURKB expression was examined in 8 pairs adjacent normal and ccRCC tumor tissues with western blot. We demonstrated that AURKB was overexpression in ccRCC tissues (Figure 9a). To investigate the mechanism of AURKB on the development of renal cancer, then we detected the biological function of AURKB. As the Figure 9c showed, AURKB knockdown significantly decreased the capacity of migration and invasion of ACHN cells.
Expression and Biological function of AURKB. (a) The expression of AURKB in ccRCC tumor(T) and adjacent normal tissues(N), (b)AURKB knockdown in ACHN cell lines, (c) Transwell assay of AURKB in ACHN cell lines.
Discussion
ccRCC is the most common subtype of kidney cancer, and its prognosis is influenced by tumor progression correlated with complex gene interactions. Investigating the molecular markers of ccRCC is important for the survival of ccRCC patients. Despite significant efforts, the transformation of metastasis has thus far not been identified [18-20]. Metastasis causes almost 90% of human cancer deaths [21].
In the current study, GEO2R was exploited to analyze the gene expression profile of GSE47352, including 4 metastatic and 5 non-metastatic ccRCC samples to explore the molecular mechanism of metastatic ccRCC and find some biomarkers, which might be useful therapeutic targets by using bioinformatics analysis. There was a total of 873 DEGs, including 503 up-regulated genes and 370 down-regulated genes, compared to the control ccRCC tissues. PPI network analysis and Cytoscape MCODE analysis were operated to evaluate protein-protein interactions and gene co-expression modules. Meanwhile, functional and pathway analysis were also operated to identify biological process and pathways of metastatic ccRCC patients.
According to the GO analysis of top 20 hub genes, biological process was mainly enriched in phosphatidylinositol-mediated signaling, positive regulation of DNA replication, regulation of phosphatidylinositol 3-kinase signaling, phosphatidylinositol phosphorylation, protein autophosphorylation. Molecular Function was mainly enriched in phosphatidylinositol-4,5-bisphosphate 3-kinase activity, protein tyrosine kinase activity, protein binding, protein kinase activity, Ras guanyl-nucleotide exchange factor activity. KEGG pathway analysis showed that top 20 hub genes were enriched in Ras signaling pathway, PI3K-Akt signaling pathway, Rap1 signaling pathway, HIF-1 signaling pathway. As we can see, most signaling pathways were correlated with Ras, phosphatidylinositol 3-kinase and protein tyrosine kinase pathway. Previous studies have reported that RAS families directly regulated various phosphatidylinositol 3-kinase isoforms [22]. Meanwhile, one study investigated more than 400 ccRCC use different genemoic platform and found PI3K/AKT pathway was recurrently mutated, indicating this pathway was a potential therapeutic target [23]. Phosphatidylinositol 3-kinase was demonstrated that metastatic RCC patients treated with anti-vascular inhibitory therapy who detected overexpression PI3K pathway have poor prognosis [24]. Other studies also reported that PI3K signaling played a leading role in progression and metastasis of ccRCC [24-27]. Not to mention protein tyrosine kinase pathway, NCCN, EAU have treated Tyrosine kinase inhibitor (TKI) drugs (solfatinib, sunitinib, etc.) as first-line treatment for metastatic renal cell carcinoma[28, 29]. Given their well-known pharmacology, therapeutic strategies to target them could demonstrate to be promising cancer treatment. Our study further confirmed the important regulatory role of signaling pathways such as RAS, PI3K pathway in renal cell metastasis. Therefore, monitoring of these signaling pathways may be helpful to further understanding the mechanism of metastasis and researching treatment.
Furthermore, PPI network analysis identified that RIPK4, TNF, CDC42, KNG1, PTPN11, KITLG, PTGS2, SYK, IGF1R, EPO, SERPINE1, FLT1, AURKB, GNA13, DLG2, ACTN2, CHEK1, FGF8, CD80 and MCHR2 had the highest degree of connectivity among DEGs. RIPK4 could promote cancer cell aggressiveness by upregulate VEGF-A [30]. TNF mediates resistance to EGFR inhibition in cancer [31, 32]. CDC42 as a member of Rho GTPases involved in cell proliferation and migration [33]. The low expression of CDC42 was associated with poor prognosis and enhanced metastasis behavior [34-37]. It was reported that PTPN11 play an important role in promoting progression and metastasis of cancer [38-41]. Another hub gene, such as KITLG, PTGS2, SYK, FLT1 (VEGFR-1), GNA13, etc. could also regulate invasion and metastasis of cancer [42-48].
Cytoscape MCODE module analysis identified 3 modules with highly relevant expression pattern. Then GO biological progress analysis was operated to explore the signaling pathway of each module. These modules were mainly enriched in inflammatory response, G-protein coupled receptor signaling pathway, positive regulation of cytosolic calcium ion concentration. Inflammatory responses played leading roles at different stages of tumor progression, including initiation, malignant conversion, angiogenesis, invasion, and metastasis [49-51]. G-protein coupled receptor was reported a central rule in tumor metastasis and induced angiogenesis [52].
To explore the diagnostic value of hub genes, ROC curves were used. The results revealed that mRNA level of several genes such as KITLG, AURKB, DLG2, could discriminate ccRCC tissues from normal tissues, yielding an AUC of 0.9235-0.9451. These data indicated that these hub genes may be potential biomarkers for the diagnosis of ccRCC.
AURKB, encoding a member of the aurora kinase subfamily of serine/threonine kinases, play an important role in tumorigenesis, inducing aneuploidy and genomic instability [53-57]. In this study, we, for the first time, investigated the expression pattern, clinicopathological parameters and biological functions of AURKB in ccRCC. AURKB expression was uncovered to be upregulated in ccRCC tissues compared with in normal renal tissues, and was correlated with poor prognosis of patients with ccRCC. Multivariate regression analysis suggested that AURKB expression level was an independent prognostic factor for ccRCC; AURKB was a risk factor (HR=1.935; P<0.001). AURKB mRNA level could discriminate ccRCC tissues from normal tissues, yielding an AUC of 0.9451 (95% CI: 0.9055 to 0.9846; p < 0.0001). These results indicated that AURKB could be a potential and novel biomarker for diagnosis and prognosis of ccRCC patients. GSEA analysis was used to explore the biological function of AURKB by the expression of it in ccRCC TCGA database. The result showed that high expression of AURKB was associated with various metastasis gene data sets. Pervious study has reported that inhibition of Aurora kinases induced apoptosis and autophagy in leukemia cells via AURKB/p70S6K/RPL15 axis with the involvement of PI3K/Akt/mTOR, AMPK, and p38 MAPK signaling pathways [58]. Other study uncovered that AURKB may activate the PTK2/PI3K/AKt/nuclear factor-KappaB pathway [59]. These studies indicated that AURKB was involved in PI3K/AKt signal pathway. Epithelial-mesenchymal transition (EMT) plays a leading role in diversified biological and pathological processes, including metastasis and cancer cell drug resistance [60-62]. EMT and Hypoxia pathway were both significantly correlated with the expression of AURKB. A hallmark of ccRCC is a clear cytoplasm that reflects increased lipid and glycogen deposition [63]. Many studies reported that carcinogenesis of renal cancer could have very closely correlation with lipid metabolism [64, 65]. In our study, the adipogenesis gene set was positively associated with the expression of AURKB. All these results indicated that AURKB may play an important role in invasion and metastasis of ccRCC.
In summary, by using a range of bioinformatics analyses, the present study has demonstrated the hub genes and important pathways that may be involved in ccRCC progression and metastasis, based on differentially expressed genes between metastatic and non-metastatic ccRCC samples. We also identified that some hub genes expression was associated with prognosis and diagnosis of ccRCC. Meanwhile, AURKB expression level was an independent prognostic factor for ccRCC. However, further explorations to confirm the function of the candidate biomarkers in ccRCC and to investigate the underlying molecular mechanisms of the genes involved in metastasis of ccRCC are needed.
Acknowledgements
Authors' Contributions
Zhengshuai Song and Hailong Ruan contributed equally to this work. Ke Chen and Xiaoping Zhang conceived the study. Chen Chen Liu performed acquisition and analysis. Qi Cao contributed to data collection. Yu Huang, Hongmei Yang Assisted in writing the manuscript. All authors read and approved the final manuscript.
Funding Statement
This study was supported by grants from the National Natural Science Foundation of China (grant nos. 81672524 and 81672528), the Clinical Research Physician Program of Tongji Medical College, Huazhong University of Science and Technology (grant no. 5001530015) and the Independent innovation foundation of Huazhong University of Science and Technology (grant no. 118530309).
Competing Interests
The authors have declared that no competing interest exists.
References
1. Ferlay J, Soerjomataram I, Dikshit R. et al. Cancer incidence and mortality worldwide: sources, methods and major patterns in GLOBOCAN 2012. Int J Cancer. 2015;136(5 E):359-386
2. Shuch B, Amin A, Armstrong A J. et al. Understanding pathologic variants of renal cell carcinoma: distilling therapeutic opportunities from biologic complexity. Eur Urol. 2015;67(1):85-97
3. Gupta G P, Massague J. Cancer metastasis: building a framework. Cell. 2006;127(4):679-695
4. Liu M, Xu Z, Du Z. et al. The Identification of Key Genes and Pathways in Glioma by Bioinformatics Analysis. J Immunol Res. 2017;2017:1278081
5. Sun C, Yuan Q, Wu D. et al. Identification of core genes and outcome in gastric cancer using bioinformatics analysis. Oncotarget. 2017;8(41):70271-70280
6. Chen L, Yuan L, Wang Y. et al. Co-expression network analysis identified FCER1G in association with progression and prognosis in human clear cell renal cell carcinoma. Int J Biol Sci. 2017;13(11):1361-1372
7. Boeckx C, Op D B K, Wouters A. et al. Overcoming cetuximab resistance in HNSCC: the role of AURKB and DUSP proteins. Cancer Lett. 2014;354(2):365-377
8. Dos S E, Carneiro-Lobo T C, Aoki M N. et al. Aurora kinase targeting in lung cancer reduces KRAS-induced transformation. Mol Cancer. 2016;15:12
9. Ou O, Huppi K, Chakka S. et al. Loss-of-function RNAi screens in breast cancer cells identify AURKB, PLK1, PIK3R1, MAPK12, PRKD2, and PTK6 as sensitizing targets of rapamycin activity. Cancer Lett. 2014;354(2):336-347
10. Yang J, Ikezoe T, Nishioka C. et al. Bcr-Abl activates AURKA and AURKB in chronic myeloid leukemia cells via AKT signaling. Int J Cancer. 2014;134(5):1183-1194
11. Ward A, Balwierz A, Zhang J D. et al. Re-expression of microRNA-375 reverses both tamoxifen resistance and accompanying EMT-like properties in breast cancer. Oncogene. 2013;32(9):1173-1182
12. Luo S, Cao N, Tang Y. et al. Identification of key microRNAs and genes in preeclampsia by bioinformatics analysis. PLoS One. 2017;12(6):e178549
13. Gaudet P, Skunca N, Hu J C. et al. Primer on the Gene Ontology. Methods Mol Biol. 2017;1446:25-37
14. Kanehisa M. The KEGG database. Novartis Found Symp. 2002;247:91-101 101-103, 119-128, 244-252
15. Szklarczyk D, Franceschini A, Wyder S. et al. STRING v10: protein-protein interaction networks, integrated over the tree of life. Nucleic Acids Res. 2015;43(Database issue):D447-D452
16. Uhlen M, Zhang C, Lee S. et al. A pathology atlas of the human cancer transcriptome. Science. 2017;357:6352
17. Song Z, Cao Q, Ruan H. et al. RCAN1.4 acts as a suppressor of cancer progression and sunitinib resistance in clear cell renal cell carcinoma. Exp Cell Res. 2018;372(2):118-128
18. Vogelstein B, Papadopoulos N, Velculescu V E. et al. Cancer genome landscapes. Science. 2013;339(6127):1546-1558
19. Turajlic S, Swanton C. Metastasis as an evolutionary process. Science. 2016;352(6282):169-175
20. Makohon-Moore A P, Zhang M, Reiter J G. et al. Limited heterogeneity of known driver gene mutations among the metastases of individual patients with pancreatic cancer. Nat Genet. 2017;49(3):358-366
21. Hanahan D, Weinberg R A. Hallmarks of cancer: the next generation. Cell. 2011;144(5):646-674
22. Fritsch R, de Krijger I, Fritsch K. et al. RAS and RHO families of GTPases directly regulate distinct phosphoinositide 3-kinase isoforms. Cell. 2013;153(5):1050-1063
23. Comprehensive molecular characterization of clear cell renal cell carcinoma. Nature. 2013, 499(7456): 43-49.
24. Jonasch E, Hasanov E, Corn P G. et al. A randomized phase 2 study of MK-2206 versus everolimus in refractory renal cell carcinoma. Ann Oncol. 2017;28(4):804-808
25. Kruck S, Bedke J, Hennenlotter J. et al. Activation of mTOR in renal cell carcinoma is due to increased phosphorylation rather than protein overexpression. Oncol Rep. 2010;23(1):159-163
26. Li J, Guo L, Ai Z. An integrated analysis of cancer genes in clear cell renal cell carcinoma. Future Oncol. 2017;13(8):715-725
27. Powles T, Lackner M R, Oudard S. et al. Randomized Open-Label Phase II Trial of Apitolisib (GDC-0980), a Novel Inhibitor of the PI3K/Mammalian Target of Rapamycin Pathway, Versus Everolimus in Patients With Metastatic Renal Cell Carcinoma. J Clin Oncol. 2016;34(14):1660-1668
28. Escudier B, Eisen T, Stadler W M. et al. Sorafenib in advanced clear-cell renal-cell carcinoma. N Engl J Med. 2007;356(2):125-134
29. Motzer R J, Hutson T E, Tomczak P. et al. Sunitinib versus interferon alfa in metastatic renal-cell carcinoma. N Engl J Med. 2007;356(2):115-124
30. Liu J Y, Zeng Q H, Cao P G. et al. RIPK4 promotes bladder urothelial carcinoma cell aggressiveness by upregulating VEGF-A through the NF-kappaB pathway. Br J Cancer. 2018;118(12):1617-1627
31. Gong K, Guo G, Gerber D E. et al. TNF-driven adaptive response mediates resistance to EGFR inhibition in lung cancer. J Clin Invest. 2018;128(6):2500-2518
32. Guo G, Gong K, Ali S. et al. A TNF-JNK-Axl-ERK signaling axis mediates primary resistance to EGFR inhibition in glioblastoma. Nat Neurosci. 2017;20(8):1074-1084
33. Stengel K, Zheng Y. Cdc42 in oncogenic transformation, invasion, and tumorigenesis. Cell Signal. 2011;23(9):1415-1423
34. Patel V, Rosenfeldt H M, Lyons R. et al. Persistent activation of Rac1 in squamous carcinomas of the head and neck: evidence for an EGFR/Vav2 signaling axis involved in cell invasion. Carcinogenesis. 2007;28(6):1145-1152
35. Chen B, Ding Y, Liu F. et al. Tiam1, overexpressed in most malignancies, is a novel tumor biomarker. Mol Med Rep. 2012;5(1):48-53
36. Menacho-Marquez M, Garcia-Escudero R, Ojeda V. et al. The Rho exchange factors Vav2 and Vav3 favor skin tumor initiation and promotion by engaging extracellular signaling loops. PLoS Biol. 2013;11(7):e1001615
37. Schmidt S, Debant A. Function and regulation of the Rho guanine nucleotide exchange factor Trio. Small GTPases. 2014;5:e29769
38. Dong L, Yu W M, Zheng H. et al. Leukaemogenic effects of Ptpn11 activating mutations in the stem cell microenvironment. Nature. 2016;539(7628):304-308
39. Fedele C, Ran H, Diskin B. et al. SHP2 Inhibition Prevents Adaptive Resistance to MEK inhibitors in Multiple Cancer Models. Cancer Discov. 2018
40. Nichols R J, Haderk F, Stahlhut C. et al. RAS nucleotide cycling underlies the SHP2 phosphatase dependence of mutant BRAF-, NF1- and RAS-driven cancers. Nat Cell Biol. 2018
41. Zhang K, Zhao H, Ji Z. et al. Shp2 promotes metastasis of prostate cancer by attenuating the PAR3/PAR6/aPKC polarity protein complex and enhancing epithelial-to-mesenchymal transition. Oncogene. 2016;35(10):1271-1282
42. Dawson M R, Duda D G, Fukumura D. et al. VEGFR1-activity-independent metastasis formation. Nature. 2009:461 (E4, E5): 7262
43. Deng Z, Ma S, Zhou H. et al. Tyrosine phosphatase SHP-2 mediates C-type lectin receptor-induced activation of the kinase Syk and anti-fungal TH17 responses. Nat Immunol. 2015;16(6):642-652
44. Wang C A, Harrell J C, Iwanaga R. et al. Vascular endothelial growth factor C promotes breast cancer progression via a novel antioxidant mechanism that involves regulation of superoxide dismutase 3. Breast Cancer Res. 2014;16(5):462
45. Yang S, Li W S, Dong F. et al. KITLG is a novel target of miR-34c that is associated with the inhibition of growth and invasion in colorectal cancer cells. J Cell Mol Med. 2014;18(10):2092-2102
46. Yu Y, Gaillard S, Phillip J M. et al. Inhibition of Spleen Tyrosine Kinase Potentiates Paclitaxel-Induced Cytotoxicity in Ovarian Cancer Cells by Stabilizing Microtubules. Cancer Cell. 2015;28(1):82-96
47. Zhang X, Yang L, Chien S. et al. Suspension state promotes metastasis of breast cancer cells by up-regulating cyclooxygenase-2. Theranostics. 2018;8(14):3722-3736
48. Zhang J X, Mai S J, Huang X X. et al. MiR-29c mediates epithelial-to-mesenchymal transition in human colorectal carcinoma metastasis via PTP4A and GNA13 regulation of beta-catenin signaling. Ann Oncol. 2014;25(11):2196-2204
49. Diakos C I, Charles K A, Mcmillan D C. et al. Cancer-related inflammation and treatment effectiveness. Lancet Oncol. 2014;15(11):e493-e503
50. Grinberg-Bleyer Y, Ghosh S. A Novel Link between Inflammation and Cancer. Cancer Cell. 2016;30(6):829-830
51. Mantovani A, Allavena P, Sica A. et al. Cancer-related inflammation. Nature. 2008;454(7203):436-444
52. Dorsam R T, Gutkind J S. G-protein-coupled receptors and cancer. Nat Rev Cancer. 2007;7(2):79-94
53. Shin J, Kim T W, Kim H. et al. Aurkb/PP1-mediated resetting of Oct4 during the cell cycle determines the identity of embryonic stem cells. Elife. 2016;5:e10877
54. Gully C P, Velazquez-Torres G, Shin J H. et al. Aurora B kinase phosphorylates and instigates degradation of p53. Proc Natl Acad Sci USA. 2012;109(24):E1513-E1522
55. Shin J, Kim T W, Kim H. et al. Aurkb/PP1-mediated resetting of Oct4 during the cell cycle determines the identity of embryonic stem cells. Elife. 2016;5:e10877
56. Yang J, Ikezoe T, Nishioka C. et al. Bcr-Abl activates AURKA and AURKB in chronic myeloid leukemia cells via AKT signaling. Int J Cancer. 2014;134(5):1183-1194
57. Ou O, Huppi K, Chakka S. et al. Loss-of-function RNAi screens in breast cancer cells identify AURKB, PLK1, PIK3R1, MAPK12, PRKD2, and PTK6 as sensitizing targets of rapamycin activity. Cancer Lett. 2014;354(2):336-347
58. He S, Shu L, Zhou Z. et al. Inhibition of Aurora kinases induces apoptosis and autophagy via AURKB/p70S6K/RPL15 axis in human leukemia cells. Cancer Letters. 2016;382(2):215-230
59. Pi W, Cao Z, Liu J. et al. Potential Molecular Mechanisms of AURKB in the Oncogenesis and Progression of Osteosarcoma Cells: A Label-Free Quantitative Proteomics Analysis. Technology in Cancer Research & Treatment. 2019;18:1180678098
60. Kalluri R, Weinberg R A. The basics of epithelial-mesenchymal transition. J Clin Invest. 2009;119(6):1420-1428
61. Hay E D. An overview of epithelio-mesenchymal transformation. Acta Anat (Basel). 1995;154(1):8-20
62. Thiery J P. Epithelial-mesenchymal transitions in development and pathologies. Curr Opin Cell Biol. 2003;15(6):740-746
63. Rini B, Goddard A, Knezevic D. et al. A 16-gene assay to predict recurrence after surgery in localised renal cell carcinoma: development and validation studies. Lancet Oncol. 2015;16(6):676-685
64. Qiu B, Ackerman D, Sanchez D J. et al. HIF2alpha-Dependent Lipid Storage Promotes Endoplasmic Reticulum Homeostasis in Clear-Cell Renal Cell Carcinoma. Cancer Discov. 2015;5(6):652-667
65. Iwamoto H, Abe M, Yang Y. et al. Cancer Lipid Metabolism Confers Antiangiogenic Drug Resistance. Cell Metab. 2018;28(1):104-117
Author contact
![]() Corresponding authors: Ke Chen, Department of Urology, Union Hospital, Tongji Medical College, Huazhong University of Science and Technology, 1277 Jiefang Avenue, Wuhan, Hubei 430022, P.R. China. E-mail: shenkeedu.cn; Zhengshuai Song, Department of Urology, The Central Hospital of Wuhan, Tongji Medical College, Huazhong University of Science and Technology, 26 shengli Avenue, Wuhan, Hubei 430013, P.R. China. E-mail: 867703966com.
Corresponding authors: Ke Chen, Department of Urology, Union Hospital, Tongji Medical College, Huazhong University of Science and Technology, 1277 Jiefang Avenue, Wuhan, Hubei 430022, P.R. China. E-mail: shenkeedu.cn; Zhengshuai Song, Department of Urology, The Central Hospital of Wuhan, Tongji Medical College, Huazhong University of Science and Technology, 26 shengli Avenue, Wuhan, Hubei 430013, P.R. China. E-mail: 867703966com.