Impact Factor ISSN: 1837-9664

 Global reach, higher impact
J Cancer 2020; 11(23):6841-6849. doi:10.7150/jca.47189 This issue Cite
Research Paper
Genetic Fine Mapping and Genomic Annotation Defines Causal Mechanisms at A Novel Colorectal Cancer Susceptibility Locus in Han Chinese
Kewei Jiang3*, Fengying Du1*, Liang lv4, Hongqing Zhuo1,2, Tao Xu1,2, Lipan Peng1,2, Yuezhi Chen1,2, Leping Li1,2, Jizhun Zhang1,2 ![]()
1. Department of Gastrointestinal Surgery, Shandong Provincial Hospital, Cheeloo College of Medicine, Shandong University, Jinan, Shandong, China.
2. Department of Gastrointestinal Surgery, Shandong Provincial Hospital Affiliated to Shandong First Medical University, Jinan, Shandong, China.
3. Department of Gastroenterological Surgery, Peking University People's Hospital, Beijing, China.
4. Department of General Surgery, Affiliated Hospital of Qingdao University, Qingdao, China.
*Equal co-first authorship.
Received 2020-4-19; Accepted 2020-9-14; Published 2020-9-30
Abstract
Genome-wide association studies of colorectal cancer (CRC) have identified two risk SNPs. The characterization of these risk regions in diverse racial groups with different linkage disequilibrium structure would aid in localizing the causal variants. Herein, fine mapping of the established CRC loci was carried out in 1,508 cases and 1,482 controls obtained from the Han Chinese population. One distinct association signal was identified at these loci, where fine mapping implicated rs1010208 as a functional locus. Next, the candidate target genes of functional SNP rs1010208 were analyzed using data from TCGA databases by expression quantitative trait loci analysis method; the data from Peking University People's Hospital were utilized for verification. The dual-luciferase reporter system analysis confirmed that rs1010208 is a regulatory region that can be mutated to decrease the expression of HINT1, resulting in proliferation and invasiveness of CRC.
Keywords: genome-wide association study, fine mapping, colorectal cancer, susceptibility loci, 5q23.3
Introduction
Colorectal cancer (CRC) is the third most common malignancy and the leading cause of cancer-related deaths worldwide, which accounts for > 1.8 million new cases and 861 thousand deaths every year [1]. In the past few decades, an increasing trend of incidence and mortality has been observed in Asia including China [2]. Thus, CRC has become a huge burden for society and individual families, and hence, elucidating the underlying pathogenesis and identifying new disease biomarkers is critical for the prevention and the early detection of CRC.
Genome-wide association studies (GWAS) does not indicate discovering of disease-causing genes or disease-causing mutations but rather locating the disease-causing mutations or genes; the true pathogenic mutations or genes are often identified in the vicinity of tag-single nucleotide polymorphisms (Tag SNPs) [3]. GWAS loci are typically represented by a lead SNP with a robust signal of association in the region. However, lead SNPs might not directly impact the disease susceptibility but act as proxies for causal variants because of linkage disequilibrium (LD). Therefore, understanding the functional significance of these associated genetic loci is the biggest challenge post-GWAS [4].
Previously, our group identified two genetic loci related to the risk of CRC (rs12522693 at 5q23.3 and rs17836917 at 17q12) through the initial screening and validation by GWAS [5]. The genes contained in these two susceptible regions play a major role in the formation and development of malignant tumors.
These two genetic loci were localized outside the DNA coding region and were not distinctly pathogenic. Therefore, further fine mapping of the above regions is essential, and the functional prediction of SNPs is utilized to identify the potential pathogenic or functional variations. The present study was conducted to explore the correlation between genetic variation and susceptibility to CRC in the Chinese Han population and to reveal the genetic susceptibility mechanism of CRC.
Materials and Methods
Ethics statement
All human-based studies were approved by the relevant institutional review boards and conducted according to the Declaration of Helsinki. All participants provided written informed consent.
Studies and participants
Based on the previous three-stage GWAS project data, we established a library of validated DNA samples, complete sample information, and related operations [5]. The validated DNA samples from 1,508 CRC cases and 1,482 controls, comprising two groups of independent samples, were used for targeted resequencing and genotyping. We set inclusion criteria as follow, all the CRC cases were histopathologically confirmed primary colorectal adenocarcinoma and they volunteered to participate in this project. Someone who had any prior history of other cancers, benign adenoma, familial history, chemotherapy, or radiotherapy was excluded. The controls were selected from individuals undergoing routine physical examinations in local hospitals or participating in a community-based screening program for non-infectious diseases conducted during the period when the cases were recruited. And individuals with a history of gastrointestinal malignancies were excluded. The controls were frequency-matched to the cases with respect to age (± 5 years) and gender. A volume of 5 mL venous blood was withdrawn from the individuals after the interview.
People who smoke more than one cigarette per day and smoke for more than one year in a row are considered smokers. Drinking twice a week and drinking more than 50 grams per drink, drinking more than 6 months of continuous drinking is considered a drinker. The participants were unrelated Han Chinese, and after training by the investigator, a questionnaire was used to conduct a one-to-one interview survey on the subjects. The collected data were entered using the two-track method, and the logistic check was corrected to perform statistical analysis.
Imputation and association analysis
We selected a 200 kb region upstream and downstream of the two genetic loci (rs12522693 and rs17836917) found in the previous GWAS project [5] and 10 kb upstream of the candidate genes, HINT1 and CCL2; then, the adjacent regions were combined to obtain two regions. According to the LD segment of the Chinese population from the HapMap database (HapMap Genome Browser release #27 Phase 1-, 2-, and 3-merged genotypes and frequencies), we extracted all the Tag SNPs from these two regions and filtered with R2 < 0.8 and minor allele frequency (MAF) in the Han Chinese (CHB) ≥ 0.05; the genotyping success rate was ≥ 0.90. (http://hapmap.ncbi.nlm.nih.gov/cgi-perl/gbrowse/hapmap27_B36/).
In order to identify the potential functional sites, we used the SNPinfo strategy to functionally annotate the screened sites and select the functional sites in the annotations [6], including non-synonymous SNPs, shear regulatory sites, stop codon, SNPs3D prediction, transcription factor binding site (TFBS) prediction, miRNA binding site prediction, and the genes in the vicinity. The online SNP SNAP software was used to analyze the linkage of the screened genetic loci.
Genotyping and quality control
Genotyping of the selected SNPs was performed with a total of 1,979 samples using Affymetrix Axiom Genome-Wide CHB1 and CHB2 arrays that contained 1,280,786 SNPs chosen for the CRC-related projects. The Axiom array data underwent extensive quality control (QC) procedures carried out by Affymetrix as detailed in our previous study [5]. Only SNPs that passed the QC were retained for subsequent analyses. After the application of these QC filters, the whole CRC dataset contained 1,898 subjects (932 cases and 966 controls) and 1,129,636 SNPs.
Identification of distinct association signals in established GWAS loci
The SNPs identified by the targeted resequencing using DNA samples from 1,508 CRC cases and 1,482 controls were validated. Association analysis was performed using a logistic regression model with adjustment for age, sex, smoking, and drinking to calculate the correlation P-value, correlation odds ratio (OR), and 95% confidence interval (CI). Then, random-effect and fixed-effect meta-analysis were conducted to assess the pooled genetic effects in the validation stage.
Prediction and verification of target genes for rs1010208
We obtained genomic annotation files for SNP genotype data and matched raw gene expression data of 146 patients with CRC assayed through The Cancer Genome Atlas (TCGA) database. An SNP with high LD (R2 > 0.9), risk SNP rs1010208, was selected as the proxy SNP, and the samples used for LD were from 1000 genome phase 1 data (CEU, CHB, JPT). Next, cis-expression quantitative trait loci (cis-eQTL) analysis was performed with rs1010208 using the transcripts within 1 Mb upstream and downstream, and the correlation of each pair of SNP-transcript expression was analyzed by a linear regression model with a P-value < 0.05 and false discovery rate (FDR) < 0.05.
Then, we obtained RNA-Seq data of 286 CRC tumors and 41 normal tissues from TCGA database for target-gene correlation studies. Based on the normalized data after chip analysis, a one-way ANOVA test was conducted to observe the differentially expressed genes in these two groups (P-value < 0.05).
Subsequently, real-time polymerase chain reaction (real-time PCR) was performed to detect the gene expression in 55 CRC patients undergone gastrointestinal surgery at the Peking University People's Hospital from May 2013 to August 2013 (characteristics of samples are listed in Supplementary Table S1).
Dual-luciferase activity assay
We synthesized 965-bp nucleotide sequences containing the risk or protective allele of HINT1 in both forward and reverse orientations. Then, complementary single-stranded oligos were annealed and subcloned into the minimal promoter-driven luciferase vector pGL3 using DH5α. The isolated clones were verified by sequencing and BLAST analysis. The cells were transfected using 1 μg pGL3 DNA vector harboring the protective or risk HINT1 gene, or an equivalent amount of empty vector DNA with 100 ng SV40 DNA as a transfection control/well. After 48 h post-transfection, the cells were lysed and analyzed for Firefly and Renilla luciferase activities using the Dual-luciferase assay system according to the manufacturer's instructions in a half-volume 96-well plate on an Enspire Multimode Plate-Reader. Firefly luciferase activity (F) was normalized to the Renilla luciferase activity (R) for each well, and the results were expressed as a mean normalized activity relative to the empty vector-transfected cells.
Functional verification of target gene HINT1
Supplementary Table S2 contains sample information for functional verification. We performed immunohistochemistry staining on these samples and analyzed the correlation between HINT1 protein expression and clinicopathological parameters in the CRC tissues by the chi-square test (Abcam: ab124912, 1:500). Kaplan-Meier method and Cox risk model were used for detecting the correlation between the disease and the primary clinical indicators.
SW480 and HCT116 cell lines were purchased from the Chinese Academy of Sciences Cell Bank (Shanghai, China) and cultured in RPMI1640 liquid medium (Gibico, USA) containing 10% fetal bovine serum (Gibico, USA). Human colonic fibroblast CCD-18Co (ATCC, CRL-1459) were set as a control and cultured in Dulbecoo minimum essential medium (DMEM) high-glucose medium (HyClone, SH30243.01B) supplemented with 10% fetal bovine serum (Gibco, USA). The cells were cultured in an incubator with 37 °C and 5% CO2, and other procedures were followed according to the general instructions. SW480, HCT116 and CCD-18Co cell lines were cultured and passaged at 90% confluence, after trypsinization at the logarithmic phase, the cells were sub-cultured in our standard medium until reaching 30% confluency. Transfected with LV-HINT1 overexpressing lentivirus, and western blot was used to verify the effect of overexpression (Abcam: ab124912, 1:1000). Subsequently, we performed a scratch test, an invasion test, an apoptosis test, and an MTT assay.
Statistical methods
For stratified analysis, the heterogeneity test between the groups was based on the chi-square distribution Q test. The univariate analysis was performed prior to cis-eQTL analysis, and samples of normal distribution were subjected to paired T-test, or else rank-sum test was performed. A two-sided unpaired T-test was used to compare the luciferase activity between the alleles. The variables were compared by the T-test using the least-significant difference (LSD) method or one-way ANOVA test.
P-value < 0.05 and FDR < 0.05 were used as the criteria of statistical significance, and all statistical tests were two-sided. The statistical analyses were performed using Stata v11.0 and R software (version 3.5.1; The R Foundation for Statistical Computing).
Results
Characteristics of samples for fine mapping
The samples used in the validation stage included 1,482 controls and 1,508 cases from Beijing and Jiangsu regions. As shown in Table S3, no significant difference as detected in the age and gender between the case and control groups (P-value = 0.131 and 0.105, respectively). Also, and no significant difference was observed in the composition of smoking and drinking status between the control and cases group (P-value = 0.238 and 0.248, respectively).
Genotyping results for validation sites
After the functional annotation of the screening loci by the SNPinfo strategy, we obtained 45 loci. SNPsnap online software was used for the linkage analysis. As a result, we obtained 10 functional sites, and the functional information is summarized in Supplementary Table S4. In the iPLEX MassARRAY genotyping map, the triangles on two sides indicate mixed genotypes, the squares in the middle are heterozygous, and the red dots are unclear. Figure S1 illustrates the genotyping of 10 SNPs in this study. The success rate of genotyping at 10 sites was > 98%.
Correlation between verification loci and risk of CRC
As shown in Table 1, the genotype distribution of the control group at 10 sites was consistent with the Hardy-Weinberg equilibrium. SNP rs1010208 was significantly associated with the risk of CRC (OR = 1.15, 95% CI: 1.01-1.31, P-value = 0.029); however, no association was found between the other nine SNPs and the risk of CRC.
Results of association analysis of verification loci
| Locus | Base changea | HWb | MAFc control/case | OR (95% CI)d | P-value |
|---|---|---|---|---|---|
| rs10068403 | G/A | 0.483 | 0.720/0.729 | 1.07 (0.96-1.20) | 0.214 |
| rs1029749 | C/A | 0.937 | 0.454/0.547 | 1.01 (0.91-1.11) | 0.927 |
| rs1010208 | C/T | 0.362 | 0.577/0.815 | 1.15 (1.01-1.31) | 0.029* |
| rs33919 | G/C | 0.967 | 0.792/0.567 | 0.96 (0.87-1.07) | 0.465 |
| rs1023527 | T/A | 0.902 | 0.550/0.534 | 0.94 (0.85-1.04) | 0.206 |
| rs11658161 | A/G | 0.579 | 0.939/0.941 | 1.04 (0.84-1.29) | 0.728 |
| rs16969118 | T/C | 0.106 | 0.901/0.901 | 0.96 (0.81-1.14) | 0.653 |
| rs17837023 | G/A | 0.220 | 0.559/0.553 | 0.98 (0.88-1.08) | 0.671 |
| rs2189333 | G/C | 0.451 | 0.674/0.680 | 1.03 (0.92-1.15) | 0.600 |
| rs28935 | T/C | 0.933 | 0.550/0.560 | 1.04 (0.94-1.15) | 0.442 |
a Base change: High frequency/low-frequency allele;
b Hardy-Weinberg equilibrium analysis in the control group;
c MAF: Small allele frequency (case/control);
d OR of the cumulative ratio logistic regression analysis, 95% CI.
Logistic regression analysis revealed an increased risk of CRC (27%; adjusted OR = 1.27, 95% CI: 1.08-1.49) in individuals with heterozygous genotype (CT) as compared to the individuals carrying rs1010208 wild-type homozygous genotype (CC) after adjustment for gender, age, and smoking status. The log-added model showed that the allele T responded to the risk of CRC in a dose-dependent manner. For each additional T allele, the risk of CRC increased by an average of 14% (adjusted OR = 1.14, 95% CI: 1.00-1.30). Strikingly, the allele T is significant in the heterozygous type but not significant in the mutant homozygote, which might be attributed to the slight frequency in the homozygous mutation. However, no statistically significant association was observed between the other 9 loci and the risk of CRC (Supplementary Table 2).
Correlation between verification loci and risk of CRC
| Loci | Case group | Control group | OR (95% CI)a | P-valuea | ||
|---|---|---|---|---|---|---|
| N | % | N | % | |||
| rs10068403 | 1509 | 1482 | ||||
| GG | 767 | 50.8 | 789 | 53.2 | 1.00 | |
| AG | 604 | 40.0 | 573 | 38.7 | 1.11 (0.95-1.30) | 0.198 |
| AA | 126 | 8.3 | 114 | 7.7 | 1.11 (0.84-1.48) | 0.457 |
| A † | 1.08 (0.96-1.21) | 0.197 | ||||
| rs1029749 | 1509 | 1482 | ||||
| CC | 441 | 29.2 | 438 | 29.6 | 1.00 | |
| CA | 736 | 48.8 | 728 | 49.1 | 1.02 (0.86-1.21) | 0.847 |
| AA | 305 | 20.2 | 300 | 20.2 | 0.96 (0.79-1.22) | 0.893 |
| A † | 1.02 (0.92-1.13) | .0716 | ||||
| rs1010208 | 1509 | 1482 | ||||
| CC | 937 | 62.1 | 984 | 66.4 | 1.00 | |
| CT | 502 | 33.3 | 435 | 29.4 | 1.27 (1.08-1.49) | 0.004 |
| TT | 61 | 4.0 | 56 | 3.8 | 1.02 (0.70-1.52) | 0.885 |
| T † | 1.14 (1.00-1.30) | 0.048 | ||||
| rs33919 | 1509 | 1482 | ||||
| GG | 502 | 33.3 | 474 | 32.0 | 1.00 | |
| CG | 721 | 47.8 | 725 | 48.9 | 0.93 (0.79-1.10) | 0.415 |
| CC | 273 | 18.1 | 276 | 18.6 | 0.93 (0.75-1.16) | 0.538 |
| C † | 0.98 (0.88-1.08) | 0.644 | ||||
| rs1023527 | 1509 | 1482 | ||||
| TT | 465 | 30.8 | 418 | 28.2 | 1.00 | |
| AT | 717 | 47.5 | 735 | 49.6 | 0.86 (0.73-1.03) | 0.100 |
| AA | 315 | 20.9 | 319 | 21.5 | 0.87 (0.70-1.07) | 0.189 |
| A † | 0.92 (0.83-1.02) | 0.128 | ||||
| rs11658161 | 1509 | 1482 | ||||
| AA | 1319 | 87.4 | 1305 | 88.1 | 1.00 | |
| AG | 174 | 11.5 | 167 | 11.3 | 1.05 (0.83-1.32) | 0.665 |
| GG | 5 | 0.3 | 4 | 0.3 | 1.15 (0.29-4.65) | 0.835 |
| G † | 1.05 (0.84-1.30) | 0.680 | ||||
| rs16969118 | 1509 | 1482 | ||||
| TT | 1232 | 81.6 | 1190 | 80.3 | 1.00 | |
| CT | 250 | 16.6 | 275 | 18.6 | 0.91 (0.75-1.11) | 0.347 |
| CC | 19 | 1.3 | 9 | 0.6 | 2.12 (0.99-4.52) | 0.052 |
| C † | 0.97 (0.81-1.15) | 0.711 | ||||
| rs17837023 | 1509 | 1482 | ||||
| GG | 473 | 31.3 | 461 | 31.1 | 1.00 | |
| AG | 731 | 48.4 | 703 | 47.4 | 0.98 (0.83-1.16) | 0.833 |
| AA | 297 | 19.7 | 305 | 20.6 | 0.91 (0.73-1.12) | 0.358 |
| A † | 0.98 (0.89-1.09) | 0.733 | ||||
| rs2189333 | 1509 | 1482 | ||||
| GG | 674 | 44.7 | 687 | 46.4 | 1.00 | |
| CG | 654 | 43.3 | 628 | 42.4 | 1.09 (0.93-1.28) | 0.278 |
| CC | 158 | 10.5 | 157 | 10.6 | 1.02 (0.79-1.32) | 0.858 |
| C† | 1.04 (0.94-1.16) | 0.468 | ||||
| rs28935 | 1509 | 1482 | ||||
| TT | 443 | 29.4 | 461 | 31.1 | 1.00 | |
| CT | 763 | 50.6 | 723 | 48.8 | 1.10 (0.92-1.30) | 0.289 |
| CC | 286 | 19.0 | 286 | 19.3 | 1.10 (0.89-1.37) | 0.386 |
| C† | 1.04 (0.94-1.15) | 0.464 | ||||
a Corrected by age, gender, and smoking and drinking status;
† The log-added model, only the genotype enters the model as a determinant variable.
Stratified analysis of rs1010208 and the risk of CRC
We conducted a stratified analysis of rs1010208 based on age, gender, smoking status, and drinking status. As shown in Table 3, the effect of the rs1010208 CT genotype on increasing the risk of CRC was significantly associated with the drinking status (OR = 1.21, 95% CI: 1.05-1.40), and the drinking status increased the risk of CRC in individuals with heterozygous genotype (CT) by 21%. Other sites were not significantly associated with CRC at all stratifications.
Stratified analysis of rs1010208 and risk of CRC
| Factors | rs1010208 (T > C)a | |
|---|---|---|
| OR (95% CI) | P-value | |
| Age (years) | ||
| < 60 | 1.18 (0.99-1.40) | 0.060 |
| ≥ 60 | 1.14 (0.94-1.39) | 0.196 |
| Gender | ||
| Male | 1.15 (0.97-1.36) | 0.110 |
| Female | 1.18 (0.96-1.47) | 0.112 |
| Smoke | ||
| Never | 1.15 (0.99-1.34) | 0.055 |
| Yes | 1.08 (0.82-1.42) | 0.575 |
| Drink | ||
| Never | 0.94 (0.67-1.31) | 0.708 |
| Yes | 1.21 (1.05-1.40) | 0.011* |
aAge and gender adjusted in the logistic regression model.
Acquisition of proxy SNPs and determination of target gene function
The association analysis conducted with the samples from the TCGA database retrieved 8 SNPs with a high degree of LD in rs1010208 (Supplementary Table S5).
The eQTL analysis of proxy SNP revealed that 3 genes, HINT1, CDC42SE2, and FNIP1, are statistically different, respectively; especially 4 proxy SNPs were associated with CDC42SE2 in cis-eQTL (Supplementary Table S6 and Figure 1). However, we proposed that the data used in this analysis are collected from the European and American populations and need further verification in the Chinese population.
Cis-eQTL correlation schematic. (A) eQTL correlation between SNP rs2189508 and HINT1. (B) eQTL correlation between SNP rs2189508 and CDC42SE2. (C) eQTL correlation between SNP rs7736085 and FNIP1.
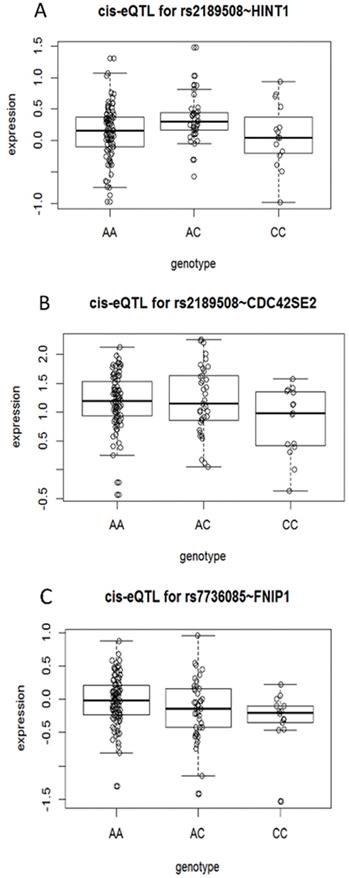
Based on the normalized TCGA RNA-Seq data, we found that among the candidate target genes, the expression of HINT1, CDC42SE2 and FNIP1 differed between the cancer tissues and the normal tissues (P-value = 0.0172, P-value <0.0001 and P-value <0.0001, respectively, shown in Supplementary Fig S2), however, in the TCGA data, tumor and normal tissues data are not paired.
Next, cis-eQTL correlation analysis was performed with 55 pairs of samples from Peking University People's Hospital. The results showed a cis-eQTL correlation between the SNP rs1010208 genotype and the expression of HINT1, thereby, indicating that the target gene of SNP rs1010208 is HINT1. Nonetheless, no cis-eQTL correlation was detected between the SNP rs1010208 genotype and the expression of CDC42SE2. Thus, we observed that the expression of HINT1 and CDC42SE2 mRNA in cancer tissues was lower than that in the adjacent tissues (P-value < 0.001, Supplementary Figure S3). Subsequently, we validated the target gene of SNP rs1010208 in the specimens from Peking University People's Hospital and found that HINT1 not only presented a cis-eQTL correlation with SNPrs1010208 but also a statistically significant difference in the expression between tumor and adjacent tissues.
Role of SNP rs1010208 in target genes
We spliced the SNP rs1010208, the promoter region, and the fluorescent reporter group in a specific order referring to the sequence in Supplementary Figure S4 for four groups. Thus, it can be concluded from the data in Supplementary Figure S5 that group 1 had low F/R values because it consisted of only the fluorescent reporter group. However, the reason for higher F/R values from group 2 than those from group 3 or 4 requires an in-depth investigation. The F/R values from groups 3 and 4 were statistically different between the groups in both HCT116 and SW480 cells (P-value < 0.01). The results of both cell lines were consistent, indicating a difference in the expression of the target gene HINT1 between the wild-type and mutant in the regulatory region. In summary, the mutations in the regulatory region, SNP rs1010208 downregulates the expression of the target gene HINT1.
Function of the target gene HINT1
Next, we performed immunohistochemistry staining on 110 samples from Peking University People's Hospital to evaluate the expression of HINT1 in tumor tissues. HINT1 was expressed in both cytoplasm and nucleus, and significant differences were detected in the expression from patients with different stages of the tumor (P-value = 0.011; characteristics of the samples are listed in Supplementary Table S2, and the expression of HINT1 in tissues is shown in Supplementary Figure S6). Kaplan-Meier survival analysis showed a significantly high survival rate of patients with high HINT1 expression than that of those with low HINT1 expression (P-value = 0.013; Supplementary Figure S7). Additionally, Cox multivariate prognostic analysis showed that the level of HINT1 expression and lymph node metastasis status were independent factors for the CRC patient in prognosis (P-value < 0.01). The expression of HINT1 in patients with different stages of tumor varies and is related to the prognosis, rendering it to be a potential target for drug treatment.
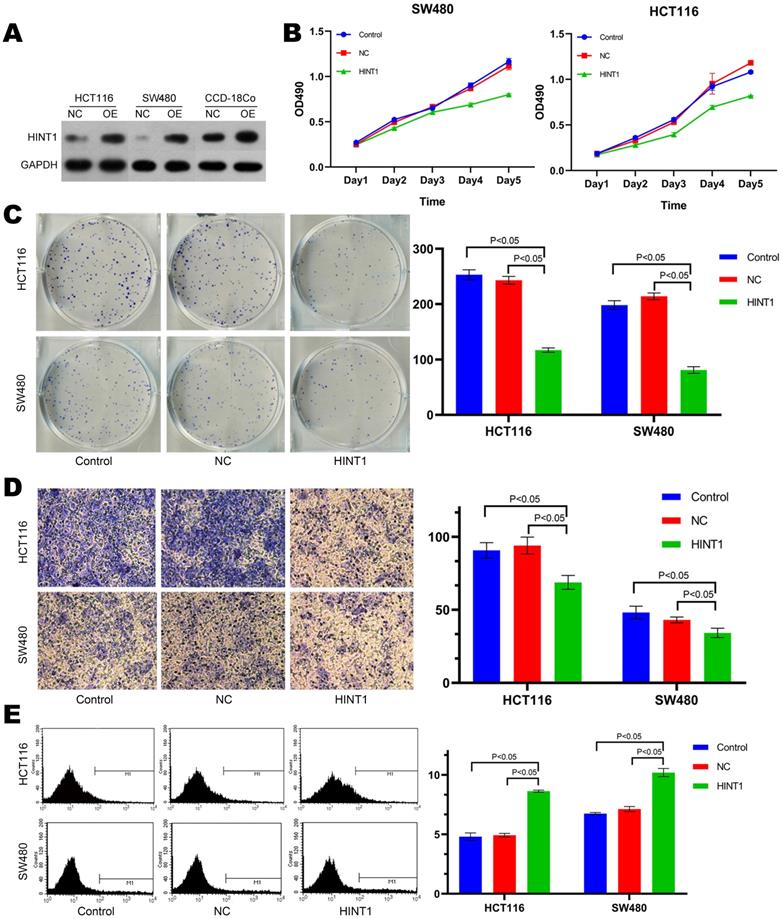
HCT116, SW480 and CCD-18Co cell lines were transfected with overexpressing lentivirus harboring the fluorescent HINT1 for 48 h. After digesting the cells, total protein was extracted and subjected to Western blotting with negative transfection as a control. The expression level of HINT1 in three cell lines was significantly different from that in the control group (NC) as shown in Figure 2A (P-value < 0.05). Subsequently, the MTT assay demonstrated that there was no difference in cell proliferation after the transfection of HINT1-overexpressing lentivirus compared with at 0 h. After 24, 48, 72, and 96 h, the overexpression of HINT1 significantly inhibited the proliferation of HCT116 and SW480 cell lines (P-value < 0.05, Figure 2B), the same result was also observed in the MTT assay of CCD-18Co cells (P-value < 0.05, Supplementary Figure S8A). In clone formation assay, after overexpression of HINT1, HCT116, SW480 and CCD-18Co cell lines all showed significant inhibitory effects (P-value < 0.05, Figure 2C and Supplementary Figure S8B). Next, we inoculated the cell lines and performed Transwell assay and Annexin V-APC single staining method to detect the ability of invasion, and apoptosis of the cell lines. Furthermore, the overexpression of HINT1 inhibited the invasion ability and increased the apoptosis of HCT116 and SW480 cell lines as compared to the control group (P-value < 0.05, Figure 2D and 2E). In the assay of CCD-18Co, it was found that cells could not pass through the membrane of transwell chamber, regardless of whether HINT1 overexpressed. However, after overexpression of HINT1, the apoptotic rate of CCD-18Co also increased (P-value < 0.05, Supplementary Figure S8C).
Effect of HINT1 on apoptosis in HCT116 cell line and SW480 cell line. (A) Changes in expression level of HINT1 in HCT116, SW480 and CCD-18Co cells after transfection. (B) Effect of HINT1 gene on the proliferation of HCT116 and SW480 cells. (C) Effect of HINT1 gene on the formation of HCT116 and SW480 cells. (D) Effect of HINT1 gene on the invasion of HCT116 and SW480 cells. (E) Effect of HINT1 gene on the apoptosis of HCT116 and SW480 cells.
Discussion
Screening for specific genetic variations that can truly explain the disease is challenging. We can integrate GWAS data with eQTL data to help us identify causal-related SNPs [7, 8]. In this study, we performed eQTL analysis using data from the TCGA database and validated potential functional SNPs in 30 matched cases from the GEO database and 55 cases from Peking University People's Hospital. We finally demonstrated that rs1010208 in the gene HINT1 was significantly associated with CRC risk in the Chinese population. The results of this study suggest that rs1010208 may reduce HINT1 expression by affecting TF binding upstream of the gene, resulting in a lower risk of CRC. The dual-luciferase reporter assay confirmed the potential function of rs1010208, and the SNP rs101028 mutation in the regulatory region down-regulated the expression of the target gene HINT1.
HINT1 belongs to the evolutionarily conserved HIT protein family and contains at least three members: HINT1, FHIT and GALT [9]. Previous studies have shown that HINT1 is a haploid-insufficient tumor suppressor gene [10, 11]. HINT1 interacts with Pontin and Reptin to inhibit T cell-mediated WNT transcription [12, 13]. HINT1 also up-regulates the expression of p53 and Bax (pro-apoptotic factor) and down-regulates the expression of Bcl-2 (apoptosis inhibitor), thereby participating in the cell apoptosis process [13]. In some cancers, the transcript of HINT1 is silenced or down-regulated, which confirms its important role in tumor formation. HINT1 inhibits the Wnt/β-catenin pathway in colorectal cancer cells and is associated with microphthalmia-related transcription factor activity in mast cells [14-18]. Genovese et al. found that HINT1 inhibits the transcriptional activities of MITF and β-catenin, both of which are immunoprecipitated with anti-HINT1-specific antibodies in malignant melanoma cells [18, 19]. The role of HINT1 in melanoma cells may be achieved by promoting the formation of non-functional complexes with oncogene transcription factors such as MITF and β-catenin [18, 19]. In addition to its inhibitory effect on tumor formation, HINT1 also plays a role in many pathophysiological states [20-23].
However, we confirmed that HINT1 is a tumor suppressor gene in colon cancer cells and there are still some limitations in our study. The area comprised in this study for fine mapping studies is limited, and no sites for remote regulation and rare mutations have been fine mapped in the current study, especially in intergenic and genetic desert areas [24]. Therefore, several functional sites or pathogenic sites are not yet detected, and thus, it is necessary to perform deep resequencing of these two regions to identify additional pathogenic sites. On the other hand, functional sites or pathogenic sites are related to the genetic difference between the population from which the SNPinfo database is derived and the Han population. These phenomena need further investigation of the genetic susceptibility mechanism underlying CRC.
After clarifying the target gene and its function, the next step is to explore the molecular mechanism of CRC. The disease-related SNP values included in NHGRI showed a moderate risk effect, and the correlation between complete knockout and heterozygous knockout needs to be considered when using disease model validation [25]. ZFN, TALEN, and CRISPR/Cas are the best ways to solve the above problems [26]. Thanks to advances in programming techniques, researchers are able to achieve precise modifications at the nucleotide level to clarify the functional significance of SNP mutations.
Conclusion
Fine mapping studies were performed on the susceptible regions, 5q23.3 and 17q12, which harbored the two susceptible loci rs12522693 and rs17836917 associated with the risk of CRC in the GWAS mentioned above in the Han population. Consequently, a novel potential functional locus, rs1010208 (chromosome 5), associated with susceptibility to CRC, downregulates the expression of the target gene HINT1, thereby inducing the proliferation and invasion of CRC. Together, the results of the present study provide a guiding significance for the genetic susceptibility mechanism underlying the CRC.
Abbreviations
CRC: Colorectal cancer; GWAS: Genome-wide association studies; Tag SNPs: Tag-single nucleotide polymorphisms; LD: Linkage disequilibrium; MAF: Minor allele frequency; TFBS: Transcription factor binding site; QC: Quality control; OR: Odds ratio; CI: Confidence interval; TCGA: The Cancer Genome Atlas; cis-eQTL: cis-expression quantitative trait loci; FDR: False discovery rate; real-time PCR: Real-time polymerase chain reaction; LSD: Least-significant difference.
Supplementary Material
Supplementary figures and tables.
Acknowledgements
Funding
This work was supported by the National Natural Science Foundation of China (Grant No. 81702363) and Key Research and Development project of Shandong Province (No. 2019GSF108161) in study design, the collection, analysis and interpretation of data, the writing of the report; and the decision to submit the article for publication.
Author contributions
Leping Li and Jizhun Zhang were responsible for designing of the study and critical review of manuscript; Kewei Jiang and Jizhun Zhang were responsible for designing and performing of the study, literature research and manuscript writing; Lipan Peng, Tao Xu and Hongqing Zhuo were responsible for data collections; Liang Lv and Fengying Du were responsible for data analysis; Yuezhi Chen and Liang Lv performed experiments.
Availability of data and material
The datasets used and/or analyzed during the current study are available from the corresponding author on reasonable request.
Informed consent
Informed consent was obtained from all individual participants included in the study.
Competing Interests
The authors have declared that no competing interest exists.
References
1. Bray F, Ferlay J, Soerjomataram I, Siegel RL, Torre LA, Jemal A. Global cancer statistics 2018: GLOBOCAN estimates of incidence and mortality worldwide for 36 cancers in 185 countries. CA Cancer J Clin. 2018;68:394-424
2. Chen W, Zheng R, Baade PD, Zhang S, Zeng H, Bray F. et al. Cancer statistics in China, 2015. CA Cancer J Clin. 2016;66:115-32
3. Mcclellan J, King MC. Genetic heterogeneity in human disease. Cell. 2010;141:210-7
4. Freedman ML, Monteiro ANA, Gayther SA, Coetzee GA, Risch A, Plass C. et al. Principles for the post-GWAS functional characterization of cancer risk loci. Nature Genetics. 2011;43:513-8
5. Jiang K, Sun Y, Cheng W, Ji J, Li Y, Ye Y. et al. Genome-wide association study identifies two new susceptibility loci for colorectal cancer at 5q23.3 and 17q12 in Han Chinese. Oncotarget. 2015;6:40327-36
6. Xu Z, Taylor JA. SNPinfo: integrating GWAS and candidate gene information into functional SNP selection for genetic association studies. Nucleic Acids Research. 2009;37:W600-5
7. Zhu Z, Zhang F, Hu H, Bakshi A, Robinson MR, Powell JE. et al. Integration of summary data from GWAS and eQTL studies predicts complex trait gene targets. Nat Genet. 2016;48:481-7
8. Martens JH, Kim B, Sharifi N, Janssen-Megens EM, Yaspo ML, Linser M. et al. Lineage-Specific Genome Architecture Links Enhancers and Non-coding Disease Variants to Target Gene Promoters. Cell. 2016;167:1369-84.e19
9. Charles BJB. Hint, Fhit, and GalT: function, structure, evolution, and mechanism of three branches of the histidine triad superfamily of nucleotide hydrolases and transferases. Bischemistry. 2002;41:9003-14
10. Li H, Balajee A, Hei T, Weinstein IB. The novel tumor suppressor HINT1 plays a role in DNA repair. Cancer Research. 2008;68:4325
11. Li H, Zhang YT, Santella RM, Weinstein IB. Hint1 is a haplo-insufficient tumor suppressor in mice. Oncogene. 2006;25:713-21
12. Jörg W, Otmar H. The histidine triad protein Hint1 interacts with Pontin and Reptin and inhibits TCF-beta-catenin-mediated transcription. J Cell Sci. 2005;118:3117-29
13. Jörg W, Otmar H. The histidine triad protein Hint1 triggers apoptosis independent of its enzymatic activity. J Biol Chem. 2006;281:27356-66
14. Huaying H, Xiaowei W, Xianwei S, Fengchang Q, Zhi X, Dongying G. et al. Clinical significance of expression of Hint1 and potential epigenetic mechanism in gastric cancer. Int J Oncol. 2011;38:1557-64
15. Wu XS, Bao TH, Ke Y, Sun DY, Shi ZT, Tang HR. et al. Hint1 suppresses migration and invasion of hepatocellular carcinoma cells in vitro by modulating girdin activity. Tumour Biol. 2016;37:1-9
16. Shi Z, Wu X, Yang K, Wang L. Hint1 Up-Regulates IκBα by Targeting the β-TrCP Subunit of SCF E3 Ligase in Human Hepatocellular Carcinoma Cells. Dig Dis Sci. 2016;61:785-94
17. Symes AJ, Marte E, Michael M, Joseph N, Alex F, Maria N. et al. Quantitative analysis of BTF3, HINT1, NDRG1 and ODC1 protein over-expression in human prostate cancer tissue. PLoS One. 2013;8:e84295
18. Genovese G, Ghosh P, Li H, Rettino A, Sioletic S, Cittadini A. et al. The tumor suppressor HINT1 regulates MITF and β-catenin transcriptional activity in melanoma cells. Cell Cycle. 2012;11:2206-15
19. Jonas SL, Jacqueline F, Stéphane T, Ruth CE. The intracellular domain of teneurin-1 induces the activity of microphthalmia-associated transcription factor (MITF) by binding to transcriptional repressor HINT1. J Biol Chem. 2015;290:8154-65
20. Laššuthová P, Brožková DŠ, Krůtová M, Neupauerová J, Haberlová J, Mazanec R. et al. Mutations in HINT1 are one of the most frequent causes of hereditary neuropathy among Czech patients and neuromyotonia is rather an underdiagnosed symptom. Neurogenetics. 2015;16:43-54
21. Shah R, Chou TF, Maize KM, Strom A, Finzel BC, Wagner CR. et al. Inhibition by divalent metal ions of human histidine triad nucleotide binding protein1 (hHint1), a regulator of opioid analgesia and neuropathic pain. Biochem Biophys Res Commun. 2017;491:760
22. Hui Z, Valérie R, Gert M, Peter DJ, Wim R, Diether L. et al. Exome sequencing reveals HINT1 mutations as a cause of distal hereditary motor neuropathy. Eur J Hum Genet. 2014;22:847-50
23. Dang YH, Liu ZW, Liu P, Wang JB. Emerging Roles of Histidine Triad Nucleotide Binding Protein 1 in Neuropsychiatric Diseases. Zhongguo Yi Xue Ke Xue Yuan Xue Bao. 2017;39:705-14
24. Hoehe MR. Haplotypes and the systematic analysis of genetic variation in genes and genomes. Pharmacogenomics. 2003;4:547-70
25. Manolio TA, Collins FS. The HapMap and Genome-Wide Association Studies in Diagnosis and Therapy. Annu Rev Med. 2009;60:443-56
26. Thomas G, Gersbach CA, Barbas CF. ZFN, TALEN, and CRISPR/Cas-based methods for genome engineering. Trends in Biotechnology. 2013;31:397-405
Author contact
![]() Corresponding author: Jizhun Zhang, Permanent address: Department of Gastrointestinal Surgery, Shandong Provincial Hospital Affiliated to Shandong University, jingwuweiqi street, 324, Jinan, Shandong 250021, China. Phone: 86-0531-68777117; Fax: 86-0531-68777198; E-mail: zhangjizhun2007com.
Corresponding author: Jizhun Zhang, Permanent address: Department of Gastrointestinal Surgery, Shandong Provincial Hospital Affiliated to Shandong University, jingwuweiqi street, 324, Jinan, Shandong 250021, China. Phone: 86-0531-68777117; Fax: 86-0531-68777198; E-mail: zhangjizhun2007com.