Impact Factor ISSN: 1837-9664

 Global reach, higher impact
J Cancer 2021; 12(3):693-702. doi:10.7150/jca.47978 This issue Cite
Research Paper
Diagnostic and prognostic value of FOXD1 expression in head and neck squamous cell carcinoma
Shijie Qiu1,2#, Dan Li3#, Zhisen Shen1,2, Qun Li1,2, Yi Shen1,2, Hongxia Deng1,2, Yidong Wu1,2, Chongchang Zhou1,2 ![]()
1. Department of Otorhinolaryngology Head and Neck Surgery, Ningbo Medical Center Lihuili Hospital, Ningbo, Zhejiang, China.
2. Department of Otorhinolaryngology Head and Neck Surgery, Lihuili Hospital affiliated to Ningbo University, Ningbo, Zhejiang, China.
3. Department of Cardiology, The Second Hospital of Yinzhou, Ningbo, Zhejiang, China.
#These authors contributed equally to this work.
Received 2020-5-9; Accepted 2020-11-4; Published 2021-1-1
Abstract
FOXD1 has been reported to function as an oncogene in several types of cancer. This study evaluated the expression of FOXD1 and its role in head and neck squamous cell carcinoma (HNSCC). We mined the Cancer Genome Atlas (TCGA) and Gene Expression Omnibus (GEO) databases for expression profiles, clinical significance, and potential mechanisms of FOXD1in HNSCC. Our validation cohort consisted of FOXD1 mRNA expression in 162 paired HNSCC and adjacent normal tissues, as determined using quantitative real-time polymerase chain reaction. FOXD1 expression was upregulated in HNSCC in the public databases and in the validation cohort. The expression level of FOXD1 was associated with DNA amplification and methylation level. The areas under the curves (AUC) of TCGA cohort and the validation cohort were 0.855 and 0.843, respectively. Furthermore, higher FOXD1 expression was significantly associated with worse overall survival (hazard ratio [HR]: 1.849, 95% confidence interval [CI]: 1.280-2.670, P = 0.001) and a lower rate of recurrence-free survival (HR: 1.650, 95% CI: 1.058-2.575, P = 0.027) in patients with HNSCC. Moreover, gene set enrichment analysis showed that cases of HNSCC with FOXD1 overexpression were enriched in bladder cancer, cell cycle, DNA replication, glycosaminoglycan biosynthesis chondroitin sulfate, homologous recombination, glycan biosynthesis, nucleotide excision repair, p53 signaling pathway, pyrimidine metabolism, and spliceosome pathways. In summary, FOXD1 was significantly upregulated in HNSCC and was a good diagnostic biomarker and an independent predictor of poor survival and low rate of recurrence-free survival in patients with HNSCC.
Keywords: FOXD1, bioinformatics, head and neck squamous cell carcinoma, prognosis, survival
Introduction
Head and neck cancer is the sixth most common cancer globally, and is comprised of malignant tumors in the oral cavity, oropharynx, hypopharynx, and larynx. Head and neck squamous cell carcinoma (HNSCC) is the predominant histological type (>90%) of head and neck cancer [1, 2]. The International Agency for Research on Cancer reported that the global incidence of HNSCC is more than one million new cases annually, and HNSCC results in 543,000 deaths per year [3]. Many studies have shown that tobacco exposure and alcohol consumption are important risk factors for the development of HNSCC [4, 5]. Recently, human papillomavirus (HPV) has also been shown to be a strong and independent risk factor for the development of HNSCC [6]. Management of HNSCC requires a multi-faceted approach that includes surgery, radiation, and/or chemotherapy. Although substantial progress has been made in treatment of HNSCC, outcomes remain poor, especially in patients with advanced disease. The 5-year survival rate is approximately 50%, which represents only a slight improvement over the last two decades [7]. This poor survival rate may be due to late diagnosis, low therapeutic response rates, and high rates of recurrence and metastasis [8]. Furthermore, reliable and specific biomarkers for diagnosis and prognosis of HNSCC are lacking. Therefore, it is critical to determine the molecular correlates of HNSCC and to identify reliable biomarkers for diagnosis, prognosis, and monitoring of recurrence, which would allow for improved personalized treatment strategies for patients with HNSCC.
Forkhead box D1 (FOXD1), located on chromosome 5q12, belongs to the forkhead box transcription factor family, and is involved in numerous physiological processes and biological functions, such as embryonic development and organogenesis, cell cycle regulation, control of metabolism, stem cell niche maintenance, and signal transduction [9, 10]. FOXD1 was identified and described for the first time in the forebrain neuroepithelium and is considered an important factor during retinal development [11]. Furthermore, FOXD1 was found to be a mediator of successful progression of cell reprogramming through self-renewal and differentiation [12, 13]. Recent studies showed that FOXD1 was associated with carcinogenesis, tumor progression, and metastasis in numerous cancers [14-16]. FOXD1 was reported to be overexpressed in colorectal cancer tissues, and expression levels correlated with tumor size, differentiation, tumor node and metastasis (TNM) stage, lymph node metastasis, and poor prognosis [17]. FOXD1 has also been shown to be highly expressed in non-small cell lung cancer, and promoted cell proliferation, migration, invasion, and metastasis through activation of Vimentin [18]. Zhao et al. found that FOXD1 was up-regulated in breast cancer tissues and promoted cell proliferation and chemotherapeutic drug resistance by targeting p27 expression [19]. These findings suggested that FOXD1 may function as an oncogene in several cancers. However, the role of FOXD1 in HNSCC has not been characterized.
In the present study, we evaluated FOXD1 mRNA expression in HNSCC using data from The Cancer Genome Atlas (TCGA) database and the Gene Expression Omnibus (GEO) database. We also investigated the association of FOXD1 expression with clinicopathological parameters and evaluated its potential as a diagnostic biomarker of HNSCC. Furthermore, we assessed the prognostic value of FOXD1 for overall survival (OS) and recurrence-free survival (RFS). We performed gene set enrichment analysis (GSEA) to identify FOXD1 related signaling pathways involved in tumorigenesis and progression of HNSCC. In addition, tissue samples from patients for whom clinicopathological and survival data were available were analyzed to validate the results of the bioinformatic analysis.
Materials and methods
Mining analysis using the Cancer Genome Atlas (TCGA) dataset
Level-3 FOXD1 RNA-seq data consisting of 520 HNSCC tissues and 44 normal controls were downloaded from the University of Santa Cruz Xena browser (https://xenabrowser.net, up to June 11, 2019). Related clinicopathological data including sample type, age at initial pathologic diagnosis, gender, histological types, smoking history, alcohol history, anatomic neoplasm subdivision, HPV status by p16 testing, perineural invasion present, histologic grade pathologic T, pathologic N, pathologic stage, OS status, OS time, RFS status, RFS time, DNA methylation, and gistic2 threshold-processed copy-number alteration (-1: copy deletion; 0: no change; +1: amplification) were obtained for secondary analysis. The β values of cg23454038 probes mapping 200 bp downstream of the transcription start sites of FOXD1 were defined as the FOXD1 promoter methylation level.
Mining analysis using the Gene Expression Omnibus (GEO) dataset
The keywords “head and neck squamous cell carcinoma” were used to search the GEO database (https://www.ncbi.nlm.nih.gov/gds/), and FOXD1 expression profiles from GSE6631 [19] were downloaded. The platform for GSE6631 was GPL8300, [HG_U95Av2] Affymetrix Human Genome U95 Version 2 Array, which contains twenty-two paired head and neck squamous cell carcinoma samples and adjacent normal tissue.
Clinical sample collection
One hundred sixty-two surgical specimens from patients with HNSCC, including tumor and adjacent normal tissues, were collected (125 male and 37 female, age 38‑79 years; average age 61.7‑years of age). The patients were diagnosed based on clinical features and histopathological examination at the Ningbo Medical Centre Lihuili Hospital (Ningbo, China) and the Affiliated Tumor Hospital of Xiangya Medical School (Changsha, China) from February 2014 to November 2018. Upon removal, specimens were immediately placed in RNA-fixer Reagent (Bioteke, Beijing, China) and stored at -80 °C until be used in experiments. None of the patients underwent radiation or chemotherapy prior to surgery. Histological type was identified independently by two experienced pathologists. Clinicopathological features were collected from medical records, and tumor stages were classified according to the 8th Edition HNSCC TNM staging system of the American Joint Committee on Cancer (AJCC) [20]. During the follow-up period, 11 patients were censored, and 72 patients died. The median patient follow-up time was 27.2 months. Overall survival time was defined as the period between pathological diagnosis and death. This study was approved by the Ethics Committee of the Ningbo Medical Centre Lihuili Hospital and the Affiliated Tumor Hospital of Xiangya Medical School. All patients provided written informed consent.
Total RNA preparation and real-time quantitative reverse transcription polymerase chain reaction (qRT-PCR)
Total RNA was extracted from specimens using TRIzol reagent (Invitrogen, Carlsbad, CA, USA), then reverse transcribed into cDNA using GoScript Reverse Transcription (RT) System (Promega, Madison, WI, USA) following the manufacturer's instructions. Quantitative RT-PCR was performed using GoTaq qPCR Master Mix (Promega, Madison, WI, USA) on a LightCycler 480 real-time PCR System (Roche, Basel, Switzerland). Glyceraldehyde-3-phosphate dehydrogenase (GAPDH) was used as an internal reference. The primers were synthesized by Huada Biotech Ltd. (Shen Zhen, China). The specific primer sequences in the experiment were as follows: FOXD1: 5′-TGAGCACTGAGATGTCCGATG-3′ (forward primer) and 5′-CACCACGTCGATGTCTGTTTC-3′ (reverse primer), GAPDH: 5′-CCATGGAGAAGGCTGGGG-3′ (forward primer) and 5′- CAAAGTTGTCATGGATGACC -3′ (reverse primer). The thermal cycling program was as follows: 95 °C for 10 min, then 45 cycles at 95 °C for 20 s, 57 °C for 35 s, and 72 °C for 30 s. Cycle threshold (Ct) values were recorded, and all results were expressed as means of three independent experiments. FOXD1 expression levels were analyzed using the 2-ΔCt method [21].
Survival analysis
Patients with HNSCC for whom FOXD1 expression and survival data were collected were divided into 2 groups (low and high FOXD1 expression) based on the maximum Youden index of the receiver operating characteristic (ROC) curves for death and recurrence. Overall survival and RFS were compared between the high and low FOXD1 expression groups using Kaplan-Meier analysis with the log-rank test. Univariate and multivariate Cox proportional hazards models were performed to evaluate the relative risk factors associated with OS or RFS, and hazard ratios (HR) with 95% confidence intervals (CI) were obtained for each variable. Only significant factors in the univariate analysis were included in the multivariate analysis.
Gene set enrichment analysis (GSEA) resulted in identification of FOXD1-related signaling pathways in HNSCC
Gene set enrichment analysis was performed to identify potential mechanisms of FOXD1 in development of HNSCC. Samples from TCGA were divided into high and low FOXD1 expression groups based on the median FOXD1 expression. MsigDB Collection (h.all.v6.2.symbols.gmt) was used as a reference for GSEA. Significantly enriched pathways related to tumor biological process were selected according to normalized enrichment score (NES) with 1000 permutations. A pathway was regarded as significantly enriched when the P-value was less than 0.05.
Statistical analysis
Statistical Program for Social Sciences (SPSS) 20.0 software (SPSS Inc., Chicago, IL, USA) and R 3.1.2 software (https://www.r-project.org/) were used to perform statistical analysis and to generate figures. Between-group comparisons of FOXD1 expression and the correlation between FOXD1 expression and clinicopathological features were performed using independent or paired Student's t-tests, as appropriate. Receiver operating characteristic curves were generated, and areas under the curves (AUC) were calculated to determine the diagnostic power of FOXD1 in HNSCC. The cut-off point was defined as the maximum Youden index. Pearson correlation coefficients were generated to evaluate the association between FOXD1 mRNA expression and FOXD1 DNA methylation levels. P ≤ 0.05 was considered statistically significant.
Results
FOXD1 was upregulated in patients with HNSCC
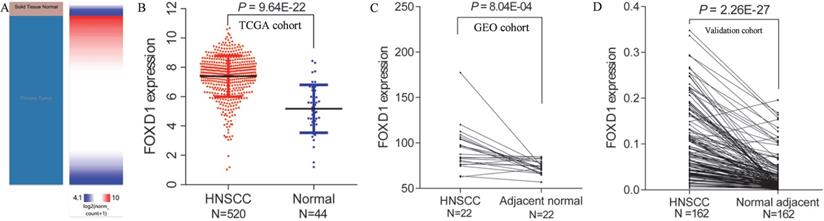
Using Xena browser, we reviewed FOXD1 mRNA expression in 520 HNSCC and 44 normal tissues in TCGA database. The results indicated that FOXD1 mRNA expression was significantly higher in HNSCC tissues than that in normal tissues (P = 9.64E-22, Figure 1A and B). Similarly, FOXD1 was significantly upregulated in one dataset (containing 22 pairs of HNSCC and adjacent normal tissues) obtained from the GEO database (P = 8.04E-4, Figure 1C). To further investigate the expression of FOXD1 in HNSCC, we collected HNSCC tissue and adjacent normal tissue from 162 patients with HNSCC for use as a validation cohort. Quantitative RT-PCR analysis showed that FOXD1 expression was significantly higher in HNSCC tissues than that in normal tissues (P = 2.26E-27, Figure 1D).
Differential expression of FOXD1 in HNSCC and normal tissue in TCGA and GEO databases. The heatmap (A) and plot (B) showed that HNSCC tissues (N=520) had significantly elevated FOXD1 expression levels compared with those in normal tissues (N=44) in TCGA database. FOXD1 expression was higher in HNSCC tissues than in adjacent normal tissues in the GEO database (C). FOXD1 was significantly overexpressed in HNSCC tissues compared with adjacent normal tissues in the validation cohort (D).
Association between FOXD1 expression and clinicopathological features of patients with HNSCC in The Cancer Genome Atlas (TCGA) database. Bold font indicates statistically significant differences
| Characteristics | N | Mean±SD | P value |
|---|---|---|---|
| Gender | |||
| Female | 136 | 7.372±1.556 | 0.814 |
| Male | 384 | 7.405±1.341 | |
| Age | |||
| <60y | 233 | 7.379±1.360 | 0.761 |
| ≥60y | 286 | 7.416±1.432 | |
| Not available | 1 | ||
| Smoking history | |||
| No | 117 | 7.745±1.336 | 0.003 |
| Yes | 391 | 7.306±1.400 | |
| Not available | 12 | ||
| Alcohol history | |||
| No | 162 | 7.356±1.504 | 0.66 |
| Yes | 347 | 7.415±1.365 | |
| Not available | 11 | ||
| Histologic grade | |||
| G1+2 | 366 | 7.402±1.334 | 0.603 |
| G3+4 | 132 | 7.330±1.578 | |
| Not available | 22 | ||
| Tumor site | |||
| Oral cavity\Oropharynx\Hypopharynx | 404 | 7.522±1.300 | 0.001 |
| Larynx | 116 | 9.961±1.631 | |
| HPV status | |||
| Negative | 73 | 7.298±1.148 | 0.906 |
| Positive | 38 | 7.263±1.644 | |
| Not available | 409 | ||
| Perineural invasion | |||
| Negative | 193 | 7.376±1.410 | 0.087 |
| Positive | 169 | 7.614±1.204 | |
| Not available | 158 | ||
| Pathologic tumor category | |||
| Tis/T1/T2 | 185 | 7.497±1.269 | 0.315 |
| T3/T4 | 273 | 7.362±1.491 | |
| Not available | 62 | ||
| Pathologic nodal category | |||
| No | 176 | 7.261±1.345 | 0.062 |
| Yes | 244 | 7.518±1.455 | |
| Not available | 100 | ||
| Pathologic stage | |||
| I+II | 101 | 7.322±1.339 | 0.446 |
| III+IV | 347 | 7.444±1.438 | |
| Not available | 72 |
Relationship between FOXD1 expression levels and clinicopathological factors
We examined the correlation between FOXD1 expression and clinicopathological features of patients with HNSCC. In the TCGA cohort, we found that patients with HNSCC who did not smoke, and had tumors located in the larynx, had significantly elevated FOXD1 expression. However, FOXD1 expression was not associated with age, gender, alcohol history, histologic grade, HPV status, perineural invasion, tumor category, nodal category, or pathologic stage (Table 1). Furthermore, FOXD1 expression was not significantly associated with any clinicopathological factors in the validation cohort (Table 2).
Association between FOXD1 expression and clinicopathological features of patients with HNSCC patients in our validation cohort
| Characteristics | N | Mean±SD | P value |
|---|---|---|---|
| Gender | |||
| Female | 37 | 0.091±0.073 | 0.794 |
| Male | 125 | 0.094±0.076 | |
| Age | |||
| <60y | 73 | 0.100±0.083 | 0.300 |
| ≥60y | 89 | 0.878±0.069 | |
| Smoking history | |||
| No | 58 | 0.104±0.080 | 0.170 |
| Yes | 104 | 0.087±0.072 | |
| Alcohol history | |||
| No | 105 | 0.088±0.074 | 0.237 |
| Yes | 57 | 0.103±0.076 | |
| Histologic grade | |||
| Well/moderately | 112 | 0.098±0.077 | 0.296 |
| Poorly | 50 | 0.084±0.070 | |
| Tumor site | |||
| Oral cavity/Oropharynx/Hypopharynx | 129 | 0.093±0.075 | 0.838 |
| Larynx | 33 | 0.096±0.078 | |
| Tumor invasion | |||
| Tis/T1/T2 | 61 | 0.096±0.068 | 0.732 |
| T3/T4 | 101 | 0.092±0.080 | |
| Lymphatic metastasis | |||
| No | 67 | 0.090±0.074 | 0.586 |
| Yes | 95 | 0.096±0.077 | |
| Clinical stage | |||
| I+II | 77 | 0.088±0.067 | 0.361 |
| III+IV | 85 | 0.099±0.082 |
The diagnostic value of FOXD1 for HNSCC
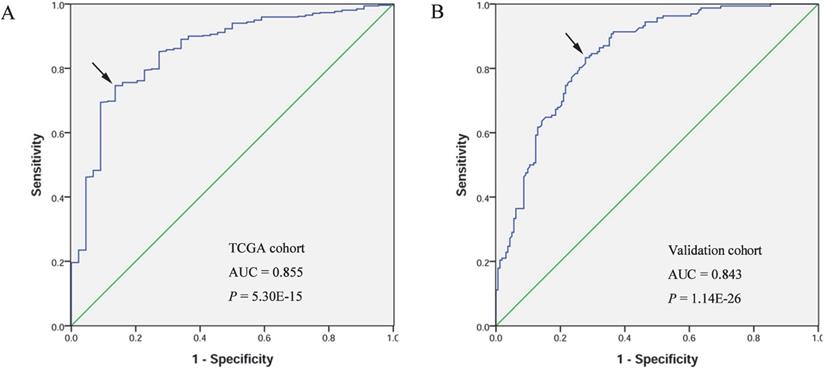
A receiver operating characteristic (ROC) curve was generated and the area under the ROC curve (AUC) was calculated to evaluate the diagnostic value of FOXD1. The AUC of TCGA cohort was 0.855, with sensitivity and specificity values of 0.746 and 0.864, respectively. In the validation cohort, the AUC was 0.843, with sensitivity and specificity values of 0.833 and 0.722, respectively (Figure 2).
Diagnostic value of FOXD1 expression in patients with HNSCC. Receiver operating characteristic curve of FOXD1 in HNSCC from TCGA cohort (A). Receiver operating characteristic curve of FOXD1 in HNSCC in the validation cohort (B). AUC: area under the curve.
High FOXD1 expression was an independent risk factor for poor OS in patients with HNSCC
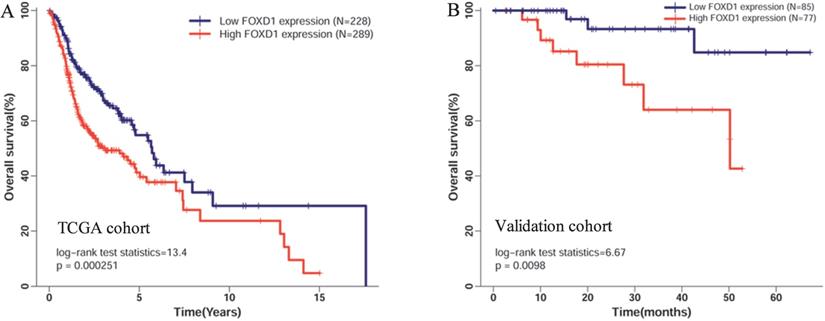
Five hundred seventeen patients with complete FOXD1 expression and overall survival data in TCGA cohort were divided into high expression (289 patients) and low expression groups (228 patients) according to the maximum Youden index of the ROC curve for death. The Kaplan-Meier curve showed that high mRNA expression of FOXD1 was associated with poor overall survival rate (Figure 3A, log-rank P = 2.51E-4). To further assess the prognostic value of FOXD1, we collected follow-up information from 162 patients with HNSCC. These results showed that patients with high FOXD1 expression had worse overall survival than patients with lower FOXD1 expression (Figure 3B, log-rank P = 0.0098). Subsequently, a Cox proportional hazard regression model was used to screen prognostic factors for patients with HNSCC in TCGA database. As shown in the Table 3, univariate analysis showed that older age (HR = 1.318, 95% CI: 1.003-1.731, P = 0.045), female (HR = 1.349, 95% CI: 1.014-1.796, P = 0.040), positive perineural invasion (HR = 2.135, 95% CI: 1.516-3.007, P = 1.42E-05), advanced pathologic stage (HR = 1.754, 95% CI: 1.203-2.558, P = 0.004), and high FOXD1 expression (HR = 1.665, 95% CI: 1.264-2.194, P = 2.93E-04) were significantly associated with poor OS in patients with HNSCC. Using significant factors identified in the univariate analysis, multivariate analysis confirmed that high FOXD1 expression (HR = 1.849, 95% CI: 1.280-2.670, P = 0.001), positive perineural invasion (HR = 2.051, 95% CI: 1.436-2.931, P = 7.90E-05), and advanced pathologic stage (HR = 1.739, 95% CI: 1.051-2.877, P = 0.31) were independent risk factors for poor OS in patients with HNSCC.
Kaplan-Meier curves of overall survival in patients with HNSCC with high and low FOXD1 expression in (A) the TCGA cohort and (B) the validation cohort. Overall survival time in the high FOXD1 expression group was shorter than that in the low expression group in TCGA database (Log-rank P = 2.51E-4). The Kaplan-Meier curve of the validation cohort showed that high FOXD1 expression was associated with significantly worse OS (Log-rank P = 0.01).
Univariate and multivariate Cox proportional hazard regression analysis of clinicopathologic features and FOXD1 expression for overall survival. Bold font indicates statistically significant differences
| Variables | Univariate analysis | Multivariate analysis | ||||
|---|---|---|---|---|---|---|
| HR | 95% CI | P | HR | 95% CI | P | |
| Age (≥ 60y vs. <60y) | 1.318 | 1.003-1.731 | 0.045 | 1.042 | 0.736-1.476 | 0.815 |
| Gender (Female vs. male) | 1.349 | 1.014-1.796 | 0.040 | 0.957 | 0.647-1.417 | 0.827 |
| Smoking history (Yes vs. No) | 1.123 | 0.803-1.572 | 0.498 | |||
| Alcohol history (Yes vs. No) | 0.942 | 0.709-1.252 | 0.680 | |||
| Histologic grade (G3/4 vs. G1/2) | 0.867 | 0.637-1.180 | 0.363 | |||
| Perineural invasion (positive vs. negative) | 2.135 | 1.516-3.007 | 1.42E-05 | 2.051 | 1.436-2.931 | 7.90E-05 |
| Pathologic stage (III/IV vs. I/II) | 1.754 | 1.203-2.558 | 0.004 | 1.739 | 1.051-2.877 | 0.031 |
| FOXD1 expression (High vs. Low) | 1.665 | 1.264-2.194 | 2.93E-04 | 1.849 | 1.280-2.670 | 0.001 |
High FOXD1 expression was an independent factor for poor RFS in patients with HNSCC patients
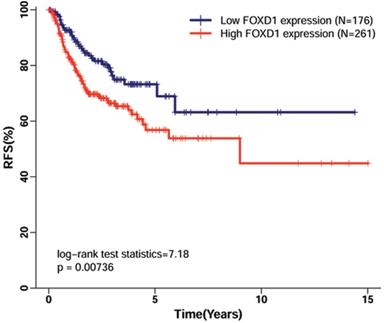
Using TCGA dataset, which contained follow-up data for HNSCC recurrence in 438 patients, we evaluated the association of FOXD1 expression with RFS in patients with HNSCC. The Kaplan-Meier curve for RFS showed that high FOXD1 expression was associated with poor RFS (Figure 4, log-rank P = 0.007). This finding was further confirmed by univariate Cox proportional hazard analysis (Table 4), in which patients with high FOXD1 expression in tumors were at significantly increased risk of recurrence compared to patients with low FOXD1 expression in tumors (HR = 1.725, 95% CI: 1.152-2.583, P = 0.008). Subsequently, multivariate analysis showed that high FOXD1 expression was an independent risk factor for RFS in patients with HNSCC (HR = 1.650, 95% CI: 1.058-2.575, P = 0.008) after adjustment for significant prognostic clinicpathological parameters (smoking history and pathologic stage).
Kaplan-Meier curves of recurrence-free survival in patients with HNSCC with high and low FOXD1 expression. The Kaplan-Meier curves showed that high FOXD1 expression predicted reduced rate of recurrence-free survival in patients with HNSCC (Log-rank P = 0.007).
Univariate and multivariate Cox proportional hazard regression analysis of clinicopathologic features and FOXD1 expression for recurrence-free survival. Bold font indicates statistically significant differences
| Variables | Univariate analysis | Multivariate analysis | ||||
|---|---|---|---|---|---|---|
| HR | 95% CI | P | HR | 95% CI | P | |
| Age (≥ 60y vs. <60y) | 1.210 | 0.829-1.765 | 0.323 | |||
| Gender (Female vs. male) | 1.006 | 0.654-1.546 | 0.979 | |||
| Smoking history (Yes vs. No) | 0.959 | 0.622-1.480 | 0.851 | |||
| Alcohol history (Yes vs. No) | 1.762 | 1.111-2.794 | 0.016 | 1.532 | 0.947-2.478 | 0.082 |
| Histologic grade (G3/4 vs. G1/2) | 0.753 | 0.481-1.180 | 0.216 | |||
| Perineural invasion (positive vs. negative) | 1.517 | 0.968-2.378 | 0.069 | |||
| Pathologic Stage (III/IV vs. I/II) | 2.398 | 1.303-4.411 | 0.005 | 2.285 | 1.237-4.220 | 0.008 |
| FOXD1 expression (High vs. Low) | 1.725 | 1.152-2.583 | 0.008 | 1.650 | 1.058-2.575 | 0.027 |
FOXD1 expression was related to DNA copy number alteration and promoter methylation in HNSCC
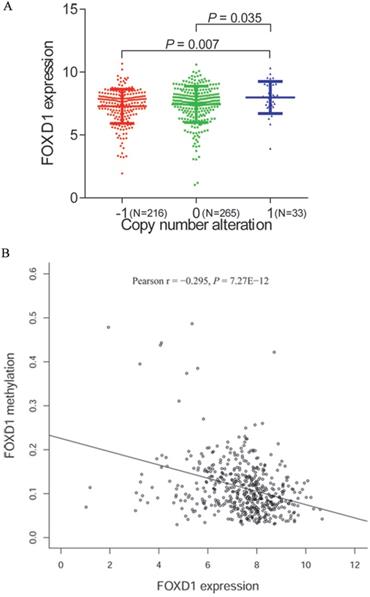
To further investigate the mechanism of FOXD1 overexpression in HNSCC, we examined the association of FOXD1 expression with copy number alterations and promoter methylation using TCGA database. Among 514 patients for whom FOXD1 DNA copy number was determined, 33 cases (14.5%) showed DNA amplification (+1) and 216 cases (31.8%) showed copy deletion (-1). We showed that DNA amplification was associated with increased FOXD1 expression (P = 0.007, compared to the copy deletion group, Figure 5A). Subsequently, we observed a negative correlation (Person r = -0.295, P = 7.27E-12) between FOXD1 expression and promoter methylation (Figure 5B).
FOXD1 expression may be modulated by changes in DNA copy number and DNA methylation. Comparison of FOXD1 RNA expression based on copy number (A). FOXD1 RNA expression was significantly negatively correlated to promoter methylation levels (Pearson r = -0.295, P = 7.27E-12). -1: copy deletion; 0: no change; +1: amplification.
GSEA identified FOXD1-related signaling pathways in HNSCC
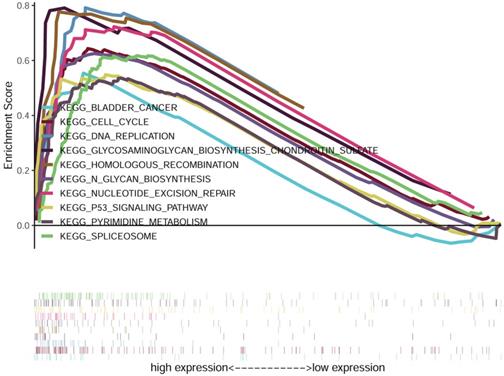
We compared the low and high FOXD1 groups using GSEA analysis to identify FOXD1-related signaling pathways activated in HNSCC. The results showed significant differences in gene sets (false discovery rate [FDR] P-value < 0.05) in the enrichment of MSigDB Collection (h.all.v6.2.symbols.gmt). Detailed results are provided in Table 5. The results showed that bladder cancer, cell cycle, DNA replication, glycosaminoglycan biosynthesis chondroitin sulfate, homologous recombination, glycan biosynthesis, nucleotide excision repair, p53 signaling pathway, pyrimidine metabolism, and spliceosome were enriched in the high FOXD1 expression group (Figure 6).
Gene set enriched in HNSCC samples with high FOXD1 expression. NES: normalized enrichment score; NOM: nominal; FDR: false discovery rate
| Gene set name | NES | NOM p-val | FDR q-val |
|---|---|---|---|
| KEGG_NUCLEOTIDE_EXCISION_REPAIR | 2.068 | < 0.001 | 0.020 |
| KEGG_GLYCOSAMINOGLYCAN_BIOSYNTHESIS_CHONDROITIN_SULFATE | 2.051 | 0.002 | 0.015 |
| KEGG_CELL_CYCLE | 2.047 | 0.002 | 0.011 |
| KEGG_BLADDER_CANCER | 1.952 | < 0.001 | 0.032 |
| KEGG_HOMOLOGOUS_RECOMBINATION | 1.935 | < 0.001 | 0.032 |
| KEGG_N_GLYCAN_BIOSYNTHESIS | 1.897 | 0.008 | 0.034 |
| KEGG_DNA_REPLICATION | 1.870 | 0.008 | 0.046 |
| KEGG_PYRIMIDINE_METABOLISM | 1.856 | 0.006 | 0.041 |
| KEGG_SPLICEOSOME | 1.837 | 0.018 | 0.045 |
Gene set enrichment analysis (GSEA) of HNSCC samples in TCGA dataset. The results of GSEA showed that bladder cancer, cell cycle, DNA replication, glycosaminoglycan biosynthesis chondroitin sulfate, homologous recombination, glycan biosynthesis, nucleotide excision repair, p53 signaling pathway, pyrimidine metabolism, and spliceosome were enriched in the FOXD1 overexpression group.
Discussion
Recently, FOXD1 has been reported to be highly expressed in several cancers, such as colorectal cancer [17], lung cancer [18], breast cancer [19], and Hodgkin's lymphoma [22]. Increased FOXD1 expression has been shown to promote cell proliferation, migration, invasion, and tumorigenesis. However, the role of FOXD1 in HNSCC has not been well characterized. The Cancer Genome Atlas (TCGA) was a large-scale effort to comprehensively characterize 33 major cancer types, including HNSCC, for which 528 cases were included [23]. Our study using TCGA database showed that FOXD1 mRNA expression was higher in HNSCC tissue than in normal tissue. The HNSCC mRNA microarray dataset GSE6631 was downloaded from the GEO database. The GEO database is a public functional genomics data repository that includes array- and sequence-based gene profiles and next-generation sequencing [24]. Analysis of the GEO dataset showed that FOXD1 was significantly upregulated in HNSCC tissues compared with corresponding adjacent normal tissues. Furthermore, we collected 162 paired HNSCC tissues and adjacent normal tissues to validate our bioinformatics analysis. Quantitative RT-PCR analysis confirmed that FOXD1 mRNA was significantly overexpressed in HNSCC tissues. These findings indicated that FOXD1 may function as an oncogene in HNSCC.
HNSCC is a heterogeneous group of tumors located in the upper aerodigestive tract with multifactorial etiologies. Alcohol consumption, betel nut chewing, and human papillomavirus infection are significant risk factors for development of HNSCC in the upper gastrointestinal tract [25-28]. In contrast, tobacco smoking is a significant risk factor for development of HNSCC in the upper respiratory tract [29, 30]. In the present study, we found that tumors located in the upper respiratory tract (larynx) showed significantly higher FOXD1 expression levels than those in the upper gastrointestinal tract (oral cavity, oropharynx and hypopharynx), which suggested that laryngeal squamous cell carcinoma may be more susceptible to FOXD1 overexpression.
Early diagnosis is critical to successful management of cancer [31, 32]. More than half of HNSCC patients are at advanced stages at the time of diagnosis because of concealment of the anatomical site and lack of specific and reliable indicators. Furthermore, the age of diagnosis is slowly decreasing [33]. Therefore, identification of biomarkers for early diagnosis of HNSCC is of great importance. In the current study, ROC curves were generated, and AUC values were calculated to evaluate FOXD1 expression as a potential diagnostic marker of HNSCC. The AUC values of TCGA cohort and the validation cohort were 0.855 and 0.843, respectively. Compared to traditional tumor markers, such as CEA (Carcino Embryonic Antigen), SCC (Squamous Cell Carcinoma Antigen), TPS (Tissue Polypeptide Specific Antigen), and CYFRA 21-1 [34, 35], FOXD1 had a greater ability to discriminate patients with HNSCC from healthy individuals, which indicated that FOXD1 could serve as a potential early diagnostic biomarker for HNSCC, especially when combined with other efficient markers.
Molecular characteristics, pathogenesis, and prognosis of head and neck cancers are heterogeneous. Several studies have shown that HPV-positive patients with HNSCC showed significantly improved overall and disease-free survival compared with HPV-negative patients [6, 36]. Development of new technologies, such as microarray technology and next-generation sequencing, have allowed for collection of large amounts of data for molecular subclassification of cancer, which has allowed for development of individualized treatment programs [37, 38]. Recent studies showed that overexpression of FOXD1 were associated with poor OS in colorectal cancer [17], non-small cell lung cancer [18], and breast cancer [19]. Consistent with these studies, the log-rank test performed in our study showed that high FOXD1 expression was associated with significantly worse OS in both TCGA cohort and the validation cohort. In addition, multivariate proportional hazard Cox regression analysis showed that high FOXD1 expression could serve as an independent indicator of poor prognosis in patients with HNSCC, which suggested that FOXD1 may be a promising prognostic biomarker and therapeutic target for HNSCC. Recurrence rate is believed to be an important contributor to the poor prognosis associated with HNSCC [39]. Approximately 30-40% of patients with HNSCC suffer from recurrence or metastasis following treatment [40]. In our study, multivariate Cox regression analysis showed that FOXD1 was an independent predictor of recurrence. This result suggested that monitoring FOXD1 expression may improve outcomes in patients with HNSCC.
Cancer results from accumulation of genetic and epigenetic modifications of oncogenes and tumor-suppressor genes, resulting in metabolic dysfunction and uncontrolled proliferation [41, 42]. Amplification of DNA is the major genetic change that results in cancer-specific expression of critical genes [43, 44]. In addition, DNA methylation is an important epigenetic modification involved in the inactivation of numerous tumor suppressor genes [45, 46]. Therefore, we explored the association of FOXD1 expression with copy number alterations and promoter methylation levels to determine the mechanism of FOXD1 overexpression in HNSCC. The results showed that DNA amplification was associated with elevated FOXD1 RNA expression. In addition, we also found that FOXD1 RNA expression was negatively correlated with promoter methylation level. These findings indicated that both genetic and epigenetic alterations contributed to dysregulation of FOXD1 in HNSCC. Gene set enrichment analysis showed that bladder cancer, cell cycle, DNA replication, glycosaminoglycan biosynthesis chondroitin sulfate, homologous recombination, glycan biosynthesis, nucleotide excision repair, p53 signaling pathway, pyrimidine metabolism, and spliceosome may be key pathways regulated by FOXD1 in HNSCC. These findings should be further validated by rigorous in vitro and in vivo experiments.
Conclusion
In summary, our analysis showed that FOXD1 expression was significantly elevated in HNSCC tissues relative to normal tissues in TCGA database, the GEO database, and the validation cohort. Genetic and epigenetic alterations contributed to upregulation of FOXD1 in HNSCC. In addition, elevated FOXD1 expression was a good diagnostic biomarker and independent predictor of poor OS and RFS in patients with HNSCC. Furthermore, FOXD1 overexpression was significantly associated with bladder cancer, cell cycle, DNA replication, nucleotide excision repair, and p53 signaling pathways. Future studies are needed to characterize the specific role of FOXD1 in HNSCC.
Acknowledgements
This work was supported by the Ningbo Health Branding Subject Fund (No. PPXK2018-02), National Natural Science Foundation of China (No.81670920), Zhejiang Provincial Medical and Health Science Research Foundation (No. 2020RC107), Zhejiang Provincial Natural Science Foundation of China (No. LQ21H130001), Medical and Health Research Project of Zhejiang Province (2018RC063 and 2021KY307), Ningbo Natural Science Foundation (No. 202003N4239), and Ningbo Huimin Technology Research and Development Project Fund (No. 2015C50026).
Authors' contributions
SQ and DL wrote the original draft. ZS and CZ reviewed and edited the draft. QL and HD contributed to the data curation. YD contributed to the formal analysis. CZ contributed to the conceptualization. YS contributed to revise the manuscript. All authors have given approval to the final version of the manuscript.
Competing Interests
The authors have declared that no competing interest exists.
References
1. Gupta B, Johnson NW, Kumar N. Global Epidemiology of Head and Neck Cancers: A Continuing Challenge. Oncology. 2016;91:13-23
2. Siegel RL, Miller KD, Jemal A. Cancer statistics, 2019. CA Cancer J Clin. 2019;69:7-34
3. Bray F, Ferlay J, Soerjomataram I, Siegel RL, Torre LA, Jemal A. Global cancer statistics 2018: GLOBOCAN estimates of incidence and mortality worldwide for 36 cancers in 185 countries. CA Cancer J Clin. 2018;68:394-424
4. Dhull AK, Atri R, Dhankhar R, Chauhan AK, Kaushal V. Major Risk Factors in Head and Neck Cancer: A Retrospective Analysis of 12-Year Experiences. World J Oncol. 2018;9:80-4
5. Liu Z, Liu H, Han P, Gao F, Dahlstrom KR, Li G. et al. Apoptotic capacity and risk of squamous cell carcinoma of the head and neck. Eur J Cancer. 2017;72:166-76
6. Ang KK, Harris J, Wheeler R, Weber R, Rosenthal DI, Nguyen-Tan PF. et al. Human papillomavirus and survival of patients with oropharyngeal cancer. N Engl J Med. 2010;363:24-35
7. Pulte D, Brenner H. Changes in survival in head and neck cancers in the late 20th and early 21st century: a period analysis. Oncologist. 2010;15:994-1001
8. Jou A, Hess J. Epidemiology and Molecular Biology of Head and Neck Cancer. Oncol Res Treat. 2017;40:328-32
9. Golson ML, Kaestner KH. Fox transcription factors: from development to disease. Development. 2016;143:4558-70
10. Hannenhalli S, Kaestner KH. The evolution of Fox genes and their role in development and disease. Nat Rev Genet. 2009;10:233-40
11. Hatini V, Tao W, Lai E. Expression of winged helix genes, BF-1 and BF-2, define adjacent domains within the developing forebrain and retina. J Neurobiol. 1994;25:1293-309
12. Fetting JL, Guay JA, Karolak MJ, Iozzo RV, Adams DC, Maridas DE. et al. FOXD1 promotes nephron progenitor differentiation by repressing decorin in the embryonic kidney. Development. 2014;141:17-27
13. Koga M, Matsuda M, Kawamura T, Sogo T, Shigeno A, Nishida E. et al. Foxd1 is a mediator and indicator of the cell reprogramming process. Nat Commun. 2014;5:3197
14. Cheng P, Wang J, Waghmare I, Sartini S, Coviello V, Zhang Z. et al. FOXD1-ALDH1A3 Signaling Is a Determinant for the Self-Renewal and Tumorigenicity of Mesenchymal Glioma Stem Cells. Cancer Res. 2016;76:7219-30
15. Nakayama S, Soejima K, Yasuda H, Yoda S, Satomi R, Ikemura S. et al. FOXD1 expression is associated with poor prognosis in non-small cell lung cancer. Anticancer Res. 2015;35:261-8
16. van der Heul-Nieuwenhuijsen L, Dits NF, Jenster G. Gene expression of forkhead transcription factors in the normal and diseased human prostate. BJU Int. 2009;103:1574-80
17. Pan F, Li M, Chen W. FOXD1 predicts prognosis of colorectal cancer patients and promotes colorectal cancer progression via the ERK 1/2 pathway. Am J Transl Res. 2018;10:1522-30
18. Li D, Fan S, Yu F, Zhu X, Song Y, Ye M. et al. FOXD1 Promotes Cell Growth and Metastasis by Activation of Vimentin in NSCLC. Cell Physiol Biochem. 2018;51:2716-31
19. Zhao YF, Zhao JY, Yue H, Hu KS, Shen H, Guo ZG. et al. FOXD1 promotes breast cancer proliferation and chemotherapeutic drug resistance by targeting p27. Biochem Biophys Res Commun. 2015;456:232-7
20. Huang SH, O'Sullivan B. Overview of the 8th Edition TNM Classification for Head and Neck Cancer. Curr Treat Options Oncol. 2017;18:40
21. Gheysarzadeh A, Sadeghifard N, Afraidooni L, Pooyan F, Mofid MR, Valadbeigi H. et al. Serum-based microRNA biomarkers for major depression: MiR-16, miR-135a, and miR-1202. J Res Med Sci. 2018;23:69
22. Nagel S, Meyer C, Kaufmann M, Drexler HG, MacLeod RA. Deregulated FOX genes in Hodgkin lymphoma. Genes Chromosomes Cancer. 2014;53:917-33
23. Cheng PF, Dummer R, Levesque MP. Data mining The Cancer Genome Atlas in the era of precision cancer medicine. Swiss Med Wkly. 2015;145:w14183
24. Barrett T, Wilhite SE, Ledoux P, Evangelista C, Kim IF, Tomashevsky M. et al. NCBI GEO: archive for functional genomics data sets-update. Nucleic Acids Res. 2013;41:D991-5
25. Chen YJ, Chang JT, Liao CT, Wang HM, Yen TC, Chiu CC. et al. Head and neck cancer in the betel quid chewing area: recent advances in molecular carcinogenesis. Cancer Sci. 2008;99:1507-14
26. Kawakita D, Matsuo K. Alcohol and head and neck cancer. Cancer Metastasis Rev. 2017;36:425-34
27. Taberna M, Mena M, Pavon MA, Alemany L, Gillison ML, Mesia R. Human papillomavirus-related oropharyngeal cancer. Ann Oncol. 2017;28:2386-98
28. Tanaka TI, Alawi F. Human Papillomavirus and Oropharyngeal Cancer. Dent Clin North Am. 2018;62:111-20
29. Peterson LA, Bellile EL, Wolf GT, Virani S, Shuman AG, Taylor JM. et al. Cigarette use, comorbidities, and prognosis in a prospective head and neck squamous cell carcinoma population. Head Neck. 2016;38:1810-20
30. Sterba KR, Garrett-Mayer E, Carpenter MJ, Tooze JA, Hatcher JL, Sullivan C. et al. Smoking status and symptom burden in surgical head and neck cancer patients. Laryngoscope. 2017;127:127-33
31. Kreppel M, Safi AF, Scheer M, Nickenig HJ, Zoller J, Preuss S. et al. The importance of early diagnosis in patients with maxillary sinus carcinoma. Eur Arch Otorhinolaryngol. 2016;273:2629-35
32. Lang GD, Konda VJ. Early diagnosis and management of esophageal and gastric cancer. Minerva Gastroenterol Dietol. 2013;59:357-76
33. Marur S, Forastiere AA. Head and Neck Squamous Cell Carcinoma: Update on Epidemiology, Diagnosis, and Treatment. Mayo Clin Proc. 2016;91:386-96
34. Barak V, Meirovitz A, Leibovici V, Rachmut J, Peretz T, Eliashar R. et al. The Diagnostic and Prognostic Value of Tumor Markers (CEA, SCC, CYFRA 21-1, TPS) in Head and Neck Cancer Patients. Anticancer Res. 2015;35:5519-24
35. Rudhart SA, Schultz JD, Gehrt F, Pavel FL, Birk R, Hoch M. et al. CYFRA 21-1: a suitable tumor marker in patients with head and neck cutaneous squamous cell carcinoma? Eur Arch Otorhinolaryngol. 2019;12:3467-75
36. Fakhry C, Zhang Q, Nguyen-Tan PF, Rosenthal D, El-Naggar A, Garden AS. et al. Human papillomavirus and overall survival after progression of oropharyngeal squamous cell carcinoma. J Clin Oncol. 2014;32:3365-73
37. Li J, Zhou C, Ni S, Wang S, Ni C, Yang P. et al. Methylated claudin-11 associated with metastasis and poor survival of colorectal cancer. Oncotarget. 2017;8:96249-62
38. Zhou C, Ye M, Ni S, Li Q, Ye D, Li J. et al. DNA methylation biomarkers for head and neck squamous cell carcinoma. Epigenetics. 2018;13:398-409
39. Leemans CR, Braakhuis BJ, Brakenhoff RH. The molecular biology of head and neck cancer. Nat Rev Cancer. 2011;11:9-22
40. Argiris A, Karamouzis MV, Raben D, Ferris RL. Head and neck cancer. Lancet. 2008;371:1695-709
41. Byler S, Goldgar S, Heerboth S, Leary M, Housman G, Moulton K. et al. Genetic and epigenetic aspects of breast cancer progression and therapy. Anticancer Res. 2014;34:1071-7
42. Pasha HF, Mohamed RH, Toam MM, Yehia AM. Genetic and epigenetic modifications of adiponectin gene: Potential association with breast cancer risk. J Gene Med. 2019 p: e3120
43. Hyman E, Kauraniemi P, Hautaniemi S, Wolf M, Mousses S, Rozenblum E. et al. Impact of DNA amplification on gene expression patterns in breast cancer. Cancer Res. 2002;62:6240-5
44. Prapinjumrune C, Morita K, Kuribayashi Y, Hanabata Y, Shi Q, Nakajima Y. et al. DNA amplification and expression of FADD in oral squamous cell carcinoma. J Oral Pathol Med. 2010;39:525-32
45. Gyorffy B, Bottai G, Fleischer T, Munkacsy G, Budczies J, Paladini L. et al. Aberrant DNA methylation impacts gene expression and prognosis in breast cancer subtypes. Int J Cancer. 2016;138:87-97
46. Perri F, Longo F, Giuliano M, Sabbatino F, Favia G, Ionna F. et al. Epigenetic control of gene expression: Potential implications for cancer treatment. Crit Rev Oncol Hematol. 2017;111:166-72
Author contact
![]() Corresponding author: Chongchang Zhou, Department of Otorhinolaryngology Head and Neck Surgery, Ningbo Medical Center Lihuili Hospital, Ningbo, Zhejiang, China. E-mail: zhou900709900709com; Tel: 86-15267851938.
Corresponding author: Chongchang Zhou, Department of Otorhinolaryngology Head and Neck Surgery, Ningbo Medical Center Lihuili Hospital, Ningbo, Zhejiang, China. E-mail: zhou900709900709com; Tel: 86-15267851938.