Impact Factor ISSN: 1837-9664

 Global reach, higher impact
J Cancer 2021; 12(3):860-873. doi:10.7150/jca.48141 This issue Cite
Research Paper
Deltex3 inhibits Epithelial Mesenchymal Transition in Papillary Thyroid Carcinoma via promoting ubiquitination of XRCC5 to regulate the AKT signal pathway
Lidong Wang1, Yonglian Huang1, Chenxi Liu1, Mingyue Guo1, Zhennan Ma1, Jingni He1, Ailian Wang2, Xiaodan Sun3, Zhen Liu1 ![]()
1. Department of General Surgery, Shengjing Hospital of China Medical University, Shenyang, China.
2. Department of Pathology, Shengjing Hospital of China Medical University, Shenyang, China.
3. Department of Pathology, First Affiliated Hospital and College of Basic Medical Sciences, China Medical University, Shenyang, China.
Received 2020-5-13; Accepted 2020-11-2; Published 2021-1-1
Abstract
Background: Papillary thyroid carcinoma (PTC) is one of the most common endocrine malignant tumors. Poor prognoses such as high recurrence rate always appear in PTC patients with cervical lymph node metastasis. The process of ubiquitination plays important roles in PTC. As ubiquitin E3 ligases, Deltex (DTX) family proteins were reported to associate with multiple cancers. However, functions and mechanisms of DTX3 in PTC are currently unknown.
Methods: In this study, DTX3 expressions were examined in 114 PTC and paired paracancerous normal tissues through quantitative real-time polymerase chain reaction and western blot. The clinical significances of DTX3 expressions in PTC patients were also investigated. After stable transfection with either short hairpin RNA to knock down DTX3 expression or full-length complementary DNA to upregulate DTX3 expression, changes of malignant phenotypes in two PTC cell lines K1 and TPC-1 were observed using cell viability, flow cytometry, wound healing and transwell assays. Afterwards, altered expressions of epithelial-mesenchymal transition (EMT) and AKT signal pathway related proteins were measured by western blot. Immunoprecipitation and mass spectrometry (IP-MS), immunofluorescence and Co-IP were utilized to identify the possible DTX3 interacting proteins.
Results: Both mRNA and protein expressions of DTX3 were lower in PTC tissues and correlated with the presence of cervical lymph node metastasis (P<0.05). DTX3 overexpression inhibited migration and invasion of PTC cells, decreased Vimentin and phosphorylated AKT expressions, but promoted E-cadherin expression (P<0.05). Moreover, knockdown of DTX3 led to opposite changes (P<0.05). Total 46 probable DTX3 interacting proteins were identified by IP-MS. Among them, X-ray repair cross-complementing protein 5 (XRCC5) and NADH: Ubiquinone Oxidoreductase Complex Assembly Factor 5 (NDUFAF5) were verified to be associated with DTX3. Moreover, DTX3 was proved to be co-localized with XRCC5 in nucleus and promote ubiquitination of XRCC5.
Conclusions: DTX3 suppresses EMT by partially facilitating ubiquitination of XRCC5 to inhibit AKT signal pathway in PTC.
Keywords: papillary thyroid carcinoma, Deltex3, epithelial-mesenchymal transition, AKT signal pathway, XRCC5
Introduction
Papillary thyroid carcinoma (PTC), with increasing incidence in recent years, is the most prevalent type of thyroid carcinoma [1-3]. As treatments of PTC have been greatly improved, most patients with PTC can be treated by properly applied surgery and postoperative regular thyroxine suppressive therapy alone or with postoperative radioactive iodine therapy [4-7]. However, a growing body of evidence indicated that the presence of cervical lymph node metastasis varied from 69.6% to 85% in PTC patients, which was considered as an extremely high risk factor of PTC recurrence [8-10]. So, it is very important to study and understand the underlying molecular mechanisms related to the metastasis of PTC.
Ubiquitination plays significant roles in tumor cells [11]. Ubiquitin E3 ligase can recognize target specificity and catalyze the combination of ubiquitin with the substrate [12]. Deltex (DTX) family proteins belong to ubiquitin E3 ligases [13]. The classic structures of DTX family proteins are divided into three parts, including a C-terminal ubiquitin E3 ligase domain of RING finger, a motif with rich prolines and the WWE domains at N-terminus [14]. Notably, the structure of DTX3 exists within a special truncated N-terminal domain lacking homology to other DTX proteins [15]. DTX1, as a member of DTX proteins, has been already reported to influence the progression of tumor cells, which indicated that DTX family proteins played critical roles in tumor cells [16].
To date, little is known about the roles of DTX3 in the progression of PTC. In the present study, we evaluated DTX3 expressions in 114 PTC tissues and paired paracancerous normal tissues. Meanwhile, we compared the correlations between DTX3 expressions and clinicopathological characteristics of patients with PTC. Then, we determined the effects and mechanisms of DTX3 on cell proliferation, apoptosis, cell cycle, migration, invasion, and epithelial-mesenchymal transition (EMT) of PTC cells. In addition, we assessed the probable DTX3 interacting proteins in PTC cells. With these results, this study will enhance our understanding of DTX3 functions in PTC.
Materials and methods
Patients and clinicopathological data
The interactive web application of Gene Expression Profiling Interactive Analysis (GEPIA) was used to visualize the gene expressions of DTX3 in multiple human carcinomas and normal tissues of The Cancer Genome Atlas (TCGA) by box plots.
Total 114 samples of PTC patients who received surgical therapy were selected from March 2018 to March 2019 in Shengjing Hospital of China Medical University. Several exclusion and inclusion criteria were considered when selecting participants. The inclusion criteria were as follows: The age of patients was 18-80 years; Patients with PTC were all found and diagnosed for the first time; No treatment was accepted before surgery; Neck Color Doppler Ultrasound or Computed Tomography was at least evaluated before surgery; Pathological diagnosis was PTC. The exclusion criteria included cases with incomplete clinicopathological data; patients who received radiotherapy or chemotherapy before surgery; and, patients with previous thyroid surgery history.
Paracancerous tissues of the same PTC patients were collected at least 2 cm away from PTC areas. The age of patients, the tumor size and cervical lymph node metastasis were classified based on the Classification System for Differentiated Thyroid Carcinoma in the 8th edition of the American Joint Committee on Cancer (AJCC) [17]. Clinical data was retrieved from patients' clinical records and presented in Table 1. All tissue specimens and clinical data were collected following protocols approved by the Ethics Committee of Shengjing Hospital of China Medical University.
The correlation analysis of DTX3 mRNA and protein expressions in patients with PTC
| Parameters | Total | mRNA | P-value | Protein | P-value |
|---|---|---|---|---|---|
| Age (years) | 0.610 | 0.415 | |||
| <55 | 76 | 0.510±0.272 | 0.566±0.267 | ||
| ≥55 | 38 | 0.483±0.259 | 0.521±0.296 | ||
| Gender | 0.438 | 0.498 | |||
| Male | 32 | 0.532±0.280 | 0.579±0.294 | ||
| Female | 82 | 0.489±0.262 | 0.540±0.271 | ||
| Tumor diameter | 0.299 | 0.138 | |||
| ≤ 2 cm | 48 | 0.532±0.245 | 0.596±0.263 | ||
| > 2 cm | 66 | 0.479±0.281 | 0.518±0.284 | ||
| Cervical lymph node metastasis | 0.002* | 0.001* | |||
| No | 40 | 0.607±0.261 | 0.663±0.282 | ||
| Yes | 74 | 0.444±0.254 | 0.490±0.255 | ||
| Multifocality | 0.919 | 0.947 | |||
| No | 61 | 0.499±0.270 | 0.552±0.274 | ||
| Yes | 53 | 0.504±0.265 | 0.549±0.282 | ||
| Extra-capsular invasion | 0.137 | 0.281 | |||
| No | 69 | 0.531±0.281 | 0.573±0.280 | ||
| Yes | 45 | 0.455±0.239 | 0.516±0.271 | ||
*P<0.05.
Cell culture
Human thyroid epithelial cell line Nthy-ori3-1, PTC cell lines K1 and TPC-1 were cultured. Nthy-ori3-1 and K1 were purchased from the European Collection of Cell Cultures and TPC-1 was gifted by Professor Lei Yang (China Medical University, China). K1 was cultured in a medium mixture of Dulbecco's modified Eagle's medium, Ham's F12 (Corning Life Sciences, NY, USA) and MCDB105 (Sigma-Aldrich St.Louis, Missouri) at a 1:2:1 ratio, which supplemented with 10% fetal bovine serum (FBS; Gibco Co., Grand Island, NY, USA), 100 U/mL penicillin, 100 mg/mL streptomycin, and 2 mmol/L glutamine (Sigma-Aldrich). Nthy-ori3-1 and TPC-1 were grown in Roswell Park Memorial Institute-1640 medium (Corning Life Sciences, NY, USA) and supplemented with 10% FBS, 100 U/mL penicillin, 100 mg/mL streptomycin, and 2 mmol/L glutamine in a humidified incubator with 5% CO2 at 37°C.
Nuclear and cytoplasmic protein extract
Nuclear and cytoplasmic protein extracts of K1 and TPC-1 cells were separated and collected with the Nuclear and Cytoplasmic Protein Extraction Kit (P0027, Beyotime Biotechnology, China), according to the manufacturer's protocols.
Plasmid construction and transfection
DTX3 short hairpin RNA (shRNA) and its negative control (neg-shRNA) were designed and synthesized into hU6-MCS-CMV-GFP-SV40-Neomycin plasmid (GeneChem Co., Ltd, Shanghai, China). The DTX3-shRNA target sequence is listed as 5'-GCGAGACTTCTGACATCTA-3'. The shRNA and neg-shRNA transfections were according to the manufacturer's protocols of Lipofectamine 3000 (Invitrogen, Carlsbad, CA). For stable transfection, PTC cells with G418 resistance were selected (0.5 mg/mL for K1 and 0.6 mg/mL for TPC-1).
Lentivirus construction and transfection
Human full-length DTX3 complementary DNA (cDNA) was constructed into pSlenti-EF1a-mcherry-P2A-Puro-CMV-DTX3-3Flag lentivirus vector. PTC cells were transfected with DTX3-cDNA or neg-vector, as the negative control for DTX3-cDNA, according to the manufacturer's protocols respectively (Obio Technology Co., Ltd, Shanghai, China). For stable transfection, PTC cells with puromycin resistance were selected (2.0 mg/mL for K1 and 3.0 mg/mL for TPC-1).
RNA extraction and quantitative real-time polymerase chain reaction (qRT-PCR)
Total RNA was extracted using Trizol (Code No. 9109, Takara Bio Inc, Japan) according to the manufacturer's instructions. cDNA was synthesized by reverse transcription using PrimeScript™ RT reagent Kit with gDNA Eraser (Code No. RR047A, Takara Bio Inc, Japan). qRT-PCR analysis was performed on a Roche LightCycler 480 II system according to the manufacturer's protocol. Primer sequences are listed in Table 2. The housekeeping gene glyceraldehyde-3-phosphate dehydrogenase (GAPDH) was used as an internal control.
Primers used in this study
| Gene | Primer sequence | Product size (bp) |
|---|---|---|
| DTX3 | Forward: 5'- CCAGCGTCTCACCTTCACTATCG -3' | 86 |
| Reverse: 5'- TGGTCTTGTGGTGGATGTCGTTC -3' | ||
| GADPH | Forward: 5'-GCACCGTCAAGGCTGAGAAC-3' | 138 |
| Reverse: 5'-TGGTGAAGACGCCAGTGGA-3' |
Western blot analysis (WB)
To extract total protein, RIPA Lysis Buffer (P0013B, Beyotime Biotechnology, China) with protease inhibitor phenylmethanesulfonyl fluoride (PMSF; ST506, Beyotime Biotechnology, China) and protease inhibitor cocktail (K1011, APExBIO Technology LLC) were added into tissues and cells. The homogenate was centrifuged at 14,000×g for 45 min at 4 °C. 40 μg total protein samples were separated by sodium dodecyl sulfate-polyacrylamide gel electrophoresis (SDS-PAGE) and then transferred to a polyvinylidene fluoride (PVDF) membrane. 5% bovine serum albumin (BSA) was used to block the membranes for 2 h at room temperature. Then, the membranes were incubated with specific primary antibodies overnight at 4 °C. Then, the membranes were incubated with secondary antibodies for 2 h at room temperature. Antibodies used in this study included the following: rabbit polyclonal anti-DTX3 (1:1000, cat. no. 25304-1-AP, Proteintech Group Inc), rabbit polyclonal anti-Vimentin (1:1000, cat. no. 10366-1-AP, Proteintech Group Inc), mouse monoclonal anti-E-cadherin (1:2000, cat. no. 60335-1-Ig, Proteintech Group Inc), rabbit polyclonal anti-N-cadherin (1:2000, cat. no. 22018-1-AP, Proteintech Group Inc), rabbit monoclonal anti-AKT (1:1000, cat. no. #4691, Cell Signaling Technology Inc), rabbit monoclonal anti-Phospho-AKT (1:2000, cat. no. #4060, Cell Signaling Technology Inc), rabbit monoclonal anti-NDUFAF5 (1:1000, cat. no. ab192235, Abcam Inc), rabbit polyclonal anti-GAPDH (1:10000, cat. no. 10494-1-AP, Proteintech Group Inc), rabbit monoclonal anti-Histone H3 (1:2000, cat. no. #4499, Cell Signaling Technology Inc), rabbit polyclonal anti-tubulin (1:10000, cat. no. 11224-1-AP, Proteintech Group Inc), rabbit polyclonal anti-XRCC5 (1:1000, cat. no. 16389-1-AP, Proteintech Group Inc), rabbit polyclonal anti-ubiquitin (1:1000, cat. no. 10201-2-AP, Proteintech Group Inc) and peroxidase-conjugated goat anti-rabbit or anti-mouse IgG (H+L) (1:3000, Zhongshan Goldenbridge Company, Beijing, China) as the secondary antibody. Enhanced chemiluminescence kit (P0018AS, Beyotime Biotechnology, China) was performed to show the binding conditions between antigens and antibodies. The integrated optical density (IOD) of each band was measured with the Image-Pro Plus 6.0 software (Media Cybernetics Inc., Rockville, MD). The ratio between the IOD of target protein and internal control in the same sample was calculated as the relative protein expression of the target protein.
Cell viability assay
96-well plates were seeded in 3×10³ cells per well. 20 μL 3-(4,5-dimethylthiazol-2-yl)-5-(3-carboxymethoxyphenyl)-2-(4-sulfophenyl)-2H-tetrazolium (MTS; Promega, USA) was added into designated wells and incubated at 37 °C for 4 h in a humidified, 5% CO2 atmosphere. After 10 s of vortexing, the optical density (OD) value at a wavelength of 490 nm was measured and indicated the viability of cells. The average OD value represented five individual wells.
Flow cytometry analysis
Cells were harvested and washed with phosphate-buffered saline (PBS) for twice. For cell apoptosis, Annexin V-PE and 7-aminoactinomycin D (7-AAD) solution (Keygentec, Nanjing, China) were added to each sample for incubating 15 min in the dark. For cell cycle analysis, cells were mixed with 70% ethanol for overnight at 4 °C, washed with cold PBS and centrifugally harvested at 1000 rpm for 5 min. The supernatants were resuspended in Propidium Iodide (PI) and Ribonuclease A (RNase A) staining buffers (Keygentec, Nanjing, China) for 15-20 min in the dark. The fluorescent signals were detected by flow cytometry (BD FACSCalibur) within 1 h. Living cells were in PE-/7-AAD- quadrant, early apoptotic cells were in PE+/7-AAD- quadrant and late apoptotic cells were in PE+/7-AAD+ quadrant.
Wound-healing assay
When cells were cultured 95-100% confluence in 6-well plates, 200 μL pipette tips were selected to scratch the cell monolayer to make a straight gap. After washing twice with PBS, cells remained in well were incubated in serum-free medium to diminish cell proliferation for 24 h. At both 0 h and 24 h, the wounded gaps were photographed with a light microscope (Nikon E100, Japan), at 100× magnification. The average cell migration areas were measured and analyzed from 5 different areas for each wound. The percentage of wound closure was calculated as followed: (original denuded area at 0 h - actual denuded area at 24 h) / original denuded area at 0 h×100%.
Matrigel invasion assay
24-well Transwell chambers with an 8 mm pore size (Corning Incorporated, NY, USA) were precoated with Matrigel (BD Biosciences, Bedford, MA). 600 μL medium supplemented with 10% FBS was added to each lower chamber. 3×10⁴ cells in 200 μL serum-free medium were seeded in each upper chamber and cultured for 24 h. Fixed with 4% paraformaldehyde for 15 min and stained with 0.1% crystal violet for 15 min, cells invaded to the lower surface of the membrane were pictured and counted in 5 random fields (200× magnification).
Immunoprecipitation and mass spectrometry (IP-MS)
Cells were harvested and lysed in IP lysis buffer (cat. no. P0013, Beyotime Biotechnology, China) with PMSF and protease inhibitor cocktail for 30 min at 4 °C. Samples were then centrifuged at 14,000×g for 45 min at 4 °C. 20 μL of supernatant was saved as the “input”. Either primary antibody or normal IgG antibody was added to the remaining cell lysis and then gently rotated overnight at 4 °C. Primary antibodies included: mouse monoclonal anti-DTX3 antibody (cat. no. sc-376439, Santa Cruz Biotechnology, Inc), rabbit polyclonal anti-XRCC5 (cat. no. 16389-1-AP, Proteintech Group Inc), rabbit monoclonal anti-NDUFAF5 (cat. no. ab192235, Abcam Inc), normal mouse IgG antibody (cat. no. A7028, Beyotime Biotechnology, China) and normal rabbit IgG antibody (cat. no. #2729, Cell Signaling Technology Inc). 20 μL Protein A/G PLUS-Agarose beads (cat. no. sc-2003, Santa Cruz Biotechnology, Inc) were added to the cell lysate and then rotated for 2 h at 4 °C. The beads were washed with IP lysis buffer and centrifuged at 3000 rpm for 5 min to harvest. After washed 4 times, the beads were boiled with either 120 μL SDT buffer (4% SDS, 100 mM Tris-HCl, 1 mM DTT, pH 7.6) or 20 μL 2×loading buffer for 10 min at 100 °C. Tubes were centrifuged at 14,000×g for 10 min and the supernatants were transferred to new tubes at 4 °C. The solution in SDT buffer was prepared for MS analysis (Shanghai Applied Protein Technology Co., LTD). The solution in 2×loading buffer was prepared for WB.
Immunofluorescence
4×10⁴ cells per well were cultured in 24-well plates. After adherence, cells were fixed by 4% paraformaldehyde for 15 min at room temperature. After washed with PBS, cells were blocked in 5% normal goat serum with 0.3% Triton-X100 for 30 min. Cells were incubated with a mixture of primary antibodies for overnight at 4℃ after washed with PBS. The primary antibodies used were as follows: mouse monoclonal anti-DTX3 (1:100, cat. no. sc-376439, Santa Cruz Biotechnology, Inc) and rabbit polyclonal anti-XRCC5 (1:200, cat. no. 16389-1-AP, Proteintech Group Inc). Then cells were washed with PBS 3 times for 5 min and incubated with a mixture of secondary antibodies, goat anti-mouse IgG Dylight 594 (1:100) and goat anti-rabbit IgG Dylight 488 (1:100), for 1 h. For nuclei staining, cells were counterstained with DAPI (cat. no. C0065, Solarbio Life Sciences) for 5 min and mounted with Antifading Mounting Medium (cat. no. S2100, Solarbio Life Sciences) for confocal image acquisition (400× magnification).
Bioinformation analysis
WEB-based GEne SeT AnaLysis Toolkit (WebGestalt) were utilized to visualize Gene ontology (GO) and the Kyoto Encyclopedia of Genes and Genomes (KEGG) enrichment analysis [18]. The Search Tool for the Retrieval of Interacting Genes (STRING) database was visualized for protein-protein interaction (PPI). The cBioPortal for Cancer Genomics was analyzed the co-expression genes of DTX3 in PTC [19-21].
Statistical analysis
Each experiment was performed at least three times. Data is provided as mean ± standard deviation. SPSS 24.0 statistical software for Windows (SPSS, Inc., Chicago, IL, USA) was used for analysis. Graphing was performed in GraphPad Prism 7. The T-test was used to assess the results of qRT-PCR and WB expressions of DTX3 in PTC and paired paracancerous normal tissues and applied to calculate correlations between DTX3 expressions and clinicopathologic characteristics of PTC. Multiple group comparison's test, such as ANOVA, was used to compare the differences. When P<0.05, the results were considered statistically significant.
Results
The expressions of DTX3 are lower in multiple carcinomas including PTC and closely associated with cervical lymph node metastasis of patients with PTC
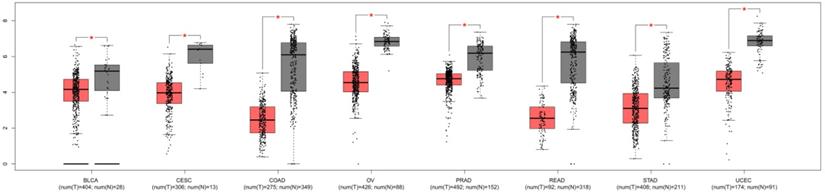
To explore the significances of DTX3 in PTC, we searched GEPIA websites to compare the expressions of DTX3 in different carcinomas and normal tissues of TCGA database. As shown in Figure 1, the results of box plots showed that the expressions of DTX3 were significantly lower in at least 8 different kinds of carcinomas than those in paired normal tissues, such as bladder urothelial carcinoma (BLCA), colon adenocarcinoma (COAD), ovarian serous cystadenocarcinoma (OV) and prostate adenocarcinoma (PRAD) (P<0.05). The result of box plot for thyroid carcinoma was also similar and shown in Figure 2A.
The expressions of DTX3 in multiple carcinomas of TCGA database. T: tumor; N: normal tissue; BLCA: bladder urothelial carcinoma; CESC: cervical squamous cell carcinoma and endocervical adenocarcinoma; COAD: colon adenocarcinoma; OV: ovarian serous cystadenocarcinoma; PRAD: prostate adenocarcinoma; READ: rectum adenocarcinoma; STAD: stomach adenocarcinoma; UCEC: uterine corpus endometrial carcinoma; UCS: uterine carcinosarcoma. *P < 0.05.
mRNA and protein relative expressions of DTX3 in PTC tissues, PTC cell lines and peritumoral nonmalignant tissues and cell line. (A) DTX3 gene expressions in thyroid carcinoma (T) and normal tissues (N) of TCGA database. (B) Relative protein expressions of DTX3 in PTC tissues and peritumoral nonmalignant tissues. Lower panel: Integrated optical density (IOD) of DTX3 protein was presented as relative expression level after normalization with internal control GAPDH. (C) Relative mRNA expressions of DTX3 in PTC tissues and peritumoral nonmalignant tissues. (D) Relative protein expressions of DTX3 in human thyroid epithelial cell line Nthy-ori3-1, PTC cell lines K1 and TPC-1. Lower panel: IOD of DTX3 protein was presented as relative expression level after normalization with internal control GAPDH. (E) Relative mRNA expressions of DTX3 in human thyroid epithelial cell line Nthy-ori3-1, PTC cell lines K1 and TPC-1. (F) The subcellular localization of DTX3 in K1 and TPC-1 cells. Histone H3 was used as internal control of nucleus and tubulin was used as internal control of cytoplasm. *P < 0.05.
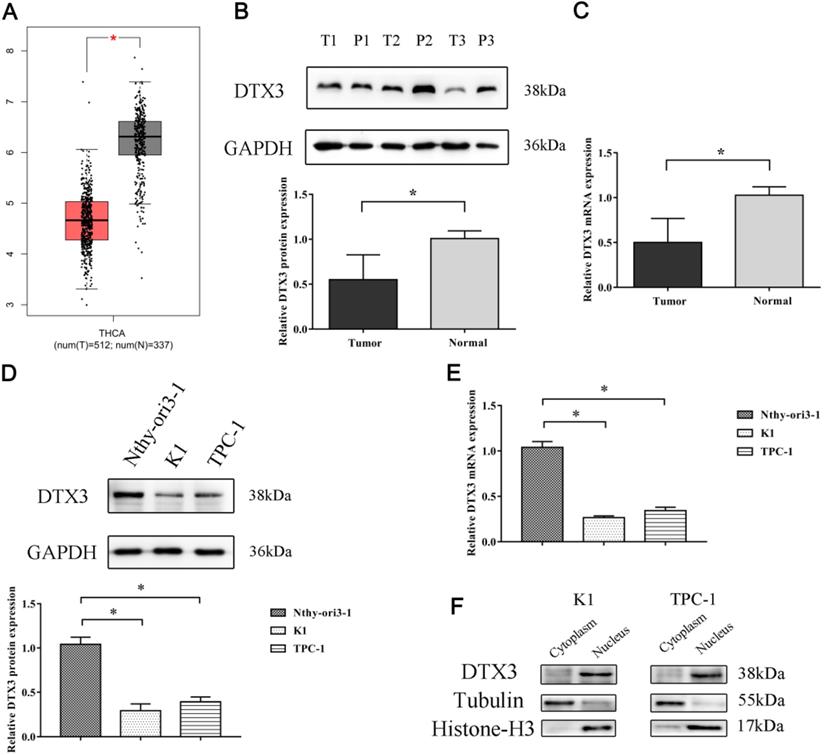
According to the exclusion and inclusion criteria, 114 PTC and paired paracancerous normal tissues were collected in Shengjing Hospital of China Medical University to detect both mRNA and protein relative expressions of DTX3. The results of qRT-PCR and WB proved that the relative mRNA and protein expressions of DTX3 in PTC tissues were 0.501 ± 0.267 and 0.551 ± 0.277, which were markedly lower as compared to those in the paired paracancerous normal tissues (1.026 ± 0.094 and 1.008 ± 0.084, P<0.05) (Figures 2B and 2C).
Then, we analyzed the correlations between clinicopathological characteristics and DTX3 expressions in PTC. As showed in Table 1, relative mRNA and protein expressions of DTX3 in group with cervical lymph node metastasis were 0.444 ± 0.254 and 0.490 ± 0.255, which were prominently lower than those in no cervical lymph node metastasis group (0.607 ± 0.261 and 0.663 ± 0.282, P<0.05). Other clinicopathological characteristics, such as age and sex of patients, multifocality and extra-capsular invasion of PTC, were not associated with the relative expressions of DTX3 (P>0.05). These findings suggested that the low expression of DTX3 might play important roles in the metastasis of PTC.
The expressions of DTX3 are lower in PTC cell lines and mainly located in nucleus
To explore the exact roles of DTX3 in PTC cells, we compared the relative mRNA and protein expressions of DTX3 in two PTC cell lines (K1 and TPC-1) and thyroid epithelial cell line Nthy-ori3-1 by qRT-PCR and WB. The results showed that the relative mRNA and protein expressions of DTX3 in K1 and TPC-1 were both significantly lower than those in Nthy-ori3-1 (P<0.05) (Figures 2D and 2E).
To detect the subcellular locations of DTX3 in PTC cell lines, the nuclear and cytoplasmic protein extracts of both K1 and TPC-1 cells were prepared for WB analysis. The outcomes indicated that the majority of DTX3 was distributed in the nucleus (Figure 2F).
DTX3 suppresses migration and invasion of PTC cells
We transfected K1 and TPC-1 cells with DTX3-shRNA, DTX3-cDNA, neg-shRNA, or neg-vector respectively. K1 and TPC-1 cells with DTX3 overexpression and downregulation were stably transfected and confirmed by qRT-PCR and WB. In K1 DTX3-shRNA group, the relative mRNA and protein expressions of DTX3 were 0.213 ± 0.023 and 0.346 ± 0.064, which were both significantly reduced, compared with control groups (0.928 ± 0.057 and 0.981 ± 0.109, P<0.05). In TPC-1 DTX3-shRNA cells, the relative mRNA and protein expressions of DTX3 were 0.301 ± 0.035 and 0.368 ± 0.078, which were both obviously lower than those in control groups (0.911 ± 0.050 and 0.985 ± 0.126, P<0.05). At the same time, In K1 DTX3-cDNA group, the relative mRNA and protein expressions of DTX3 were 5.867 ± 0.532 and 4.612 ± 0.570, which were both upregulated in comparison with control groups (0.933 ± 0.044 and 0.967 ± 0.094, P<0.05). In TPC-1 DTX3-cDNA cells, the relative mRNA and protein expressions of DTX3 were 6.169 ± 0.637 and 5.761 ± 0.719, which were both overexpressed than those in control groups (0.943 ± 0.037 and 0.963 ± 0.085, P<0.05) (Figures 3A, 3B and 3C).
The influences of upregulation and downregulation of DTX3 expressions on migration and invasion of PTC cells. (A) DTX3 relative downregulated protein expression levels were measured by western blot using anti-DTX3 antibody. GAPDH was used as a loading control. Lower panel: Integrated optical density (IOD) of DTX3 protein was presented as relative expression level after normalization with internal control. (B) DTX3 relative upregulated protein expression levels were measured by western blot using anti-DTX3 antibody. GAPDH was used as a loading control. Lower panel: IOD of DTX3 protein was presented as relative expression level after normalization with internal control. (C) DTX3 relative upregulated and downregulated mRNA expression levels were measured by qRT-PCR. (D) The migration abilities affected by upregulation and downregulation of DTX3 were measured by wound healing assay (100× magnification). (E) The invasion abilities affected by upregulation and downregulation of DTX3 were measured by Matrigel-coated transwell invasion assay (200× magnification). *P < 0.05, n.s means not significant.
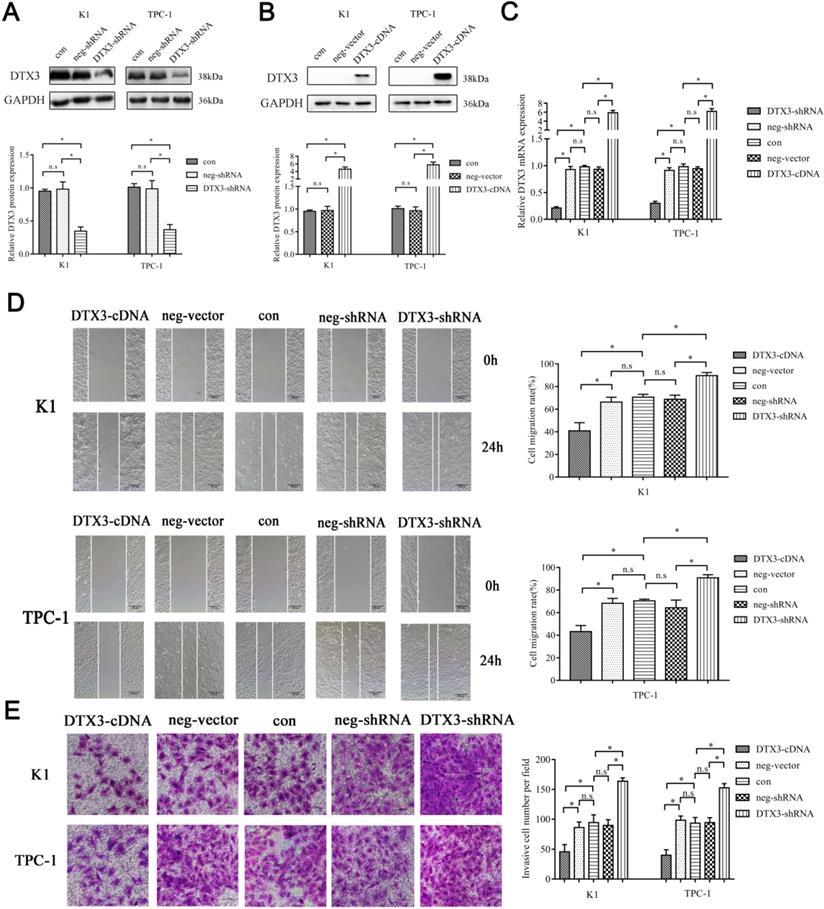
Then, we performed MTS assay, flow cytometry, wound-healing assay and Matrigel invasion experiments to assess the effects of DTX3 on malignant phenotypes of PTC cells. In the wound-healing assay, the percentages of wound closure in K1 and TPC-1 DTX3-cDNA cells were 40.899% ± 7.110% and 43.261% ± 5.328%, which were smaller than those in control groups (66.235% ± 4.277% and 68.313% ± 4.303%, P<0.05). While, the percentages of wound closure in K1 and TPC-1 DTX3-shRNA cells were 89.648% ± 2.751% and 90.867% ± 2.720%, which were larger as compared with control groups (68.701% ± 3.696% and 64.409% ± 6.730%, P<0.05) (Figure 3D).
In the Matrigel invasion experiments, the average numbers of cells passing through in K1 and TPC-1 DTX3-cDNA groups were 45.667 ± 12.014 per field and 41.333 ± 7.506 per field, which were less than those in control groups (86.333 ± 9.074 per field and 98.333 ± 7.024 per field, P<0.05). However, the average invaded cells in K1 and TPC-1 DTX3-shRNA groups were 163.667 ± 5.686 per field and 152.667 ± 7.024 per field, which were larger than those in control groups (89.667 ± 9.504 per field and 94.333 ± 8.327 per field, P<0.05) (Figure 3E). The changes in cell viability, cell apoptosis and cell cycle assays among DTX3-cDNA, DTX3-shRNA and control groups were not significantly different (P>0.05, data not shown).
These results suggested that DTX3 overexpression reduced cell migration and invasion in PTC cells, and inhibition of DTX3 expression led to reverse changes.
DTX3 inhibits EMT in PTC cells
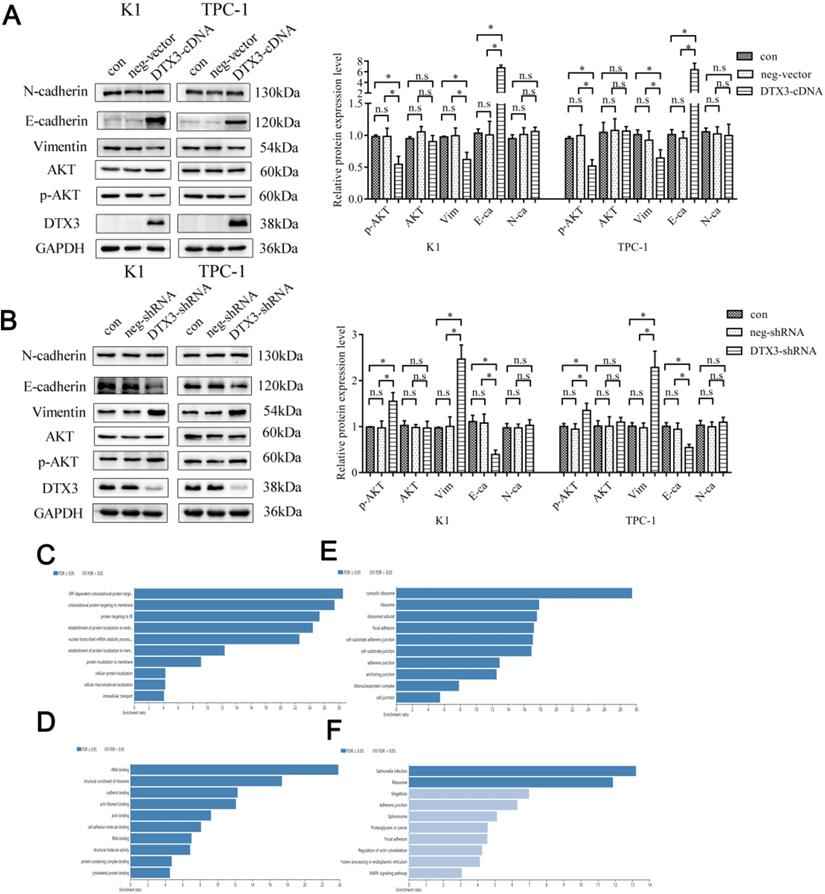
The relative protein expressions of Vimentin, E-cadherin and N-cadherin were evaluated by WB. In K1 and TPC-1 DTX3-cDNA cells, the relative protein expressions of Vimentin were 0.620 ± 0.113 and 0.643 ± 0.129, which were lower than those in control groups (0.992 ± 0.122 and 0.989 ± 0.088, P<0.05). In K1 and TPC-1 DTX3-cDNA cells, the relative E-cadherin expressions were 6.736 ± 0.508 and 6.384 ± 1.218, which were higher than those in control groups (1.006 ± 0.214 and 0.955 ± 0.101, P<0.05). In K1 and TPC-1 DTX3-shRNA groups, the relative protein expressions of Vimentin and were 2.466 ± 0.309 and 2.287 ± 0.351, which were higher than those in control groups (1.004 ± 0.207 and 0.973 ± 0.105, P<0.05). In K1 and TPC-1 DTX3-shRNA groups, E-cadherin relative expressions were 0.394 ± 0.096 and 0.547 ± 0.066, which were much lower than those in control groups (1.077 ± 0.195 and 0.942 ± 0.134, P<0.05). However, the change of N-cadherin by DTX3 was not obviously observed in K1 and TPC-1 cells (P>0.05) (Figures 4A and 4B).
DTX3 inhibits EMT partially by regulating AKT signal pathway in PTC cells and each top 10 GO and KEGG enrichment analysis terms of 46 DTX3 interacting proteins. (A) Comparisons of expressions of EMT and AKT signal pathway related proteins in K1 and TPC-1 cells transfected with DTX3 cDNA by western blot. Right panel: Relative expression levels indicated are normalized to GAPDH levels. (B) Comparisons of expressions of EMT and AKT signal pathway related proteins in K1 and TPC-1 cells transfected with DTX3 shRNA by western blot. Right panel: Relative expression levels indicated are normalized to GAPDH levels. (C) Top 10 biological process of GO enrichment terms. (D) Top 10 molecular function of GO enrichment terms. (E) Top 10 cellular components of GO enrichment terms. (F) Top 10 KEGG pathway enrichment terms. GAPDH protein was used as a loading control. *P < 0.05, n.s means not significant.
Above all, DTX3 acted pivotal parts in suppressing the migration and invasion of PTC cells by downregulation of EMT.
The inhibitory effects of DTX3 on EMT are partially regulated by AKT signal pathway
Since AKT signal pathway was closely associated with EMT, we wondered if some proteins in AKT signal pathway would be influenced by DTX3. AKT and phosphorylated AKT (p-AKT) expressions were evaluated by WB. In K1 and TPC-1 DTX3-cDNA cells, the relative protein expressions of p-AKT were 0.549 ± 0.124 and 0.518 ± 0.099, which were lower than those in control groups (0.982 ± 0.129 and 0.995 ± 0.168, P<0.05). In K1 and TPC-1 DTX3-shRNA groups, the relative protein expressions of p-AKT were 1.552 ± 0.186 and 1.350 ± 0.157, which were higher than those in control groups (0.970 ± 0.151 and 0.943 ± 0.117, P<0.05). The changes of AKT by DTX3 was not obviously observed in K1 and TPC-1 cells (P>0.05) (Figures 4A and 4B).
These results suggested that DTX3 in PTC cells inhibited the EMT process partially through AKT signal pathway.
Identification and functional enrichments of DTX3 interacting candidates
As an ubiquitin E3 ligase, IP-MS was performed to recognize the interacting proteins with DTX3. According to the results, there were 11 unique peptides corresponding to DTX3 protein, which suggested that DTX3 was successfully immunoprecipitated and captured by MS. Then, to reduce the influence from potential contamination and/or nonspecific binding of the IgG portion of DTX3 antibody as much as possible, the candidates for DTX3 interacting proteins were screened as following criteria: proteins with at least 2 unique peptides; proteins were uniquely identified in DTX3-IP group; proteins in DTX3-IP group with unique peptides number 2 times more than those of IgG-IP negative control group [22]. After selection, a total of 46 proteins were identified as putatively interacting with DTX3 (Table 3).
Details of 46 candidates for interacting with DTX3
| Accession | Gene name | Description |
|---|---|---|
| Q60FE6 | FLNA | Filamin A |
| O95425 | SVIL | Supervillin |
| Q01082 | SPTBN1 | Spectrin beta chain, non-erythrocytic 1 |
| Q00610 | CLTC | Clathrin heavy chain 1 |
| O75369 | FLNB | Filamin-B |
| O15144 | ARPC2 | Actin-related protein 2/3 complex subunit 2 |
| B4E0E1 | PARP1 | Poly [ADP-ribose] polymerase 1 |
| Q8NEN9 | PDZD8 | PDZ domain-containing protein 8 |
| E9PCY7 | HNRNPH1 | Heterogeneous nuclear ribonucleoprotein H |
| A0A1X7SBS1 | HNRNPU | Heterogeneous nuclear ribonucleoprotein U |
| P36578 | RPL4 | 60S ribosomal protein L4 |
| A0A0J9YXZ5 | IQGAP1 | Ras GTPase-activating-like protein IQGAP1 |
| P25705 | ATP5F1A | ATP synthase subunit alpha, mitochondrial |
| P13639 | EEF2 | Elongation factor 2 |
| A0A087WY00 | MYO5A | Unconventional myosin-Va |
| F8VZ49 | HNRNPA1 | Heterogeneous nuclear ribonucleoprotein A1 |
| Q5JR95 | RPS8 | 40S ribosomal protein S8 |
| P63244 | RACK1 | Receptor of activated protein C kinase 1 |
| H7C463 | IMMT | MICOS complex subunit MIC60 |
| A0A087WVV2 | RRBP1 | Ribosome-binding protein 1 |
| Q96C19 | EFHD2 | EF-hand domain-containing protein D2 |
| V9HW35 | HEL-S-55 | Peroxiredoxin |
| C9J0J7 | PFN2 | Profilin |
| Q0QEN7 | ATP5B | ATP synthase subunit beta |
| P78527 | PRKDC | DNA-dependent protein kinase catalytic subunit |
| P19474 | TRIM21 | E3 ubiquitin-protein ligase TRIM21 |
| A0A024R592 | GANAB | Glucosidase, alpha neutral AB, isoform CRA_b |
| Q09666 | AHNAK | Neuroblast differentiation-associated protein AHNAK |
| P62424 | RPL7A | 60S ribosomal protein L7a |
| P14649 | MYL6B | Myosin light chain 6B |
| Q5CAQ5 | TRA1 | Epididymis secretory sperm binding protein |
| H3BR27 | RBMX | RNA-binding motif protein, X chromosome |
| B1AH77 | RAC2 | Ras-related C3 botulinum toxin substrate 2 |
| P30050 | RPL12 | 60S ribosomal protein L12 |
| P62277 | RPS13 | 40S ribosomal protein S13 |
| A8MUD9 | RPL7 | 60S ribosomal protein L7 |
| P13010 | XRCC5 | X-ray repair cross-complementing protein 5 |
| F5H018 | RAN | GTP-binding nuclear protein Ran |
| F8VVM2 | SLC25A3 | Phosphate carrier protein, mitochondrial |
| Q5TEU4 | NDUFAF5 | Arginine-hydroxylase NDUFAF5, mitochondrial |
| Q6FG43 | FLOT2 | FLOT2 protein |
| Q14315 | FLNC | Filamin-C |
| P49411 | TUFM | Elongation factor Tu, mitochondrial |
| P36957 | DLST | Dihydrolipoyllysine-residue succinyltransferase component of 2-oxoglutarate dehydrogenase complex, mitochondrial |
| Q5T985 | ITIH2 | Inter-alpha-trypsin inhibitor heavy chain H2 |
| P07900 | HSP90AA1 | Heat shock protein HSP 90-alpha |
To figure out the molecular functions and mechanisms of these DTX3 interacting proteins, the enrichments of GO and KEGG pathway were carried on. Each top 10 GO and KEGG enrichment analysis terms were listed. According to the GO enrichment results, these proteins based on biological process were mainly classified in SRP-dependent cotranslational protein targeting to membrane (GO: 0006614) (Figure 4C). In molecular function enrichment, these proteins were mostly enriched in rRNA binding (GO: 0019843) (Figure 4D). The enriched proteins were in some cellular components including cytosolic ribosome (GO: 0022626) (Figure 4E). KEGG pathway enrichment implied that proteins interacting with DTX3 were mainly enriched in pathways such as ribosome (hsa03010) (Figure 4F).
DTX3 is co-localized with XRCC5 and promotes its ubiquitination
To identify IP-MS results of DTX3 interacting proteins much more accurate, we searched protein-protein interaction (PPI) of DTX3 using the STRING database and co-expression genes of DTX3 in the cBioPortal. As combined PPI and co-expression genes of DTX3 with IP-MS results, the intersection called our attentions to two proteins named XRCC5 (X-ray repair cross-complementing protein 5) and NDUFAF5 (NADH: Ubiquinone Oxidoreductase Complex Assembly Factor 5). Next, Co-IP analysis showed that endogenous DTX3 could interact with either NDUFAF5 or XRCC5 (Figures 5A, 5B and 5C).
NDUFAF5 and XRCC5 were interacted with DTX3 respectively and XRCC5 was co-localization with DTX3. (A) Whole cell lysates were prepared and subjected to immunoprecipitation with either DTX3 antibody or normal IgG antibody. Antibodies of XRCC5 and NDUFAF5, as primary antibodies, were used to western blot. (B) Whole cell lysates were prepared and subjected to immunoprecipitation with either NDUFAF5 antibody or normal IgG antibody. DTX3 antibody as the primary antibody was used to western blot. (C) Whole cell lysates were prepared and subjected to immunoprecipitation with either XRCC5 antibody or normal IgG antibody. DTX3 antibody as the primary antibody was used to western blot. (D) Dual immunofluorescence staining for the co-localization of DTX3 and XRCC5 in PTC cells (400× magnification).
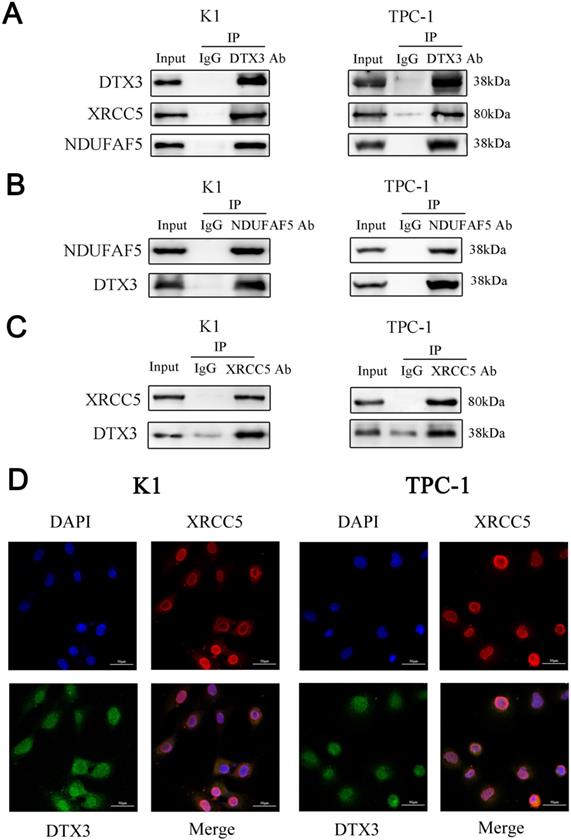
To see the co-localizations of DTX3 and XRCC5, immunofluorescence was performed. The results showed both DTX3 (Green) and XRCC5 (Red) were found to be present as mainly nuclear localizations. Moreover, they were co-localized since a clear yellow overlap was depicted (Figure 5D). These demonstrated the co-localization of DTX3 and XRCC5 in PTC cells.
According to the co-expression result from the cBioPortal, we figured out that there was a negative co-expression correlation between DTX3 and XRCC5 (Figure 6A). We supposed that DTX3 might be involved in the protein degradation of XRCC5. To confirm this speculation, proteasome inhibitor MG-132 was used to suppress proteasome functions in PTC cells. With MG-132, the relative protein expressions of XRCC5 were higher than those in cells without MG-132 added (P<0.05) (Figure 6B). Then, to evaluate the effects of DTX3 on the proteasome dependent degradation of XRCC5, MG-132 was used and the expressions of ubiquitinated XRCC5 were detected. In K1 and TPC-1 DTX3-cDNA cells, the relative protein expressions of ubiquitinated XRCC5 were higher than those in the control groups (P<0.05) (Figure 6C).
The degradation of XRCC5 was ubiquitin/proteasome-dependent and DTX3 could promote the ubiquitination of XRCC5. (A) The negative co-expression relationship between DTX3 and XRCC5 in PTC database of TCGA. (B) Cells were treated with 10 µM MG-132 for 6 h and whole cell lysates were prepared to western blot with XRCC5 antibody. Lower panel: Integrated optical density (IOD) of XRCC5 protein was presented as relative expression level after normalization with internal control GAPDH. (C) Cells were treated with 10 µM MG-132 for 6 h and whole cell lysates were subjected to immunoprecipitation with either XRCC5 antibody or normal IgG antibody. Ubiquitin antibody was used as the primary antibody to western blot.
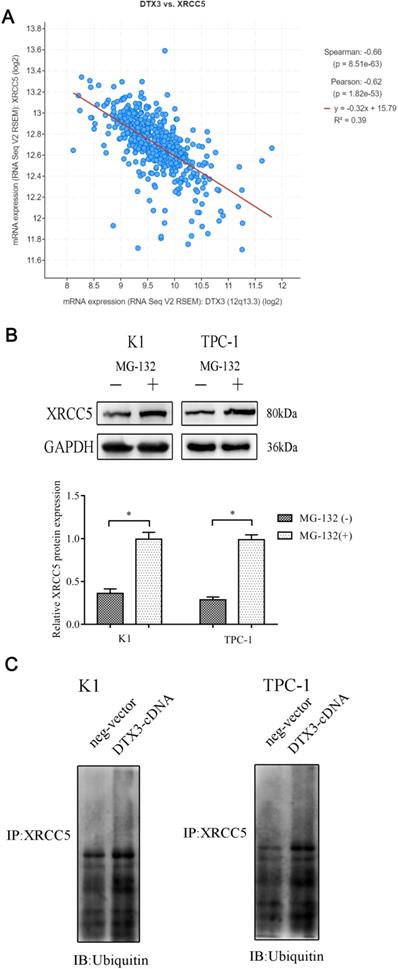
Altogether, these results indicated that DTX3 could interact with XRCC5 and upregulate its ubiquitination.
Discussion
Ubiquitin E3 ligases play key roles in the ubiquitination pathway of cells. As one kind of ubiquitin E3 ligases, four members of DTX family proteins (DTX1, DTX2, DTX3 and DTX4) have been identified so far in human beings. Recently, more evidence discovered the functions of DTX family proteins in several tumors. The migration and invasion of Glioblastoma (GBM) cells were positively associated with expressions of DTX1. Patients of GBM with a lower level of DTX1 survived longer and had better prognoses [23]. In diffuse large B-cell lymphoma (DLBCL), mutations in DTX1 gene could be discovered to impair its original effects, nearly 65% of which were found in the WWE1-domain [24]. In gastric cancer, DTX1 was reported specifically down-regulated and promoted cellular FLICE inhibitory protein (c-FLIP), as its E3 ligase substrate, to degrade through the endosome-lysosomal pathway [25]. DTX4 was significantly up-regulated through comparison of the interaction network between miRNAs and target genes in nasopharyngeal carcinoma samples [26].
In humans, the gene of DTX3 is in chromosome 12 (12q13.3). The protein of DTX3 consists of 347 amino acids and the molecular weight is 37988 Da. DTX3 has received much attention in the past decade. It was discussed that the transcriptional change of DTX3 was a direct consequence of the activation of E2F transcription factors and regulated the expansion of hepatocellular carcinoma cells [27]. There was a significant relationship between DNA copy number alteration and mRNA expression of DTX3 in luminal subtype breast cancer. Gene amplification of DTX3 was also proved to have impacts on overall survival of luminal subtype breast cancer [28]. It was reported that the expression of DTX3, acted as an anti-oncogene, was negatively correlated with NOTCH2 and suppressed proliferation and tumorigenicity of human esophageal carcinoma cells [29].
However, the impacts of DTX3 in the progression of PTC are still unknown. In present study, we showed DTX3 was much lower in PTC than in paired normal tissues in both mRNA and protein expressions (P<0.05). Moreover, there were prominently correlations between DTX3 expressions and the presence of cervical lymph node metastasis in PTC (P<0.05). After manipulating DTX3 expressions in PTC cells, we proved that downregulation of DTX3 facilitated the migration and invasion of PTC cells, while upregulation of DTX3 repressed those behaviors. These results suggested that DTX3 was an anti-oncogene and suppressed the migration and invasion of PTC.
It is generally considered that an important mechanism of migration and invasion of cancer cells lies in EMT [30]. The process of EMT includes the epithelial cell depolarization and loss of adhesion, cytoskeleton transforming and alteration to morphological characteristics of mesenchymal cells [31]. When EMT occurred, E-cadherin was downregulated with upregulated Vimentin and N-cadherin [32]. In our study, the diminution of DTX3 led to markedly decline of E-cadherin expression, while obviously elaborated Vimentin expression. And DTX3 overexpression caused reverse phenomena. These results showed that DTX3 attenuated the process of EMT to abate the migration and invasion of PTC cells.
A close relationship between EMT and AKT signal pathway has been reported in the literatures [33]. In our study, the increased phosphorylated AKT was observed after DTX3 expression was knocked down. When DTX3 was overexpressed, the expression of phosphorylated AKT was downregulated. These results demonstrated that DTX3 suppressed AKT signal pathway which participating the restrain of EMT process.
Two or more proteins form complexes through noncovalent bonds to constitute cell biochemical reaction network. Exploring and understanding the association between two interacting proteins is of great significance to analyze the regulation mechanisms in tumor cells. In this study, 46 interacting partners of DTX3 were identified and chosen by IP-MS. The functional enrichment results suggested that these DTX3 interacting proteins were associated with biological processes of transportation and localization. Binding with RNA, actin and cytoskeleton protein might be the main molecular functions of these DTX3 interacting proteins.
As the negative co-expression between DTX3 and XRCC5 in PTC database of TGCA was noticed, we focused on exploring the mechanism of XRCC5 regulated by DTX3. XRCC5, also called Ku80, forms a heterodimer with XRCC6 to bind the ends of broken DNA double strands. The heterodimer is also considered as participating in migration and invasion of tumors, not just maintaining the stability of chromosomes [34]. Recently, XRCC5 has been reported to be highly expressed in various tumors such as gastric cancer, breast cancer and hepatocellular carcinoma [35-37]. In PTC cells, XRCC5 was also showed high expression. Knocking down XRCC5 decreased the malignancy and inactivated the AKT signal pathway in PTC cells [38]. However, it has not yet been established whether XRCC5 can be regulated by DTX3. In this paper, we shed new light on the interaction and co-localizations of DTX3 and XRCC5. We also took a new look at the mechanism that DTX3 inhibited EMT of PTC cells by partially promoting ubiquitination of XRCC5 to restrain the AKT signal pathway.
Compared with PPI results of DTX3 from STRING, NDUFAF5 was considered as another DTX3 interacting protein of high reliability [39]. NDUFAF5, a member of seven-β-strand S-adenosylmethionine-dependent methyltransferases, which is totally located in the mitochondria of mammal cells. Complex I (NADH ubiquinone oxidoreductase) in mitochondrion is assembled from forty-four different proteins with the main functions of transferring the electrons of NADH along the respiratory chain and storing the energy in the form of ATP. NDUFAF5 was reported to catalyze the hydroxylation of Arg-73 in NADH: Ubiquinone Oxidoreductase Core Subunit S7 (NDUFS7) and affect the biogenesis of Complex I at an early stage of assembly [40]. Mutations in NDUFAF5 were found to be related to cavitating leukoencephalopathies, lactic acidosis, classic Leigh syndrome, hyponatremia and some lethal neonatal mitochondrial diseases [41-43]. In our study, Co-IP assay was performed and the results proved that there was an endogenous interaction between DTX3 and NDUFAF5 in PTC cells.
Conclusions
In the present study, we showed DTX3 expressed low in PTC tissues both in mRNA and protein significantly. DTX3 expressions were relevant to the cervical lymph node metastasis of patients with PTC. DTX3 exerted the anti-oncogenic effects on EMT in PTC cells, which were partially mediated by interacting with XRCC5 to promote its ubiquitination to regulate AKT signal pathway. However, more exact molecular mechanisms of DTX3 interacting XRCC5 requires further study.
Abbreviations
PTC: papillary thyroid carcinoma; DTX: deltex; GEPIA: gene expression profiling interactive analysis; TCGA: the cancer genome atlas; BLCA: bladder urothelial carcinoma; COAD: colon adenocarcinoma; OV: ovarian serous cystadenocarcinoma; PRAD: prostate adenocarcinoma; CESC: cervical squamous cell carcinoma and endocervical adenocarcinoma; READ: rectum adenocarcinoma; STAD: stomach adenocarcinoma; UCEC: uterine corpus endometrial carcinoma; UCS: uterine carcinosarcoma; AJCC: the American Joint Committee on Cancer; FBS: fetal bovine serum; shRNA: short hairpin RNA; cDNA: complementary DNA; qRT-PCR: quantitative real‐time polymerase chain reaction; GAPDH: glyceraldehyde-3-phosphate dehydrogenase; WB: western blot; PMSF: phenylmethanesulfonyl fluoride; SDS-PAGE: sodium dodecyl sulfate-polyacrylamide gel electrophoresis; PVDF: polyvinylidene Fluoride; BSA: bovine serum albumin; IOD: integrated optical density; OD: optical density; MTS: 3-(4,5-dimethylthiazol-2-yl)-5-(3-carboxymethoxyphenyl)-2-(4-sulfophenyl)-2H-tetrazolium; 7-AAD: 7-aminoactinomycin D; PI: propidium iodide; RNase A: Ribonuclease A; CO-IP: co-immunoprecipitation; MS: mass spectrometry; WebGestalt: WEB-based GEne SeT AnaLysis Toolkit; GO: gene ontology; KEGG: Kyoto Encyclopedia of Genes and Genomes; STRING: the search tool for the retrieval of interacting genes; PPI: protein-protein interaction; NDUFAF5: NADH Ubiquinone Oxidoreductase Complex Assembly Factor 5; GBM: Glioblastoma; DLBCL: Diffuse large B-cell lymphoma; c-FLIP: cellular FLICE inhibitory protein; EMT: epithelial-mesenchymal transition; NDUFS7: NADH Ubiquinone Oxidoreductase Core Subunit S7; PBS: phosphate-buffered saline; XRCC5: X-ray repair cross-complementing protein 5.
Acknowledgements
This work was supported by the National Natural Science Foundation of China (Grant number: 81672644), Young Scholar Support Program 2018 of China Medical University (Grant number: QGZD2018061) and 345 Talent Project of Shengjing Hospital of China Medical University.
Authors' contributions
- Lidong Wang, Yonglian Huang, Chenxi Liu and Zhen Liu designed the study;
- Lidong Wang, Mingyue Guo, Zhennan Ma and Jingni He collected the tissues and clinicopathological data;
- Ailian Wang, and Xiaodan Sun finished the pathological diagnosis;
- Lidong Wang, Yonglian Huang and Chenxi Liu performed the cell culture, transfection, qRT-PCR, western blot, MTS assay, flow cytometry, wound healing, transwell assays, Co-IP, immunofluorescence, and the statistical analysis;
- Lidong Wang drafted the manuscript;
- Zhen Liu revised the manuscript.
Competing Interests
The authors have declared that no competing interest exists.
References
1. Yuksel UM, Turanli S, Acar Y. et al. The prognostic factors for clinical N1b patients in thyroid papillary carcinoma. Journal of cancer research and therapeutics. 2019;15(3):681-5
2. Wu Y, Xu T, Cao X. et al. BRAF (V600E) vs. TIRADS in predicting papillary thyroid cancers in Bethesda system I, III, and V nodules. Cancer biology & medicine. 2019;16(1):131-8
3. Seib CD, Sosa JA. Evolving Understanding of the Epidemiology of Thyroid Cancer. Endocrinology and metabolism clinics of North America. 2019;48(1):23-35
4. Shangguan L, Fang S, Zhang P. et al. Impact factors for the outcome of the first (131)I radiotherapy in patients with papillary thyroid carcinoma after total thyroidectomy. Annals of nuclear medicine. 2019;33(3):177-83
5. Eltelety AM, Terris DJ. Neck Dissection in the Surgical Treatment of Thyroid Cancer. Endocrinology and metabolism clinics of North America. 2019;48(1):143-51
6. Brito JP, Hay ID. Management of Papillary Thyroid Microcarcinoma. Endocrinology and metabolism clinics of North America. 2019;48(1):199-213
7. Miccoli P, Bakkar S. Surgical management of papillary thyroid carcinoma: an overview. Updates in surgery. 2017;69(2):145-50
8. Wang X, Lei J, Wei T. et al. Clinicopathological characteristics and recurrence risk of papillary thyroid microcarcinoma in the elderly. Cancer management and research. 2019;11:2371-7
9. Maksimovic S, Jakovljevic B, Gojkovic Z. Lymph Node Metastases Papillary Thyroid Carcinoma and their Importance in Recurrence of Disease. Med Arch. 2018;72(2):108-11
10. Zheng X, Peng C, Gao M. et al. Risk factors for cervical lymph node metastasis in papillary thyroid microcarcinoma: a study of 1,587 patients. Cancer biology & medicine. 2019;16(1):121-30
11. Yu S, Dai J, Ma M. et al. RBCK1 promotes p53 degradation via ubiquitination in renal cell carcinoma. Cell death & disease. 2019;10(4):254
12. Liu X, Zhang Y, Wei Y. et al. The E3 ubiquitin ligase Itch is required for B-cell development. Scientific reports. 2019;9(1):421
13. Joazeiro CA, Weissman AM. RING finger proteins: mediators of ubiquitin ligase activity. Cell. 2000;102(5):549-52
14. Hsiao HW, Hsu TS, Liu WH. et al. Deltex1 antagonizes HIF-1alpha and sustains the stability of regulatory T cells in vivo. Nature communications. 2015;6:6353
15. Takeyama K, Aguiar RC, Gu L. et al. The BAL-binding protein BBAP and related Deltex family members exhibit ubiquitin-protein isopeptide ligase activity. The Journal of biological chemistry. 2003;278(24):21930-7
16. Tottone L, Zhdanovskaya N, Carmona Pestana A. et al. Histone Modifications Drive Aberrant Notch3 Expression/Activity and Growth in T-ALL. Frontiers in oncology. 2019;9:198
17. Perrier ND, Brierley JD, Tuttle RM. Differentiated and anaplastic thyroid carcinoma: Major changes in the American Joint Committee on Cancer eighth edition cancer staging manual. CA: a cancer journal for clinicians. 2018;68(1):55-63
18. Liao Y, Wang J, Jaehnig EJ. et al. WebGestalt 2019: gene set analysis toolkit with revamped UIs and APIs. Nucleic acids research. 2019;47(W1):W199-W205
19. Nishant A, Rehan A. et al. Integrated genomic characterization of papillary thyroid carcinoma. Cell. 2014;159(3):676-90
20. Gao J, Aksoy BA, Dogrusoz U. et al. Integrative analysis of complex cancer genomics and clinical profiles using the cBioPortal. Science signaling. 2013;6(269):pl1
21. Cerami E, Gao J, Dogrusoz U. et al. The cBio cancer genomics portal: an open platform for exploring multidimensional cancer genomics data. Cancer discovery. 2012;2(5):401-4
22. Zhang L, Xia X, Zhang M. et al. Integrated analysis of genomics and proteomics reveals that CKIP-1 is a novel macrophage migration regulator. Biochemical and biophysical research communications. 2013;436(3):382-7
23. Huber RM, Rajski M, Sivasankaran B. et al. Deltex-1 activates mitotic signaling and proliferation and increases the clonogenic and invasive potential of U373 and LN18 glioblastoma cells and correlates with patient survival. PloS one. 2013;8(2):e57793
24. Meriranta L, Pasanen A, Louhimo R. et al. Deltex-1 mutations predict poor survival in diffuse large B-cell lymphoma. Haematologica. 2017;102(5):e195-e8
25. Hsu TS, Mo ST, Hsu PN. et al. c-FLIP is a target of the E3 ligase deltex1 in gastric cancer. Cell death & disease. 2018;9(2):135
26. Liu M, Zhu K, Qian X. et al. Identification of miRNA/mRNA-Negative Regulation Pairs in Nasopharyngeal Carcinoma. Medical science monitor: international medical journal of experimental and clinical research. 2016;22:2215-34
27. Viatour P, Ehmer U, Saddic LA. et al. Notch signaling inhibits hepatocellular carcinoma following inactivation of the RB pathway. The Journal of experimental medicine. 2011;208(10):1963-76
28. Gatza ML, Silva GO, Parker JS. et al. An integrated genomics approach identifies drivers of proliferation in luminal-subtype human breast cancer. Nature genetics. 2014;46(10):1051-9
29. Ding XY, Hu HY, Huang KN. et al. Ubiquitination of NOTCH2 by DTX3 suppresses the proliferation and migration of human esophageal carcinoma. Cancer science. 2020;111(2):489-501
30. Jiang X, Zhang Z, Song C. et al. Glaucocalyxin A reverses EMT and TGF-beta1-induced EMT by inhibiting TGF-beta1/Smad2/3 signaling pathway in osteosarcoma. Chemico-biological interactions. 2019;307:158-66
31. Dongre A, Weinberg RA. New insights into the mechanisms of epithelial-mesenchymal transition and implications for cancer. Nature reviews Molecular cell biology. 2019;20(2):69-84
32. Piera-Velazquez S, Jimenez SA. Endothelial to Mesenchymal Transition: Role in Physiology and in the Pathogenesis of Human Diseases. Physiological reviews. 2019;99(2):1281-324
33. Sa R, Song H, Wei M. et al. MiR-616 plays oncogenic role in hepatocellular carcinoma progression through suppressing PTEN expression and activating PI3K/AKT pathway. Artificial cells, nanomedicine, and biotechnology. 2020;48(1):728-34
34. Safarzad M, Besharat S, Salimi S. et al. Association between selenium, cadmium, and arsenic levels and genetic polymorphisms in DNA repair genes (XRCC5, XRCC6) in gastric cancerous and non-cancerous tissue. J Trace Elem Med Biol. 2019;55:89-95
35. Li Q, Liu J, Jia Y. et al. miR-623 suppresses cell proliferation, migration and invasion through direct inhibition of XRCC5 in breast cancer. Aging. 2020;12(11):10246-58
36. Gu Z, Li Y, Yang X. et al. Overexpression of CLC-3 is regulated by XRCC5 and is a poor prognostic biomarker for gastric cancer. Journal of hematology & oncology. 2018;11(1):115
37. Liu ZH, Wang N, Wang FQ. et al. High expression of XRCC5 is associated with metastasis through Wnt signaling pathway and predicts poor prognosis in patients with hepatocellular carcinoma. European review for medical and pharmacological sciences. 2019;23(18):7835-47
38. Fan Y, Li J, Wei W. et al. Ku80 gene knockdown by the CRISPR/Cas9 technique affects the biological functions of human thyroid carcinoma cells. Oncology reports. 2019;42(6):2486-98
39. Huttlin EL, Bruckner RJ, Paulo JA. et al. Architecture of the human interactome defines protein communities and disease networks. Nature. 2017;545(7655):505-9
40. Rhein VF, Carroll J, Ding S. et al. NDUFAF5 Hydroxylates NDUFS7 at an Early Stage in the Assembly of Human Complex I. The Journal of biological chemistry. 2016;291(28):14851-60
41. Zhang J, Liu M, Zhang Z. et al. Genotypic Spectrum and Natural History of Cavitating Leukoencephalopathies in Childhood. Pediatric neurology. 2019;94:38-47
42. Simon MT, Eftekharian SS, Stover AE. et al. Novel mutations in the mitochondrial complex I assembly gene NDUFAF5 reveal heterogeneous phenotypes. Molecular genetics and metabolism. 2019;126(1):53-63
43. Sugiana C, Pagliarini DJ, McKenzie M. et al. Mutation of C20orf7 disrupts complex I assembly and causes lethal neonatal mitochondrial disease. American journal of human genetics. 2008;83(4):468-78
Author contact
![]() Corresponding author: Zhen Liu, PhD, Department of General Surgery, Shengjing Hospital of China Medical University, Shenyang, China. E-mail: liuzorg. Zip code: 110004. Telephone number: +86018940254591.
Corresponding author: Zhen Liu, PhD, Department of General Surgery, Shengjing Hospital of China Medical University, Shenyang, China. E-mail: liuzorg. Zip code: 110004. Telephone number: +86018940254591.