Impact Factor ISSN: 1837-9664

 Global reach, higher impact
J Cancer 2021; 12(7):1867-1883. doi:10.7150/jca.48979 This issue Cite
Research Paper
Screening and bioinformatical analysis of differentially expressed genes in nasopharyngeal carcinoma
Weiqian Guo1, Xiaomin Zheng1, Lei Hua1, Xianbin Zheng2, Yangyang Zhang3, Bin Sun3, Zhenchao Tao3, Jin Gao1,3 ![]()
1. Department of Radiation Oncology, Anhui Provincial Hospital Affiliated to Anhui Medical University, Hefei 230001, China.
2. Xinxiang Medical University, Xinxiang 453000, China.
3. Department of Radiation Oncology, the First Affiliated Hospital of USTC, Division of Life Sciences and Medicine, University of Science and Technology of China, Hefei 230031, China.
Received 2020-6-2; Accepted 2020-12-31; Published 2021-1-30
Abstract

Objective: To identify differentially expressed genes via bioinformatical analysis for nasopharyngeal carcinoma (NPC) and explore potential biomarkers for NPC.
Methods: We downloaded the NPC gene expression datasets (GSE40290, GSE53819) and obtained differentially expressed genes (DEGs) via GEO2R. Functional analysis of DEGs was performed by Gene Ontology (GO) and Kyoto Encyclopedia of Genes and Genomes (KEGG) analysis. In order to explore the interaction of DEGs and screen the core genes, we established protein-protein interaction (PPI) network. Then the expression level, prognostic and diagnostic analysis of the core genes in NPC were performed to reveal their potential effects on NPC. Furthermore, we obtained the transcription factors (TF) and microRNAs of core genes to construct the coregulatory network.
Results: We obtained 124 up-regulated genes and 190 down-regulated genes in total. These genes were found to be related to signal transduction, extracellular matrix organization and cell adhesion based on GO analysis. KEGG analysis revealed that the NF-kappa B (NF-κB) signaling pathway, pathways in cancer were mainly enriched signaling pathways. 25 core genes were obtained by constructing PPI network. Then the high expression of 10 core genes in NPC were verified via GEPIA, Oncomine databases and laboratory experiments. The TF-microRNA coregulatory network of the 10 core genes was built. Survival and diagnostic analysis indicated that SPP1 had negative influence on the prognosis of NPC patients based on two datasets and nine up-regulated core genes (FN1, MMP1, MMP3, PLAU, PLAUR, SERPINE1, SPP1, COL8A1, COL10A1) might be diagnostic markers for NPC.
Conclusions: Core genes of NPC were screened out by bioinformatical analysis in the present study and these genes may serve as prognostic and diagnostic biomarkers for NPC.
Keywords: nasopharyngeal carcinoma, core genes, bioinformatical analysis, prognosis, microarray
Introduction
Nasopharyngeal carcinoma (NPC) is a malignancy in head and neck arising from the nasopharyngeal epithelium [1]. NPC has a unique geographical distribution, which the incidence of NPC in Southeast Asia is higher than that in western countries [2]. 86000 new cases of NPC were reported globally in 2012 and there were approximately 50000 patients died [3]. Multiple factors participate in the pathogenesis of NPC, including the genetic factors, dietary factors, Epstein-Barr virus [4, 5]. NPC is sensitive to radiotherapy and because of its deep anatomical position, which limits the operation; chemoradiotherapy has become the main treatment of NPC. After treatment, the 5-year survival rate of patients with early NPC can be more than 90% [6], but local recurrence and metastasis greatly affect the prognosis of patients [7]. Thus, there is an urgent need to explore pathogenesis of NPC and find the early diagnostic markers for NPC.
With the development of molecular biotechnology, bioinformatical analysis plays an important role in screening tumor candidate biomarkers, and it provides new clues for the study of tumor pathogenesis including NPC [8]. For example, Zhu et al. confirmed that the curcumin could improve radiosensitization of NPC cell lines by constructing a competing endogenous RNA network based on bioinformatical analysis [9]. Zhang et al. screened several serum microRNAs as potential prognostic markers of NPC patients with concurrent chemoradiotherapy by microRNA chip and bioinformatical analysis [10]. Although many studies have been carried out for NPC, there is still a lack of biomarkers for prognosis and early diagnosis of NPC and further studies to explore therapeutic targets for NPC are still needed.
In the current study, we obtained GSE40290 and GSE53819 from the Gene Expression Omnibus (GEO) database. Differentially expressed genes (DEGs) were screened out by GEO2R online tool. The Gene Ontology (GO) terms and Kyoto Encyclopedia of Genes and Genomes (KEGG) pathway analysis were carried out for better understanding of DEGs. Subsequently, core genes were obtained by constructing protein-protein interaction (PPI) network. The expression of core genes in NPC were validated by Gene Expression Profiling Interactive Analysis (GEPIA), Oncomine databases and laboratory experiments. Prognostic analysis revealed that SPP1 had negative influence on the overall survival and progression-free survival (PFS) of NPC patients and diagnostic analysis indicated that nine core genes might be diagnostic markers for NPC. In conclusion, we identified potential biomarkers of NPC based on bioinformatical analysis, which might be targets of treatment for NPC patients.
Materials and Methods
Information of datasets
We searched gene expression datasets of NPC from GEO database (http://www.ncbi.nlm.nih.gov/ geo/). The inclusion criteria were as follows: (1) the datasets of mRNA expression profile, (2) the datasets of NPC tissues and normal nasopharyngeal tissues, (3) the datasets contained more than five pairs of NPC tissues and normal tissues, (4) all NPC tissues and normal tissues were confirmed by histopathology. The datasets that did not meet these criteria were excluded. Then, two datasets (GSE40290 and GSE53819) were obtained. The GSE40290 dataset contained 25 NPC tissues and 8 normal nasopharyngeal tissues, which was detected by GPL8380 platform (Capitalbio 22K Human oligo array version 1.0). The GSE53819 dataset contained 18 NPC tissues and 18 normal nasopharyngeal tissues, which was detected by GPL6480 platform (Agilent-014850 Whole Human Genome Microarray 4x44K G4112F). Then, GSE102349 with 113 NPC patients and GSE12452 with 31 NPC patients were also downloaded for survival and diagnostic analysis respectively, because of their completely clinical information.
Acquisition of differentially expressed genes (DEGs)
GEO2R was applied to identify the DEGs of GSE40290 and GSE53819 according to the criteria of adjusted P value < 0.05 and | logFC | > 1. The genes with logFC > 1 were considered as up-regulated genes and the genes with logFC < -1 were considered as down-regulated genes. Then the heat map of top 50 DEGs and the volcano map of all genes were drawn by pheatmap and ggplot2 package of R 3.6.1 software. Venn software was used to obtain the overlap of the two datasets.
Functional annotation of DEGs
GO analysis interpreted genes from three aspects: biological process (BP), cellular component (CC) and molecular function (MF). Signaling pathways, which the DEGs might involve, were analyzed via the KEGG pathway analysis. GO terms and KEGG pathway analysis of DEGs were carried out through the Database for Annotation, Visualization and Integrated Discovery (DAVID, https://david.ncifcrf.gov/) and the cut-off criterion of statistical significance was P < 0.05. Then R software was used to show the results.
Screening of core genes by constructing PPI network
In order to explore the interaction of DEGs, we constructed PPI network by the Search Tool for the Retrieval of Interacting Genes (STRING, http://www.string‑db.org/) and Cytoscape 3.6.1 was used to show the network. The MCODE app of Cytoscape was applied to obtain the core genes and the parameters of MCODE were set to node score cutoff = 0.2, degree cutoff = 2, max. depth = 100 and k-core = 2. The genes with the highest MCODE-score were regarded as core genes. Then the biological process that core genes might involve was predicted and visualized by the BinGO app in Cytoscape software (P < 0.01).
Validation of expression and clinical analysis of core genes
The GEPIA (http://gepia.cancer-pku.cn/) and the Oncomine databases (https://www.oncomine.org) were applied to validate the expression level of core genes between NPC tissues and normal nasopharyngeal tissues. The effect of core genes on survival time of NPC patients was showed by GEPIA database. Then GSE102349 dataset was used to evaluate the effect of core genes on PFS of NPC patients via R software and GSE12452 dataset was used to evaluate the diagnostic value of these core genes for NPC with receiver operating characteristic (ROC) curve via GraphPad Prism software. cBioPortal database (https://www.cbioportal.org/) was applied to perform analysis of genetic alterations related to the core genes based on TCGA. The cut-off criterion of statistical significance was P < 0.05.
TF-microRNA coregulatory interactions
The NetworkAnalyst (https://www.networkanalyst.ca/NetworkAnalyst/home.xhtml) is an online analytic platform. The transcription factors (TF) and microRNAs of core genes were obtained via the NetworkAnalyst online tool based on RegNetwork repository, which collected the literature curated regulatory interaction information. The coregulatory network was constructed by Cytoscape software. Then, the expression of key elements of the network in NPC cells were evaluated by qRT-PCR.
Cell lines
Human NPC cell lines (CNE1, CNE2, 6-10B, 5-8F) and normal nasopharyngeal cell (NP69) were from Sun Yat-sen University (Guangzhou, China). They were cultured in RPMI-1640 (Biological Industries) with 10% fetal bovine serum (Biological Industries) and stored at 37℃ with 5% CO2.
RNA extraction and quantitative real-time PCR (qRT-PCR)
Total RNAs of cells were extracted by Trizol reagent (Invitrogen) and converted into complementary DNA (cDNA) using the PrimeScriptTMRT Master Mix (Takara, China) according to the manufacture's protocol. Then, TB Green® Premix Ex TaqTM II (Takara, China) was used to perform qRT-PCR. GAPDH and U6 was used as an internal control to normalize results and the relative expression of core genes were evaluated by the 2-ΔΔCt method. All experiments were repeated in three times. The primers were synthesized by Sango Biotech (Shanghai, China) and the sequences of all primers were presented in Table 1.
The sequences of all primers for qRT-PCR
| Genes | Forward primer (5'-3') | Reverse primer (5'-3') |
|---|---|---|
| FN1 | TGATCACATGGACGCCTGC | GAGTCAAGCCGGACACAACG |
| MMP1 | AAGAATGATGGGAGGCAAGT | GGTTTCAGCATCTGGTTTCC |
| MMP3 | AGTCTTCCAATCCTACTGTTGCT | TCCCCGTCACCTCCAATCC |
| PLAU | AACTCTGCCACTGTCCTTC | CGGTTGTCTGGGTTCCTG |
| PLAUR | GCCTTACCGAGGTTGTGTGT | CATCCAGGCACTGTTCTTCA |
| SERPINE1 | AGTGGACTTTTCAGAGGTGGA | GCCGTTGAAGTAGAGGGCATT |
| SPP1 | TGCTGGTTGTAGACCCCAAAAG | CAGGGAGTTTCCATGAAGCCAC |
| COL8A1 | CCACTTGCAGTATGGCAAAGA | CCCTCGTAAACTGGCTAATGGTA |
| COL10A1 | AAGAATGGCACCCCTGTAATGT | ACTCCCTGAAGCCTGATCCA |
| COL17A1 | CTGACTTTGCTGGAGATCTGG | TAGGCCATCCCTTGCAGTAG |
| c-JUN | AAAGGAAGCTGGAGAGAATCG | TGTTTAAGCTGTGCCACCTG |
| hsa-miR-127-5p | GCCGAGCTGAAGCTCAGAGG | CTCAACTGGTGTCGTGGA |
| hsa-miR-144 | ACACTCCAGCTGGGTACAGTA | CTCAACTGGTGTCGTG |
| hsa-miR-204 | CTGTCACTCGAGCTGCTGGAATG | ACCGTGTCGTGGAGTCGGCAATT |
| hsa-miR-802 | CAGTAACAAAGATTCATCC | GAACATGTCTGCGTATCTC |
| GAPDH | ACAACTTTGGTATCGTGGAAGG | GCCATCACGCCACAGTTTC |
| U6 | CTCGCTTCGGCAGCACATATACT | ACGCTTCACGAATTTGCGTGTC |
Western blot analysis
Three core genes (COL8A1, COL10A1, COL17A1), that have not been reported in NPC, were selected for western blot analysis in cell lines. Cells were collected at 90% confluence and total proteins of cells were extracted with cell lysis buffer and heated at 95 °C for 10 minutes. Then the proteins were electrophoresed and transferred to polyvinyl fluoride (PVDF) membranes (Immobilon®-P). After sealing with 5% defatted milk for 2h at room temperature (RT), the membranes were incubated with the first antibody overnight at 4℃. Then the membranes were incubated with the second antibody for 2h at RT after washing with PBST. The target bands of the membrane were visualized and photographed by smearing the chemiluminescence reagent. Then, Image J software was used to quantify the relative intensity level of the target bands. The anti-COL8A1 (ab58776), anti-COL10A1 (ab58632) and anti-COL17A1 (ab184996) were purchased from Abcam. The anti-GAPDH (10494-1-AP), HRP goat anti-rabbit IgG antibody (SA00001-2) were provided by San Ying Biotechnology, China.
Statistical analysis
GraphPad Prism 8 and Excel were used for statistical analysis. The results were described as mean ± SD. Two-tailed Student's t-test was used to calculate statistical significance. The cut-off criterion of statistical significance was P < 0.05.
Results
Screening of DEGs in NPC
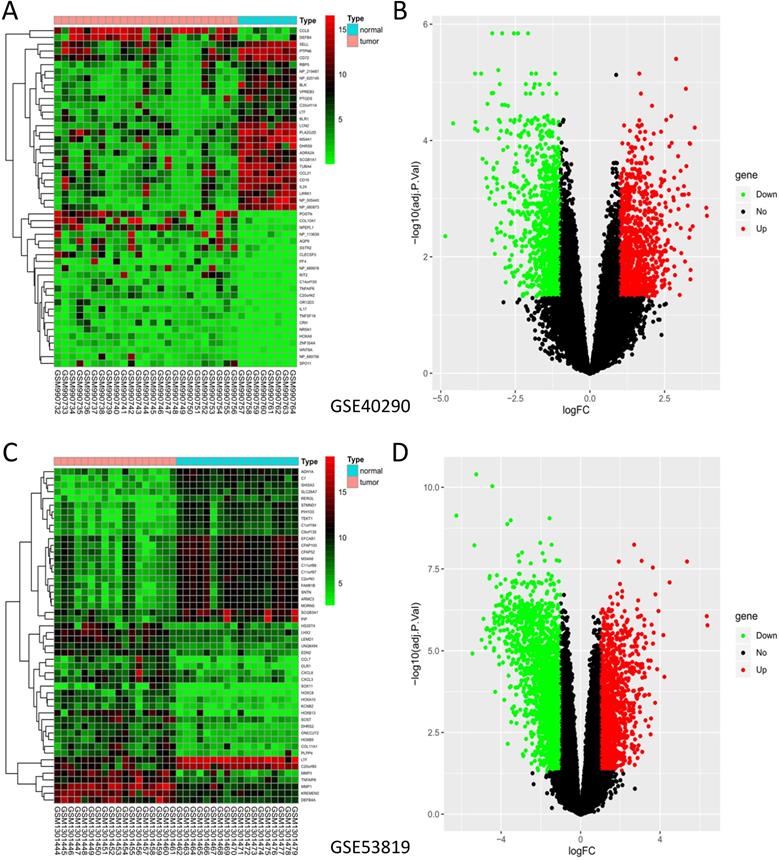
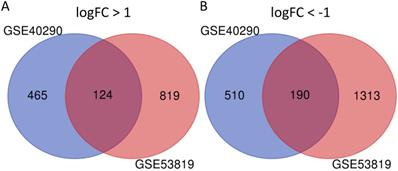
GSE40290 and GSE53819 contained 43 NPC tissues and 26 normal nasopharyngeal tissues totally. On the basis of selection criteria including adjusted P value < 0.05, | logFC | > 1 via GEO2R tool, 1289 DEGs were identified in GSE40290 totally, including 589 up-regulated genes and 700 down-regulated genes (Fig. 1B). Then 2446 DEGs were identified in GSE53819 totally, including 943 up-regulated genes and 1503 down-regulated genes (Fig. 1D). The heat maps showed the top 50 DEGs of GSE40290 and GSE53819 (Fig. 1A, C). Then, the overlap of GSE40290 and GSE53819 was obtained by Venn software, which contained 314 commonly DEGs including 124 up-regulated genes and 190 down-regulated genes (Fig. 2A, B).
DEGs of GSE40290 and GSE53819. Heatmap of the top 50 DEGs: (A) GSE40290; (C) GSE53819; Volcano map: (B) GSE40290; (D) GSE53819. Red: up-regulated DEGs, green: down-regulated DEGs, black: no difference.
314 commonly DEGs of GSE40290 and GSE53819. (A) 124 up-regulated DEGs; (B) 190 down-regulated DEGs.
Functional analysis of DEGs
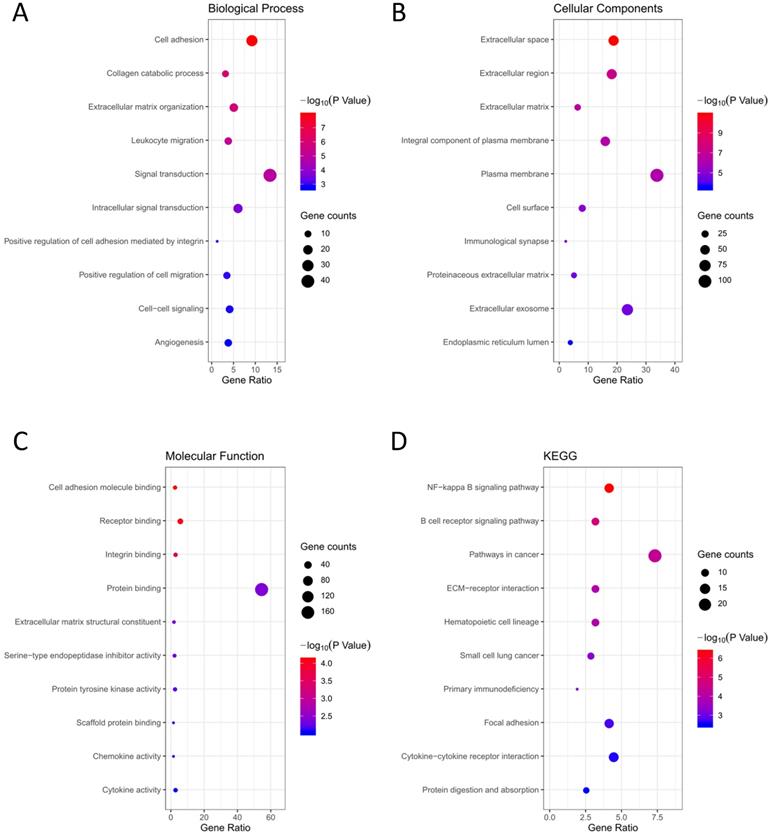
GO terms and KEGG pathway analysis of the 314 DEGs were carried out via DAVID database. BP, CC and MF are parts of GO annotation. For BP, the DEGs were mainly related to signal transduction, extracellular matrix organization, cell adhesion, collagen catabolic process and leukocyte migration, et al. (Fig. 3A, Table 2). For CC, the DEGs were mainly related to extracellular region, plasma membrane, extracellular space, extracellular matrix and integral component of plasma membrane, et al. (Fig. 3B, Table 2). For MF, the DEGs were mainly related to protein binding, cell adhesion molecule binding, receptor binding, integrin binding and extracellular matrix structural constituent, et al. (Fig. 3C, Table 2). KEGG analysis revealed that the NF-kappa B (NF-κB) signaling pathway, pathways in cancer, B cell receptor signaling pathway, ECM-receptor interaction and hematopoietic cell lineage were mainly enriched signaling pathways (Fig. 3D, Table 2).
Functional analysis of the 314 DEGs. (A) BP; (B) CC; (C) MF; (D) KEGG pathway analysis.
The GO and KEGG pathway analysis of 314 DEGs in NPC
| Category | Term | Count | % | P Value | FDR |
|---|---|---|---|---|---|
| GOTERM_BP_DIRECT | GO:0007155~cell adhesion | 29 | 0.064215 | 1.20E-08 | 2.04E-05 |
| GOTERM_BP_DIRECT | GO:0030574~collagen catabolic process | 10 | 0.022143 | 1.71E-06 | 0.002913 |
| GOTERM_BP_DIRECT | GO:0030198~extracellular matrix organization | 16 | 0.035429 | 2.11E-06 | 0.003594 |
| GOTERM_BP_DIRECT | GO:0050900~leukocyte migration | 12 | 0.026572 | 1.05E-05 | 0.017855 |
| GOTERM_BP_DIRECT | GO:0007165~signal transduction | 42 | 0.093001 | 1.59E-05 | 0.026996 |
| GOTERM_CC_DIRECT | GO:0005615~extracellular space | 59 | 0.130644 | 1.50E-11 | 1.99E-08 |
| GOTERM_CC_DIRECT | GO:0005576~extracellular region | 57 | 0.126215 | 8.37E-08 | 1.11E-04 |
| GOTERM_CC_DIRECT | GO:0031012~extracellular matrix | 20 | 0.044286 | 5.79E-07 | 7.66E-04 |
| GOTERM_CC_DIRECT | GO:0005887~integral component of plasma membrane | 50 | 0.110715 | 7.09E-07 | 9.38E-04 |
| GOTERM_CC_DIRECT | GO:0005886~plasma membrane | 106 | 0.234716 | 1.00E-06 | 0.001323 |
| GOTERM_MF_DIRECT | GO:0050839~cell adhesion molecule binding | 8 | 0.017714 | 7.90E-05 | 0.113113 |
| GOTERM_MF_DIRECT | GO:0005102~receptor binding | 18 | 0.039857 | 1.06E-04 | 0.151684 |
| GOTERM_MF_DIRECT | GO:0005178~integrin binding | 9 | 0.019929 | 3.96E-04 | 0.565681 |
| GOTERM_MF_DIRECT | GO:0005515~protein binding | 171 | 0.378645 | 0.004543 | 6.314384 |
| GOTERM_MF_DIRECT | GO:0005201~extracellular matrix structural constituent | 6 | 0.013286 | 0.005372 | 7.425958 |
| KEGG_PATHWAY | hsa04064: NF-kappa B signaling pathway | 13 | 0.028786 | 4.62E-07 | 5.77E-04 |
| KEGG_PATHWAY | hsa04662: B cell receptor signaling pathway | 10 | 0.022143 | 2.12E-05 | 0.026444 |
| KEGG_PATHWAY | hsa05200: Pathways in cancer | 23 | 0.050929 | 6.18E-05 | 0.077161 |
| KEGG_PATHWAY | hsa04512: ECM-receptor interaction | 10 | 0.022143 | 1.36E-04 | 0.169313 |
| KEGG_PATHWAY | hsa04640: Hematopoietic cell lineage | 10 | 0.022143 | 1.36E-04 | 0.169313 |
Screening of core genes based on PPI network
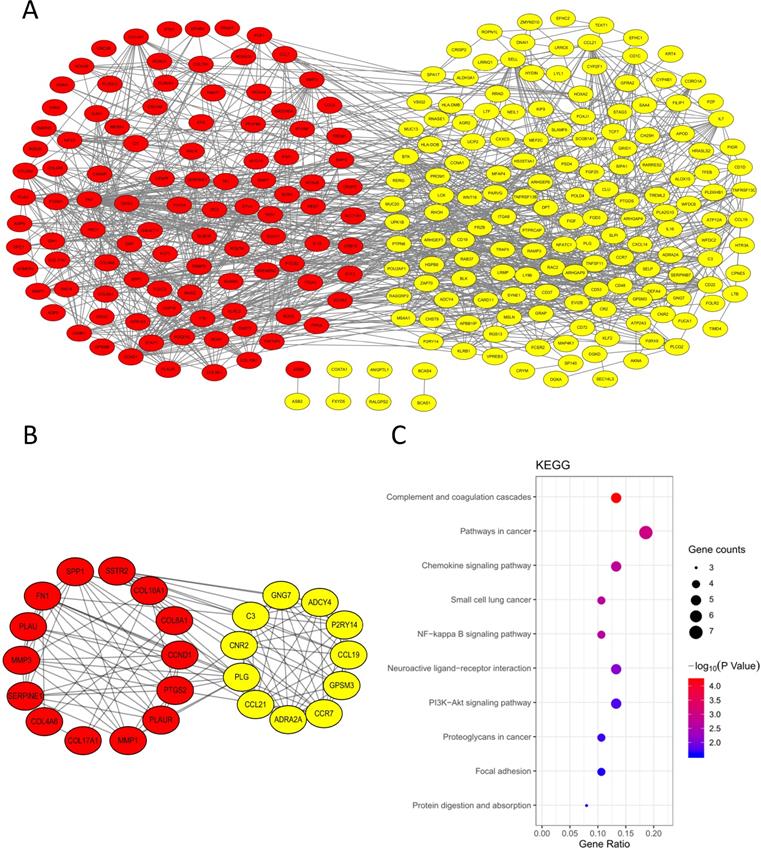
In order to explore the interaction of 314 DEGs, we established PPI network. As shown, the network contained 313 nodes and 1026 edges (Fig. 4A). Subsequently, the module with the highest MCODE-score (9.583) was screened out by MCODE app and the module contained 25 core genes and 115 edges (Fig. 4B). The KEGG pathway of 25 core genes was analyzed by DAVID and they were mainly enriched in pathways in cancer, small cell lung cancer, complement and coagulation cascades, chemokine signaling pathway and NF-κB signaling pathway, et al. (Fig. 4C, Table 3).
PPI network. (A) PPI network of the 314 DEGs; (B) Module analysis of the network. Red: up-regulated genes, yellow: down-regulated genes; (C) KEGG analysis of the 25 core genes in the module.
The KEGG pathway analysis of 25 core genes in NPC
| Category | Term | Count | % | P Value | FDR |
|---|---|---|---|---|---|
| KEGG_PATHWAY | hsa04610: Complement and coagulation cascades | 5 | 0.133120 | 6.37E-05 | 0.070385 |
| KEGG_PATHWAY | hsa05200: Pathways in cancer | 7 | 0.186368 | 0.001209 | 1.329008 |
| KEGG_PATHWAY | hsa04062: Chemokine signaling pathway | 5 | 0.133120 | 0.001949 | 2.134442 |
| KEGG_PATHWAY | hsa05222: Small cell lung cancer | 4 | 0.106496 | 0.002332 | 2.548887 |
| KEGG_PATHWAY | hsa04064: NF-kappa B signaling pathway | 4 | 0.106496 | 0.002581 | 2.817598 |
The expression of core genes
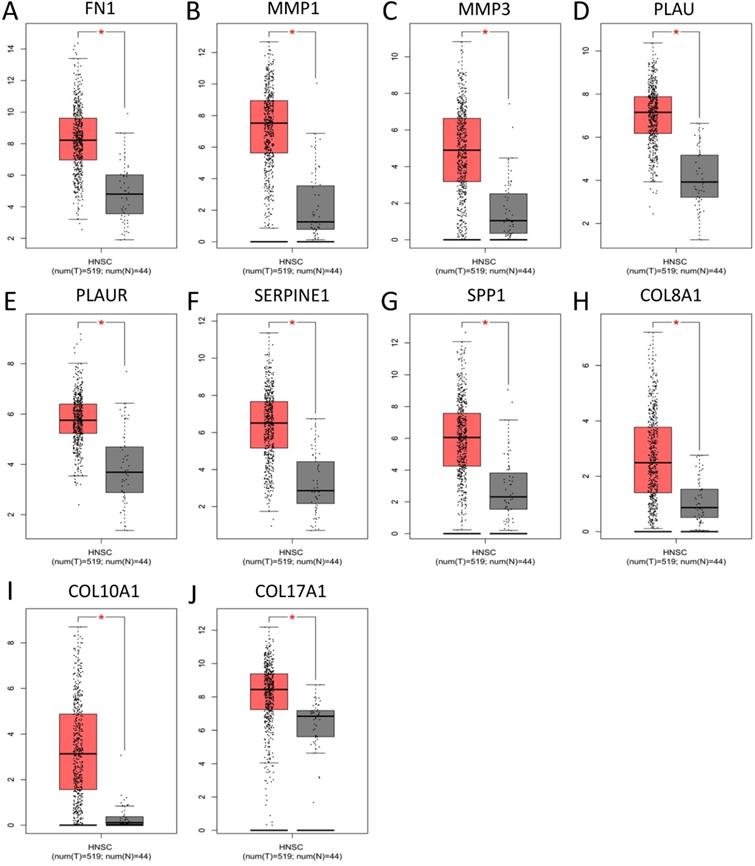
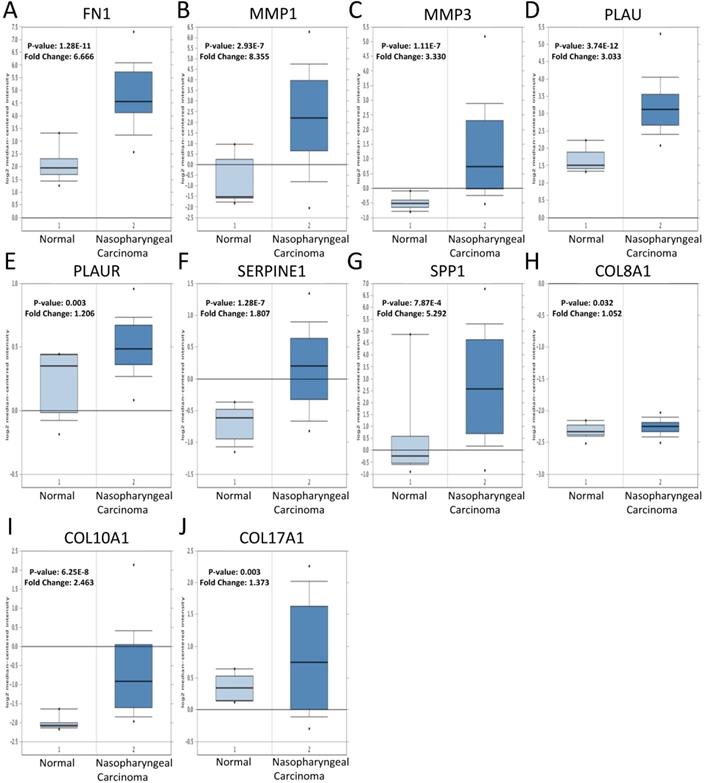
To validate the expression of 25 core genes in NPC tissues, we uploaded the 25 core genes to GEPIA database and there were 10 core genes were revealed to be significantly over-expressed in NPC tissues contrasted to normal nasopharyngeal tissues, including FN1, MMP1, MMP3, PLAU, PLAUR, SERPINE1, SPP1, COL8A1, COL10A1 and COL17A1, which were consistent with GSE40290 and GSE53819 (P < 0.05, Fig. 5). The results were also validated by Oncomine database (FN1: fold change = 6.666, P = 1.28E-11; MMP1: fold change = 8.355, P = 2.93E-7; MMP3: fold change = 3.330, P = 1.11E-7; PLAU: fold change = 3.033, P = 3.74E-12; PLAUR: fold change = 1.206, P = 0.003; SERPINE1: fold change = 1.807, P = 1.28E-7; SPP1: fold change = 5.292, P = 7.87E-4; COL8A1: fold change = 1.052, P = 0.032; COL10A1: fold change = 2.463, P = 6.25E-8; COL17A1: fold change = 1.373, P = 0.003) (Fig. 6).
Significantly expressed 10 core genes in NPC tissues compared to normal tissues in GEPIA: (A) FN1; (B) MMP1; (C) MMP3; (D) PLAU; (E) PLAUR; (F) SERPINE1; (G) SPP1; (H) COL8A1; (I) COL10A1; (J) COL17A1. Red: tumor tissues, grey: normal tissues. *: P < 0.05.
Verification of the expression of the 10 core genes in NPC tissues compared to normal tissues in Oncomine: (A) FN1; (B) MMP1; (C) MMP3; (D) PLAU; (E) PLAUR; (F) SERPINE1; (G) SPP1; (H) COL8A1; (I) COL10A1; (J) COL17A1. The cut-off criterion of statistical significance was P < 0.05.
Experimental validation
The expression of the 10 core genes in NPC cells (CNE1, CNE2, 6-10B, 5-8F) and normal nasopharyngeal cell (NP69) were evaluated by qRT-PCR and we found that they were significantly up-regulated in NPC cells compared with normal nasopharyngeal cell (P < 0.05, Fig. 7A).
The expression of the 10 core genes in NPC cells (CNE1, CNE2, 6-10B, 5-8F) and normal nasopharyngeal cell (NP69). (A) qRT-PCR; (B) Western blot analysis. *: P < 0.05, **: P < 0.01, ***: P < 0.001, ****: P < 0.0001.
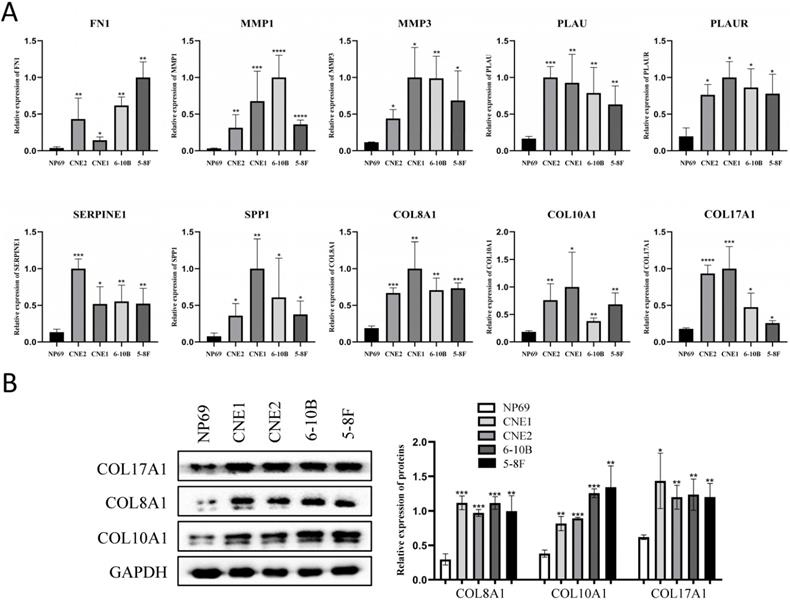
Furthermore, the roles of COL8A1, COL10A1 and COL17A1 in NPC have not been reported, while other seven core genes in NPC have been studied already. Therefore, they were selected for western blot analysis in cell lines and they were also validated to be up-regulated in NPC cells at protein level (P < 0.05, Fig. 7B).
Genetic information of core genes
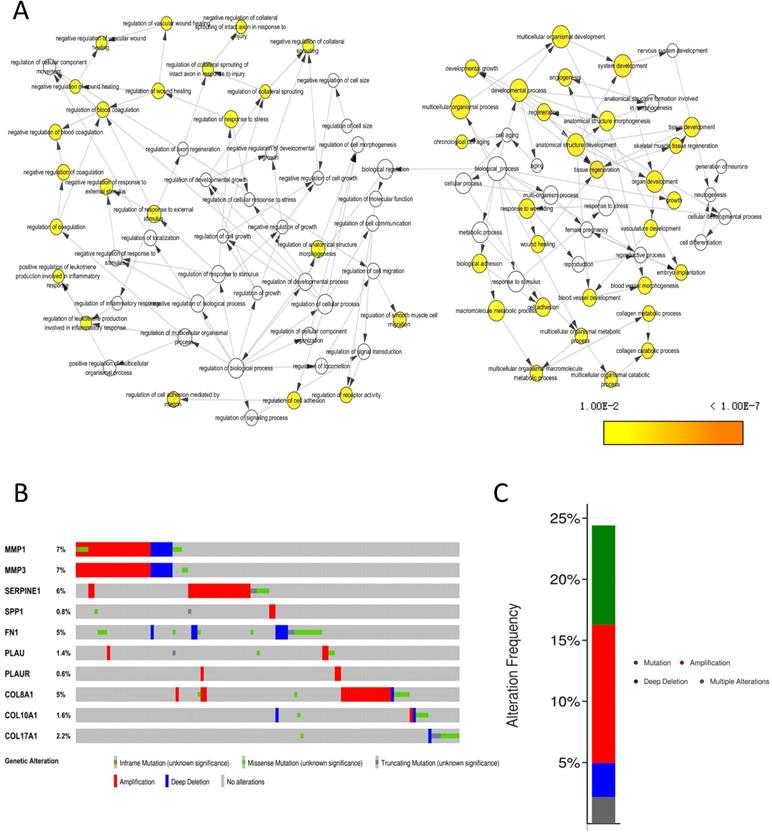
The biological process that the 10 core genes might involve was analyzed by the BinGO app of Cytoscape software and they were enriched in multicellular organismal development, angiogenesis and regulation of wound healing, et al. (Fig. 8A). By analyzing genetic alterations of the 10 core genes in NPC via cBioPortal database, we found that MMP1 (7%), MMP3 (7%) and SERPINE1 (6%) had the highest frequency of alterations in the 10 core genes (Fig. 8B) and the alterations of the 10 core genes occurred in 123 (24%) of 504 patients (Fig. 8C).
Genetic information of the 10 core genes. (A) Biological process (P < 0.01); (B) Genetic alterations in cBioPortal database; (C) Alteration frequency.
The construction of TF-microRNA coregulatory network
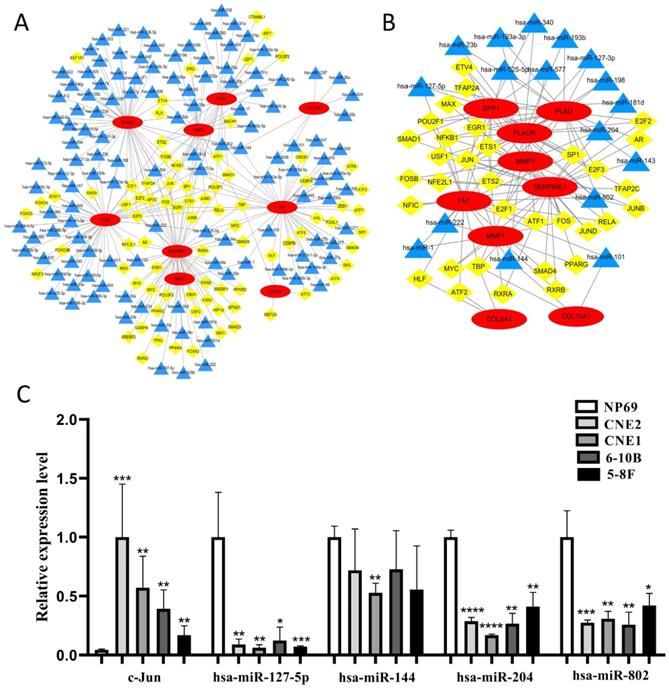
We constructed the TF-microRNA coregulatory network of 10 core genes by NetworkAnalyst database and Cytoscape software to further investigate the potential function of the 10 core genes. In the network, nine core genes could be identified (except for COL17A1) and there were 80 TFs, 127 microRNAs totally (Fig. 9A). After removing the points with only one degree of correlation, 33 TFs and 17 microRNAs were identified (Fig. 9B). We found that Jun could regulate six core genes. Simultaneously, four microRNAs (hsa-miR-127-5p, hsa-miR-144, hsa-miR-204, hsa-miR-802) could regulate three core genes. Therefore, Jun and the four microRNAs were selected as key elements in the network and their expression in NPC cells were evaluated by qRT-PCR (Fig. 9C). We found that Jun was significantly up-regulated in NPC cells, and three microRNAs (hsa-miR-127-5p, hsa-miR-204, hsa-miR-802) were significantly down-regulated in NPC cells (P < 0.05). These results indicated that the key elements might be involved in the upstream mechanisms that regulate core genes.
The construction of TF-microRNA coregulatory network. (A) Integrative regulatory network of TF-mRNA-microRNA; (B) Network after removing the points with only one degree of correlation; (C) The expression of key elements in TF-microRNA coregulatory network in NPC cells. Red: core genes, yellow: TFs, blue: microRNAs, *: P < 0.05, **: P < 0.01, ***: P < 0.001, ****: P < 0.0001.
Clinical analysis of core genes
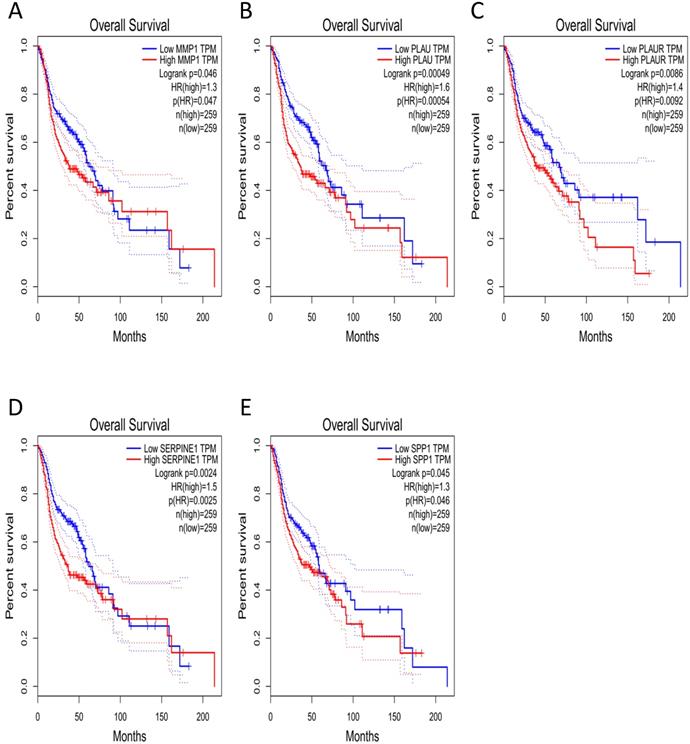
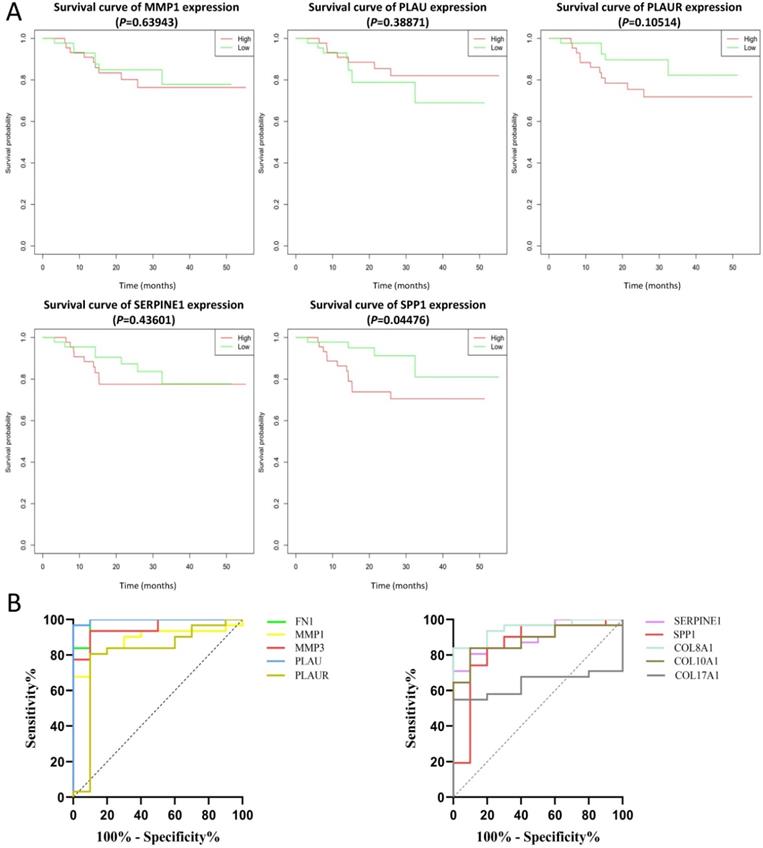
The effect of the 10 core genes on prognosis of NPC patients was analyzed by GEPIA database. Then we found that 5 of the 10 core genes had influence on the survival of NPC patients, including MMP1 (HR = 1.3, P = 0.04700), PLAU (HR = 1.6, P = 0.00054), PLAUR (HR = 1.4, P = 0.00920), SERPINE1 (HR = 1.5, P = 0.00250) and SPP1 (HR = 1.3, P = 0.04600) (Fig. 10). In addition, GSE102349 with 113 NPC patients was downloaded to re-evaluate the effect of the five core genes on PFS of NPC patients and the clinical parameters of 113 patients were presented in Table 4. We found that only high expression of SPP1 was significantly related with poor PFS of NPC patients (P = 0.04476, Fig. 11A). Then, the diagnostic value of the 10 core genes in NPC was evaluated via GSE12452 dataset and we found that the area under the curve (AUC) of nine core genes (FN1, MMP1, MMP3, PLAU, PLAUR, SERPINE1, SPP1, COL8A1, COL10A1) were all more than 0.8 (P < 0.05, Fig. 11B, Table 5) and among them, the AUC of FN1 and PLAU were close to 1. These results indicated that the nine genes might be diagnostic markers of NPC.
The prognostic analysis of core genes in NPC based on GEPIA: (A) MMP1; (B) PLAU; (C) PLAUR; (D) SERPINE1; (E) SPP1. The cut-off criterion of statistical significance was P < 0.05.
Clinical characteristics of 113 NPC patients in GSE102349
| Characteristics | Number of patients |
|---|---|
| Age (years) | |
| Median | 45.5 |
| 25th percentile | 39 |
| 75th percentile | 54 |
| Gender | |
| Male | 86 |
| Female | 26 |
| Unknown | 1 |
| Smoking history | |
| Smokers | 32 |
| Non-smokers | 46 |
| Unknown | 35 |
| Histologic type | |
| Non-keratinizing carcinoma, differentiated | 85 |
| Non-keratinizing carcinoma, undifferentiated | 22 |
| Unknown | 6 |
| Clinical stage | |
| Stage I | 5 |
| Stage II | 2 |
| Stage III | 41 |
| Stage IV | 25 |
| Unknown | 40 |
The prognostic analysis (A) and diagnostic analysis (B) of core genes in NPC based on GSE102349 and GSE12452 datasets, respectively. The cut-off criterion of statistical significance was P < 0.05.
The diagnostic analysis of core genes in NPC based on GSE12452
| Core genes | P value | AUC with 95% CI |
|---|---|---|
| FN1 | < 0.0001 | 0.9839 (0.9490-1.0000) |
| MMP1 | 0.0003 | 0.8871 (0.7847-0.9895) |
| MMP3 | < 0.0001 | 0.9516 (0.8889-1.0000) |
| PLAU | < 0.0001 | 0.9968 (0.9863-1.0000) |
| PLAUR | 0.0043 | 0.8032 (0.6194-0.9870) |
| SERPINE1 | 0.0002 | 0.8968 (0.8017-0.9918) |
| SPP1 | 0.0009 | 0.8516 (0.6940-1.0000) |
| COL8A1 | < 0.0001 | 0.9484 (0.8845-1.0000) |
| COL10A1 | 0.0003 | 0.8839 (0.7802-0.9875) |
| COL17A1 | 0.1917 | 0.6387 (0.4765-0.8009) |
AUC: The area under the curve; CI: Confidence interval.
Discussion
NPC is a malignant tumor originating from epithelium of nasopharynx and the most powerful predictor for prognosis is the stage of NPC. The 5-year survival rate of patients could decrease with the increase of the stage of NPC [11]. However, NPC is generally diagnosed at a locoregionally advanced stage [12]. Therefore, early diagnosis is beneficial to prolong the survival time of NPC patients. It is key to explore the pathogenesis of NPC and search for molecular markers related to early diagnosis of NPC.
In our study, we identified 314 DEGs of NPC totally based on GSE40290 and GSE53819. These genes were found to be mainly related to signal transduction, extracellular matrix organization and cell adhesion based on GO analysis. For KEGG analysis, we found that NF-κB signaling pathway, pathways in cancer and B cell receptor signaling pathway were mainly enriched pathways, which were mostly associated with the development of cancer. NF-κB is a nuclear transcription factor and participates in regulating the expression of multiple genes that are important for tumorigenesis, inflammation and autoimmune diseases [13]. NF-κB signaling pathway mediated chronic inflammation might contribute to persistent EBV infection that further contributes to nasopharyngeal carcinogenesis [14-16]. Then, 10 up-regulated core genes were obtained by constructing PPI network and gene expression level analysis in NPC, including FN1, MMP1, MMP3, PLAU, PLAUR, SERPINE1, SPP1, COL8A1, COL10A1 and COL17A1. Subsequently, the expression of SPP1 was found to be negatively correlated with overall survival and PFS of NPC patients by GEPIA and GSE102349 dataset, which indicated that SPP1 might be a prognostic marker for NPC. In addition, based on ROC curve analysis of GSE12452, nine genes (FN1, MMP1, MMP3, PLAU, PLAUR, SERPINE1, SPP1, COL8A1, COL10A1) might serve as diagnostic markers of NPC.
Fibronectin 1 (FN1) is a member of the ligand glycoprotein family, which is expressed in many kinds of cells and participates in cellular adhesion and migration process [17]. The high expression of FN1 suppressed apoptosis of NPC cells by NF-κB pathway, which might lead to cell migration [18]. MMP1 and MMP3 are members of matrix metalloproteinases (MMPs) [19]. MMP1 belongs to collagenase and Song et al. found that MMP1 was over-expressed in NPC and it could promote cell proliferation, suppress cell apoptosis and increase the resistance to 5-fluorouracil in NPC [20]. MMP3 was induced by Zta, which was a lytic transactivator of Epstein-Barr virus, and promoted cell migration and invasion in NPC [21]. PLAU is urokinase-type plasminogen activator and PLAUR is the receptor of PLAU. They were also reported to promote NPC cell proliferation and invasion through different signaling pathways, such as Notch signaling pathway and JAK-STAT pathway [22, 23]. Serpin Family E Member 1 (SERPINE1) is a fibrinolytic inhibitor, which plays a crucial role in various tumors [24]. Sang et al. found that the transcription factor TEL2 suppressed metastasis of NPC by down-regulating SERPINE1 and the up-regulation of SERPINE1 could promote metastasis of NPC [25]. Secreted phosphoprotein 1 (SPP1) is a phosphorylated extracellular matrix protein, which is a metastasis-associated gene [26]. In NPC, the high expression of SPP1 resulted in shorter survival time of NPC patients and SPP1 could improve the ability of cell proliferation and migration [27, 28]. COL8A1, COL10A1 and COL17A1 are all members of collagen family. Collagen is the main structural protein in the extracellular space, which participates in the formation of tumor microenvironment and promotes metastasis of tumor [29]. The expression of COL8A1, COL10A1 and COL17A1 were found to be significantly elevated in many different tumor types [30-34] and they were all tumor-related genes. COL8A1 could improve the ability of cell proliferation and invasion, and the over-expression of COL8A1 was associated with the lymphatic metastasis of hepatocellular carcinoma [35]. COL10A1 was proved to promote metastasis by inducing epithelial-mesenchymal transition in gastric cancer [31] and the over-expression of COL10A1 had a negative effect on the prognosis of patients in colorectal cancer [32]. COL17A1 might be related to cellular motility and adhesion, which had the potential to promote the progress of tumor [36]. However, the role of COL8A1, COL10A1 and COL17A1 in NPC has not been studied. In our study, the three novel genes were validated to be significantly up-regulated in NPC tissues and cells. Furthermore, the ROC curve analysis showed that COL8A1 and COL10A1 had good diagnostic value for NPC and they might be diagnostic markers for NPC. DEGs were mainly enriched in extracellular matrix related biological processes in our study and the three novel genes are collagen, which is the main component of extracellular matrix and participates in the formation of tumor microenvironment [29]. These results suggested that they might play a regulatory role in NPC by altering tumor microenvironment and regulating cellular adhesion, which needs further experimental explorations to validate in the future.
Furthermore, the TF-microRNA coregulatory network of the 10 core genes was constructed and there were 33 TFs and 17 microRNAs in the network. We found that Jun could regulate the most core genes, including MMP1, MMP3, PLAU, PLAUR, SERPINE1 and SPP1. Cellular Jun (c-Jun) is an essential member of the activating protein-1 (AP-1) transcription factor family, which can induce oncogenic transformation [37]. AP-1 is a dimer composed of c-Jun and c-Fos [38]. The AP-1 binding sites in the promoter of MMP1 and MMP3 were essential for the expression of the two genes [39, 40], and the combination of them promoted the expression of MMP1 in osteosarcoma [39]. In addition to be induced by AP-1, PLAU and PLAUR could also up-regulate the expression of AP-1, which promoted the invasion of trophoblast [41]. c-Jun could also induce the expression of SERPINE1 in human hepatoma cell line [42] and might cause the migration of endothelial cell [43]. SPP1 was found to be regulated by c-Jun N-terminal kinase (JNK) signaling pathway and could promote the lung metastasis of breast cancer [44]. There were four microRNAs (hsa-miR-127-5p, hsa-miR-144, hsa-miR-204, hsa-miR-802) could regulate three core genes in the network (Fig. 9B). hsa-miR-127-5p could combine with the 3'UTR of SPP1 to inhibit the proliferation of chondrocyte in osteoarthritis [45]. Zhang et al. discovered that hsa-miR-144 could combine with 3'UTR of FN1 to inhibit cell invasion in papillary thyroid cancer [46]. hsa-miR-204 was down-regulated in NPC cells as well as tissues and it could inhibit cell invasion and radioresistance by regulating target gene in NPC [47]. The regulatory relationship between MMP3, PLAUR, SERPINE1 and hsa-miR-204 in the network have not been reported, but the three core genes were predicted as target genes of hsa-miR-204 by miRTarBase database. hsa-miR-802 is also a tumor-related microRNA and it could inhibit the development of many tumors like gastric cancer and ovarian cancer [48, 49]. However, whether hsa-miR-802 can regulate the three core genes (FN1, PLAUR, SPP1) needs further study to validate. We evaluated the expression of the five key elements in NPC cells and we found that c-Jun was significantly up-regulated in NPC cells, and three microRNAs (hsa-miR-127-5p, hsa-miR-204, hsa-miR-802) were significantly down-regulated in NPC cells (P < 0.05). These results indicated that these key elements might be involved in the upstream mechanism that regulates core genes. Core genes might promote the development of NPC through transcriptional regulation of c-Jun and the three microRNAs might inhibit the progress of NPC by silencing the expression of their corresponding core genes.
There were several studies have previously identified many DEGs of NPC through bioinformatical analysis [50-52]. Compared with previous studies, the advantages of our study may be summarized as follows: Firstly, these previous reports have only screened core genes for NPC and they did not further evaluate the clinical value of core genes for NPC. Due to the lack of clinical data of NPC in public databases, very few studies have evaluated the clinical value of core genes for NPC. Han et al. only explored the effect of their core genes on prognosis of NPC patients based on the clinical data of head and neck squamous cell carcinoma (HNSCC) in public database [53]. However, the clinical features of NPC and HNSCC are different. Therefore, the validation based on HNSCC was not specific for NPC. In our present study, gene expression datasets of NPC from GEO database, including GSE102349 and GSE12452, were used for prognostic and diagnostic analysis of core genes in NPC, respectively. Therefore, the evaluation of core genes related clinical value for NPC in our present study were more reliable than these previous studies and we also obtained several prognostic and diagnostic biomarkers for NPC. Secondly, multiple previous reports have only selected key biomarkers of NPC at mRNA level and they did not further explore upstream molecules that might regulate core genes [53-55]. In our present study, we constructed TF-microRNA regulatory network of core genes. The expression of the key elements in network, including c-Jun, hsa-miR-127-5p, hsa-miR-204, hsa-miR-802, were also validated in NPC cells and they might be involved in the upstream mechanism that regulate core genes, which provides a new direction to study the pathogenesis of NPC. Thirdly, three novel genes that have not been studied in NPC were identified in our study, including COL8A1, COL10A1 and COL17A1. The three core genes might be novel molecules that participated in nasopharyngeal carcinogenesis, which are worthy for further study.
In conclusion, the purpose of the present study was to identify DEGs and potential pathways for NPC through bioinformatical methods. 314 DEGs were identified totally and several biological processes and signaling pathways that these DEGs mainly enriched in, including extracellular matrix related biological processes, NF-κB signaling pathway, pathways in cancer, B cell receptor signaling pathway and ECM-receptor interaction, might be critical for nasopharyngeal carcinogenesis. 10 up-regulated core genes were screened out and the upstream TFs and microRNAs of the 10 core genes, including c-Jun, hsa-miR-127-5p, hsa-miR-204 and hsa-miR-802, might participate in nasopharyngeal carcinogenesis by regulating corresponding core genes. Prognostic analysis revealed that the expression of SPP1 was negatively correlated with overall survival and PFS of NPC patients. Diagnostic analysis revealed that these core genes, including FN1, MMP1, MMP3, PLAU, PLAUR, SERPINE1, SPP1, COL8A1, COL10A1, had high diagnostic value for NPC. Although several prognostic and diagnostic markers of NPC were screened out in our study, further experimental explorations to research the function of the candidate genes are still needed in the future.
Abbreviations
NPC: nasopharyngeal carcinoma; GEO: Gene Expression Omnibus; DEGs: differentially expressed genes; DAVID: Database for Annotation, Visualization and Integrated Discovery; GO: Gene Ontology; KEGG: Kyoto Encyclopedia of Genes and Genomes; BP: biological process; CC: cellular component; MF: molecular function; PPI: protein-protein interaction; STRING: Search Tool for the Retrieval of Interacting Genes; MCODE: Molecular Complex Detection; GEPIA: Gene Expression Profiling Interactive Analysis; TF: transcription factor; TCGA: The Cancer Genome Atlas; PFS: progression-free survival; ROC: receiver operating characteristic; AUC: area under the curve.
Acknowledgements
This work was supported by the Natural Science Foundation of Anhui Province (1408085MH189) and the National Cancer Center Climbing Fund (NCC201812B037).
Author Contributions
WQG and LH collected the data; WQG, XBZ and YYZ analyzed the data; BS and ZCT interpreted results; WQG wrote the manuscript; JG designed the study and revised the manuscript. All authors read and approved the final manuscript.
Competing Interests
The authors have declared that no competing interest exists.
References
1. Chua MLK, Wee JTS, Hui EP. et al. Nasopharyngeal carcinoma. Lancet. 2016;387:1012-1024
2. Ng WT, Wong ECY, Lee VHF. et al. Head and neck cancer in Hong Kong. Jpn J Clin Oncol. 2018;48:13-21
3. Ngan HL, Wang L, Lo KW. et al. Genomic landscapes of EBV-associated nasopharyngeal carcinoma vs. HPV-associated head and neck cancer. Cancers. 2018;10:210
4. Roy Chattopadhyay N, Das P, Chatterjee K. et al. Higher incidence of nasopharyngeal carcinoma in some regions in the world confers for interplay between genetic factors and external stimuli. Drug Discov Ther. 2017;11:170-180
5. Zhang J, Jia L, Tsang CM. et al. EBV infection and glucose metabolism in nasopharyngeal carcinoma. Adv Exp Med Biol. 2017;1018:75-90
6. Tan WL, Tan EH, Lim DW. et al. Advances in systemic treatment for nasopharyngeal carcinoma. Chin Clin Oncol. 2016;5:21
7. Prawira A, Oosting SF, Chen TW. et al. Systemic therapies for recurrent or metastatic nasopharyngeal carcinoma: a systematic review. Br J Cancer. 2017;117:1743-1752
8. Ye Z, Wang F, Yan F. et al. Bioinformatic identification of candidate biomarkers and related transcription factors in nasopharyngeal carcinoma. World J Surg Oncol. 2019;17:60
9. Zhu D, Shao M, Yang J. et al. Curcumin enhances radiosensitization of nasopharyngeal carcinoma via mediating regulation of tumor stem-like cells by a circRNA network. J Cancer. 2020;11:2360-2370
10. Zhang Z, Huang J, Wang G. et al. Serum miRNAs, a potential prognosis marker of loco-regionally advanced nasopharyngeal carcinoma patients treated with CCRT. BMC Cancer. 2020;20:183
11. Petersson F. Nasopharyngeal carcinoma: a review. Semin Diagn Pathol. 2015;32:54-73
12. Chen YP, Chan ATC, Le QT. et al. Nasopharyngeal carcinoma. Lancet. 2019;394:64-80
13. Zhang Q, Lenardo MJ, Baltimore D. 30 years of NF-kappaB: a blossoming of relevance to human pathobiology. Cell. 2017;168:37-57
14. Zhang W, Guo Q, Liu G. et al. NKILA represses nasopharyngeal carcinoma carcinogenesis and metastasis by NF-kappaB pathway inhibition. PLoS Genet. 2019;15:e1008325
15. You R, Liu YP, Lin DC. et al. Clonal mutations activate the NF-kappaB pathway to promote recurrence of nasopharyngeal carcinoma. Cancer Res. 2019;79:5930-5943
16. Yi M, Cai J, Li J. et al. Rediscovery of NF-kappaB signaling in nasopharyngeal carcinoma: How genetic defects of NF-kappaB pathway interplay with EBV in driving oncogenesis? J Cell Physiol. 2018;233:5537-5549
17. Cai X, Liu C, Zhang TN. et al. Down-regulation of FN1 inhibits colorectal carcinogenesis by suppressing proliferation, migration, and invasion. J Cell Biochem. 2018;119:4717-4728
18. Wang J, Deng L, Huang J. et al. High expression of Fibronectin 1 suppresses apoptosis through the NF-kappaB pathway and is associated with migration in nasopharyngeal carcinoma. Am J Transl Res. 2017;9:4502-4511
19. Gonzalez-Avila G, Sommer B, Mendoza-Posada DA. et al. Matrix metalloproteinases participation in the metastatic process and their diagnostic and therapeutic applications in cancer. Crit Rev Oncol Hematol. 2019;137:57-83
20. Song L, Liu H, Liu Q. Matrix metalloproteinase 1 promotes tumorigenesis and inhibits the sensitivity to 5-fluorouracil of nasopharyngeal carcinoma. Biomed Pharmacother. 2019;118:109120
21. Lan YY, Yeh TH, Lin WH. et al. Epstein-Barr virus Zta upregulates matrix metalloproteinases 3 and 9 that synergistically promote cell invasion in vitro. PLoS One. 2013;8:e56121
22. Guo H, Wang F, Diao Y. et al. Knockdown of Notch1 inhibits nasopharyngeal carcinoma cell growth and metastasis via downregulation of CCL2, CXCL16, and uPA. Mol Carcinog. 2019;58:1886-1896
23. Bao YN, Cao X, Luo DH. et al. Urokinase-type plasminogen activator receptor signaling is critical in nasopharyngeal carcinoma cell growth and metastasis. Cell Cycle. 2014;13:1958-1969
24. Yang JD, Ma L, Zhu Z. SERPINE1 as a cancer-promoting gene in gastric adenocarcinoma: facilitates tumour cell proliferation, migration, and invasion by regulating EMT. J Chemother. 2019;31:408-418
25. Sang Y, Chen MY, Luo D. et al. TEL2 suppresses metastasis by down-regulating SERPINE1 in nasopharyngeal carcinoma. Oncotarget. 2015;6:29240-29253
26. Pang X, Gong K, Zhang X. et al. Osteopontin as a multifaceted driver of bone metastasis and drug resistance. Pharmacol Res. 2019;144:235-244
27. Qin H, Wang R, Wei G. et al. Overexpression of osteopontin promotes cell proliferation and migration in human nasopharyngeal carcinoma and is associated with poor prognosis. Eur Arch Otorhinolaryngol. 2018;275:525-534
28. Hou X, Wu X, Huang P. et al. Osteopontin is a useful predictor of bone metastasis and survival in patients with locally advanced nasopharyngeal carcinoma. Int J Cancer. 2015;137:1672-1678
29. Xu S, Xu H, Wang W. et al. The role of collagen in cancer: from bench to bedside. J Transl Med. 2019;17:309
30. Hansen NU, Willumsen N, Sand JM. et al. Type VIII collagen is elevated in diseases associated with angiogenesis and vascular remodeling. Clin Biochem. 2016;49:903-908
31. Li T, Huang H, Shi G. et al. TGF-beta1-SOX9 axis-inducible COL10A1 promotes invasion and metastasis in gastric cancer via epithelial-to-mesenchymal transition. Cell Death Dis. 2018;9:849
32. Huang H, Li T, Ye G. et al. High expression of COL10A1 is associated with poor prognosis in colorectal cancer. Onco Targets Ther. 2018;11:1571-1581
33. Zhang M, Chen H, Wang M. et al. Bioinformatics analysis of prognostic significance of COL10A1 in breast cancer. Biosci Rep. 2020;40:BSR20193286
34. Thangavelu PU, Krenacs T, Dray E. et al. In epithelial cancers, aberrant COL17A1 promoter methylation predicts its misexpression and increased invasion. Clin Epigenetics. 2016;8:120
35. Ma ZH, Ma JH, Jia L. et al. Effect of enhanced expression of COL8A1 on lymphatic metastasis of hepatocellular carcinoma in mice. Exp Ther Med. 2012;4:621-626
36. Jones VA, Patel PM, Gibson FT. et al. The role of collagen XVII in cancer: squamous cell carcinoma and beyond. Front Oncol. 2020;10:352
37. Vogt PK. Jun, the oncoprotein. Oncogene. 2001;20:2365-2377
38. Lin G, Yu B, Liang Z. et al. Silencing of c-jun decreases cell migration, invasion, and EMT in radioresistant human nasopharyngeal carcinoma cell line CNE-2R. Onco Targets Ther. 2018;11:3805-3815
39. Kimura R, Ishikawa C, Rokkaku T. et al. Phosphorylated c-Jun and Fra-1 induce matrix metalloproteinase-1 and thereby regulate invasion activity of 143B osteosarcoma cells. Biochim Biophys Acta. 2011;1813:1543-1553
40. Chambers M, Kirkpatrick G, Evans M. et al. IL-4 inhibition of IL-1 induced Matrix metalloproteinase-3 (MMP-3) expression in human fibroblasts involves decreased AP-1 activation via negative crosstalk involving of Jun N-terminal kinase (JNK). Exp Cell Res. 2013;319:1398-1408
41. Zheng Q, Yang Y, Cui X. et al. AP1 mediates uPA/uPAR induced FUT4 expression and trophoblast invasion. J Cell Biochem. 2018;119:6442-6451
42. Arts J, Grimbergen J, Toet K. et al. On the role of c-Jun in the induction of PAI-1 gene expression by phorbol ester, serum, and IL-1alpha in HepG2 cells. Arterioscler Thromb Vasc Biol. 1999;19:39-46
43. Montt-Guevara MM, Palla G, Spina S. et al. Regulatory effects of estetrol on the endothelial plasminogen pathway and endothelial cell migration. Maturitas. 2017;99:1-9
44. Insua-Rodríguez J, Pein M, Hongu T. et al. Stress signaling in breast cancer cells induces matrix components that promote chemoresistant metastasis. EMBO Mol Med. 2018;10:e9003
45. Liang J, Xu L, Zhou F. et al. MALAT1/miR-127-5p regulates osteopontin (OPN)-mediated proliferation of human chondrocytes through PI3K/Akt pathway. J Cell Biochem. 2018;119:431-439
46. Zhang DL, Wang JM, Wu T. et al. BAG5 promotes invasion of papillary thyroid cancer cells via upregulation of fibronectin 1 at the translational level. Biochim Biophys Acta Mol Cell Res. 2020;1867:118715
47. Lu Y, Li T, Wei G. et al. The long non-coding RNA NEAT1 regulates epithelial to mesenchymal transition and radioresistance in through miR-204/ZEB1 axis in nasopharyngeal carcinoma. Tumour Biol. 2016;37:11733-11741
48. Zhang XY, Mu JH, Liu LY. et al. Upregulation of miR-802 suppresses gastric cancer oncogenicity via targeting RAB23 expression. Eur Rev Med Pharmacol Sci. 2017;21:4071-4078
49. Yang B, Sun L, Liang L. MiRNA-802 suppresses proliferation and migration of epithelial ovarian cancer cells by targeting YWHAZ. J Ovarian Res. 2019;12:100
50. Liu K, Kang M, Zhou Z. et al. Bioinformatics analysis identifies hub genes and pathways in nasopharyngeal carcinoma. Oncol Lett. 2019;18:3637-3645
51. Zhu HM, Fei Q, Qian LX. et al. Identification of key pathways and genes in nasopharyngeal carcinoma using bioinformatics analysis. Oncol Lett. 2019;17:4683-4694
52. Zhang JZ, Wu ZH, Cheng Q. Screening and identification of key biomarkers in nasopharyngeal carcinoma: Evidence from bioinformatic analysis. Medicine. 2019;98:e17997
53. Han B, Yang X, Zhang P. et al. DNA methylation biomarkers for nasopharyngeal carcinoma. PLoS One. 2020;15:e0230524
54. Ge Y, He Z, Xiang Y. et al. The identification of key genes in nasopharyngeal carcinoma by bioinformatics analysis of high-throughput data. Mol Biol Rep. 2019;46:2829-2840
55. Hui L, Zhang J, Ding X. et al. Identification of potentially critical differentially methylated genes in nasopharyngeal carcinoma: A comprehensive analysis of methylation profiling and gene expression profiling. Oncol Lett. 2017;14:7171-7178
Author contact
![]() Corresponding author: Jin Gao, Department of Radiation Oncology, Anhui Provincial Hospital Affiliated to Anhui Medical University, Hefei 230001, China; Department of Radiation Oncology, the First Affiliated Hospital of USTC, Division of Life Sciences and Medicine, University of Science and Technology of China, Hefei 230031, China. Tel: +86 551 65898970; E-mail: gaojinsyedu.cn.
Corresponding author: Jin Gao, Department of Radiation Oncology, Anhui Provincial Hospital Affiliated to Anhui Medical University, Hefei 230001, China; Department of Radiation Oncology, the First Affiliated Hospital of USTC, Division of Life Sciences and Medicine, University of Science and Technology of China, Hefei 230031, China. Tel: +86 551 65898970; E-mail: gaojinsyedu.cn.