Impact Factor ISSN: 1837-9664

 Global reach, higher impact
J Cancer 2021; 12(7):1936-1944. doi:10.7150/jca.53675 This issue Cite
Research Paper
Prognostic significance of FSCN family in multiple myeloma
Cong Deng1*, Chaozeng Si2*, Xu Ye3, Qiang Zhou1, Tiansheng Zeng3,4,5, Zeyong Huang3,4,5, Wenhui Huang3,4,5, Pei Zhu3,4,5, Qingfu Zhong3,4,5, Zhihua Wu3,4,5, Huoyan Zhu3,4,5, Qing Lin3,4,5, Wenjuan Zhang3,4,5, Lin Fu3,4,5,6,7 ![]() , Yongjiang Zheng8
, Yongjiang Zheng8 ![]() , Tingting Qian3,4,5
, Tingting Qian3,4,5 ![]()
1. Department of Clinical laboratory, The Second Affiliated Hospital, Guangzhou Medical University, 510260 Guangzhou, China.
2. Department of Information Center, China-Japan Friendship Hospital, 100029 Beijing, China.
3. Department of Hematology, The Second Affiliated Hospital, Guangzhou Medical University, 510260 Guangzhou, China.
4. Translational Medicine Center, State Key Laboratory of Respiratory Disease, The Second Affiliated Hospital of Guangzhou Medical University, 510260 Guangzhou, China.
5. Guangdong Provincial Education Department Key Laboratory of Nano-Immunoregulation Tumor Microenvironment, The Second Affiliated Hospital of Guangzhou Medical University, 510260 Guangzhou, China.
6. Translational Medicine Center, Huaihe Hospital of Henan University, 475000 Kaifeng, China.
7. Department of Hematology, Huaihe Hospital of Henan University, 475000 Kaifeng, China.
8. Department of Hematology, Institute of Hematology, The Third Affiliated Hospital of Sun Yat-Sen University, 510630 Guangzhou, China.
* These authors contributed equally to this work: Cong Deng, Chaozeng Si.
Received 2020-9-24; Accepted 2020-12-29; Published 2021-1-30
Abstract

Multiple myeloma (MM) is a hematologic tumor with monoclonal proliferation of malignant plasma cells in the bone marrow. Fascin (FSCN) is an actin-binding protein that plays a crucial role in cell migration and invasion, contributing to tumor metastasis. There are three members (FSCN1-3) in FSCN family. However, the prognostic role of FSCN family in MM remains unclear. In this study, we used four independent Gene Expression Omnibus (GEO) datasets to explore the relationships between FSCN1-3 expression profiles and patient survival in MM. We found that FSCN1 was dramatically down-regulated in MM compared to normal donors (p < 0.001) and monoclonal gammopathy of undetermined significance (MGUS) (p = 0.032). Patients with high expression of FSCN1 and FSCN2 had significantly longer OS (p = 0.023 and 0.028, respectively). Univariate and multivariate analysis showed that FSCN1 (p = 0.003, 0.002) and FSCN2 (p = 0.018, 0.013) were independent favorable prognostic factors for OS in MM. Moreover, the combination of high expression of FSCN1 and FSCN2 could effectively predict both longer EFS (p = 0.046) and OS (p = 0.015). Our study suggested that FSCN1 and FSCN2 can be used as favorable biomarkers for predicting clinical outcomes in MM.
Keywords: FSCN, multiple myeloma, biomarker, prognosis.
Introduction
Multiple myeloma (MM) is a hematologic malignancy characterized by the expansion of clonal plasma cells in bone marrow and abnormal secretion of immunoglobulins [1]. MM can be grouped into asymptomatic or symptomatic based on with or without myeloma-related organ or tissue dysfunction, including hypercalcemia, renal impairment, anemia and bone lesions [1, 2]. Monoclonal gammopathy of undetermined significance (MGUS) is considered as an asymptomatic premalignant stage. There are 0.5-1% of MGUS that can evolve into symptomatic MM (intramedullary MM) per year, and may finally progress to extramedullary MM or plasma cell leukemia (PCL) [1, 3]. Clinical stage and cytogenetic abnormalities are the most commonly used variables for risk stratification in MM [4]. In addition, gene expression profiling has been recognized as an important prognostic factor in recent years [4, 5]. Exploring more powerful biomarkers is very meaningful for identifying patients with poor prognosis earlier and providing better therapy strategies, especially for asymptomatic high-risk MM patients [6].
Fascin (FSCN) is a 55-kDa actin-binding protein involved in the formation and stability of microspikes, filopodia and invadopodia, which leads to cell adhesion, motility and migration [7-9]. There are three isoforms in FSCN family, including FSCN1, FSCN2 and FSCN3, which are encoded by FSCN1, FSCN2 and FSCN3 gene, respectively [10]. The expression of FSCN1 was low or absent from adult epithelia, but often highly increased in many aggressive carcinomas, such as breast cancer [11], pancreatic cancer [12] and hepatocellular carcinoma [13]. FSCN1 has been proved to play an important role in promoting metastasis of tumors [14-17]. For example, upregulated FSCN1 expression in oral squamous cell carcinoma (OSCC) derived cells resulted in a significant increase in cell migration and invasion. FSCN1 overexpression was significantly correlated with advanced tumor stage and lymph node metastasis in OSCC [18]. Moreover, high FSCN1 expression was strongly associated with poor clinical outcomes and could be used as a prognostic and predictive biomarker in different cancer types, including nonsmall cell lung cancer [19], urinary bladder urothelial carcinoma [20] and breast cancer [21, 22]. FSCN1 has been extensively studied in recent years, whereas very little is known about FSCN2 and FSCN3. It has been reported that FSCN2 and FSCN3 may function in progressive hearing loss [23] and terminal elongation of the spermatid head [24], respectively.
However, the role of FSCN family in MM is still unclear. In this study, we enrolled 1201 patients from four independent GEO datasets and investigated the potential prognostic role of FSCN family in MM by exploring the relationships between FSCN1-3 expression profiles and the clinical outcomes of MM patients.
Materials and Methods
Patients
All clinical, cytogenetic and molecular information, as well as gene microarray expression data used in this study were collected from Gene Expression Omnibus (GEO) datasets (http://www.ncbi.nlm.nih.gov/geo). We divided all the samples into two cohorts. The first cohort was used for microarray expression analysis, including GSE39754 (6 normal donors, 170 MM) and GSE2113 (7 MGUS, 39 MM, 6 PCL). The gene expression data was analyzed by Affymetrix Human Genome U133 Plus 2.0 Array. The second cohort was mainly applied for survival analysis. This cohort consisted of two independent microarray datasets of MM patients, GSE24080 and GSE4581. The gene expression profiling of 559 newly diagnosed MM patients in GSE24080 and 414 untreated MM patients in GSE4581 were also evaluated by the Affymetrix Human Genome U133 Plus 2.0 Array.
Clinical endpoints of this study were event-free survival (EFS) and overall survival (OS). EFS was defined as the length of time from diagnosis to the first event, including progression, relapse, death, etc. OS was defined as the length of time from diagnosis to death or the end of the follow-up for any reason.
All experiment design, quality control, and data normalization were in line with the standard Affymetrix protocols. The research was conducted in accordance with the International Conference and the Declaration of Helsinki.
Statistical analysis
The clinical and molecular characteristics of patients were described using median and/or range. Comparison of numerical data and categorical data were based on the Wilcoxon rank sum test, Kruskal-Wallis test and Fisher exact test, respectively. The Kaplan-Meier methods and log-rank test were applied for survival analysis. Co-expression analysis was conducted by calculating Pearson's correlation coefficient. Univariate and multivariate Cox proportional hazard models were constructed for EFS and OS, using a limited backward elimination procedure. The confidence interval is 95%. All statistical analysis was performed by R software 3.5.0.
Results
The expression levels of FSCN family in normal donors and myeloma patients in different stages
To investigate the association between expression levels of FSCN1-3 and MM, we analyzed expression levels of FSCN1-3 in normal donors and MM patients from GSE39754 dataset. The FSCN1 expression in MM patients demonstrated a remarkable decrease compared to normal donors (p < 0.001, Fig 1A). However, there was no significant difference in the expression of FSCN2 and FSCN3 between normal donors and MM patients (Fig 1A).
The expression levels of FSCN1-3 in normal donors and myeloma patients in different stages. X-axis represents the sample type; Y-axis represents the FSCN1-3 expression levels (log2). A MM patients (n=170) compared with normal donors (n=6) in GSE39754. B Comparison of FSCN1-3 expression levels in three different stages of myeloma patients: MGUS (n=7), MM (n=39), PCL (n=6) in GSE2113.
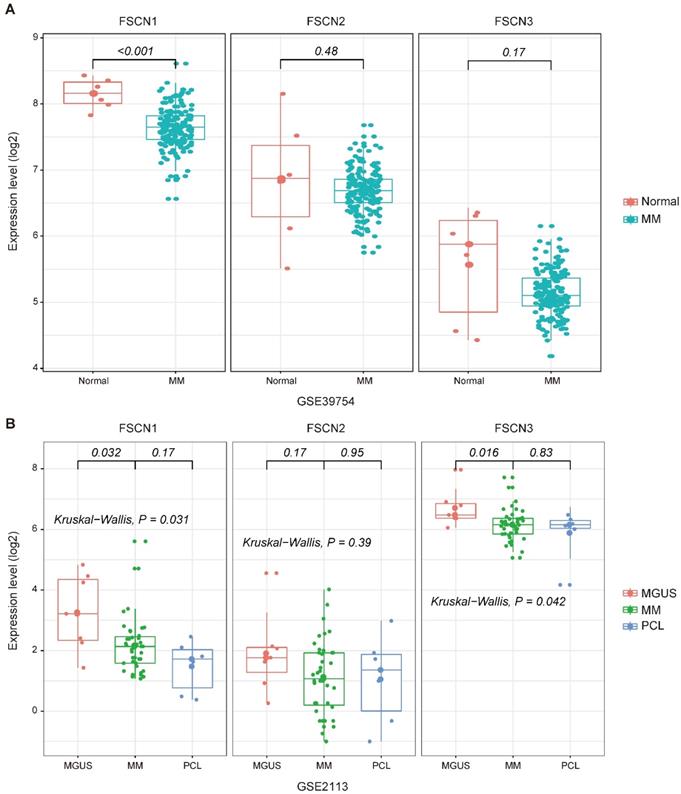
To explore the relationship between FSCN1-3 expression levels and the progression of myeloma, we also analyzed FSCN1-3 expression levels of patients from GSE2113 in three different myeloma stages, including MGUS, MM and PCL. The FSCN1 and FSCN3 expression were also down-regulated in MM compared with MGUS (p = 0.032, 0.016, Fig 1B), no statistically significance was found between MM and PCL. There was no significant difference in FSCN2 expression among different myeloma stages (Fig 1B).
Comparison of EFS and OS between different expression levels of FSCN family
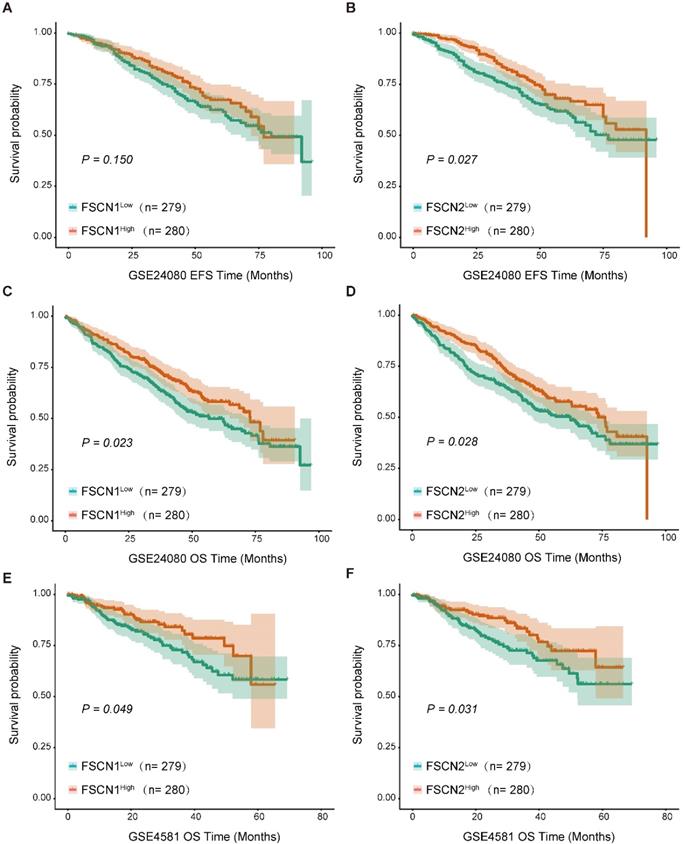
Using the GSE24080 dataset (559 MM patients), we analyzed the impact of FSCN1-3 expression on clinical outcomes in MM. Based on the median expression level of each FSCN member, we divided all the patients into low and high FSCN expression groups. The comparison of EFS and OS between different FSCN expression groups were shown in Table 1. High expression of FSCN1 was significantly associated with longer OS (p = 0.023, Fig 2C), and it had no obvious impact on EFS (p = 0.150, Fig 2A). EFS and OS in MM patients with high FSCN2 expression were longer than those with low FSCN2 expression (p = 0.027, 0.028, Fig 2B, Fig 2D). The expression level of FSCN3 had no effect on EFS and OS of patients in two groups (Table 1). The impacts of elevated levels of FSCN1 and FSCN2 on longer OS were also validated in another independent dataset GSE4581 (p = 0.049, 0.031, Fig 2E, 2F).
Comparison of EFS and OS between the high and low expression levels of FSCN family in GSE24080.
| EFS | OS | |||
|---|---|---|---|---|
| χ2 | p-value | χ2 | p-value | |
| FSCN1(High vs. Low) | 3.170 | 0.075 | 12.976 | <0.001 |
| FSCN2 (High vs. Low) | 3.861 | 0.049 | 5.379 | 0.020 |
| FSCN3 (High vs. Low) | 1.505 | 0.220 | 3.131 | 0.077 |
Abbreviations: EFS: event-free survival; OS: overa ll survival.
Survival analysis between different expression levels of FSCN1 and FSCN2. A No significant difference was observed in EFS between FSCN1high group and FSCN1low group in GSE24080. B FSCN2high group had longer EFS than FSCN2low group in GSE24080. C FSCN1high group had longer OS than FSCN1low group in GSE24080. D FSCN2high group had longer OS than FSCN2low in GSE24080. E FSCN1high group had longer OS than FSCN1low group in GSE4581. F FSCN2high group had longer OS than FSCN2low in GSE4581.
Gene co-expression analysis for FSCN family in MM
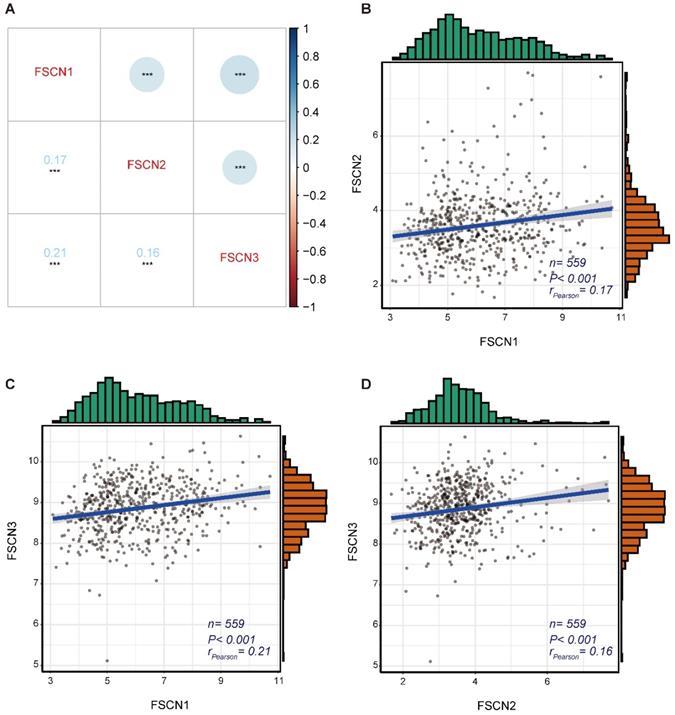
To identify the expression correlations between FSCN family members, we performed a gene co-expression analysis of 559 MM patients in GSE24080 dataset. As shown in Fig 3, the expressions of FSCN1-3 were not significantly associated with each other (all rPearson < 0.5, Fig 3).
The gene co-expression analysis for FSCN family members in GSE24080 dataset. A Co-expression heat map of FSCN genes. B Co-expression relationship between FSCN1 and FSCN2. C Co-expression relationship between FSCN1 and FSCN3. D Co-expression relationship between FSCN2 and FSCN3.
Comparison of clinical and molecular characteristics in different FSCN1 and FSCN2 expression
Comparison of the clinical and molecular characteristics of the 559 MM patients in GSE24080 based on different FSCN1 and FSCN2 expression levels were summarized in Table 2. Compared to FSCN1low group, FSCN1high group had decreased beta-2 microglobulin (B2M) level (p = 0.015), elevated hemoglobin (HGB) level (p < 0.001), less aspirate plasma cells (ASPC) (p < 0.001), less bone marrow biopsy plasma cells (BMPC) (p < 0.001) and less frequent cytogenetic abnormality (p < 0.001). As the same as FSCN1, FSCN2high group had decreased B2M level (p = 0.007) and less frequent cytogenetic abnormality (p = 0.001) compared with FSCN2low group. In addition, FSCN2high group was related to more older patients (p = 0.020), more male patients (p = 0.028), decreased lactate dehydrogenase (LDH) level (p < 0.001) and higher FGFR3 expression (p = 0.009).
Patients' characteristics of 559 multiple myeloma patients in GSE24080.
| FSCN1 | FSCN2 | |||||
|---|---|---|---|---|---|---|
| Low (n = 279) | High (n = 280) | p-value | Low (n = 279) | High (n = 280) | p-value | |
| Age, mean (range) | 56.92 (29.7-76.5) | 57.44 (24.83-75) | 0.200 | 56.31 (24.83-76.5) | 58.05 (30.5-75) | 0.020 |
| Gender, no (%) | ||||||
| female | 116 (41.58) | 106 (37.86) | 0.417 | 124 (44.44) | 98 (35) | 0.028 |
| male | 163 (58.42) | 174 (62.14) | 155 (55.56) | 182 (65) | ||
| Race, no (%) | ||||||
| other | 31 (11.11) | 31 (11.07) | 1.000 | 37 (13.26) | 25 (8.93) | 0.135 |
| white | 248 (88.89) | 249 (88.93) | 242 (86.74) | 255 (91.07) | ||
| ISS, no (%) | ||||||
| I | 171 (61.07) | 147 (52.69) | 0.091 | 169 (60.36) | 149 (53.41) | 0.078 |
| II | 59 (21.07) | 63 (22.58) | 62 (22.14) | 60 (21.51) | ||
| Ⅲ | 50 (17.86) | 69 (24.73) | 49 (17.5) | 70 (25.09) | ||
| B2M (mean(sd)) | 5.29 (6.295) | 4.19 (4.171) | 0.015 | 5.351 (6.209) | 4.129 (4.281) | 0.007 |
| CRP (mean(sd)) | 12.328 (26.743) | 10.934 (18.34) | 0.473 | 11.698 (17.113) | 11.563 (27.534) | 0.944 |
| CREAT (mean(sd)) | 1.36 (1.322) | 1.286 (1.216) | 0.494 | 1.426 (1.438) | 1.219 (1.068) | 0.054 |
| LDH (mean(sd)) | 171.065 (71.332) | 172.886 (60.189) | 0.744 | 181.828 (73.813) | 162.161 (55.424) | <0.001 |
| ALB (mean(sd)) | 4.042 (0.559) | 4.056 (0.605) | 0.780 | 4.056 (0.585) | 4.042 (0.58) | 0.774 |
| HGB (mean(sd)) | 10.961 (1.794) | 11.545 (1.785) | <0.001 | 11.104 (1.752) | 11.401 (1.86) | 0.052 |
| ASPC (mean(sd)) | 47.842 (23.14) | 37.568 (23.249) | <0.001 | 44.143 (24.639) | 41.247 (22.702) | 0.149 |
| BMPC (mean(sd)) | 52.326 (25.13) | 40.515 (25.38) | <0.001 | 48.5 (26.52) | 44.298 (25.137) | 0.055 |
| MRI (mean(sd)) | 9.962 (12.728) | 12.111 (15.194) | 0.070 | 12.062(14.582) | 10.049 (13.443) | 0.090 |
| Cytogenetic abnormality (%) | ||||||
| No | 151 (54.12) | 201 (71.79) | <0.001 | 157 (56.27) | 195 (69.64) | 0.001 |
| Yes | 128 (45.88) | 79 (28.21) | 122 (43.73) | 85 (30.36) | ||
| ISOTYPE, no (%) | ||||||
| FLC | 52 (18.57) | 32 (11.47) | 0.112 | 35(12.5) | 49 (17.56) | 0.694 |
| IgA | 57 (20.36) | 76 (27.24) | 67(23.93) | 66 (23.66) | ||
| IgD | 2 (0.71) | 1 (0.36) | 1(0.36) | 2 (0.72) | ||
| IgG | 156 (55.71) | 157 (56.27) | 165(58.93) | 148 (53.05) | ||
| Nonsecretory | 3 (1.07) | 3 (1.08) | 2(0.71) | 4 (1.43) | ||
| NSE | 2 (0.71) | 0 (0) | 1(0.36) | 1 (0.36) | ||
| High CCND1, no (%) | 138 (49.46) | 142 (50.71) | 0.565 | 135 (48.39) | 145 (51.79) | 0.679 |
| High LIG4, no (%) | 139 (49.82) | 141 (50.36) | 0.746 | 140 (50.18) | 140 (50) | 0.308 |
| High TP53, no (%) | 150 (53.76) | 130 (46.43) | 0.378 | 143 (51.25) | 137 (48.93) | 0.620 |
| High CDK4, no (%) | 147 (52.69) | 133 (47.5) | 0.312 | 152 (54.48) | 128 (45.71) | 0.651 |
| High FGFR3, no (%) | 140 (50.18) | 140 (50) | 0.213 | 113 (40.5) | 167 (59.64) | 0.009 |
| High CDK5, no (%) | 138 (49.46) | 142 (50.71) | 0.943 | 143 (51.25) | 137 (48.93) | 0.721 |
| High HK2, no (%) | 152 (54.48) | 128 (45.71) | 0.478 | 145 (51.97) | 135 (48.21) | 0.142 |
Abbreviations: ALB: abumin (35 g/l); ASPC: Aspirate plasma cells (%); BMPC: Bone marrow biopsy plasma cells (%); B2M: beta-2 microglobulin (mg/l); CREAT: creatinine (mg/dl); CRP: C-reactive protein (mg/l); HGB: hemoglobin (g/dl); ISS: International Staging System; LDH: lactate dehydrogenase (U/l); MRI: number of magnetic resonance imaging (MRI)-defined focal lesions (skull, spine, pelvis); no: number of patients.
Univariate and multivariate analysis of possible prognostic factors in MM
To further confirm the potential prognostic value of FSCN family in MM, age (≥ 60 vs. < 60 years), gender, albumin (ALB), B2M, HGB, LDH, expression levels of FSCN1-3 and other common genetic mutations (CCND1, FGFR3, LIG4, and TP53) were included in univariate and multivariate cox regression analysis.
As shown in Table 3, univariate analysis demonstrated that ALB (p = 0.033, < 0.001), B2M (both p < 0.001), HGB (p < 0.001, = 0.002), LDH (both p < 0.001), FSCN2 expression (p = 0.028, = 0.018) were significantly correlated with both EFS and OS of 559 MM patients in GSE 24080. Additionally, CCND1 expression (p = 0.006) was significantly associated with EFS. Age (p = 0.028) and FSCN1 expression (p = 0.003) were closely related to OS in univariate analysis. While in multivariate analysis, LDH was an independent risk factor for both EFS and OS (both p < 0.001). For EFS, HGB (p = 0.023) and CCND1 (p = 0.011) were independent favorable factors. As for OS, ALB (p < 0.001), FSCN1 (p = 0.002) and FSCN2 (p = 0.013) were independent favorable factors, while age (p = 0.029), B2M (p = 0.010) were independent risk factors.
Univariate and multivariate cox regression analysis of EFS and OS in 559 multiple myeloma patients.
| Univariate cox regression | Multivariate cox regression | |||||||
|---|---|---|---|---|---|---|---|---|
| EFS | OS | EFS | OS | |||||
| HR (95%CI) | p-value | HR (95%CI) | p-value | HR (95%CI) | p-value | HR (95%CI) | p-value | |
| Age (≥60 vs. <60) | 0.97 (0.71-1.32) | 0.839 | 1.40 (1.04-1.89) | 0.028 | 0.89 (0.65-1.23) | 0.492 | 1.41 (1.04-1.92) | 0.029 |
| Gender | 1.05 (0.77-1.43) | 0.750 | 0.97 (0.72-1.32) | 0.850 | 1.34 (0.97-1.86) | 0.075 | 1.24 (0.90-1.71) | 0.185 |
| ALB | 0.72 (0.53-0.97) | 0.033 | 0.48 (0.35-0.64) | < 0.001 | 0.76 (0.56-1.04) | 0.088 | 0.51 (0.37-0.70) | < 0.001 |
| B2M | 1.72 (1.27-2.33) | < 0.001 | 2.21 (1.64-3.00) | < 0.001 | 1.25 (0.88-1.78) | 0.211 | 1.58 (1.12-2.22) | 0.010 |
| HGB | 0.54 (0.39-0.74) | < 0.001 | 0.62 (0.45-0.84) | 0.002 | 0.66 (0.46-0.95) | 0.023 | 1.00 (0.70-1.41) | 0.980 |
| LDH | 2.58 (1.65-4.05) | < 0.001 | 3.68 (2.53-5.37) | < 0.001 | 2.31 (1.45-3.68) | < 0.001 | 3.18 (2.13-4.73) | < 0.001 |
| FSCN1 (High vs. Low) | 0.80 (0.59-1.09) | 0.151 | 0.63 (0.46-0.85) | 0.003 | 0.83 (0.60-1.15) | 0.265 | 0.60 (0.43-0.82) | 0.002 |
| FSCN2 (High vs. Low) | 0.71 (0.52-0.96) | 0.028 | 0.69 (0.51-0.94) | 0.018 | 0.73 (0.53-1.00) | 0.051 | 0.66 (0.48-0.92) | 0.013 |
| FSCN3 (High vs. Low) | 0.84 (0.62-1.14) | 0.254 | 0.77 (0.57-1.04) | 0.093 | 0.95 (0.68-1.33) | 0.768 | 0.92 (0.66-1.27) | 0.607 |
| CCND1(High vs. Low) | 0.65 (0.48-0.88) | 0.006 | 0.74 (0.55-1.00) | 0.053 | 0.66 (0.48-0.91) | 0.011 | 0.87 (0.64-1.20) | 0.400 |
| FGFR3 (High vs. Low) | 0.90 (0.67-1.22) | 0.508 | 0.80 (0.59-1.08) | 0.150 | 0.98 (0.70-1.36) | 0.902 | 0.93 (0.67-1.28) | 0.642 |
| LIG4 (High vs. Low) | 0.84 (0.62-1.14) | 0.268 | 0.84 (0.63-1.14) | 0.269 | 0.87 (0.64-1.18) | 0.364 | 0.93 (0.68-1.26) | 0.636 |
| TP53 (High vs. Low) | 1.06 (0.78-1.44) | 0.700 | 0.85 (0.63-1.15) | 0.284 | 1.14 (0.83-1.56) | 0.415 | 0.88 (0.65-1.20) | 0.418 |
Abbreviations: ALB: albumin 35 g/l; B2M: beta-2 microglobulin mg/l; CR: complete remission; CI: confidence interval; EFS: event-free survival; HGB: hemoglobin g/dl; HR: hazard ratio; LDH: lactate dehydrogenase U/l; OS: overall survival.
The combined prognostic significance of FSCN1 and FSCN2 in MM
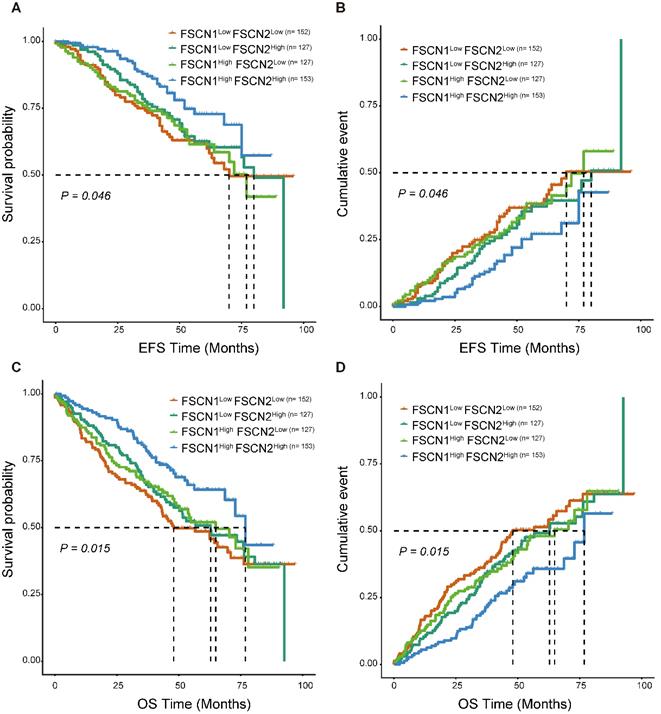
As FSCN1 and FSCN2 were proved to be independent prognostic factors in MM, we further explored their combined prognostic significance in 559 patients from GSE24080. As shown in Fig 4, FSCN1high FSCN2high group had significant longer EFS and OS compared to the other three groups (p = 0.046, 0.015).
Survival analysis of combination of different expression levels of FSCN1 and FSCN2 in GSE24080 dataset. A, B FSCN1high FSCN2high group had longer EFS than other groups. C, D FSCN1high FSCN2high group had longer OS than other groups.
Discussion
In this study, we found that the expression levels of FSCN1 and FSCN3 were significantly decreased in MM. Enhanced expressions of FSCN1 and FSCN2 closely related to longer OS and could serve as independent favorable prognostic factors for OS in MM. Combining high expression of FSCN1 and FSCN2 could not only effectively predict longer OS but also longer EFS.
FSCN1 was usually up-regulated in many malignant tumors and could be considered as an oncogene by promoting migration and invasion of tumors cells [25]. Increasing evidences suggested that elevated level of FSCN1 was significantly correlated with increased metastatic potential and more aggressive phenotypes in a variety of tumors [26-29], and inhibiting FSCN1 could block the migration and metastasis of tumor cells [30]. For instance, the increased expression of FSCN1 in HR-negative breast cancers might contribute to their more aggressive behavior [11], down-regulation of FSCN1 by si-RNA dramatically reduced the migratory abilities of breast cancer cells [31]. Forced expression of FSCN1 in cultured colorectal cancer cells promoted their migratory and invasive capabilities in vitro and enabled cells had higher abilities to form metastases in vivo, whereas specific inhibition of FSCN1 expression reduced colorectal cancer cells invasion [32]. The anti-migration and anti-invasion effect by knocking-down expression of FSCN1 could also be found in ovarian cancer [33], non-small cell lung cancer [34] and glioblastoma [35]. Thus, inhibition of FSCN1 expression may be essential for anti-metastatic therapy. Additionally, the increased expression of FSCN1 has been proved to be an adverse biomarker predicting poor outcomes in many types of malignancies [36, 37]. Surprisingly, in contrast to most of malignancies, FSCN1 was found to be down-regulated in two independent GSE datasets in MM (GSE39754 and GSE2113, Fig 1), and high expression of FSCN1 was closely related to longer OS in MM, which was confirmed in 973 patients from GSE24080 and GSE4581 (Table 1, Fig 2). This unique inverse correlation between the expression of FSCN1 and the prognosis of MM patients is unexpected and needs further investigation. In addition, compared with FSCN1low group, patients with high expression of FSCN1 had decreased levels of unfavorable prognostic factors (B2M, ASPC, BMPC and cytogenetic abnormality) and increased level of favorable one (HGB) (Table 2), which might partially contribute to longer OS in FSCN1high group. In multivariate analysis, we proved that FSCN1 can be an independent favorable prognosis factor for OS (p = 0.002, Table 3) Further investigation is required to evaluate using FSCN1 as a therapeutic target in MM.
Previous studies on FSCN2 have focused on the role of maintaining ear and eye functions [23, 38, 39]. Very little was found in the literature on the relationship between FSCN2 and tumors. In this study, we demonstrated that high expression of FSCN2 was significantly associated with favorable EFS and OS in MM (Table 1, Fig 2). We also found that B2M, LDH, cytogenetic abnormality, which were related to poor clinical outcomes in MM, showed a significant decrease in FSCN2high group compared to FSCN2low group (Table 2). To further confirm whether FSCN2 could predict prognosis independently, multivariate analysis was conducted and high expression of FSCN2 was proved to be an independent positive prognosis indicator for OS in MM (p = 0.013, Table 3). Further efforts are required to explore how FSCN2 affects the patient survival.
As FSCN1 and FSCN2 were both positively related to OS, we further investigated the prognostic role of the combination of FSCN1 and FSCN2. FSCN1 and FSCN2 did not show a coordinated expression pattern in our study (rPearson < 0.5, Fig 3). This was in line with previous studies that FSCN1 was expressed in neural and mesenchymal tissues and FSCN2 was predominantly expressed in retinal photoreceptor cells, respectively [28]. As to the prognosis, combination of high expression of FSCN1 and FSCN2 could not only effectively predict longer OS but also longer EFS (all p < 0.05, Fig 4).
In multivariate analysis, consistently with previous studies, we found that LDH was an independent risk factor for both EFS and OS, B2M was an independent risk factor for OS, and HGB was an independent favorable factor for EFS (Table 3). Cyclin D1 (CCND1) is a critical modulator in cell cycle. The prognostic role of CCND1 in MM is still controversial. CCND1 was reported to be associated with unfavorable prognosis in MM [40, 41], whereas it was identified as a favorable prognostic indicator in another study [42]. In our study, we showed that CCND1 was an independent favorable factor for EFS in MM (Table 3).
In conclusion, our research demonstrated that increased expression levels of FSCN1 and FSCN2 were strongly associated with longer OS and they were independent favorable prognostic factors for OS in MM. In addition, the combination of FSCN1 and FSCN2 expression was an effective prognosis predictor for both EFS and OS in MM. However, the related molecular mechanism of FSCN family in MM remains unclear and needs to be further investigated.
Acknowledgements
This work was supported by grants from Medical Scientific Research Foundation of Guangdong Province, China (A2019472, A2018031), Xinjiang Joint Fund of National Natural Science Foundation of China (U1903117), National Natural Science Foundation of China (81500118, 81970193), Guangdong Basic and Applied Basic Research Foundation (2019A1515011327), and the Fundamental Research Funds for the Central Universities (19ykpy39).
Competing Interests
The authors have declared that no competing interest exists.
References
1. Palumbo A, Anderson K. Multiple myeloma. N Engl J Med. 2011;364:1046-60
2. Furukawa Y, Kikuchi J. Molecular pathogenesis of multiple myeloma. Int J Clin Oncol. 2015;20:413-22
3. Rajkumar SV, Dimopoulos MA, Palumbo A, Blade J, Merlini G, Mateos MV. et al. International Myeloma Working Group updated criteria for the diagnosis of multiple myeloma. Lancet Oncol. 2014;15:e538-48
4. Chan HSH, Chen CI, Reece DE. Current review on high-risk multiple myeloma. Curr Hematol Malig Rep. 2017;12:96-108
5. Weaver CJ, Tariman JD. Multiple myeloma genomics: A systematic review. Semin Oncol Nurs. 2017;33:237-53
6. Fonseca R, Bergsagel PL, Drach J, Shaughnessy J, Gutierrez N, Stewart AK. et al. International Myeloma Working Group molecular classification of multiple myeloma: spotlight review. Leukemia. 2009;23:2210-21
7. Li A, Dawson JC, Forero-Vargas M, Spence HJ, Yu X, Konig I. et al. The actin-bundling protein fascin stabilizes actin in invadopodia and potentiates protrusive invasion. Curr Biol. 2010;20:339-45
8. Vignjevic DM, Louvard D, Goldman RD, Schoumacher M. Actin, microtubules, and vimentin intermediate filaments cooperate for elongation of invadopodia. J Cell Biol. 2010;189:541-56
9. Adams JC. Roles of fascin in cell adhesion and motility. Curr Opin Cell Biol. 2004;16:590-6
10. Kureishy N, Sapountzi V, Prag S, Anilkumar N, Adams JC. Fascins, and their roles in cell structure and function. Bioessays. 2002;24:350-61
11. Grothey A, Hashizume R, Sahin A, McCrea P. Fascin, an actin-bundling protein associated with cell motility, is upregulated in hormone receptor negative breast cancer. Br J Cancer. 2000;83:870-3
12. Li A, Morton JP, Ma Y, Karim SA, Zhou Y, Faller WJ. et al. Fascin is regulated by slug, promotes progression of pancreatic cancer in mice, and is associated with patient outcomes. Gastroenterology. 2014;146:1386-96
13. Huang X, Ji J, Xue H, Zhang F, Han X, Cai Y. et al. Fascin and cortactin expression is correlated with a poor prognosis in hepatocellular carcinoma. Eur J Gastroenterol Hepatol. 2012;24:633-9
14. Zhao H, Yang F, Zhao W, Zhang C, Liu J. Fascin overexpression promotes cholangiocarcinoma RBE cell proliferation, migration, and invasion. Technol Cancer Res Treat. 2016;15:322-33
15. Bi JB, Zhu Y, Chen XL, Yu M, Zhang YX, Li BX. et al. The role of fascin in migration and invasion of urothelial carcinoma of the bladder. Urol Int. 2013;91:227-35
16. Bu M, Liu X, Liu X, Xu W. Upregulation of fascin-1 is involved in HIF-1α-dependent invasion and migration of hypopharyngeal squamous cell carcinoma. Int J Oncol. 2019;55:488-98
17. Xie JJ, Xu LY, Wu JY, Shen ZY, Zhao Q, Du ZP. et al. Involvement of CYR61 and CTGF in the fascin-mediated proliferation and invasiveness of esophageal squamous cell carcinomas cells. Am J Pathol. 2010;176:939-51
18. Alam H, Bhate AV, Gangadaran P, Sawant SS, Salot S, Sehgal L. et al. Fascin overexpression promotes neoplasticprogression in oral squamous cell carcinoma. BMC Cancer. 2012;12:1-15
19. Zhang Y, Liang B, Dong H. Expression of fascin_1 protein in cancer tissues of patients with nonsmall cell lung cancer and its relevance to patients' clinicopathologic features and prognosis. J Cancer Res Ther. 2018;14:856-9
20. Gomaa W, Al-Maghrabi H, Al-Attas M, Al-Ghamdi F, Al-Maghrabi J. Fascin expression in urinary bladder urothelial carcinoma correlates with unfavourable prognosis. Int J Clin Exp Pathol. 2019;12:3901-7
21. Abbasi A, Noroozinia F, Anvar S, Abbasi M, Hosseinzadeh S, Mokhtari S. Fascin overexpression is associated with higher grades of breast cancer. Pol J Pathol. 2019;70:264-8
22. Wang CQ, Tang CH, Chang HT, Li XN, Zhao YM, Su CM. et al. Fascin-1 as a novel diagnostic marker of triple-negative breast cancer. Cancer Med. 2016;5:1983-8
23. Liu X, Zhao M, Xie Y, Li P, Wang O, Zhou B. et al. Null mutation of the fascin2 gene by TALEN leading to progressive hearing loss and retinal degeneration in C57BL/6J Mice. G3 (Bethesda). 2018;8:3221-30
24. Tubb B, Mulholland DJ, Vogl W, Lan ZJ, Niederberger C, Cooney A. et al. Testis fascin (FSCN3): a novel paralog of the actin-bundling protein fascin expressed specifically in the elongate spermatid head. Exp Cell Res. 2002;275:92-109
25. Hashimoto Y, Kim DJ, Adams JC. The roles of fascins in health and disease. J Pathol. 2011;224:289-300
26. Machesky LM, Li A. Fascin: Invasive filopodia promoting metastasis. Commun Integr Biol. 2010;3:263-70
27. Zhang X, Cho IH, Park JH, Lee MK, Hwang YS. Fascin is involved in cancer cell invasion and is regulated by stromal factors. Oncol Rep. 2019;41:465-74
28. Gross SR. Actin binding proteins: Their ups and downs in metastatic life. Cell Adh Migr. 2013;7:199-213
29. Tan VY, Lewis SJ, Adams JC, Martin RM. Association of fascin-1 with mortality, disease progression and metastasis in carcinomas: a systematic review and meta-analysis. BMC Med. 2013;11:52
30. Han S, Huang J, Liu B, Xing B, Bordeleau F, Reinhart-King CA. et al. Improving fascin inhibitors to block tumor cell migration and metastasis. Mol Oncol. 2016;10:966-80
31. Zhao H, Kang X, Xia X, Wo L, Gu X, Hu Y. et al. miR-145 suppresses breast cancer cell migration by targeting FSCN-1 and inhibiting epithelial-mesenchymal transition. Am J Transl Res. 2016;8:3106-14
32. Vignjevic D, Schoumacher M, Gavert N, Janssen KP, Jih G, Lae M. et al. Fascin, a novel target of beta-catenin-TCF signaling, is expressed at the invasive front of human colon cancer. Cancer Res. 2007;67:6844-53
33. McGuire S, Kara B, Hart PC, Montag A, Wroblewski K, Fazal S. et al. Inhibition of fascin in cancer and stromal cells blocks ovarian cancer metastasis. Gynecol Oncol. 2019;153:405-15
34. Zhao D, Zhang T, Hou XM, Ling XL. Knockdown of fascin-1 expression suppresses cell migration and invasion of non-small cell lung cancer by regulating the MAPK pathway. Biochem Biophys Res Commun. 2018;497:694-99
35. Park KS, Yoon SY, Park SH, Hwang JH. Anti-migration and anti-invasion effects of curcumin via suppression of fascin expression in glioblastoma Cells. Brain Tumor Res Treat. 2019;7:16-24
36. Wang C, Wang J, Chen Z, Gao Y, He J. Immunohistochemical prognostic markers of esophageal squamous cell carcinoma: a systematic review. Chin J Cancer. 2017;36:65.Online
37. Ruys AT, Koerkamp BG, Wiggers JK, Klümpen HJ, Kate FJt, Gulik TMv. Prognostic biomarkers in patients with resected cholangiocarcinoma: A systematic review and meta-analysis. Ann Surg Oncol. 2014;21:487-500
38. Wada Y, Abe T, Takeshita T, Sato H, Yanashima K, Tamai M. Mutation of human retinal fascin gene (FSCN2) causes autosomal dominant retinitis pigmentosa. Invest Ophthalmol Vis Sci. 2001;42(10):2395-2400
39. Wada Y, Abe T, Itabashi T, Sato H, Kawamura M, Tamai M. Autosomal Dominant Macular Degeneration Associated With 208delG Mutation in the FSCN2 Gene. Arch Ophthalmol. 2003;121:1613-20
40. Hoechtlen-Vollmar W, Menzel G, Bartl R, Lamerz R, Wick M, Seidel D. Amplification of cyclin D1 gene in multiple myeloma clinical and prognostic relevance. Br J Haematol. 2000;109:30-8
41. Sewify EM, Afifi OA, Mosad E, Zaki AH, Gammal SA El. Cyclin D1 amplification in multiple myeloma is associated with multidrug resistance expression. Clin Lymphoma Myeloma Leuk. 2014;14:215-22
42. Soverini S, Cavo M, Cellini C, Terragna C, Zamagni E, Ruggeri D. et al. Cyclin D1 overexpression is a favorable prognostic variable for newly diagnosed multiple myeloma patients treated with high-dose chemotherapy and single or double autologous transplantation. Blood. 2003;102:1588-94
Author contact
![]() Corresponding author: Lin Fu, MD. PhD. E-mail: fulin022com; Yongjiang Zheng, MD. PhD. E-mail: zhengyj5sysu.edu.cn; Tingting Qian. E-mail: qiantingting.08com.
Corresponding author: Lin Fu, MD. PhD. E-mail: fulin022com; Yongjiang Zheng, MD. PhD. E-mail: zhengyj5sysu.edu.cn; Tingting Qian. E-mail: qiantingting.08com.