Impact Factor ISSN: 1837-9664

 Global reach, higher impact
J Cancer 2021; 12(9):2715-2722. doi:10.7150/jca.56397 This issue Cite
Research Paper
Integrating pre- and post-treatment Plasma Epstein-Barr Virus DNA levels for better prognostic prediction of Nasopharyngeal Carcinoma
Wanxia Li1,3#, Chao Yang4#, Zehong Lv1#, Junzheng Li6, Zonghua Li7, Xiaofei Yuan1, Shuting Wu1, Yue Yuan1, Linchong Cui1, Juan Lu1 ![]() , Jing Chen5
, Jing Chen5 ![]() , Feipeng Zhao2
, Feipeng Zhao2 ![]()
1. Department of Otolaryngology-Head and Neck Surgery, Nanfang Hospital, Southern Medical University, Guangzhou 510515, Guangdong, China.
2. Department of Otolaryngology-Head and Neck Surgery, the Affiliated Hospital of Southwest Medical University, Southwest Medical University, Luzhou 646000, Sichuan, China.
3. Department of Health Management, Nanfang Hospital, Southern Medical University, Guangzhou 510515, Guangdong, China.
4. Department of Laboratory Medicine, Nanfang Hospital, Southern Medical University, Guangzhou 510515, Guangdong, China.
5. School of Traditional Chinese Medicine, Southern Medical University, Guangzhou 510515, Guangdong, China.
6. Department of Otolaryngology-Head and Neck Surgery, Guangzhou Red Cross Hospital, Jinan University, Guangzhou 510220, Guangdong, China.
7. Department of Otolaryngology, 942 Hospital of the Chinese People's Liberation Army, Yinchuan750001, Ningxia, China.
#Co-first authors with equal contributions to this work.
Received 2020-11-25; Accepted 2021-2-3; Published 2021-3-5
Abstract

Background: Pre- and post-treatment plasma Epstein‐Barr virus (EBV) DNA are important biomarkers for the prognosis of nasopharyngeal carcinoma (NPC). This study was performed to determine the prognostic potential of integrating EBV DNA levels in plasma measured pre-treatment (pre-EBV) and 3 months post-treatment (3 m-EBV).
Materials and methods: A total of 543 incident non-metastatic NPC patients treated with intensity-modulated radiotherapy, with or without chemotherapy, were reviewed. Patients were divided into four subgroups based on pre-EBV and 3 m-EBV status. The data for pre-EBV and 3 m-EBV samples were integrated, and the predictability of the survival of patients with NPC was analyzed.
Results: There were significant differences in the 5-year progression-free survival, distant metastasis-free survival, locoregional relapse-free survival, and overall survival among the four patient subgroups (P<0.001). Patients who tested negative for both pre-EBV and 3 m-EBV had the best prognosis, followed by patients who tested positive for pre-EBV and negative for 3 m-EBV, and those who tested negative for pre-EBV and positive for 3 m-EBV; however, patients who tested positive for both pre-EBV and 3 m-EBV had the poorest chances of survival. Multivariate analyses demonstrated that integration of pre-EBV and 3 m-EBV data was an independent predictor of NPC progression in patients. Receiver operating characteristic curve analysis further confirmed that the combination of pre-EBV and 3 m-EBV had a greater prognostic value than pre-EBV or 3 m-EBV alone.
Conclusions: Integrating pre-EBV and 3 m-EBV data could provide more accurate risk stratification and better prognostic prediction in NPC.
Keywords: nasopharyngeal carcinoma, plasma, EBV DNA, prognosis, risk stratification
Introduction
Nasopharyngeal carcinoma (NPC) is endemic in Southeast Asia, especially in southern China, and has been established as an Epstein-Barr virus (EBV)-associated cancer [1]. Studies have demonstrated that EBV DNA in plasma originates from the tumor, and the load of plasma EBV DNA is strongly correlated with tumor burden [2]. In recent years, plasma EBV DNA has been widely used in clinical analysis as a reliable biomarker for screening, monitoring, and prognostic prediction of NPC [3-7]. A high pre-treatment plasma EBV DNA load correlates with advanced cancer stages, and poor prognosis [2, 8-11]. Conversely, detectable post-treatment EBV DNA levels are indicative of minimal residual disease and have been reported to be a stronger prognostic factor for NPC [2, 5, 12-15].
As pre- or post-treatment plasma EBV DNA is dynamic biomarkers [16, 17], combined evaluation of the changes in both may provide a more accurate prognosis. However, since most of the relevant studies mainly focused on prognosis with either pre- or post-treatment EBV DNA [18-21], to our knowledge, data on the investigation of the prognostic potential of simultaneous temporal changes in pre- and post-treatment plasma EBV DNA level for NPC are limited.
Therefore, we performed this retrospective study to evaluate the prognostic accuracy of the combination of plasma EBV DNA levels measured pre-treatment (pre-EBV) and 3 months post-treatment (3 m-EBV) for risk stratification and prognosis in NPC patients.
Materials and Methods
Patients
Data for a total of 543 patients with newly diagnosed, biopsy-proven, and nonmetastatic NPC treated at Nanfang Hospital, of Southern Medical University, from January 2008 to December 2015 were used in this study. Patients whose pre-EBV and/or 3 m-EBV data were not available were excluded. Patients with non-WHO pathological types, distant metastasis at primary diagnosis, and previous or other synchronous malignancies were also excluded. All patients were restaged according to the seventh edition of the American Joint Committee on Cancer (AJCC) staging system based on imaging materials and medical records [22]. Our retrospective study was approved by the Ethics Committee of Nanfang Hospital, Southern Medical University (NFEC-2017-165).
Treatment
All patients were treated with 2.12-2.24 Gy per fraction, with five daily fractions per week, using intensity-modulated radiotherapy (IMRT) for a total of 6-8 weeks. Cumulative radiation doses were 70-74 Gy to the gross tumor target of the nasopharynx (GTVnx), 66-70 Gy to the neck metastatic lymph node area (GTVnd), 60-62 Gy to the high-risk clinical target volume (CTV1), and 50-56 Gy to the low-risk clinical target volume (CTV2). Concurrent chemotherapy (CCT) consisted of cisplatin, administered triweekly, or weekly until the end of radiotherapy. Induction or adjuvant chemotherapy (ICT/ACT) consisted of cisplatin with 5-fluorouracil or cisplatin with taxanes or all three used together, administered triweekly for 2 or 3 cycles. Among the patients, 32 (5.9%) were at stage I and received IMRT treatment alone, 54 (9.9%) were at stage II and received concurrent chemoradiotherapy (CCRT), and 457 (84.2%) were at intermediate and advanced stages III/IV and received CCRT, ICT, and/or ACT.
Follow-up and Endpoints
All patients were routinely followed up every 3 months within the first year after therapy, every 6 months during the second and third years, and annually thereafter. Physical examination of the head and neck, nasopharyngeal endoscopy, MRI of the nasopharynx and neck, abdominal ultrasound, chest radiography, whole-body PET, and plasma EBV DNA measurements were performed routinely. PET/CT was considered if necessary.
The primary study endpoint was progression-free survival (PFS), which was defined as the time from the initial pathological diagnosis of NPC to relapse at any site or death from any cause, whichever occurred first, or last follow-up visit. The secondary endpoints included distant metastasis-free survival (DMFS, distant metastasis detection, death, or last follow-up visit), locoregional relapse-free survival (LRFS, relapse in nasopharynx or neck lymph nodes, death, or last follow-up visit), and overall survival (OS, all-cause death or last follow-up visit).
Quantification of plasma EBV DNA
Plasma EBV DNA measurements were performed at pre-EBV and 3 m-EBV stages using a real-time quantitative PCR technique targeting the BamH I-W region of the EBV genome. All plasma EBV DNA assays were conducted at the Laboratory Medicine Center of Nanfang Hospital, Southern Medical University. After the PCR assay, samples with an undetectable EBV DNA signal were recorded as 0 copies/mL, and a positive plasma EBV DNA load was defined as > 0 copies/mL. Referring to previous studies [2, 6, 7, 23-26], the cutoff levels chosen to classify the patients into low and high EBV DNA groups were 1500 copies/mL pre-treatment and 0 copies/mL 3 months post-treatment in this study.
Statistical analysis
Survival outcomes were estimated using the Kaplan-Meier method and compared by the log-rank test. The Cox proportional hazard model was used for multivariate analysis including the following variables: sex, age (≥45 vs. <45 years), T stage (T4 vs. T1-3), N stage (N2-3 vs. N0-1), and the change in pre-EBV and 3 m-EBV. ROC curve analysis was performed to calculate the optimal cut-off value of pre-EBV and 3 m-EBV, and compare the different prognostic values of pre-EBV, 3 m-EBV, and the change in pre-EBV and 3 m-EBV. Statistical analysis was performed using SPSS software version 21.0 (IBM Corporation, Armonk, NY, USA). Two-tailed P-values < 0.05 were considered statistically significant.
Results
Patient characteristics and survival outcomes
Among the 543 NPC patients, 405 (74.6%) were male and 138 (25.4%) were female, the median age was 45.4 years (range: 13-75). Patient characteristics are listed in Table 1. During the median follow-up period of 49.2 months (range: 3-137 months), a total of 177 patients (32.6%) experienced disease progression, including 44 cases of locoregional relapse (8.1%), 95 cases of distant metastasis (17.5%), 24 cases of both locoregional relapse and distant metastasis (4.4%), and 74 deaths (13.6%, 60 patients died from locoregional recurrence or distant metastasis and 14 patients died without locoregional recurrence or distant metastasis). The 5-year PFS, DMFS, LRFS, and OS rates were 66.1%, 75.6%, 86.0%, and 83.8%, respectively.
Clinical characteristics of NPC patients (n=543)
| Characteristic | N (%) |
|---|---|
| Sex | |
| Female | 138 (25.4%) |
| Male | 405 (74.6%) |
| Age (years) | |
| <45 | 252 (46.4%) |
| ≥45 | 291 (53.6%) |
| Smoking | |
| Yes | 322 (49.3%) |
| No | 221 (40.7%) |
| WHO pathologic type1 | |
| Keratinizing carcinoma | 3 (0.6%) |
| Differentiated non-keratinizing carcinoma | 34 (6.3%) |
| Undifferentiated non-keratinizing carcinoma | 507 (93.1%) |
| Overall stage2 | |
| I | 32 (5.9%) |
| II | 54 (9.9%) |
| III | 186 (34.3%) |
| IV | 271 (49.9%) |
| Tumor stage2 | |
| T1 | 99 (18.2%) |
| T2 | 92 (16.9%) |
| T3 | 109 (20.1%) |
| T4 | 243 (44.8%) |
| Node stage2 | |
| N0 | 59 (10.9%) |
| N1 | 144 (26.5%) |
| N2 | 295 (54.3%) |
| N3 | 45 (8.3%) |
1 Pathologic type according to the 2005 World Health Organization (WHO) classification of tumors.
2 According to the 7th edition of the AJCC staging system.
Pre- and Post-treatment plasma EBV DNA assessment and survival outcomes
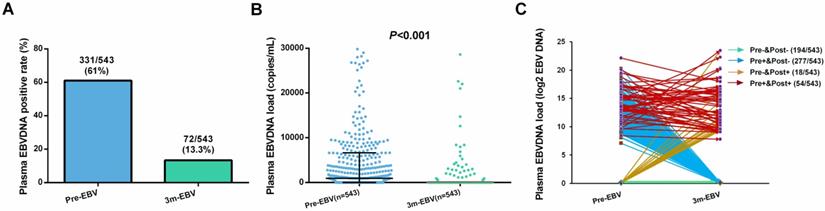
Of the 543 patients, the positive rate (61.0%) and median viral load (926 copies/mL, range: 0-4.57×10⁶ copies/mL) of pre-EBV samples were significantly higher than those for 3 m-EBV (13.3% and 0 copies/mL, range: 0-1.16×10⁷ copies/mL, respectively) (Figure 1A and 1B). Four different patterns were observed in pre-EBV and 3 m-EBV (Figure 1C): (1) negative for both pre-EBV and 3 m-EBV; (2) positive for pre-EBV and negative for 3 m-EBV; (3) negative for pre-EBV and positive for 3 m-EBV; (4) positive for both pre-EBV and 3 m-EBV.
The positive rate and viral load of pre-treatment (Pre-EBV) and 3 months post-treatment (3 m-EBV) plasma EBV DNA. (A) Comparisons of the positive rates for Pre-EBV and 3 m-EBV values. (B) Comparisons of plasma Pre-EBV and 3 m-EBV values. (C) The changes in Pre-EBV and 3 m-EBV DNA levels in plasma.
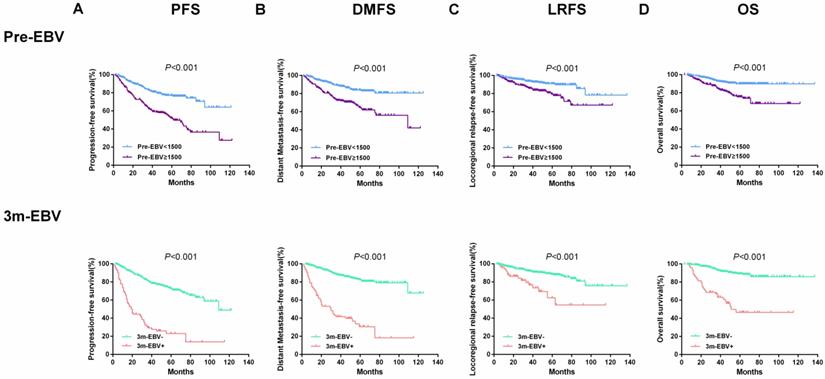
Also, the entire cohort of 543 patients was divided into two groups based on plasma EBV DNA cut-off values of 1500 copies/ml for pre-EBV and 0 copies/ml for 3 m-EBV. The results of survival analysis showed that patients with pre-EBV load ≥1500 copies/mL had worse 5-year PFS, DMFS, LRFS, and OS than those with <1500 copies/mL (all P < 0.001). Similarly, the 5-year PFS, DMFS, LRFS, and OS were significantly lower among patients with positive (>0 copies/mL) 3 m-EBV than in patients with negative plasma EBV DNA (all P<0.001). Kaplan-Meier survival curves for survival analyses of subgroups are shown in Figure 2.
Kaplan-Meier curves of survival outcomes among subgroups defined by pre-treatment (Pre-EBV) and 3 months post-treatment (3 m-EBV) plasma EBV DNA levels. (A) Progression-free survival (PFS). (B) Distant metastasis-free survival (DMFS). (C) Locoregional relapse-free survival (LRFS). (D) Overall survival (OS).
Combination of Pre-EBV and 3 m-EBV data
As the aforementioned analyses showed, both pre-EBV and 3 m-EBV data were effective prognostic factors for NPC patients. Therefore, we stratified the entire population into four subgroups according to the change in the two prognostic factors for pre-EBV and 3 m-EBV: negative for both pre-EBV and 3 m-EBV (Group 1: Pre- and Post-, n=194); positive for pre-EBV and negative for 3 m-EBV (Group 2: Pre+ and Post-, n=277); negative for pre-EBV and positive for 3 m-EBV (Group 3: Pre- and Post+, n=18); positive for both pre-EBV and 3 m-EBV (Group 4: Pre+ and Post+, n=54) (Table 2).
Subgroups of the change in plasma EBV DNA levels pre-treatment (pre-EBV) and 3 months post-treatment (3 m-EBV)
| Timepoints | 3 m-EBV | ||
|---|---|---|---|
| Negative | Positive | ||
| Pre-EBV | Negative | 194 (35.7%) | 18 (3.3%) |
| Positive | 277 (51.0%) | 54 (10.0%) | |
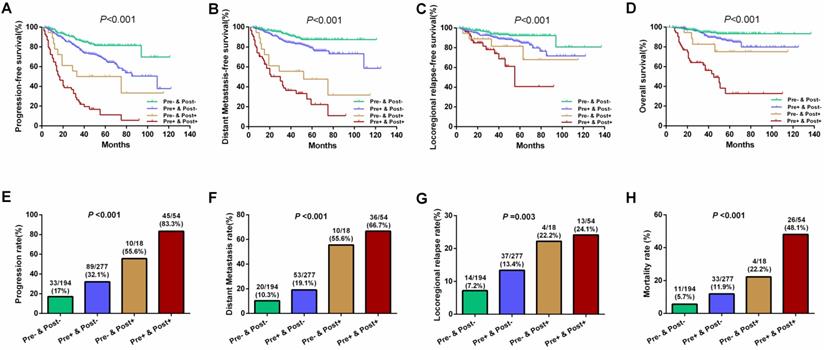
Results of further subgroup prognostic analyses are presented in Figure 3. Differences for 5-year PFS (81.4%, 67.1%, 50.0%, and 11.2% for Groups 1 to 4, respectively), DMFS (87.3%, 79.2%, 47.6%, and 22.2% for Groups 1 to 4, respectively), LRFS (92.3%, 85.9%, 81.5%, and 40.7% for Groups 1 to 4, respectively), and OS (93.5%, 86.2%, 75.1%, and 32.8% for Groups 1 to 4, respectively) were statistically significant among the above four subgroups (all P<0.001; Figure 3A-D). Similarly, the disease progression, distant metastasis, locoregional relapse, and mortality rates were significant among these four subgroups (all P<0.05; Figure 3E-H). Patients who tested negative for both pre-EBV and 3 m-EBV had the best prognosis, followed by patients who tested positive for pre-EBV and negative for 3 m-EBV, and negative for pre-EBV and positive for 3 m-EBV subgroup patients; patients who tested positive for both pre-EBV and 3 m-EBV had the poorest survival outcomes.
Survival outcomes and treatment failure rates among four patient subgroups according to the combinations of pre- and 3 months post-treatment plasma EBV DNA levels. (A) Progression-free survival. (B) Distant metastasis-free survival. (C) Locoregional relapse-free survival. (D) Overall survival. (E) Progression rate. (F) Distant metastasis rate. (G) Locoregional relapse rate. (H) Mortality rate. “Pre-” and “Pre+” denote negative and positive pre-treatment EBV DNA status, respectively; “Post-” and “Post+” denote negative and positive 3 months post-treatment EBV DNA status, respectively.
Cox multivariate analysis
Multivariate analysis revealed that integrating pre-EBV and 3 m-EBV plasma EBV DNA status could be employed as an independent predictor of PFS, DMFS, LRFS, and OS in NPC patients. Compared with the “Pre- and Post-” subgroup, the “Pre- and Post+” and “Pre+ and Post+” subgroups were independent risk factors for worse PFS, DMFS, LRFS, and OS (all P<0.001), whereas the “Pre+ and Post-” subgroup was an independent risk factor for comparatively poorer PFS (P=0.002) and DMFS (P=0.031) (Table 3).
Multivariate analysis of prognostic factors of NPC patients
| Variable | PFS | DMFS | LRFS | OS | ||||
|---|---|---|---|---|---|---|---|---|
| HR (95% CI) | P value | HR (95% CI) | P value | HR (95% CI) | P value | HR (95% CI) | P value | |
| Sex (male vs. female) | 1.273 (0.856-1.895) | 0.233 | 1.296 (0.798-2.105) | 0.294 | 0.890 (0.477-1.661) | 0.714 | 1.532 (0.805-2.916) | 0.194 |
| Age (≥45 vs. <45) | 1.151 (0.852-1.555) | 0.360 | 1.063 (0.736-1.536) | 0.744 | 1.079 (0.664-1.754) | 0.759 | 1.718 (1.054-2.798) | 0.030 |
| Smoking (Yes vs. No) | 0.996 (0.706-1.404) | 0.981 | 0.983 (0.644-1.500) | 0.937 | 1.171 (0.666-2.061) | 0.584 | 1.000 (0.592-1.687) | 0.999 |
| T stage (T4 vs. T1-3) | 1.163 (0.859-1.574) | 0.329 | 1.023 (0.705-1.484) | 0.905 | 1.661 (1.013-2.724) | 0.044 | 1.122 (0.700-1.799) | 0.633 |
| N stage (N2-3 vs. N0-1) | 1.256 (0.900-1.753) | 0.180 | 1.646 (1.071-2.531) | 0.023 | 1.024 (0.612-1.716) | 0.927 | 1.702 (0.988-2.931) | 0.055 |
| EBV DNA change subgroup | <0.001 | <0.001 | <0.001 | <0.001 | ||||
| Pre- & Post- | Reference | Reference | Reference | Reference | Reference | Reference | Reference | Reference |
| Pre+ & Post- | 1.878 (1.252-2.818) | 0.002 | 1.773 (1.053-2.983) | 0.031 | 1.814 (0.970-3.389) | 0.062 | 1.912 (0.959-3.812) | 0.066 |
| Pre- & Post+ | 4.167 (2.032-8.547) | <0.001 | 7.254 (3.338-15.762) | <0.001 | 3.388 (1.104-10.400) | 0.033 | 4.582 (1.442-14.554) | 0.010 |
| Pre+ & Post+ | 9.678 (6.019-15.559) | <0.001 | 10.488 (5.924-18.568) | <0.001 | 5.628 (2.553-12.404) | <0.001 | 11.587 (5.576-24.080) | <0.001 |
Abbreviations: PFS: progression-free survival; DMFS: distant metastasis-free survival; LRFS: locoregional relapse-free survival; OS: overall survival; HR: hazard ratio; CI: confidence interval.
Further, the “Pre+ and Post+” subgroup patients had a significantly higher risk of disease progression (hazard ratio (HR), 9.678; 95% confidence interval (CI), 6.019-15.559), distant metastasis (HR, 10.488; 95% CI, 5.924-18.568), locoregional recurrence (HR, 5.628; 95% CI, 2.553-12.404 ), and death (HR, 11.587; 95% CI, 5.576-24.080) than the “Pre- and Post-” group (Table 3).
ROC curve analysis
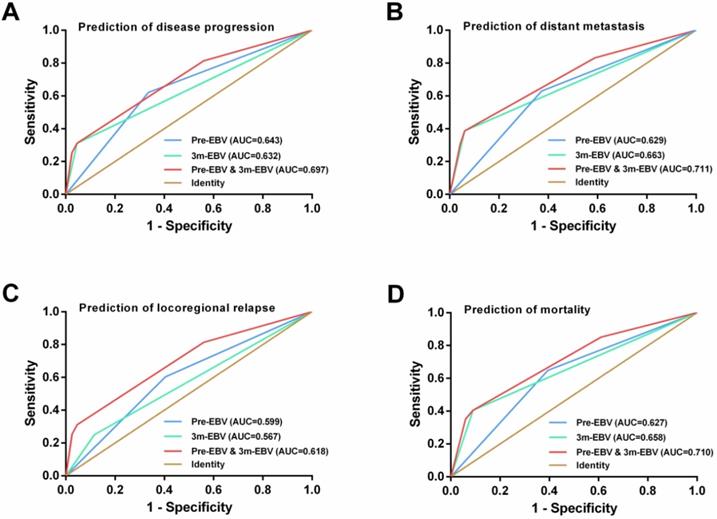
By comparing the ROC curves, integrating the pre-EBV and 3 m-EBV status demonstrated larger area under the curve (AUC) values than pre-EBV or 3 m-EBV alone for predicting NPC progression (AUC=0.697; P< 0.001), distant metastasis (AUC=0.711; P< 0.001), locoregional relapse (AUC=0.618; P=0.002), and mortality (AUC=0.710; P< 0.001) (Figure 4).
ROC curve analysis for comparing the prognostic potential of pre-treatment (pre-EBV), 3 months post-treatment (3 m-EBV) plasma EBV DNA levels, and integrated pre-EBV and 3 m-EBV values. (A) Prediction of disease progression. (B) Prediction of distant metastasis. (C) Prediction of locoregional relapse. (D) Prediction of mortality. AUC: the area under the curve.
Discussion
In the past two decades, plasma EBV DNA, an archetypal circulating tumor DNA, has been recognized as a robust biomarker for NPC [27]. Previous studies have confirmed that pre- and post-treatment plasma EBV DNA have independent prognostic value in patients with NPC [2, 5-15, 28, 29]. The above findings have been further confirmed in our research. We also found that there were significant changes in the positive rate and load of plasma EBV DNA after treatment, and these findings led us to investigate whether the integrated pre-EBV and 3 m-EBV data improve prognostic stratification for NPC patients.
To the best of our knowledge, the performance of the combination of pre- and post-treatment plasma EBV DNA for predicting treatment failure in NPC patients has not been fully investigated, partly because of the limited availability of data and the lack of comprehensive subgroup analyses. In this study, we used the long-term follow-up clinical database with a large sample size, and all eligible patients were divided into four subgroups. We found that patients with persistently negative pre-EBV and 3 m-EBV had the best survival outcome, while patients with consistently positive pre-EBV and 3 m-EBV had the worst prognosis. This result is consistent with previous studies [12, 23].
Furthermore, by using the multivariate prognostic model, our data also showed that patients with consistently positive pre-EBV and 3 m-EBV had a significantly higher risk of disease progression, distant metastasis, locoregional recurrence, and death than the persistently negative group (Table 3). The most reasonable explanation for the poor prognosis of these patients is that they either had uncontrolled tumors, unfavorable treatment responses, or residual diseases, which may have progressed with high risk [5, 30]. Moreover, closer follow-up visits and further intensified therapy or timely salvage treatment might be beneficial for these high-risk subgroup patients, while excessive or non-contributive treatment and examination can be avoided for patients with persistently negative EBV DNA [31, 32].
Another important finding from our study was that the “Pre- and Post+” patients were revealed to have worse 5-year PFS, DMFS, LRFS, and OS than the “Pre- and Post-”, as well as “Pre+ and Post-” patients. Notably, the prognosis of this subgroup of patients remains controversial, mainly because of a limited number of previous studies, carried out with a small sample size of patients [11, 13, 17]. Although our results differ from those obtained by Peng et al. [11], they are broadly consistent with the findings obtained by Lin et al. [23] and Li et al. [13]. EBV DNA can be detected in NPC tumor cells [33]. Also, cell-free EBV DNA can be detected in the plasma of patients with NPC, which may come from necrosis and lysis of tumor cells infected with EBV [34, 35]. In our study, 18 patients (8.5%) with positive 3 m-EBV were found among the 212 patients with negative pre-EBV. It may be that EBV infection has occurred in the nasopharyngeal carcinoma tissue of NPC patients in the “Pre- and Post+” group before treatment, but EBV DNA could not be detected in the plasma. Next, we will collect nasopharyngeal tumor tissues and venous blood samples of NPC patients in the “Pre- and Post+” group before and after treatment, and detect EBV DNA in tumor cells and plasma to confirm this possibility.
Additionally, ROC curve analysis further confirmed that integrating pre-EBV and 3 m-EBV had greater prognostic value than pre-EBV or 3 m-EBV analyzed alone, which was similar to the findings obtained by Peng et al. [11]. Considering the above results, integrating pre-EBV and 3 m-EBV data yielded a strong independent prognostic factor for NPC patients, highlighting the feasibility and clinical application in NPC prognostic stratification and tumor surveillance post-treatment.
Our study had some limitations as well. First, some potential biases were unavoidable owing to the retrospective design. Second, the population enrolled in the study was considerably small, especially the sample size for the “Pre- and Post+” subgroup. Moreover, all NPC patients originated from one center and there was no validation cohort. Therefore, larger sample-sized, prospective, multi-center, randomized, and controlled clinical studies are required to further validate our findings.
Conclusions
In summary, the results of the current study demonstrated that integrating pre-EBV and 3 m-EBV data was an effective prognostic predictor for NPC patients, which could further provide more accurate risk stratification. Our study may help guide individual management for NPC patients' in future clinical practice. However, further studies with larger sample sizes and multiple patient origins will be helpful in establishing the reliability of the proposed method.
Abbreviations
3 m-EBV: 3 months post-treatment; AUC: area under the curve; CTV1: clinical target volume; CCRT: concurrent chemoradiotherapy; CCT: Concurrent chemotherapy; CI: confidence interval; DMFS: distant metastasis-free survival; EBV: Epstein‐Barr virus; GTVnx: gross tumor target of the nasopharynx; ICT/ACT: Induction or adjuvant chemotherapy; IMRT: intensity-modulated radiotherapy; LRFS: locoregional relapse-free survival; CTV2: low-risk clinical target volume; NPC: nasopharyngeal carcinoma; GTVnd: gross tumor target of neck metastatic lymph node area; OS: overall survival; pre-EBV: pre-treatment; PFS: progression-free survival; ROC: receiver operator characteristic.
Acknowledgements
This work was supported by grants from the National Natural Science Foundation of China (81602570) and the Natural Science Foundation of Guangdong Province (2020A1515010596 and 2018A030313572).
Availability of data and material
The data that support the findings of this study are available from the corresponding author upon reasonable request.
Author Contributions
Study concept: Feipeng Zhao. Study design: Juan Lu and Jing Chen. Data acquisition: Wanxia Li, Chao Yang, and Zehong Lv. Quality control of data and algorithms: Yue Yuan and Linchong Cui. Data analysis and interpretation: Junzheng Li, Zonghua Li, Xiaofei Yuan, and Shuting Wu. Statistical analysis: Junzheng Li, Zonghua Li, and Xiaofei Yuan. Article preparation: Wanxia Li, Chao Yang, and Zehong Lv. Article editing: Juan Lu and Jing Chen. Article review: All authors.
Competing Interests
The authors have declared that no competing interest exists.
References
1. Chen YP, Chan ATC, Le QT, Blanchard P, Sun Y, Ma J. Nasopharyngeal carcinoma. Lancet. 2019;394(10192):64-80
2. Lin JC, Wang WY, Chen KY, Wei YH, Liang WM, Jan JS, Jiang RS. Quantification of plasma Epstein-Barr virus DNA in patients with advanced nasopharyngeal carcinoma. N Engl J Med. 2004;350(24):2461-2470
3. Chan KCA, Woo JKS, King A, Zee BCY, Lam WKJ, Chan SL, Chu SWI, Mak C, Tse IOL, Leung SYM. et al. Analysis of Plasma Epstein-Barr Virus DNA to Screen for Nasopharyngeal Cancer. N Engl J Med. 2017;377(6):513-522
4. Lo YM, Chan AT, Chan LY, Leung SF, Lam CW, Huang DP, Johnson PJ. Molecular prognostication of nasopharyngeal carcinoma by quantitative analysis of circulating Epstein-Barr virus DNA. Cancer Res. 2000;60(24):6878-6881
5. Chan AT, Lo YM, Zee B, Chan LY, Ma BB, Leung SF, Mo F, Lai M, Ho S, Huang DP. et al. Plasma Epstein-Barr virus DNA and residual disease after radiotherapy for undifferentiated nasopharyngeal carcinoma. J Natl Cancer Inst. 2002;94(21):1614-1619
6. Wang WY, Twu CW, Chen HH, Jiang RS, Wu CT, Liang KL, Shih YT, Chen CC, Lin PJ, Liu YC. et al. Long-term survival analysis of nasopharyngeal carcinoma by plasma Epstein-Barr virus DNA levels. Cancer. 2013;119(5):963-970
7. Zhao FP, Liu X, Chen XM, Lu J, Yu BL, Tian WD, Wang LU, Xu X, Huang HR, Zhang MW. et al. Levels of plasma Epstein-Barr virus DNA prior and subsequent to treatment predicts the prognosis of nasopharyngeal carcinoma. Oncol Lett. 2015;10(5):2888-2894
8. Lo YM, Leung SF, Chan LY, Lo KW, Zhang J, Chan AT, Lee JC, Hjelm NM, Johnson PJ, Huang DP. Plasma cell-free Epstein-Barr virus DNA quantitation in patients with nasopharyngeal carcinoma. Correlation with clinical staging. Ann N Y Acad Sci. 2000;906:99-101
9. Leung SF, Zee B, Ma BB, Hui EP, Mo F, Lai M, Chan KC, Chan LY, Kwan WH, Lo YM. et al. Plasma Epstein-Barr viral deoxyribonucleic acid quantitation complements tumor-node-metastasis staging prognostication in nasopharyngeal carcinoma. J Clin Oncol. 2006;24(34):5414-5418
10. Guo R, Tang LL, Mao YP, Du XJ, Chen L, Zhang ZC, Liu LZ, Tian L, Luo XT, Xie YB. et al. Proposed modifications and incorporation of plasma Epstein-Barr virus DNA improve the TNM staging system for Epstein-Barr virus-related nasopharyngeal carcinoma. Cancer. 2019;125(1):79-89
11. Peng H, Guo R, Chen L, Zhang Y, Li WF, Mao YP, Sun Y, Zhang F, Liu LZ, Lin AH. et al. Prognostic Impact of Plasma Epstein-Barr Virus DNA in Patients with Nasopharyngeal Carcinoma Treated using Intensity-Modulated Radiation Therapy. Sci Rep. 2016;6:22000
12. Lo YM, Chan LY, Chan AT, Leung SF, Lo KW, Zhang J, Lee JC, Hjelm NM, Johnson PJ, Huang DP. Quantitative and temporal correlation between circulating cell-free Epstein-Barr virus DNA and tumor recurrence in nasopharyngeal carcinoma. Cancer Res. 1999;59(21):5452-5455
13. Li WF, Zhang Y, Huang XB, Du XJ, Tang LL, Chen L, Peng H, Guo R, Sun Y, Ma J. Prognostic value of plasma Epstein-Barr virus DNA level during posttreatment follow-up in the patients with nasopharyngeal carcinoma having undergone intensity-modulated radiotherapy. Chin J Cancer. 2017;36(1):87
14. Le QT, Jones CD, Yau TK, Shirazi HA, Wong PH, Thomas EN, Patterson BK, Lee AW, Zehnder JL. A comparison study of different PCR assays in measuring circulating plasma epstein-barr virus DNA levels in patients with nasopharyngeal carcinoma. Clin Cancer Res. 2005;11(16):5700-5707
15. Hou X, Zhao C, Guo Y, Han F, Lu LX, Wu SX, Li S, Huang PY, Huang H, Zhang L. Different clinical significance of pre- and post-treatment plasma Epstein-Barr virus DNA load in nasopharyngeal carcinoma treated with radiotherapy. Clin Oncol (R Coll Radiol). 2011;23(2):128-133
16. He SS, Wang Y, Bao Y, Cai XY, Yang XL, Chen DM, Chen Y, Lu LX. Dynamic changes in plasma Epstein-Barr virus DNA load during treatment have prognostic value in nasopharyngeal carcinoma: a retrospective study. Cancer Med. 2018;7(4):1110-1117
17. Prayongrat A, Chakkabat C, Kannarunimit D, Hansasuta P, Lertbutsayanukul C. Prevalence and significance of plasma Epstein-Barr Virus DNA level in nasopharyngeal carcinoma. J Radiat Res. 2017;58(4):509-516
18. Chen YP, Zhao BC, Chen C, Shen LJ, Gao J, Mai ZY, Chen MK, Chen G, Yan F, Liu S. et al. Pretreatment platelet count improves the prognostic performance of the TNM staging system and aids in planning therapeutic regimens for nasopharyngeal carcinoma: a single-institutional study of 2,626 patients. Chin J Cancer. 2015;34(3):137-146
19. Lee VH, Kwong DL, Leung TW, Choi CW, O'Sullivan B, Lam KO, Lai V, Khong PL, Chan SK, Ng CY. et al. The addition of pretreatment plasma Epstein-Barr virus DNA into the eighth edition of nasopharyngeal cancer TNM stage classification. Int J Cancer. 2019;144(7):1713-1722
20. Chan ATC, Hui EP, Ngan RKC, Tung SY, Cheng ACK, Ng WT, Lee VHF, Ma BBY, Cheng HC, Wong FCS. et al. Analysis of Plasma Epstein-Barr Virus DNA in Nasopharyngeal Cancer After Chemoradiation to Identify High-Risk Patients for Adjuvant Chemotherapy: A Randomized Controlled Trial. J Clin Oncol 2018:JCO2018777847.
21. Hui EP, Li WF, Ma BB, Lam WKJ, Chan KCA, Mo F, Ai QYH, King AD, Wong CH, Guo R. et al. Integrating postradiotherapy plasma Epstein-Barr virus DNA and TNM stage for risk stratification of nasopharyngeal carcinoma to adjuvant therapy. Ann Oncol. 2020
22. Edge SB, Compton CC. The American Joint Committee on Cancer: the 7th edition of the AJCC cancer staging manual and the future of TNM. Ann Surg Oncol. 2010;17(6):1471-1474
23. Lin JC, Wang WY, Liang WM, Chou HY, Jan JS, Jiang RS, Wang JY, Twu CW, Liang KL, Chao J. et al. Long-term prognostic effects of plasma epstein-barr virus DNA by minor groove binder-probe real-time quantitative PCR on nasopharyngeal carcinoma patients receiving concurrent chemoradiotherapy. Int J Radiat Oncol Biol Phys. 2007;68(5):1342-1348
24. Wei W, Huang Z, Li S, Chen H, Zhang G, Li S, Hu W, Xu T. Pretreatment Epstein-Barr virus DNA load and cumulative cisplatin dose intensity affect long-term outcome of nasopharyngeal carcinoma treated with concurrent chemotherapy: experience of an institute in an endemic area. Oncol Res Treat. 2014;37(3):88-95
25. Jin YN, Yao JJ, Zhang F, Wang SY, Zhang WJ, Zhou GQ, Qi ZY, Sun Y. Is pretreatment Epstein-Barr virus DNA still associated with 6-year survival outcomes in locoregionally advanced nasopharyngeal carcinoma? J Cancer. 2017;8(6):976-982
26. Chen QY, Tang QN, Tang LQ, Chen WH, Guo SS, Liu LT, Li CF, Li Y, Liang YJ, Sun XS. et al. Pretreatment Serum Amyloid A and C-reactive Protein Comparing with Epstein-Barr Virus DNA as Prognostic Indicators in Patients with Nasopharyngeal Carcinoma: A Prospective Study. Cancer Res Treat. 2018;50(3):701-711
27. Lam WKJ, Chan KCA, Lo YMD. Plasma Epstein-Barr virus DNA as an archetypal circulating tumour DNA marker. J Pathol. 2019;247(5):641-649
28. Xie X, Ren Y, Wang K, Yi B. Molecular Prognostic Value of Circulating Epstein-Barr Viral DNA in Nasopharyngeal Carcinoma: A Meta-Analysis of 27,235 Cases in the Endemic Area of Southeast Asia. Genet Test Mol Biomarkers. 2019;23(7):448-459
29. Qu H, Huang Y, Zhao S, Zhou Y, Lv W. Prognostic value of Epstein-Barr virus DNA level for nasopharyngeal carcinoma: a meta-analysis of 8128 cases. Eur Arch Otorhinolaryngol. 2020;277(1):9-18
30. Hsu CL, Chan SC, Chang KP, Lin TL, Lin CY, Hsieh CH, Huang SF, Tsang NM, Lee LY, Ng SH. et al. Clinical scenario of EBV DNA follow-up in patients of treated localized nasopharyngeal carcinoma. Oral Oncol. 2013;49(6):620-625
31. Twu CW, Wang WY, Chen CC, Liang KL, Jiang RS, Wu CT, Shih YT, Lin PJ, Liu YC, Lin JC. Metronomic adjuvant chemotherapy improves treatment outcome in nasopharyngeal carcinoma patients with postradiation persistently detectable plasma Epstein-Barr virus deoxyribonucleic acid. Int J Radiat Oncol Biol Phys. 2014;89(1):21-29
32. Chen FP, Huang XD, Lv JW, Wen DW, Zhou GQ, Lin L, Kou J, Wu CF, Chen Y, Zheng ZQ. et al. Prognostic potential of liquid biopsy tracking in the posttreatment surveillance of patients with nonmetastatic nasopharyngeal carcinoma. Cancer. 2020
33. Chang YS, Tyan YS, Liu ST, Tsai MS, Pao CC. Detection of Epstein-Barr virus DNA sequences in nasopharyngeal carcinoma cells by enzymatic DNA amplification. J Clin Microbiol. 1990;28(11):2398-2402
34. Lo YM, Chan LY, Lo KW, Leung SF, Zhang J, Chan AT, Lee JC, Hjelm NM, Johnson PJ, Huang DP. Quantitative analysis of cell-free Epstein-Barr virus DNA in plasma of patients with nasopharyngeal carcinoma. Cancer Res. 1999;59(6):1188-1191
35. Fournie GJ, Courtin JP, Laval F, Chale JJ, Pourrat JP, Pujazon MC, Lauque D, Carles P. Plasma DNA as a marker of cancerous cell death. Investigations in patients suffering from lung cancer and in nude mice bearing human tumours. Cancer Lett. 1995;91(2):221-227
Author contact
![]() Corresponding authors: Juan Lu, Department of Otolaryngology-Head and Neck Surgery, Nanfang Hospital, Southern Medical University, Guangzhou 510515, China. Phone: 86-20-62787323; E-mail: lujuanqzcom. Jing Chen, School of Traditional Chinese Medicine, Southern Medical University, Guangzhou 510515, Guangdong, China. Phone: 86-20-61648771; E-mail: liuchengjingcom. Feipeng Zhao, Department of Otolaryngology-Head and Neck Surgery, the Affiliated Hospital of Southwest Medical University, Southwest Medical University, Luzhou 646000, China. Phone: 86-830-3165641; E-mail: zhaofeipeng008edu.cn.
Corresponding authors: Juan Lu, Department of Otolaryngology-Head and Neck Surgery, Nanfang Hospital, Southern Medical University, Guangzhou 510515, China. Phone: 86-20-62787323; E-mail: lujuanqzcom. Jing Chen, School of Traditional Chinese Medicine, Southern Medical University, Guangzhou 510515, Guangdong, China. Phone: 86-20-61648771; E-mail: liuchengjingcom. Feipeng Zhao, Department of Otolaryngology-Head and Neck Surgery, the Affiliated Hospital of Southwest Medical University, Southwest Medical University, Luzhou 646000, China. Phone: 86-830-3165641; E-mail: zhaofeipeng008edu.cn.