Impact Factor ISSN: 1837-9664

 Global reach, higher impact
J Cancer 2021; 12(24):7436-7444. doi:10.7150/jca.62788 This issue Cite
Research Paper
Association between Platelet Count with 1-year Survival in Patients with Cancer Cachexia
Yuying Liu1,2*, Yizhong Ge2,3,4*, Qinqin Li1,2,3*, Guotian Ruan2,3, Qi Zhang2,3, Xi Zhang2,3, Meng Tang2,3, Mengmeng Song2,3, Xiaowei Zhang2,3, Xiangrui Li2,3, Kangping Zhang2,3, Ming Yang2,3, Chunlei Hu2,3, Tong Liu2,3, Hailun Xie2,3, Yongbing Chen2,3, Kaiying Yu2,3, Minghua Cong5, Wei Li6, Zhengping Wang1 ![]() , Hanping Shi2,3
, Hanping Shi2,3 ![]()
1. Institute of Biopharmaceutical Research, Liaocheng University, Liaocheng, Shandong 252000, China.
2. Department of Gastrointestinal Surgery/Department of Clinical Nutrition, Beijing Shijitan Hospital, Capital Medical University, Beijing, 100038, China.
3. Beijing International Science and Technology Cooperation Base for Cancer Metabolism and Nutrition, Beijing, 100038, China.
4. The Second Affiliated Hospital and Yuying Children's Hospital of Wenzhou Medical University, Wenzhou, 325000, China.
5. Comprehensive Oncology Department, National Cancer Center/Cancer Hospital, Chinese Academy of Medical Sciences and Peking Union Medical College, Beijing, 100038, China.
6. Cancer Center, the First Hospital, Jilin University, Changchun, 130021, China.
*Equal contributions to this work with shared first authorship.
Received 2021-5-15; Accepted 2021-9-15; Published 2021-10-30
Abstract

Background: Changes in platelet count (PLT) are strongly associated with patient survival and may be clinically indicative of certain underlying diseases. However, there were few studies on the prognosis of patients with cancer cachexia.
Objective: The purpose of this study was to investigate the relationship between PLT and 1-year survival in patients with cancer cachexia.
Methods: We performed a nested case-control study of data from a multicenter clinical study of cancer. There were 252 patients with cancer cachexia whose survival time was less than or equal to 1 year and 252 patients with cancer cachexia whose survival time was more than 1 year meeting the inclusion criteria. The mortality risk and the adjusted risk were estimated by logistic regression and displayed as odds ratios (ORs) and 95% confidence intervals (95% CIs).
Results: PLT was negatively correlated with 1-year overall survival (OS) of patients with cancer cachexia (increased per standard deviation (SD): OR = 1.29; 95% CI: 1.05-1.60; P = 0.018). The higher the PLT, the lower the OS of patients. When classified by dichotomy (D1 < 296×109/L, D2 ≥ 296×109/L), OS of patients in the D2 group was worse (OR = 2.18; 95% CI: 1.38-3.47; P = 0.001). When classified by quartile (Q1- Q3 < 305×109/L, Q4 ≥ 305×109/L), OS of patients in the Q4 group was poorer (OR = 1.82; 95% CI: 1.14-2.94; P = 0.013). In addition, patients with a low PLT (< 296×109/L) and either a high total bilirubin (TBIL) (≥ 17.1 µmol/L) or a smoking history had poor 1-year survival. Based on our primary cohort study, we conducted a survival analysis of 3130 patients with cancer cachexia and found that OS was better in patients with low PLT (< 296×109/L).
Conclusion: PLT was negatively correlated with 1-year overall survival of patients with cancer cachexia.
Keywords: platelet count, survival, cancer cachexia, nested case-control study
Introduction
Cachexia is extremely common among all cancer deaths worldwide, with a prevalence of more than 50% [1-3]. Its incidence varies according to the type of tumor and is relatively high in gastric and pancreatic cancer (approximately 80%) but relatively low in breast cancer and leukemia (approximately 40%) [2]. In 2011, the International Delphi Consensus Process defined cancer cachexia as a multifactorial syndrome of sustained muscle loss (with or without adipose loss) that cannot be completely reversed by conventional nutritional support and leads to progressive functional impairments [4]. Cachexia patients often develop the following clinical manifestations: anorexia (or decreased food intake), enhanced catabolic metabolism, decreased muscle mass and strength, social and psychological disorders, and even death [5]. Therefore, how to intervene in the development of cachexia as well as improve the patients' quality of life has become an urgent issue in clinic.
In recent years, the relationship between platelets and cancer has received extensive attention. Platelet count (PLT) is associated with prognosis in many diseases. For instance, it can be used as a predictor of death and graft loss after liver transplantation. Patients with a PLT < 70 × 109/L on the fifth day following liver transplantation presented a high mortality rate and poor graft survival within one year after operation [6], and it had also been reported that decreased PLT level was significantly associated with increased total risk of death [7]. In addition, similar results were noted by the Women's Health Initiative (limited to post-menopausal females), in which low and high deviations from baseline and average platelet counts were positively correlated with total mortality, coronary heart disease (CHD) mortality, cancer mortality, and non-CHD/non-cancer mortality [8]. Furthermore, PLT plays a critical role in several steps of tumor development, including but not limited to tumor growth, angiogenesis, and metastasis of malignancies [9].
This study aims to explore the predictive function of PLT in the clinic, since in addition to its crucial role in hemostasis, platelet is increasingly recognized as an inflammatory mediator regulating the immuno-oncological system [10]. It was worth noting that it may play a critical predictive role in clinical practice, as several studies have reported the association between PLT and cancer prognosis [11-14]. However, few prospectively prognostic studies of PLT in the cachectic population are currently available. In view of this, this study aimed to investigate the association between PLT and overall survival (OS) in patients with cancer induced cachexia.
Materials and Methods
Participants
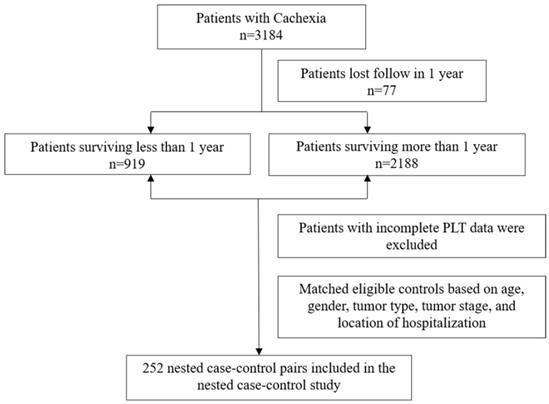
This study was a nested case-control study with data obtained from 40 clinical centers in China from 2013 to 2020. Cancer patients aged 18 years or older were enrolled and patients with incomplete PLT data were excluded (Figure 1). Currently, this study has been approved by the Medical Ethics Review Committee of the registered hospital (Beijing Shijitan Hospital) and conducted in accordance with the Declaration of Helsinki. In total, we identified 252 patients with cancer cachexia whose survival time was less than or equal to 1 year and matched 252 controls with a survival time of more than 1 year. We then paired the case and control groups in a 1: 1 ratio based on age (±5 years), gender, tumor type, tumor stage, and location of hospitalization. The median survival estimates along with the two-sided 95% CI of patients with survival time greater than 1 year and patients with survival time less than or equal to 1 year were as follows: 37.5 months (95%CI, 27.8 to 36.2) and 6.13 months (95%CI, 5.50 to 6.80), respectively. All pathological stages in our study were defined in accordance with the American Joint Committee on Cancer TNM staging system (8th edition) [15].
Flowchart of the study participants.
Diagnosis of Cancer Cachexia and Evaluation of Anthropometric and Lifestyle Factors
The diagnosis of cancer cachexia was based on Fearon's criteria [4]. Body mass index (BMI) was calculated as follows: BMI (kg/m2) = weight (kg) / height2 (m2). Mid-upper arm circumference (MAC) and triceps skin fold (TSF) were measured at the acromion and at the midpoint of the olecranon crest of the dominant arm. The subject was placed in a supine position with the knee flexed 90 degrees. MAC was measured with a plastic metric tape, while TSF was measured with a conventional skin crease caliper. A Jamar dynamometer was employed to measure hand grip strength (HGS) of the dominant hand. Information on smoking status, alcohol consumption and tea consumption were obtained through a lifestyle questionnaire. The OS was the primary outcome in this study, which included mortality due to any cause. Evidence of death was obtained from regular follow-up of the patients.
Laboratory Analysis
The subjects of laboratory testing mainly included total protein, albumin, neutrophils, total bilirubin (TBIL), aspartic transaminase (AST), alanine transaminase (ALT), hemoglobin, white blood cell (WBC), lymphocyte, red blood cell (RBC), as well as PLT. All blood tests were performed after at least 9 hours of fasting and before anti-tumor treatment within the first 24-hour hospitalization. All the study outcomes were reviewed and adjudicated by an independent Endpoint Adjudication Committee, whose members were unaware of the specific assignments of study group.
Cohort Study Analysis
Prognostic validation was performed in the cachexia cohort based on the truncation level of the nested case-control study. We collected data on 50,000 patients with cancer from 2013 to the end of 2020, and then divided them into a high PLT (≥ 296×109/L) group and a low PLT (< 296×109/L) group. Ultimately, 3130 patients with cancer cachexia were identified based on clinical diagnoses in the medical records, and a subsequent cohort study was conducted according to the matching principle of a 1: 1 ratio.
Statistical Analysis
Baseline characteristics were represented as means. Differences in categorical variables in baseline characteristics between the case and control groups were compared using the chi-square test, whereas continuous variables were compared using the Wilcoxon rank sum test or the t-test. In this study, odds ratios (ORs) and 95% confidence intervals (95% CIs) for 1-year survival of cancer patients were constructed by modeling risk factors as continuous variables, as well as modeling dichotomous and quartile PLTs using the chi-square test. Adjusted matching variables included BMI, HGS, MAC, TBIL, WBC, RBC, TSF, chemotherapy, radiotherapy, and surgery. Correction factors were selected using stepwise regression. In addition, heterogeneity among subgroups was evaluated by a conditional logistic regression method, and the influence of preoperative treatment was excluded by sensitivity analysis, and the interaction between PLT and subgroups was examined by probability ratio. Survival analysis of the basic cohort (n = 3130) was performed by the Kaplan-Meier method and survival curves. In this study, a two-tailed P < 0.05 was considered statistically significant. All analyses were performed by the R software, version 4.0.2.
Results
Characteristics of Patients
Compared with patients who survived more than 1 year, patients who survived less than or equal to 1 year had higher levels of WBC (7.86×10⁹/L ± 3.98×10⁹/L vs. 6.45×10⁹/L ± 3.21×10⁹/L), neutrophil count (5.59×10⁹/L ± 3.77×10⁹/L vs. 4.36×10⁹/L ± 3.90×10⁹/L), as well as PLT (261×109/L ± 116×109/L vs. 238×109/L ± 96×109/L). However, HGS (21.85 kg ± 9.56 kg vs. 24.25 kg ± 8.50 kg), BMI(20.15 kg/m2 ± 2.90 kg/m2 vs. 21.18 kg/m2 ± 3.26 kg/m2) total protein (65.28 g/L ± 8.47 g/L vs. 67.63 g/L ± 6.86 g/L) and albumin (35.09 g/L ± 5.32 g/L vs. 38.30 g/L ± 5.92 g/L) levels, blood components including Hb (113.29 g/L ± 20.76 g/L vs. 120.38 g/L ± 17.97 g/L), lymphocyte count (1.33×10⁹/L ± 0.76×10⁹/L vs. 1.53×10⁹/L ± 0.65×10⁹/L), RBC (3.90×10¹²/L ± 0.72×10¹²/L vs. 4.16×10¹²/L ± 0.59×10¹²/L), as well as MAC (24.44 cm ± 3.29 cm vs. 25.22 cm ± 3.66 cm) and TSF (12.27 mm ± 6.83 mm vs. 14.53 mm ± 7.37 mm) were lower in the patient population with shorter survival (Table 1). The above variables were used as adjustment variables for the case-control matching analysis.
Detailed baseline characteristics of the enrolled patients
| Characteristic | Total (n = 504) | > 1year (n = 252) | ≤ 1year (n = 252) | P value |
|---|---|---|---|---|
| Age, years, n (%) | 59.61 (9.49) | 59.69 (9.48) | 59.52 (9.51) | 0.844 |
| Gender, n (%) | 1.000 | |||
| Male | 324 (64.30) | 162 (64.30) | 162 (64.30) | |
| Female | 180 (35.70) | 90 (35.70) | 90 (35.70) | |
| Tumor stage, n (%) | 1.000 | |||
| I | 14 (2.80) | 7 (2.80) | 7 (2.80) | |
| II | 62 (12.30) | 31 (12.30) | 31 (12.30) | |
| III | 164 (32.50) | 82 (32.50) | 82 (32.50) | |
| IV | 264 (52.40) | 132 (52.40) | 132 (52.40) | |
| Chronic disease (Yes), n (%) | 167 (33.10) | 89 (35.30) | 78 (31.00) | 0.344 |
| Family history (Yes), n (%) | 76 (15.10) | 37 (14.70) | 39 (15.50) | 0.901 |
| Smoking, n (%) | 260 (51.60) | 125 (49.60) | 135 (53.60) | 0.422 |
| Drinking, n (%) | 143 (28.40) | 64 (25.40) | 79 (31.30) | 0.167 |
| Tea consumption (Yes), n (%) | 149 (29.60) | 77 (30.60) | 72 (28.60) | 0.696 |
| Nutrition support (Yes), n (%) | 199 (39.50) | 85 (33.70) | 114 (45.20) | 0.011 |
| Total protein, g/L | 66.45 (7.79) | 67. 63 (6.86) | 65.28 (8.47) | 0.001 |
| Albumin, g/L | 36.69 (5.84) | 38.30 (5.92) | 35.09 (5.32) | <0.001 |
| TBIL, median (IQR), g/L | 11.00 [8.00, 15.20] | 10.55 [8.00, 14.35] | 11.20 [8.07, 16.33] | 0.058 |
| AST, median (IQR), U/L | 22.00 [17.00, 30.02] | 21.00 [17.00, 28.38] | 22.95 [17.20, 32.00] | 0.093 |
| ALT, median (IQR), U/L | 18.80 [13.00, 29.38] | 18.80 [13.47, 29.00] | 18.45 [12.80, 31.15] | 0.970 |
| Hb, g/L | 116.83 (19.72) | 120.38 (17.97) | 113.29 (20.76) | <0.001 |
| WBC, 109/L | 7.15 (3.68) | 6.45 (3.21) | 7.86 (3.98) | <0.001 |
| Neutrophil count, 109/L | 4.98 (3.88) | 4.36 (3.90) | 5.59 (3.77) | <0.001 |
| Lymphocyte count, 109/L | 1.43 (0.71) | 1.53 (0.65) | 1.33 (0.76) | 0.001 |
| RBC, 1012/L | 4.03 (0.67) | 4.16 (0.59) | 3.90 (0.72) | <0.001 |
| PLT, 109/L | 249.35 (106.74) | 237.52 (95.92) | 261.17 (115.56) | 0.013 |
| BMI, kg/m2 | 20.66 (3.13) | 21.18 (3.26) | 20.15 (2.90) | <0.001 |
| HGS, kg | 23.05 (9.12) | 24.25 (8.50) | 21.85 (9.56) | 0.003 |
| TSF, mm | 13.40 (7.18) | 14.53 (7.37) | 12.27 (6.83) | <0.001 |
| MAC, cm | 24.83 (3.50) | 25.22 (3.66) | 24.44 (3.29) | 0.012 |
| Surgery, n (%) | 127.00 (25.20) | 67.00 (26.60) | 60.00 (23.80) | 0.530 |
| Chemotherapy, n (%) | 279.00 (55.40) | 155.00(61.50) | 124.00 (49.20) | 0.007 |
| Radiotherapy, n (%) | 28.00(5.60) | 9.00 (3.60) | 19.00 (7.50) | 0.080 |
Notes: Continuous variables were represented by mean ± standard deviations (SDs), among them, TBIL, AST, ALT were represented by median and interquartile range. Categorical variables were represented by numbers and percentages. Differences in baseline characteristics were compared using the chi-square test, t-test (conform to the normal distribution), or Wilcoxon rank sum test (not conform to the normal distribution). TBIL: total bilirubin; AST: aspartic transaminase; ALT: alanine transaminase; Hb: hemoglobin; WBC: white blood cell; RBC: red blood cell; PLT: platelet count; BMI: body mass index; HGS: hand grip strength; TSF: triceps skin fold; MAC: mid-upper arm circumference.
The Relationship between PLT and 1-year OS of the Patients with Cancer Cachexia
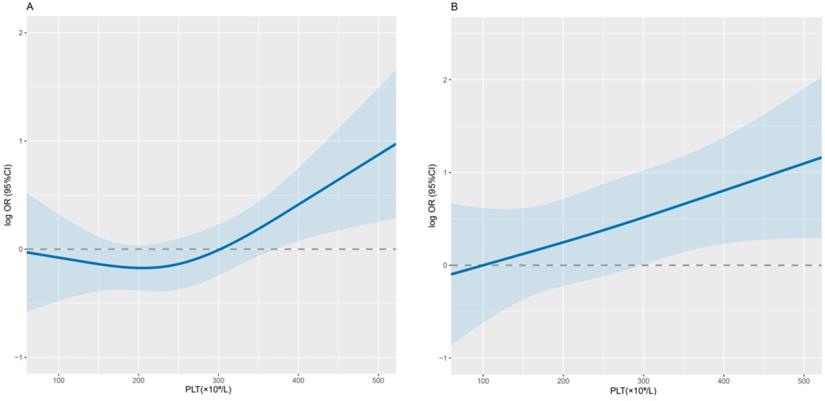
Overall, PLT was significantly correlated with 1-year survival in cancer cachexia patients (per SD increment-OR = 1.29; 95% CI: 1.05-1.60) (Table 2). The adjusted curve showed a linear trend, suggesting that the higher the PLT, the lower the OS of patients (Figure 2). When dichotomizing PLT (D1 < 296×109/L, D2 ≥ 296×109/L), we found that the D2 group had poorer OS compared with the D1 group (adjusted OR = 2.18; 95 % CI: 1.38-3.47; adjusted P = 0.001). While when patients' PLT levels were divided into quartiles (Q1-Q3 < 305×109/L, Q4 ≥ 305×109/L), the Q4 group had a relatively higher risk (adjusted OR = 1.82; 95% CI: 1.14-2.94; adjusted P = 0.013) and worse 1-year OS compared with the Q1-Q3 group (Table 2). Through sensitivity analysis, we ruled out the effect of radiotherapy and chemotherapy on the results, which was consistent with the initial results (Table 3).
Conditional logistic regression analysis of anthropometrics and 1-year OS of patients with cancer cachexia
| PLT (×109/L) | Cases/Controls | Unadjusted | Adjusted | ||
|---|---|---|---|---|---|
| P value | OR (95% CI) | P value | OR (95% CI) | ||
| Per SD | 0.015 | 1.23 (1.04-1.46) | 0.018 | 1.29 (1.05-1.60) | |
| By cutoff | |||||
| D1 (< 296) | 167/200 | ref. | ref. | ||
| D2 (≥ 296) | 85/52 | 0.001 | 2.01 (1.34-3.02) | 0.001 | 2.18 (1.38-3.47) |
| Interquartile | |||||
| Q1~Q3 (< 305) | 175/203 | ref. | ref. | ||
| Q4 (≥ 305) | 77/49 | 0.006 | 1.79 (1.19-2.71) | 0.013 | 1.82 (1.14-2.94) |
Notes: The 1-year survival ORs of cancer cachexia patients were estimated by modeling PLT as a continuous variable and using conditional logistic regression as the dichotomy and quartile. The analyses were adjusted for BMI, HGS, MAC, albumin, TBIL, WBC, RBC, TSF, chemotherapy, radiotherapy, surgery. PLT: platelet count; CI: confidence interval; OR: odds ratio; P: probability; D: dichotomy; Q: quarter; BMI: body mass index; HGS: hand grip strength; MAC: mid-upper arm circumference; TBIL: total bilirubin; WBC: white blood cell; RBC: red blood cell; TSF: triceps skin fold.
Relationship between PLT and 1-year survival in patients with cancer cachexia. Notes: Use conditional logistic regression to analyze the data before (A; per SD increment-P=0.015; OR=1.23; 95% CI: 1.04-1.46) and after adjustment (B; per SD increment-P=0.018; OR=1.29; 95% CI: 1.05-1.60). Adjusted for BMI, HGS, MAC, albumin, TBIL, WBC, RBC, TSF, chemotherapy, radiotherapy, surgery. PLT: platelet count; CI: confidence interval; OR: odds ratio; BMI: body mass index; HGS: hand grip strength; MAC: mid-upper arm circumference; TBIL: total bilirubin; WBC: white blood cell; RBC: red blood cell; TSF: triceps skin fold.
Sensitivity analysis
| PLT (×109/L) | Cases/Controls | Unadjusted | Adjusted | ||
|---|---|---|---|---|---|
| P value | OR (95% CI) | P value | OR (95% CI) | ||
| Per SD | 0.029 | 1.21(1.02-1.44) | 0.040 | 1.25(1.01-1.56) | |
| By cutoff | |||||
| D1 (< 296) | 161/194 | ref. | ref. | ||
| D2 (≥ 296) | 82/50 | 0.001 | 1.98(1.32-2.99) | 0.001 | 2.16(1.36-3.48) |
| Interquartile | |||||
| Q1~Q3 (< 305) | 169/195 | ref. | ref. | ||
| Q4 (≥ 305) | 74/49 | 0.012 | 1.71(1.13-2.60) | 0.024 | 1.74 (1.08-2.82) |
Notes: The sensitivity analysis of the correlation between PLT and the one-year survival of the cancer cachexia population after excluding 19 cases who received preoperative treatment.
Subgroup Analyses
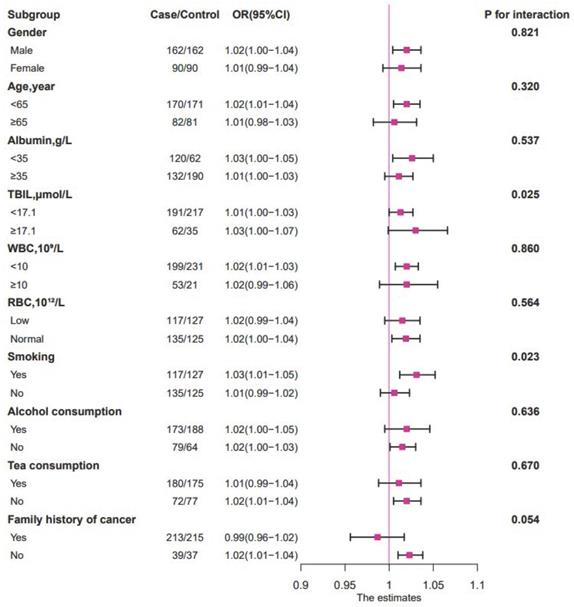
When the relationship between PLT and survival time was evaluated in different subgroups by stratified analysis (Figure 3), it could be observed that high TBIL level (≥ 17.1 µmol/L), smoking history, and high PLT (≥ 296×109/L) were negatively correlated with patient prognosis (P < 0.05). The negative association between PLT and 1-year survival was stronger in the high TBIL group (OR = 1.03; 95% CI: 1.00-1.07; P = 0.025) than in the low TBIL group (OR = 1.01; 95% CI: 1.00-1.03) (Figure 3, Figure 4). Similarly, the negative correlation between PLT and 1-year survival was stronger in patients with cancer cachexia (OR = 1.03; 95% CI: 1.01-1.05; P = 0.023) than in those without a history of smoking (OR = 1.01; 95% CI: 0.99-1.02) (Figure 3, Figure 4).
The relationship between PLT (as continue value) and the 1-year OS of patients with cancer cachexia in different subgroups. Notes: The conditional logistic regression model was used to calculate the relationship between ORs and PLT (as continue value) of patients with cancer cachexia at 1 year. Each subgroup was adjusted for BMI, HGS, MAC, albumin, TBIL, WBC, RBC, TSF, chemotherapy, radiotherapy, surgery. OR: odds ratio; P: probability; TBIL: total bilirubin; WBC: white blood cell; RBC: red blood cell.
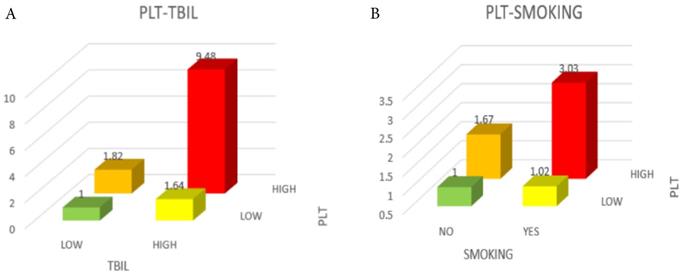
Comparison of mortality risk among different groups of patients. A, Green was in the OR range of 0-1, yellow and orange were in the range of 1-2, and red was in the range of 9-10. B, Green was in the OR range of 0-1, yellow was in the range of 1-1.5, orange was in the range of 1.5-2, and red was in the range of 3-3.5. Notes: PLT: platelet count; TBIL: total bilirubin; OR: odds ratio.
Validation in a Cohort of Patients with Cancer Cachexia
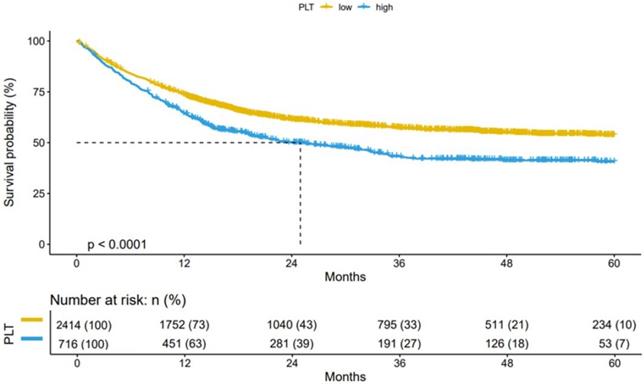
Based on the cut-off level (296×109/L) of the nested case-control study, we performed prognostic validation in the cachexia cohort. The cohort study (n=3130) showed that compared with patients with high PLT (≥ 296×109/L), patients with low PLT (< 296×109/L) had better OS (Figure 5). Thus, providing validation for the reliability of the established cut-off for PLT in cancer cachexia patients.
Results of the Kaplan-Meier survival analysis in PLT-stratified patients with cancer cachexia. Notes: Patients with cancer cachexia were followed up for more than 1 year (n=3130). PLT: platelet count; P: probability.
Discussion
Overall, in this hospital-based retrospective nested case-control study, a higher PLT was associated with a poorer OS. The relationship between PLT and survival has been examined in several previous studies. In an analysis of 285 patients with non-small cell lung cancer who underwent consecutive therapeutic pneumonectomy, the rates of thrombocytosis were 22.41% and 3.82% in stage III + IV and stage I patients, respectively (median PLT: 449×109/L vs. 254×109/L; P < 0.001), indicating that thrombocytosis was prevalent in patients with non-small cell cancer [12]. In addition, it has been reported that elevated PLT (≥ 400×109/L) could predict poor prognosis in lung cancer patients [14]. However, the cut-off values of PLT in the above studies were higher than the normal value, demonstrating no contradiction with the results of our study. Similarly, a cohort study conducted by Lu et al. showed that the median OS of hepatocellular carcinoma patients was highest when the platelet count change (ΔPLT) was in the range of '± 20×109/L', while it decreased when the ΔPLT ≤ or ≥ 20×109/L, which is in favor of our findings[13]. Of note, reports on the association between PLT levels within the normal range and patient survival remain scarce.
Analysis of Q1-Q4 groups indicated that elevated PLT was negatively correlated with OS of cancer cachexia patients. Furthermore, we found interactions between PLT and TBIL levels as well as smoking history in subgroup analyses. Specifically, the OR value was highest (OR=8.98) when both PLT and TBIL were high, suggesting that those patients with higher PLT and TBIL would suffer from a higher risk of death compared to those with lower PLT and TBIL.
A study showed that in stage IV colorectal cancer patients, elevated TBIL and DBIL were associated with poorer OS [16]. The optimal cut-off value for TBIL was 12.9 μmol/L, slightly lower than that of this study, which may be attributed to different geographic locations and tumor stages. However, in studies on non-metastatic breast cancer [17], gastric cancer [18], as well as stages II and III colorectal cancer (after radical resection) [19], TBIL was positively correlated with survival. But among them the TBIL cut-off values were all lower than that in our study. Further study of the interaction under normal values for PLT is needed. Furthermore, patients with high PLT and smoking history also had a poor survival (OR = 2.95), partially owing to the fact that smoking causes oxidative stress in vivo and leads to platelet activation and aggregation. Meanwhile, smoking may activate thrombopoietin which stimulates platelet production [20]. It had also been reported that smoking caused a hypercoagulable state of blood, which directly promoted thrombosis [21].
Platelets, and platelet related indicators, including PLT, mean platelet volume (MPV), platelet distribution width (PDW), platelet crit (PCT), and platelet-to-lymphocyte ratio (PLR), are important in the clinical observation of the prognosis of certain cancers. Using a retrospective analysis, Huang [22] and colleagues found that breast cancer patients with a PDW >16.8% had an overall survival rate of 16.8%, which was significantly shorter than that of patients with a PDW ≤ 16.8%, indicating that PDW may be a prognostic marker in breast cancer. It had also been reported that MPV and PDW could be used as the prognostic indicators for benign and malignant endometrial lesions. In the malignant group, MPV was higher than 7.54 while PDW was lower than 37.8, showing the potential of these two indicators in discriminating between benign and malignant endometrial tumors [23]. Similarly, patients with a higher baseline MPV had worse progression free survival and overall survival [24], in consistency with the previous conclusion. Moreover, PLR has been demonstrated to be of reference significance in prediction of prognosis across a variety of cancers. A meta-analysis showed a negative correlation between PLR and OS, as a higher PLR increased the risk of mortality from hepatocellular carcinoma (OR = 1.59; 95% CI: 1.42-2.04; P < 0.00001) [25].
The ability of PLT in predicting the prognosis of cancer cachexia patients may be related to thromboembolism. In cancer patients, the endogenous ligand podoplanin binds to C-type lectin-like receptor 2 to induce platelet activation, promoting hematological cancer metastasis and cancer associated thrombosis [26]. This hypothesis has been confirmed in animal experiments. In addition, Julia and colleagues, in the study of cancer patients with poor prognosis, found that the mortality and the incidence of venous thromboembolism may be enhanced by excessive platelet activation [27]. Another mechanism by which massive platelet activation leads to poor prognosis in cancer patients may lie in the release of a large number of factors that modulate tumor microenvironment after platelet activation. These factors may promote the release of angiogenic growth factors from platelet α-granules and contribute to tumor angiogenesis. The release of proinflammatory cytokines helps remodel extracellular matrix and promotes angiogenesis. In addition, platelets promote circulation, extravasation, as well as epithelial mesenchymal transition at metastatic sites, and facilitate malignant cell colonization [10, 28, 29]. The risk of thromboembolism is significantly increased [30], and venous thromboembolism is considered as the main cause of death among cancer patients. Studies have proven that early venous embolism was associated with increased mortality in lung cancer patients [31]. Other mechanisms still need to be explored.
Currently, this correlation was found for the first time in our study, which provided great help and convenience for the prognostic management of patients with cancer cachexia. However, this paper has several limitations in the following aspects. First, participants' PLT was evaluated only at baseline, so we could not explore the impact of dynamic changes in PLT on the survival of cancer patients. Second, our included sample size (n=252) was not sufficiently representative of all patients with cancer cachexia. Further studies need to expand the sample size to increase credibility. Third, our study subjects were of a single ethnicity, multi-ethnic studies may be conducted in the future to generalize our conclusions. Finally, this study is short of a systematic review addressing multiple platelet indices (MPV, PDW, PCT, etc.) which could be fixed out in future study design. Due to the aforementioned limitations, these findings require further verification in the future.
Conclusions
In summary, PLT was negatively correlated with 1-year OS in patients with cancer cachexia, which was validated in the total independent population cohort. In addition, patients with a high TBIL and a smoking history had a lower 1-year survival rate. Our findings, to some extent, provide certain guidance for the prognostic management of patients with cancer cachexia.
Abbreviations
PLT: platelet count; ORs: odds ratios; 95% CIs: 95% confidence intervals; OS: overall survival; SD: standard deviation; TBIL: total bilirubin; CHD: coronary heart disease; BMI: body mass index; MAC: mid-upper arm circumference; TSF: triceps skin fold; HGS: hand grip strength; AST: aspartic transaminase; ALT: alanine transaminase; WBC: white blood cell; RBC: red blood cell; Hb: hemoglobin; P: probability; D: dichotomy; Q: quarter; MPV: mean platelet volume; PDW: platelet distribution width; PCT: platelet crit; PLR: platelet-to-lymphocyte ratio; TNM: tumor node metastasis.
Acknowledgements
We thank all the patients who participated in this study for their active cooperation and valuable contribution, their blood and time. We would like to express gratitude to the 40 clinical centers for providing the data used in this study. We also appreciate the linguistic assistance provided by TopEdit during the preparation of this manuscript.
Funding
This work was supported by the National Key Research and Development Program [grant number 2017YFC1309200].
Competing Interests
The authors have declared that no competing interest exists.
References
1. Baracos VE, Martin L, Korc M, Guttridge DC, Fearon KCH. Cancer-associated cachexia. Nat Rev Dis Primers. 2018;4:17105
2. Sadeghi M, Keshavarz-Fathi M, Baracos V, Arends J, Mahmoudi M, Rezaei N. Cancer cachexia: Diagnosis, assessment, and treatment. Crit Rev Oncol Hematol. 2018;127:91-104
3. Argiles JM, Busquets S, Stemmler B, Lopez-Soriano FJ. Cancer cachexia: understanding the molecular basis. Nat Rev Cancer. 2014;14:754-62
4. Fearon K, Strasser F, Anker SD, Bosaeus I, Bruera E, Fainsinger RL. et al. Definition and classification of cancer cachexia: an international consensus. The Lancet Oncology. 2011;12:489-95
5. Stewart GD, Skipworth RJ, Fearon KC. Cancer cachexia and fatigue. Clinical medicine (London, England). 2006;6:140-3
6. Beltrame P, Rodriguez S, Brandao ABM. Low platelet count: Predictor of death and graft loss after liver transplantation. World J Hepatol. 2019;11:99-108
7. Bonaccio M, Di Castelnuovo A, Costanzo S, De Curtis A, Donati MB, Cerletti C. et al. Age- and sex-based ranges of platelet count and cause-specific mortality risk in an adult general population: prospective findings from the Moli-sani study. Platelets. 2018;29:312-5
8. Kabat GC, Kim MY, Verma AK, Manson JE, Lin J, Lessin L. et al. Platelet count and total and cause-specific mortality in the Women's Health Initiative. Ann Epidemiol. 2017;27:274-80
9. Riedl J, Pabinger I, Ay C. Platelets in cancer and thrombosis. Hämostaseologie. 2013
10. Olsson AK, Cedervall J. The pro-inflammatory role of platelets in cancer. Platelets. 2018;29:569-73
11. Xie X, Zeng X, Cao S, Hu X, Shi Q, Li D. et al. Elevated pretreatment platelet distribution width and platelet count predict poor prognosis in nasopharyngeal carcinoma. Oncotarget. 2017;8:106089-97
12. Skorek P, Stępień K, Fila M, Hauer J, Kużdżał J. Preoperative thrombocytosis in surgically treated patients with non-small cell lung cancer. Polish archives of internal medicine. 2018;128:512-7
13. Lu L, Zhang Y, Zheng P, Wu Z, Wang X, Chen Y. et al. Elevated Platelet Count is Associated with Poor Survival After Transarterial Chemoembolization Treatment in Patients with Hepatocellular Carcinoma: A Cohort Study. J Hepatocell Carcinoma. 2020;7:191-9
14. Zhang X, Ran Y. Prognostic role of elevated platelet count in patients with lung cancer: a systematic review and meta-analysis. International journal of clinical and experimental medicine. 2015;8:5379-87
15. Amin MB, Greene FL, Edge SB, Compton CC, Gershenwald JE, Brookland RK. et al. The Eighth Edition AJCC Cancer Staging Manual: Continuing to build a bridge from a population-based to a more "personalized" approach to cancer staging. CA Cancer J Clin. 2017;67:93-9
16. Yang L, Ge LY, Yu T, Liang Y, Yin Y, Chen H. The prognostic impact of serum bilirubin in stage IV colorectal cancer patients. J Clin Lab Anal. 2018 32
17. Liu X, Meng QH, Ye Y, Hildebrandt MA, Gu J, Wu X. Prognostic significance of pretreatment serum levels of albumin, LDH and total bilirubin in patients with non-metastatic breast cancer. Carcinogenesis. 2015;36:243-8
18. Sun H, He B, Nie Z, Pan Y, Lin K, Peng H. et al. A nomogram based on serum bilirubin and albumin levels predicts survival in gastric cancer patients. Oncotarget. 2017;8:41305-18
19. Zhang Q, Ma X, Xu Q, Qin J, Wang Y, Liu Q. et al. Nomograms incorporated serum direct bilirubin level for predicting prognosis in stages II and III colorectal cancer after radical resection. Oncotarget. 2017;8:71138-46
20. Lupia E, Bosco O, Goffi A, Poletto C, Locatelli S, Spatola T. et al. Thrombopoietin contributes to enhanced platelet activation in cigarette smokers. Atherosclerosis. 2010;210:314-9
21. Elkhalifa AM. Effects of cigarette smoking on coagulation screening tests and platelet counts in a Sudanese male adults population. Saudi Med J. 2018;39:897-901
22. Huang Y, Cui MM, Huang YX, Fu S, Zhang X, Guo H. et al. Preoperative platelet distribution width predicts breast cancer survival. Cancer Biomark. 2018;23:205-11
23. Kurtoglu E, Kokcu A, Celik H, Sari S, Tosun M. Platelet Indices May be Useful in Discrimination of Benign and Malign Endometrial Lesions, and Early and Advanced Stage Endometrial Cancer. Asian Pac J Cancer Prev. 2015;16:5397-400
24. Lian L, Xia YY, Zhou C, Shen XM, Li XL, Han SG. et al. Mean platelet volume predicts chemotherapy response and prognosis in patients with unresectable gastric cancer. Oncol Lett. 2015;10:3419-24
25. Hu DH, Yu SM. Association between platelet to lymphocyte ratio (PLR) and overall survival (OS) of hepatocellular carcinoma (HCC): A meta-analysis. Cell Mol Biol (Noisy-le-grand). 2017;63:30-2
26. Suzuki-Inoue K. Platelets and cancer-associated thrombosis: focusing on the platelet activation receptor CLEC-2 and podoplanin. Blood. 2019;134:1912-8
27. Riedl J, Kaider A, Marosi C, Prager GW, Eichelberger B, Assinger A. et al. Decreased platelet reactivity in patients with cancer is associated with high risk of venous thromboembolism and poor prognosis. Thromb Haemost. 2017;117:90-8
28. Gay LJ, Felding-Habermann B. Contribution of platelets to tumour metastasis. Nature Reviews Cancer. 2011;11:123
29. Labelle M, Begum S, Hynes RO. Direct signaling between platelets and cancer cells induces an epithelial-mesenchymal-like transition and promotes metastasis. Cancer cell. 2011;20:576-90
30. Khorana AA, Francis CW, Culakova E, Kuderer NM, Lyman GH. Thromboembolism is a leading cause of death in cancer patients receiving outpatient chemotherapy. Journal of thrombosis and haemostasis: JTH. 2007;5:632-4
31. Kourelis TV, Wysokinska EM, Wang Y, Yang P, Mansfield AS, Tafur AJ. Early venous thromboembolic events are associated with worse prognosis in patients with lung cancer. Lung cancer (Amsterdam, Netherlands). 2014;86:358-62
Author contact
![]() Corresponding authors: Prof. Han-Ping Shi, Department of Gastrointestinal Surgery/Department of Clinical Nutrition, Beijing Shijitan Hospital, Capital Medical University; Beijing International Science and Technology Cooperation Base for Cancer Metabolism and Nutrition. 10 Tie Yi Road, Beijing, 100038, China; Tel: +86-10-6392 6985; Fax: +86-10-6392 6325. E-mail: shihpedu.cn; Dr. Zheng-Ping Wang, Institute of Biopharmaceutical Research, Liaocheng University, Liaocheng, Shandong 252000, China; E-mail: bioactiveschinacom.
Corresponding authors: Prof. Han-Ping Shi, Department of Gastrointestinal Surgery/Department of Clinical Nutrition, Beijing Shijitan Hospital, Capital Medical University; Beijing International Science and Technology Cooperation Base for Cancer Metabolism and Nutrition. 10 Tie Yi Road, Beijing, 100038, China; Tel: +86-10-6392 6985; Fax: +86-10-6392 6325. E-mail: shihpedu.cn; Dr. Zheng-Ping Wang, Institute of Biopharmaceutical Research, Liaocheng University, Liaocheng, Shandong 252000, China; E-mail: bioactiveschinacom.