Impact Factor ISSN: 1837-9664

 Global reach, higher impact
J Cancer 2021; 12(24):7445-7453. doi:10.7150/jca.64661 This issue Cite
Research Paper
PTPRO is a therapeutic target and correlated with immune infiltrates in pancreatic cancer
Xuben Hou1, Jintong Du2 ![]() , Hao Fang1
, Hao Fang1 ![]()
1. Department of Medicinal Chemistry and Key Laboratory of Chemical Biology of Natural Products (MOE), Cheeloo College of Medicine, School of Pharmaeutical Science, Shandong University, Jinan, Shandong, 250012, China.
2. Shandong Cancer Hospital and Institute, Shandong First Medical University, Jinan, Shandong, 250117, China.
Received 2021-7-7; Accepted 2021-10-4; Published 2021-10-30
Abstract

As a member of protein tyrosine phosphatases (PTPs), the protein tyrosine phosphatase receptor type O (PTPRO) has attracted increasing attention for its important roles in cell signaling. Currently, the roles of PTPRO in human cancers remain elusive. Herein, we performed bioinformatic analyses and revealed the potential oncogenic role of PTPRO in specific cancer types. Further in vitro experiments indicated that inhibition of PTPRO suppresses the proliferative abilities of tumor cells in pancreatic cancer, blood cancer, and breast cancer. Moreover, small molecular PTPRO inhibitor could induce cell apoptosis and affect the cell cycle in pancreatic cancer. In addition, PTPRO expression promoted the infiltration of CD8+ T, macrophages, dendritic cells, and neutrophils, in pancreatic cancers. Our findings suggested PTPRO may serve as a potential drug target for pancreatic cancer.
Keywords: PTPRO, prognosis, biomarker, pancreatic cancer, tumor-infiltrating
Introduction
Nowadays, phosphorylation of protein tyrosine, which is modulated jointly by protein tyrosine phosphatases (PTPs) and protein tyrosine kinases (PTKs), is recognized as a major regulatory mechanism of cell signaling [1]. Elevated tyrosine kinase activity is frequently observed in many human cancers and most of the known dominant oncogenes are PTKs [2]. Considering that PTPs catalyze the reverse reaction, it is speculated that PTPs might block this oncogenic transformation and act as tumor suppressors [3]. However, numerous studies have revealed that PTPs do not necessarily oppose PTK activity but can also exert oncogenic functions [4, 5]. In contrast to the PTK activity, PTPs can mediate signal transduction pathways either negatively or positively. As such, they activate or inhibit tyrosine kinases through dephosphorylation of either the kinase or its downstream target [6].
Even though targeted therapy based on PTK has progressed to the levels that they have been approved by the FDA, the development of PTP inhibitor is still in progress. Genetic assessment of various cancers in humans at a large-scale level recently revealed the value of PTPs as candidate tumor inhibitors or as potential oncoproteins. Currently, the Src homology domain-containing phosphatase 2 (SHP2) and the three-membered family of phosphatases of regenerating liver (PRL) have been identified as oncogenic members of the PTP superfamily [7-12]. At present, four SHP2 inhibitors are currently undergoing clinical trials for the therapy against solid tumors. These findings shed new lights on the PTP-targeted anti-cancer therapy.
Protein tyrosine phosphatase receptor-type O (PTPRO) is categorized as a receptor-type PTP of the R3 subtype. Evidence indicates that PTPRO can be downregulated via methylation in some forms of tumors, such as breast cancer, hepatocellular carcinoma, lung cancer, chronic lymphocytic leukemia, and esophageal carcinoma [13-18]. Nevertheless, to our knowledge no studies have systematically investigated the expression and prognostic value of PTPRO in various human cancers. Therefore, the specific objective here was to better characterize the potential functions of PTPRO in human cancers. Herein, we employed the PrognoScan [19] and Oncomine [20] databases, as well as Kaplan-Meier plotter [21] to conduct a comprehensive analysis of PTPRO expression and its link with cancer prognosis. In vitro tests indicated that inhibition of PTPRO impacts the cell growth, cell apoptosis as well as cell cycle in pancreatic cancer. Also, we examined the link between PTPRO expression and KEGG pathways using Gene Set Enrichment Analyses (GSEA) [22]. Furthermore, we utilized TIMER [23, 24] (Immune Estimation Tumor Resource) to analyze the relationship between PTPRO and tumor-infiltrating immune cells in the various tumor microenvironments. Our findings revealed that PTPRO might play a crucial role in the progression of pancreatic cancer.
Materials and Methods
Bioinformatic analysis
Data on PTPRO gene expression in certain forms of cancers were retrieved from the Oncomine database [20]. The PrognoScan database [19] was employed to analyze the relationship between PTPRO expression and survival in various tumor types. The threshold was adjusted to a Cox P-value < 0.05. Meanwhile, Kaplan-Meier plotter (http://kmplot.com/analysis/) [21] was used to analyze the association between PTPRO expression and survival in rectum and pancreatic cancers. Also calculated were log-rank P-value and hazard ratio (HR) with 95% confidence intervals. GSEA were carried out using TCGA gene expression data of pancreatic cancer samples with pearson measure and PTPRO was used as the gene phenotype. The link between PTPRO expression and tumor purity, as well as immune infiltrate abundance, such as B cells, CD8+ T cells, CD4+ T cells, neutrophils, dendritic cells, and macrophages, were analyzed via TIMER (http://timer.cistrome.org/) [23].
Anti-proliferation assay
We conducted the sulforhodamine B assay (SRB) to assess the proliferative ability of the adherent cells. In brief, the cells were seeded into 96-well plates and subjected to various concentrations of PTPRO inhibitor GP03, then incubated for 72 hours. Subsequently, the cells were fixed for 1 hour in 10% trichloroacetic acid at 4 °C. After that, the cells were washed thrice in tap water then air-dried. Surviving cells were stained at room temperature with 0.4% (w/v) SRB for 20 minutes and then rinsed thrice with 1% acetic acid. Bound SRB were dissolved in 10 mM Tris, then we measured the absorbance at 540 nm.
Lentivirus transduction and Celigo image cytometry assay
The PTPRO-siRNA lentivirus (shPTPRO) and negative control lentivirus (shCtrl) were obtained from Shanghai GeneChem Co., Ltd. (Shanghai, China). The SW1990 cell line was infected with lentivirus as per the instructions of the manufacturer. We used a fluorescence microscope (Olympus IX71, Tokyo, Japan) to examine the cells for presence of the GFP marker three days following infection. Subsequently, we seeded (2500 cells/well) the transfected SW1990 cells into 96-well plates and incubated them at 37 °C with 5% CO2 for five days. Daily counting of cell number was conducted using the Celigo® Image Cytometer (Nexcelom, USA).
Cell apoptosis
We seed the SW1990 cells (5 × 10⁵ cells/mL) into six-well plates then incubated them for 24 hours together with GP03 compound (100μM). Subsequently, the cells were collected via trypsinization then washed two times in cold PBS. Next, the cells were centrifuged, then supernatants removed after which the cells were resuspended in 400μL of 1×binding buffer, then added to 5μL of annexin V-FITC and left to stand for 15 minutes at RT. After that, we added 10μL of PI to the cells then maintained them again at RT for 15 minutes, but in the dark. Finally, we used a flow cytometer (BD Accuri C6) to analyze the stained cells.
Cell cycle
We seed the SW1990 cells (5 × 10⁵ cells/mL) into six-well plates then incubated them for 24 hours together with GP03 compound (100 μM). Subsequently, the cells were collected via trypsinization then washed two times in cold PBS. Next, the cells were centrifuged, then supernatants removed after which the cells were resuspended in 400 μL of 1×binding buffer, then added to 5μL of annexin V-FITC and left to stand for 15 minutes at RT. After that, we added 10μL of PI to the cells then maintained them again for 15 minutes at RT, but in the dark. Finally, we used a flow cytometer (BD Accuri C6) to analyze the stained cells.
Results
Expression of PTPRO in various forms of human cancers
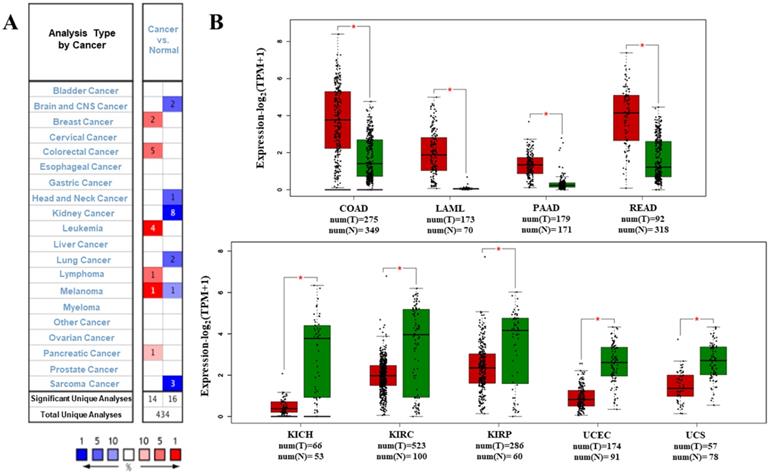
We analyzed the data on the levels of PTPRO mRNA to compare the expression of PTPRO in various forms of cancers. The data which included information on tumor tissues versus their corresponding normal tissues were analyzed via the Oncomine database. According to the results, PTPRO was upregulated in breast, leukemia, lymphoma, colorectal, pancreatic cancers, and melanoma, relative to the matched normal tissues (Figure 1A). Also, downregulation of PTPRO was noted in bladder, colorectal, prostate, breast, lung, ovarian, head and neck cancers of certain data sets. We further assessed the expression of PTPRO expression in human cancers. At this stage, we employed the GEPIA server to analyze RNA-seq data of several cancers in TCGA. Significant upregulation of PTPRO was observed in colon adenocarcinoma (COAD), pancreatic adenocarcinoma (PAAD), rectum adenocarcinoma (READ), and acute myeloid leukemia (LAML), in comparison to matched normal tissues. However, PTPRO was downregulated in kidney chromophobe (KICH), kidney renal clear cell carcinoma (KIRC), uterine carcinosarcoma (UCS), uterine corpus endometrial carcinoma (UCEC), and kidney renal papillary cell carcinoma (KIRP), relative to the corresponding normal tissues (Figure 1B).
Expression of PTPRO in various forms of human cancers. (A) Upregulation or downregulation of PTPRO in data sets of various cancers, relative to normal tissues based on the Oncomine database. (B) Expression of PTPRO in various types of human cancers from TCGA database as assessed via GEPIA [25] (*P < 0.01).
Prognostic potential of PTPRO in human cancers
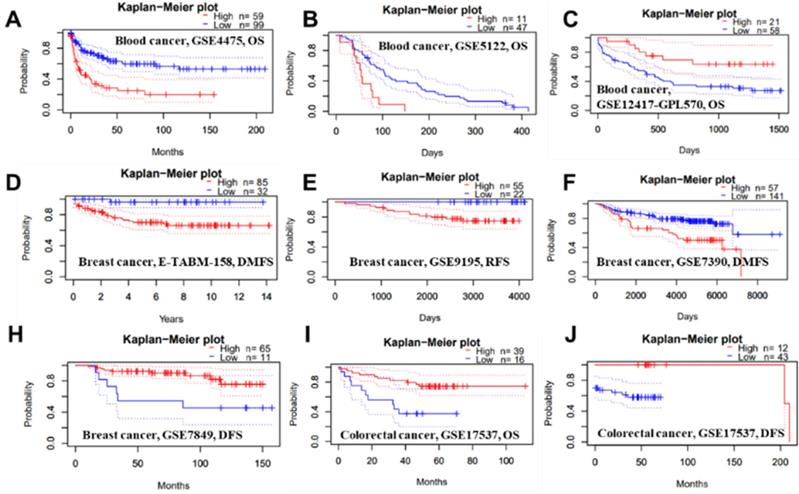
We conducted several analyses to determine whether there is a link between cancer prognosis and the expression of PTPRO. The PrognoScan was employed to assess whether PTPRO expression influence survival rates (Supplementary Table 1). Markedly, overexpression of PTPRO was associated with poorer prognosis in five type cancers, which included blood, brain, breast, esophagus and lung cancers. For example, two cohorts (GSE4475 and GSE5122) included 158 B-cell lymphoma samples and 58 AML samples revealed that PTPRO upregulation was related to poorer prognosis (OS HR = 2.02, 95% CI = 1.46 to 2.18, Cox P = 0.00002; OS HR = 1.62, 95% CI=1.12 to 2.34, Cox P = 0.01). Interesting, another cohort (GSE12417-GPL570), which include 79 AML samples, showed high PTPRO expression were associated with better prognosis (OS HR = 0.10, 95% CI= 0.02 to 0.59, Cox P = 0.01). In terms of breast cancer, three cohorts (E-TABM-158, GSE9195 and GSE7390) showed high PTPRO expression were linked to poorer prognosis (DMFS HR = 2.51, 95% CI = 1.27 to 4.98, Cox P = 0.008; RFS HR = 3.36, 95% CI=1.03 to 10.97, Cox P = 0.04; DMFS HR = 1.41, 95% CI = 1.00 to 1.98, Cox P = 0.05), however, one cohort (GSE7849) showed high PTPRO expression were related to better prognosis (DFS HR = 0.56, 95% CI = 0.33 to 0.95, Cox P = 0.03). Although we observed higher expression of PTPRO in colorectal cancer compared with normal samples (Figure 1B), two cohorts (GSE17537 and GSE17537) indicated that the high expression of PTPRO seems to be associated with better prognosis (OS HR = 0.57, 95% CI = 0.36 to 0.91, Cox P = 0.02; DFS HR = 0.56, 95% CI=0.34 to 0.93, Cox P = 0.03).
Representative Kaplan-Meier survival curves showing the high versus low PTPRO expression in various forms of cancer based on the PrognoScan databases.
Kaplan-Meier survival curves showing the high versus low PTPRO expression in various cancer types based on the Kaplan-Meier plotter databases.
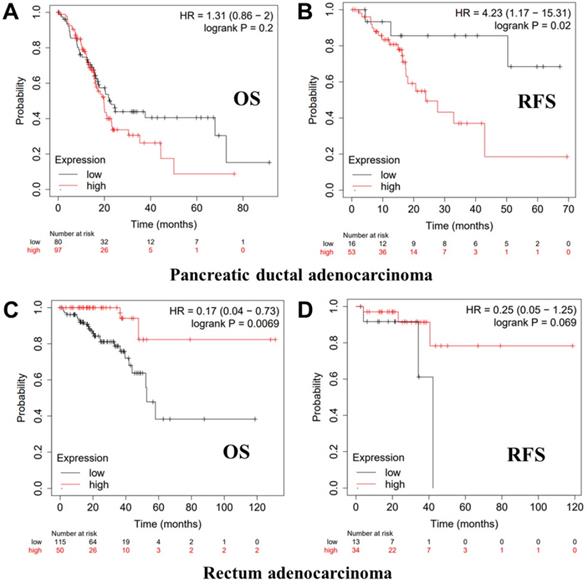
We further employed the Kaplan-Meier plotter database to evaluate the prognostic significance of PTPRO in pancreatic and rectum cancer samples, which are not included in the PrognoScan database. Notably, poor prognosis of pancreatic (OS HR = 1.31, 95% CI = 0.86 to 2.00, P = 0.2; RFS HR = 4.23, 95% CI = 1.17 to 15.31, P = 0.02) correlated with PTPRO overexpression. However, PTPRO expression was linked to a better OS and RFS in rectum cancer. These results suggested that PTPRO upregulation could be an independent risk factor for poor disease outcomes in patients of pancreatic cancer. The results above revealed that PTPRO expression affects the prognosis of specific types of cancer.
Anti-proliferation activity of PTPRO inhibition
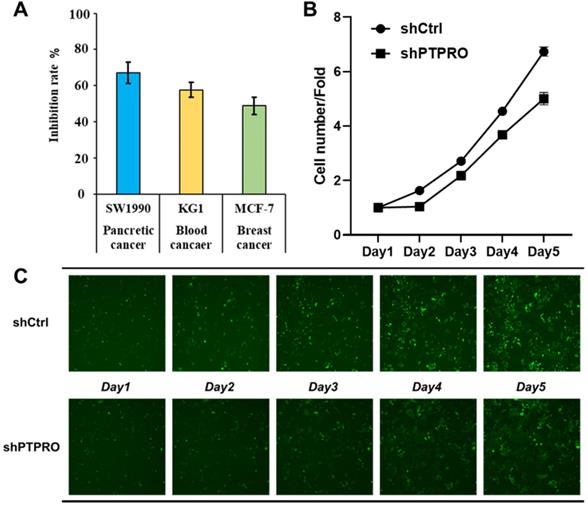
Bioinformatic analysis above suggested the potential oncogenic role of PTPRO in blood, breast, and pancreatic cancers. In our previous work, a selective PTPRO inhibitor GP03 has been identified through structure-based virtual screening (Figure S1 in Supporting Information) [26]. Therefore, we measured the anti-proliferation activities of GP03 against three cancer cell lines using sulforhodamine B assay (SRB) assay, including KG1 cells (blood cancer), MCF-7 cells (breast cancer) and SW1990 cells (pancreatic cancer). As results shown in Figure 4A, GP03 exhibited anti-proliferation activity against three type of cancer cells, of which the anti-proliferation activity on pancreatic cancer cells is the strongest. Moreover, GP03 inhibited the growth of SW1990 cells in a dose-dependent manner (Figure S2 in Supporting Information). To confirm the oncogenic role of PTPRO, we knocked-down the expression of PTPRO in pancreatic cancer cells using lentiviral and measured the cell viability using Celigo and flow cytometry assays, which based on GFP-expressing cancer cells. As expected, knock-down of the expression of PTPRO inhibited growth of pancreatic cancer cell.
(A) The anti-proliferation activities of PTPRO inhibitor GP03 at 50μM against three cancer cell lines. (B) Effects of PTPRO knock-down on proliferation of pancreatic cancer cells. (C) Cell counts using the Celigo system (×100 magnification).
Effects of PTPRO inhibitor on cell apoptosis and cell cycle
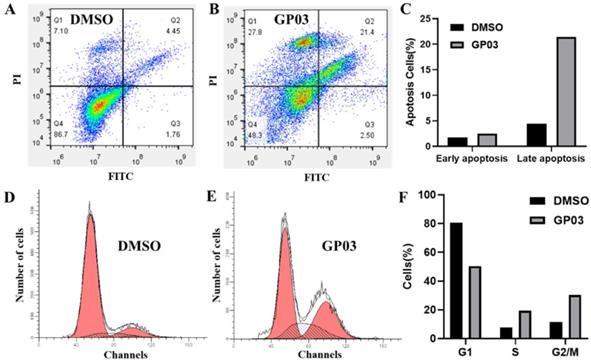
Here, we further evaluated the effects of PTPRO inhibitor GP03 on cell apoptosis as well as cell cycle of pancreatic cancer cells. We conducted the Annexin V-FITC/PI assay to determine the apoptotic induction effect of GP03. According to the results, compound GP03 effectively induced apoptosis of pancreatic cancer cells, compared with DMSO control (Figure 5A-C). Furthermore, cell cycle distribution of pancreatic cancer cells was evaluated following DMSO and GP03 treatment. Based on the results, the progression of cell cycle was blocked at the G2 and S stages 24 hours following compound GP03 treatment (Figure 5D-F).
(A-C) Apoptosis induction of pancreatic cancer cells by DMSO and PTPRO inhibitor GP03 at 100 μM. (D-F) Cell cycle distribution of pancreatic cancer cells treated with DMSO and PTPRO inhibitor GP03 at 100 μM.
Correlation of PTPRO expression with clinical prognosis and immune cell enrichment levels
Kaplan-Meier plotter database was employed to examine the link between PTPRO expression and clinical features, as well as immune cell enrichment levels of pancreatic cancer patients. As result shown in Table 1, high levels of PTPRO mRNA was significantly related to worse OS in grade 1 pancreatic cancer patients (P <0.001). Moreover, upregulation of PTPRO was related to worse PFS in male patients (P = 0.02), grade 2 patients (P = 0.027) and patient with high mutation burden (P = 0.004).
Correlation of PTPRO mRNA expression and clinical prognosis in pancreatic cancer with different clinicopathological factors by Kaplan-Meier plotter database
| Clinicopathological characteristics | OS (n=177) | PFS (n=69) | ||||
|---|---|---|---|---|---|---|
| N | Hazard ratio | P-value | N | Hazard ratio | P-value | |
| Sex | ||||||
| Female | 80 | 1.67(0.89-3.16) | 0.11 | 32 | 1.91(0.5-7.23) | 0.34 |
| Male | 97 | 0.72(0.37-1.39) | 0.32 | 37 | NA | 0.02` |
| Stage | ||||||
| 1 | 21 | NA | 0.097 | NA | NA | NA |
| 2 | 146 | 0.73(0.45-1.18) | 0.19 | 55 | 2.25(0.86-5.88) | 0.088 |
| 3 | NA | NA | NA | NA | NA | NA |
| 4 | NA | NA | NA | NA | NA | NA |
| Grade | ||||||
| 1 | 31 | 14.68(1.85-116.73) | 0.00099 | NA | NA | NA |
| 2 | 94 | 0.69(0.38-1.26) | 0.23 | 38 | 0.29(0.09-0.93) | 0.027 |
| 3 | 48 | 0.62(0.28-1.37) | 0.23 | NA | NA | NA |
| 4 | NA | NA | NA | NA | NA | NA |
| Mutation burden | ||||||
| High | 84 | 1.66(0.91-3.01) | 0.093 | 29 | 6.58(0.82-52.99) | 0.044 |
| Low | 83 | 1.51(0.71-3.21) | 0.28 | 33 | 3.55(0.43-29.3) | 0.21 |
NA: Data not available because sample number too low for meaningful analysis.
Furthermore, we observed associations of PTPRO expression with worse OS and PFS in patients with enriched CD8+ T-cells level (OS, P = 0.026; PFS, P = 0.008) and decreased macrophages level (OS, P = 0.013; PFS, P = 0.0072). The enrichment levels of B-cells and CD4+ memory T-cells show less impacts on the prognosis values (OS), where high expressions of PTPRO are associated with worse PFS. In addition, overexpression of PTPRO was also linked to worse PFS values in patients with enriched eosinophils level (P = 0.0053) or enriched regulatory T-cells level (P = 0.021) (Table 2). These data indicated that the level of PTPRO expression affect the prognosis of pancreatic cancer patient having specific clinicopathological characteristics and immune cell enrichment levels.
Correlation of PTPRO mRNA expression and clinical prognosis in pancreatic cancer with different levels of immune cell enrichment by Kaplan-Meier plotter database
| Levels of immune cell enrichment | OS (177) | PFS (69) | |||||
|---|---|---|---|---|---|---|---|
| N | Hazard ratio | P-value | N | Hazard ratio | P-value | ||
| Basophils | Enriched | NA | NA | NA | NA | NA | NA |
| Decreased | 164 | 0.75 (0.49-1.14) | 0.18 | 62 | 1.62 (0.64-4.08) | 0.31 | |
| B-cells | Enriched | 59 | 1.63 (0.67-4.02) | 0.28 | 21 | 9.67 (0.93-100.05) | 0.024 |
| Decreased | 118 | 1.32 (0.79-2.19) | 0.28 | 48 | 6.84 (1.5-31.11) | 0.0051 | |
| CD4+ memory T-cells | Enriched | 43 | 0.48 (0.16-1.48) | 0.19 | 20 | NA | 0.011 |
| Decreased | 134 | 1.36 (0.81-2.28) | 0.25 | 49 | 11.01 (1.44-84.19) | 0.0043 | |
| CD8+ T-cells | Enriched | 76 | 2.22 (1.08-4.53) | 0.026 | 35 | NA | 0.008 |
| Decreased | 101 | 1.23 (0.73-2.07) | 0.44 | 34 | 4.39 (0.55-34.84) | 0.13 | |
| Eosinophils | Enriched | 154 | 1.34 (0.79-2.25) | 0.28 | 60 | 6.98 (1.52-32.05) | 0.0053 |
| Decreased | 23 | 0.51 (0.16-1.56) | 0.23 | NA | NA | NA | |
| Macrophages | Enriched | 109 | 1.43 (0.84-2.43 | 0.19 | 46 | 2.1 (0.73-6.01) | 0.16 |
| Decreased | 68 | 2.98 (1.21-7.35) | 0.013 | 23 | 10.91 (1.26-94.76) | 0.0072 | |
| Mesenchymal stem cells | Enriched | 156 | 0.8 (0.49-1.3) | 0.37 | 58 | 1.89 (0.74-4.82) | 0.17 |
| Decreased | 21 | 2.42 (0.53-11.05) | 0.24 | NA | NA | NA | |
| Natural killer T-cells | Enriched | 60 | 2.87 (1.16-7.12) | 0.017 | 21 | 4.29 (0.44-42.16) | 0.18 |
| Decreased | 97 | 1.46 (0.85-2.52) | 0.17 | 48 | 2.3 (0.87-6.1) | 0.086 | |
| Regulatory T-cells | Enriched | 67 | 2.17 (0.91-5.14) | 0.073 | 25 | NA | 0.021 |
| Decreased | 110 | 0.7 (0.41-1.19) | 0.19 | 44 | 5.73 (0.72-45.45) | 0.065 | |
| Type 1 T-helper cells | Enriched | NA | NA | NA | NA | NA | NA |
| Decreased | 165 | 1.27 (0.82-1.95) | 0.28 | 63 | 2.49 (0.78-7.95) | 0.11 | |
| Type 2 T-helper cells | Enriched | 41 | 1.6 (0.75-3.4) | 0.22 | NA | NA | NA |
| Decreased | 146 | 1.6 (0.94-2.73) | 0.079 | 51 | 3.79 (0.82-17.48) | 0.068 | |
NA: Data not available because sample number too low for meaningful analysis.
GSEA analysis revealed pathways associate with PTPRO expression in pancreatic cancers
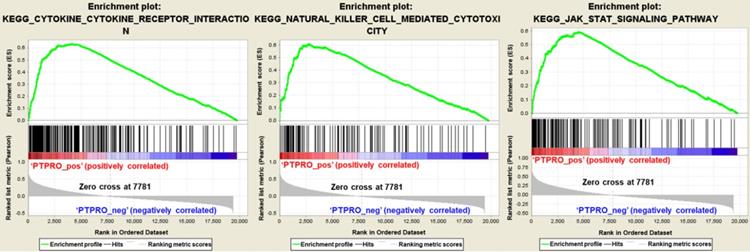
To further elucidate the function of PTPRO in pancreatic cancer, Gene Set Enrichment Analyses (GSEA) we carried out using the TCGA dataset. Single gene GSEA analyses indicate that the high expression of PTPRO was obviously enriched in the expression of gene signatures associated with cytokine-cytokine receptor interaction, natural killer (NK) cell-mediated cytotoxicity, and Jak-STAT signaling pathway. In particular, the Jak-STAT signaling pathway controlling cellular processes including proliferation, differentiation and apoptosis [27, 28], which may explain the anti-cancer activity of PTPRO inhibitor. Furthermore, the GESA result also revealed the potential role of PTPRO in tumor immunology. Cytokines has been used to direct immune effector cells to directly attack and destroy the tumor cells [29]. Pro-inflammatory cytokines have been found to exhibit potent anti-tumour activities in animal models. Evidence show that NK cells quickly kill close by cells that exhibit surface markers related to oncogenic transformation. This activity of NK cells is unique amongst the immune cells. Also, NK cells play their anticancer role by facilitating the responses of antibody and T-cells [30].
PTPRO expression is linked to infiltration level of immune cells in pancreatic cancers
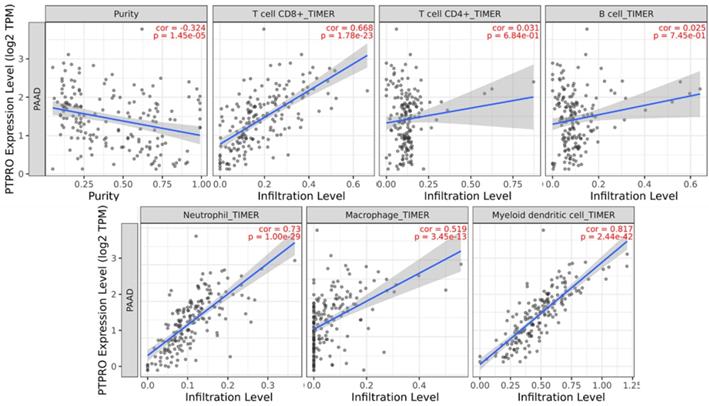
Inspired by the results of analysis above, we speculated that PTPRO expression might be related to infiltration level of immune cells in pancreatic cancers. As such, we used the TIMER to explore this hypothesis. Based on the results, PTPRO expression showed an inverse relationship with tumor purity (r = -0.324, P = 1.45e-05) in pancreatic cancers. Notably, PTPRO expression was positively related to the levels of CD8+ T cell infiltration (r = 0.668, P = 1.78e-23), neutrophils (r = 0.73, P = 1.00e-29), macrophages (r = 0.519, P = 3.45e-13) and dendritic cells (r = 0.817, P = 2.44e-42) in pancreatic cancers. The CD8+ T cells are preferred immune cells for cancer immunotherapy with the ability to detect and eradicate cancer cells [31]. Neutrophils and macrophages can be divided into different subsets and possess either antitumorigenic or protumorigenic functions [32, 33]. Dendritic cells initiate and regulate adaptive immune responses, thereby harness the ability of the immune system to recognize and eliminate cancer [34]. On the other hand, the expression of PTPRO indicated a weak correlation with CD4+ T cells (r = 0.031, P = 6.84e-01) and B cells (r = 0.025, P = 7.45e-01) in pancreatic cancers. These data indicated that PTPRO could play a precise function in infiltration of immune cells (specifically, neutrophils and dendritic cells) with regards to pancreatic cancers.
Gene set enrichment analysis in pancreatic cancer (PAAD) based on the Kyoto Encyclopedia of Genes and Genomes (KEGG) pathways. PAAD samples were correlated positively with gene signatures that are linked to cytokine-cytokine receptor interaction, natural killer cell mediated cytotoxicity, and Jak-STAT signaling pathway.
PTPRO expression versus immune infiltration level in PAAD (pancreatic adenocarcinoma).
Discussion
In this manuscript, we systematically investigated the differential expression of PTPRO as well as its prognosis values in different human cancers. Bioinformatic analysis revealed the potential oncogenic role of PTPRO in several cancer type, especially pancreatic cancer. Upregulation of PTPRO is related to a poorer prognosis in PAAD. Thereafter, in vitro tests proved that inhibition of PTPRO effected the growth of pancreatic cancer cells. Moreover, small molecular PTPRO inhibitor GP03 not only induced cell apoptosis of pancreatic cancer cells, but also inhibited cell cycle progression in G2 and S phase. Further GSEA analysis revealed several signaling pathways associate with PTPRO expression, which helps to understand the underlying carcinogenic functions of PTPRO in pancreatic cancer. Specially, the two most relevant pathways play vital roles in tumor immunology. In addition, the expression of PTPRO exhibited strong relevance with tumor-infiltrating immune cells, which suggested the potential role of PTPRO in anti-tumor immunity. Taken together, our findings indicated that inhibition of PTPRO may serve as a new strategy for the treatment of pancreatic cancer.
Supplementary Material
Supplementary figures and tables.
Acknowledgements
This research was funded by the National Natural Science Foundation of China (82003590), China-Australia Centre for Health Sciences Research (CACHSR no. 2019GJ07), and Research Funds of Shandong Academy of Medical Science for Young Scholar (Grant No. 2018-32).
Authors' Contributions
Jintong Du and Hao Fang conceived and designed the project; Xuben Hou performed experiments. Xuben Hou, Jintong Du, and Hao Fang wrote the manuscript.
Competing Interests
The authors have declared that no competing interest exists.
References
1. Hale AJ, Ter Steege E, den Hertog J. Recent advances in understanding the role of protein-tyrosine phosphatases in development and disease. Dev Biol. 2017;428:283-92
2. Stanford SM, Bottini N. Targeting Tyrosine Phosphatases: Time to End the Stigma. Trends Pharmacol Sci. 2017;38:524-40
3. Yu ZH, Zhang ZY. Regulatory Mechanisms and Novel Therapeutic Targeting Strategies for Protein Tyrosine Phosphatases. Chem Rev. 2018;118:1069-91
4. Bollu LR, Mazumdar A, Savage MI. et al. Molecular Pathways: Targeting Protein Tyrosine Phosphatases in Cancer. Clin Cancer Res. 2017;23:2136-42
5. Elson A. Stepping out of the shadows: Oncogenic and tumor-promoting protein tyrosine phosphatases. Int J Biochem Cell Biol. 2018;96:135-47
6. Frankson R, Yu ZH, Bai Y. et al. Therapeutic Targeting of Oncogenic Tyrosine Phosphatases. Cancer Res. 2017;77:5701-05
7. Zhang J, Zhang F, Niu R. Functions of Shp2 in cancer. J Cell Mol Med. 2015;19:2075-83
8. Hardy S, Kostantin E, Hatzihristidis T. et al. Physiological and oncogenic roles of the PRL phosphatases. FEBS J. 2018;285:3886-908
9. Zhang C, Qu L, Lian S. et al. PRL-3 Promotes Ubiquitination and Degradation of AURKA and Colorectal Cancer Progression via Dephosphorylation of FZR1. Cancer Res. 2019;79:928-40
10. Kostantin E, Hardy S, Valinsky WC. et al. Inhibition of PRL-2.CNNM3 Protein Complex Formation Decreases Breast Cancer Proliferation and Tumor Growth. J Biol Chem. 2016;291:10716-25
11. Gimenez-Mascarell P, Oyenarte I, Hardy S. et al. Structural Basis of the Oncogenic Interaction of Phosphatase PRL-1 with the Magnesium Transporter CNNM2. J Biol Chem. 2017;292:786-801
12. Chen YNP, LaMarche MJ, Chan HM. et al. Allosteric inhibition of SHP2 phosphatase inhibits cancers driven by receptor tyrosine kinases. Nature. 2016;535:148 -+
13. Kang MM, Shan SL, Wen XY. et al. Tumor-Suppression Mechanisms of Protein Tyrosine Phosphatase O and Clinical Applications. Asian Pac J Cancer Prev. 2015;16:6215-23
14. Motiwala T, Kutay H, Ghoshal K. et al. Protein tyrosine phosphatase receptor-type O (PTPRO) exhibits characteristics of a candidate tumor suppressor in human lung cancer. Proc Natl Acad Sci U S A. 2004;101:13844-9
15. Li SY, Li R, Chen YL. et al. Aberrant PTPRO methylation in tumor tissues as a potential biomarker that predicts clinical outcomes in breast cancer patients. BMC Genetics. 2014 15
16. Dong H, Ma L, Gan J. et al. PTPRO represses ERBB2-driven breast oncogenesis by dephosphorylation and endosomal internalization of ERBB2. Oncogene. 2017;36:410-22
17. Hsu SH, Motiwala T, Roy S. et al. Methylation of the PTPRO gene in human hepatocellular carcinoma and identification of VCP as its substrate. J Cell Biochem. 2013;114:1810-18
18. Motiwala T, Majumder S, Kutay H. et al. Methylation and silencing of protein tyrosine phosphatase receptor type O in chronic lymphocytic leukemia. Clin Cancer Res. 2007;13:3174-81
19. Mizuno H, Kitada K, Nakai K. et al. PrognoScan: a new database for meta-analysis of the prognostic value of genes. BMC Med Genomics. 2009;2:18
20. Rhodes DR, Kalyana-Sundaram S, Mahavisno V, et al. Oncomine 3.0: genes, pathways, and networks in a collection of 18,000 cancer gene expression profiles, Neoplasia. 2007; 9: 166-80
21. Nagy A, Lanczky A, Menyhart O. et al. Validation of miRNA prognostic power in hepatocellular carcinoma using expression data of independent datasets. Sci Rep. 2018;8:9227
22. Subramanian A, Tamayo P, Mootha VK. et al. Gene set enrichment analysis: a knowledge-based approach for interpreting genome-wide expression profiles. Proc Natl Acad Sci U S A. 2005;102:15545-50
23. Li T, Fu J, Zeng Z. et al. TIMER2.0 for analysis of tumor-infiltrating immune cells. Nucleic Acids Res. 2020;48:W509-W14
24. Pan JH, Zhou H, Cooper L. et al. LAYN Is a Prognostic Biomarker and Correlated With Immune Infiltrates in Gastric and Colon Cancers. Front Immunol. 2019 10
25. Tang Z, Li C, Kang B. et al. GEPIA: a web server for cancer and normal gene expression profiling and interactive analyses. Nucleic Acids Res. 2017;45:W98-W102
26. Hou X, Rooklin D, Yang D. et al. Computational Strategy for Bound State Structure Prediction in Structure-Based Virtual Screening: A Case Study of Protein Tyrosine Phosphatase Receptor Type O Inhibitors. J Chem Inf Model. 2018;58:2331-42
27. Owen KL, Brockwell NK, Parker BS. JAK-STAT Signaling: A Double-Edged Sword of Immune Regulation and Cancer Progression. Cancers (Basel). 2019 11
28. Pencik J, Pham HT, Schmoellerl J. et al. JAK-STAT signaling in cancer: From cytokines to non-coding genome. Cytokine. 2016;87:26-36
29. Lee M, Rhee I. Cytokine Signaling in Tumor Progression. Immune Netw. 2017;17:214-27
30. Shimasaki N, Jain A, Campana D. NK cells for cancer immunotherapy. Nat Rev Drug Discov. 2020;19:200-18
31. van der Leun AM, Thommen DS, Schumacher TN. CD8(+) T cell states in human cancer: insights from single-cell analysis. Nat Rev Cancer. 2020;20:218-32
32. Hedrick CC, Malanchi I. Neutrophils in cancer: heterogeneous and multifaceted. Nat Rev Immunol. 2021
33. Najafi M, Hashemi Goradel N, Farhood B. et al. Macrophage polarity in cancer: A review. J Cell Biochem. 2019;120:2756-65
34. Gardner A, Ruffell B. Dendritic Cells and Cancer Immunity. Trends Immunol. 2016;37:855-65
Author contact
![]() Corresponding authors: E-mail: haofangcnedu.cn; jintongducom.
Corresponding authors: E-mail: haofangcnedu.cn; jintongducom.