Impact Factor ISSN: 1837-9664

 Global reach, higher impact
J Cancer 2022; 13(8):2490-2503. doi:10.7150/jca.69274 This issue Cite
Research Paper
New Clues to Prognostic Biomarkers of Four Hematological Malignancies
Samson Pandam Salifu1,2 ![]() , Albert Doughan1
, Albert Doughan1
1. Department of Biochemistry and Biotechnology, Kwame Nkrumah University of Science and Technology (KNUST), Kumasi, Ghana.
2. Kumasi Centre for Collaborative Research in Tropical Medicine (KCCR), Kumasi, Ghana.
Received 2021-11-20; Accepted 2022-3-6; Published 2022-5-9
Abstract

Globally, one out of every two reported cases of hematologic malignancies (HMs) results in death. Each year approximately 1.24 million cases of HMs are recorded, of which 58% become fatal. Early detection remains critical in the management and treatment of HMs. However, this is thwarted by the inadequate number of reliable biomarkers. In this study, we mined public databases for RNA-seq data on four common HMs intending to identify novel biomarkers that could serve as HM management and treatment targets. A standard RNA-seq analysis pipeline was strictly adhered to in identifying differentially expressed genes (DEGs) with DESeq2, limma+voom and edgeR. We further performed gene enrichment analysis, protein-protein interaction (PPI) network analysis, survival analysis and tumor immune infiltration level detection on the genes using G:Profiler, Cytoscape and STRING, GEPIA tool and TIMER, respectively. A total of 2,136 highly-ranked DEGs were identified in HM vs. non-HM samples. Gene ontology and pathway enrichment analyses revealed the DEGs to be mainly enriched in steroid biosynthesis (5.075×10⁻⁴), cholesterol biosynthesis (2.525×10⁻⁸), protein binding (3.308×10⁻¹⁸), catalytic activity (2.158×10⁻¹⁰) and biogenesis (5.929×10⁻⁸). The PPI network resulted in 60 hub genes which were verified with data from TCGA, MET500, CPTAC and GTEx projects. Survival analyses with clinical data from TCGA showed that high expression of SRSF1, SRSF6, UBE2Z and PCF11, and low expression of HECW2 were correlated with poor prognosis in HMs. In summary, our study unraveled essential genes that could serve as potential biomarkers for prognosis and may serve as drug targets for HM management.
Keywords: Hematologic malignancies, Hub genes, RNA-seq, Lymphoma, Biomarker
Background
Hematological malignancies (HMs) present a global health burden worsened by a lack of precise diagnostic, treatment and prognostic biomarkers. An estimated 1.24 million cases of HMs are diagnosed yearly across the globe, accounting for about 6% of all cancer cases [1]. As of 2020, HMs case fatality rate stood at 58% and culminated in approximately 7% of all cancer deaths worldwide [1]. This is an improvement to the statistics recorded in 2017, where HMs constituted 8.6% of all cancer cases and 11.5% of all cancer deaths worldwide [2]. However, there was no corresponding reduction in the case-fatality rate from 2017 (52%) to 2010 (58%). Al-Azri [3] attributed the overall poor survival of HM patients to late diagnosis.
Recent advances in cancer therapies such as immunotherapy, stem cell transplantation, gene therapy and chemotherapy have improved HM cancers treatment. However, early detection continues to be a challenge. For screening and identification of HMs, ranges of assays are available such as blood tests, imaging (CT, X-ray or PET scans) tests and bone marrow biopsies. However, each of these methods has its drawbacks, including (1) false negative or positive results, (2) overdiagnosis of cases that could lead to unnecessary treatment and psychological stress [4] and (3) exertion of unnecessary worry and risk on a patient who may not have HM. For these reasons, it is critical to discover novel diagnostic and prognostic biomarkers that will be effective in HM diagnosis.
Liquid biopsies have recently supplanted traditional tissues biopsies as the preferred choice of diagnosis of HMs [5, 6]. It provides a less painful, less invasive and increases the testing rate of HMs. Unfortunately, liquid biopsies can only detect circulating tumor cells (CTCs) and cell-free DNA (cfDNA), which may be present in low concentrations in the patient's blood and the tests may not be sensitive enough to detect them [6]. This necessitates the need for more sensitive, accurate and reliable biomarkers for HM diagnosis.
In recent years, the introduction of inhibitors targeting immunological checkpoints such as PD-1/PD-L1 and CTLA-4 has resulted in significant paradigm shifts in treating hematological malignancies [7]. Recent findings indicate that checkpoint inhibition appears to be a promising treatment option for certain types of hematologic malignancies [8]. However, the use of checkpoint inhibitors is accompanied by significant side effects and high costs, and only a small percentage of patients appear to benefit clinically [9]. This highlights the critical need for biomarkers to identify patients more likely to respond to treatment and/or experience fewer adverse effects. To this end, there have been reports on biomarkers that can serve as a diagnostic, prognostic and therapeutic target for HM management. Popular among these include the Cluster of Differentiation 47 (CD47) [10, 11], CD123 [12] and miR-155 [13]. Although several antagonists of CD47, CD123 and miR-155 have been studied in vitro and in vivo with promising results using cell lines and mouse models of hematological malignancy, these studies focused on a specific HM at a time. Our approach leverages this limitation by considering hematological malignancies as a unity in identifying potential biomarkers to diagnosis and prognosis.
Multiple HMs may have similar gene expression profiles that could promote tumor progression [14]. However, these genes have not been fully explored. Analyzing the transcriptomes of multiple HMs simultaneously will be vital in identifying the genes that HMs share in common, which will further enable the elucidation of their common signaling pathways that promote oncogenesis. These could be applied in the development of therapeutics and diagnostics to manage HMs effectively. In the present study, we contributed to the existing pool of HM biomarkers by identifying novel genes unique to HM patients that could serve as potential diagnostic and prognostic targets for HM treatment and management.
Materials and methods
Data sources
In this study, we mined public databases for RNA-seq data on chronic lymphocytic leukemia (CLL), acute myeloid leukemia (AML), acute lymphocytic leukemia (ALL) and Burkitt lymphoma (BL). We settled on four datasets generated by Cocciardi et al. [15] (AML), Black et al. [16] (ALL), Lombardo et al. [17] (BL) and CNAG-CRG [18] (CLL), based on our set inclusion criteria of at least ten samples, data being published within the last five years and cancer diagnosis being performed by at least two experienced oncologists. Table 1 provides a summary of the datasets used in this study. Ten paired-end FASTQ files were downloaded for each HM via NCBI-SRA. As a control group, we used mRNA data on lymphoblastoid cell lines (LCLs) from healthy non-cancer participants of the 1000 Genomes project. Our choice of data and control groups presents an unbiased representation of the various HMs.
Characteristics of the RNA-seq dataset used in this study
| Data accession | Contributors | Organism | Year | Cancer type | Number of samples |
|---|---|---|---|---|---|
| PRJNA594725 | CNAG-CRG [18] | Homo sapiens | 2019 | CLL | 10 |
| PRJNA528267 | Cocciardi et al. [15] | Homo sapiens | 2019 | AML | 10 |
| PRJNA475681 | Black et al. [16] | Homo sapiens | 2018 | ALL | 10 |
| SRP099346 | Lombardo et al. [17] | Homo sapiens | 2017 | BL | 10 |
| ERP001942 | Ouyang et al. [19] | Homo sapiens | 2017 | LCLs | 10 |
Quality control, trimming and mapping
FastQC [20] and MultiQC [21] were used for data quality assessment. Low-quality bases and adapter sequences were trimmed with Trimmomatic [22]. Trimmomatic was also used to filter out reads, which were shorter than 20 bases pairs. Furthermore, the trimmed reads were aligned to the human reference genome (GRCh38) using the 2-pass mode of STAR aligner [23] under default parameters. Gene quantification was performed with featureCounts [24], with gene_id and gene_biotype attributes. A description of the tools used in this study has been provided in Table 2.
Characteristics of all tools used before differential expression analysis in R
| Tool | Version | Function | Reference |
|---|---|---|---|
| FastQC | 0.11.9 | Quality checks | Andrews [20] |
| MultiQC | 1.10 | Summarization | Ewels et al. [21] |
| Trimmomatic | 0.39 | Trimming | Bolger et al. [22] |
| STAR | 2.7.7a | Splice-aware alignment | Dobin et al. [23] |
| featureCounts | 1.6.3 | Gene quantification | Liao et al. [24] |
Differential expression analysis (DEA)
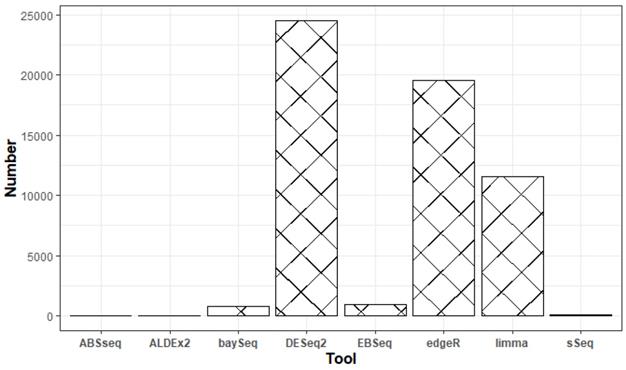
We surveyed eight popular tools (ABSseq, ALDEx2, DESeq2, baySeq, EBSeq, edgeR, limma+voom and sSeq) used for differential expression analysis. Based on the total number of downloads and Google scholar citations (Figure 1), we settled on DESeq2, edgeR and limma+voom. We surmise that both the number of downloads and citations are commensurate to usage. Additionally, according to the tool's manual, all analyses were performed using default parameters following a step-by-step approach. Table 3 briefly describes the DEA tools used in this study.
Google scholar citations for the respective DEA tools between January 2013 and March 2021.
Characteristics of the tools used for differential expression analysis
| DEA tool | Version | Read count distribution | Normalization approach | Differential expression test | Citation |
|---|---|---|---|---|---|
| DESeq2 | 1.28.1 | Negative binomial | size factors | Exact test | Love et al. [25] |
| edgeR | 3.30.3 | Negative binomial | trimmed mean of M-values (TMM) | Exact test | Robinson et al. [26] |
| limma+voom | 3.44.3 | voom transformation of counts | trimmed mean of M-values (TMM) | Empirical Bayes method | Ritchie et al. [27] |
Gene ontology analyses
The overlapping set of genes identified by all the DEA tools were used for gene ontology analysis. The Database for Annotation, Visualization and Integrated Discovery (DAVID) [28] and G:Profiler's g:Gost [29] were used to identify the biological events and pathways for which the identified genes are involved in HMs. Adjusted P values (Padj) less than 0.05 were considered to be statistically significant, and all inferences were drawn from Functional Annotation Clusters with enrichment scores ≥ 1.3. Gene enrichment analysis using multiple databases provided corroborating evidence of the biological processes, molecular functions and biological pathways the genes are involved in HMs.
Protein-protein interaction (PPI) network
Cytoscape [30], an open platform Bioinformatics program to visualize molecular interaction networks was used to visualize the protein-protein interaction (PPI) network of the genes. The STRING plugin [31] in Cytoscape was used to visualize the interactions between the common genes. PPIs with a confidence score of at least 0.9 were considered to be highly significant. Additionally, the Molecular Complex Detection (MCODE) [32] plugin in Cytoscape was used to identify the highly interconnected nodes (most closely associated genes) within the PPI network, which we termed hub genes.
Hub genes expression in tumors
The Gene Expression Profiling Interactive Analysis (GEPIA) [33] online tool was used to analyze the expression of the hub genes in other human cancers. This was achieved through a systematic search across gene expression datasets from The Cancer Genome Atlas (TCGA) and Genotype-Tissue Expression (GTEx) projects.
Hub-gene survival analysis
GEPIA tool was used to perform survival analysis on the hub genes. GEPIA employs data from TCGA and GTEx projects to perform analyses, including patient survival.
Tumor immune infiltration levels
To investigate the association of gene expression patterns with tumor infiltration immune cells (TIIC), the Tumor Immune Estimation Resource (TIMER) web-based tool [34] was employed. Of the seven available TIMER modules (Gene, Survival, Mutation, SCNA, Diff Exp, Correlation, Estimation), we focused on SCNA to compare the tumor infiltration levels among hematologic malignancies with different copy number aberrations for a given gene. SCNA used the two-sided Wilcoxon rank-sum test to perform the analyses.
Gene expression in different races, gender and age groups
Finally, we used the UALCAN web tool to explore the difference in hub gene expression in different age groups, races and gender. UALCAN uses cancer OMICs data from TCGA, MET500 [35] and CPTAC [36] for biomarker identification and validation and explores the epigenetic regulation of gene expression. Table 4 describes all the web-based tools used in this study.
Web-based tools used in the analysis of differentially expressed genes
| Tool | Function | Reference |
|---|---|---|
| DAVID | Gene enrichment analysis | Huang et al. [28] |
| G:profiler | Gene enrichment analysis | Reimand et al. [29] |
| Cytoscape | PPI network | Shannon et al. [30] |
| STRING | PPI network | Szklarczyk et al. [31] |
| GEPIA | Survival analysis | Tang et al. [33] |
| TIMER | Tumor immune infiltration detection | Li et al. [34] |
| UALCAN | Gene expression in different races, gender and age groups | Chandrashekar et al. [37] |
Results
Identification of differentially expressed genes (DEGs)
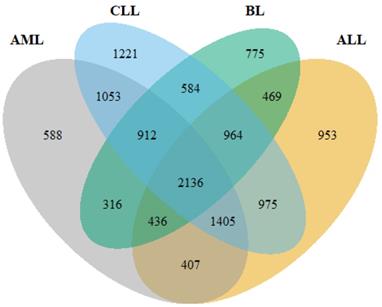
Following pre-processing of the raw data, DEGs were identified using DESeq2, limma+voom and edgeR. Overall, 7745, 9250, 7253 and 6592 DEGs were obtained from ALL, CLL, AML and BL, respectively (Figure 2). The intersect function showed that 2,136 genes were common to all the HMs and served as the primary data for further analyses.
A Venn diagram showing the number of common genes among the four HMs (ALL, AML, CLL and BL).
Gene ontology (GO) analyses
GO and pathway enrichment analyses were performed using G:Profiler and DAVID to investigate the biological function of the shared DEGs. After removing all electronic GO terms, the results showed the DEGs to be significantly implicated in protein binding, catalytic activity and regulation of intracellular signal transduction. The most significant pathways were found to be steroid biosynthesis (Padj = 5.075×10⁻⁴), cholesterol biosynthesis (Padj = 2.525×10⁻⁸) and activation of gene expression by SREBF (Padj = 1.617×10⁻⁴). Table 5 provides a detailed distribution of the top GO terms associated with the DEGs.
Gene and pathway enrichment analysis of the common DEGs
| Term ID | Term description | Number of genes | Padj |
|---|---|---|---|
| Molecular function | |||
| GO:0005515 | Protein binding | 1695 | 3.308×10⁻¹⁸ |
| GO:0003824 | Catalytic activity | 696 | 2.158×10⁻¹⁰ |
| GO:0042802 | Identical protein binding | 289 | 1.395×10⁻⁷ |
| GO:0016740 | Transferase activity | 309 | 1.627×10⁻⁶ |
| GO:0019899 | Enzyme binding | 275 | 1.911×10⁻⁵ |
| Biological process | |||
| GO:0006996 | Organelle organization | 528 | 5.599×10⁻¹⁰ |
| GO:0071840 | Cellular component organization or biogenesis | 782 | 5.929×10⁻⁸ |
| GO:0044237 | Cellular metabolic process | 1222 | 6.526×10⁻⁸ |
| GO:0008152 | Metabolic process | 1299 | 3.326×10⁻⁷ |
| GO:1902531 | Regulation of intracellular signal transduction | 258 | 3.855×10⁻⁷ |
| Cellular component | |||
| GO:0005622 | Intracellular anatomical structure | 1733 | 1.4×10-46 |
| GO:0005737 | Cytoplasm | 1413 | 5.435×10-39 |
| GO:0005829 | Cytosol | 777 | 5.924×10⁻³⁰ |
| GO:0043227 | Membrane-bounded organelle | 1491 | 1.869×10⁻²⁸ |
| GO:0043229 | Intracellular organelle | 1455 | 8.918×10⁻²⁷ |
| KEGG Pathway | |||
| KEGG:00100 | Steroid biosynthesis | 11 | 5.075×10⁻⁴ |
| KEGG:01100 | Metabolic pathways | 226 | 2.443×10⁻³ |
| KEGG:01200 | Carbon metabolism | 30 | 3.282×10⁻³ |
| KEGG:00010 | Glycolysis / Gluconeogenesis | 19 | 2.702×10⁻² |
| KEGG:00620 | Pyruvate metabolism | 15 | 2.999×10⁻² |
| Reactome Pathway | |||
| REAC:R-HSA-1655829 | Cholesterol biosynthesis | 17 | 2.525×10⁻⁸ |
| REAC:R-HSA-191273 | Cell Cycle, Mitotic | 108 | 3.632×10⁻⁶ |
| REAC:R-HSA-69278 | Regulation of cholesterol biosynthesis by SREBP | 23 | 8.498×10⁻⁶ |
| REAC:R-HSA-2426168 | Activation of gene expression by SREBF | 18 | 1.617×10⁻⁴ |
| REAC:R-HSA-5419276 | Mitochondrial translation termination | 28 | 4.817×10⁻⁴ |
| Human phenotype | |||
| HP:0000252 | Microcephaly | 182 | 3.154×10⁻³ |
| HP:0002977 | Aplasia/Hypoplasia involving the central nervous system | 239 | 3.624×10⁻³ |
| HP:0040195 | Decreased head circumference | 182 | 7.637×10⁻³ |
| HP:0004377 | Hematologic neoplasm | 53 | 1.027×10⁻² |
| HP:0011893 | Abnormal leukocyte count | 71 | 1.051×10⁻² |
| HP:0010975 | Abnormal B cell count | 15 | 1.264×10⁻² |
| HP:0001882 | Leukopenia | 49 | 1.407×10⁻² |
| HP:0002846 | Abnormal B cell morphology | 15 | 1.892×10⁻² |
PPI network and module selection
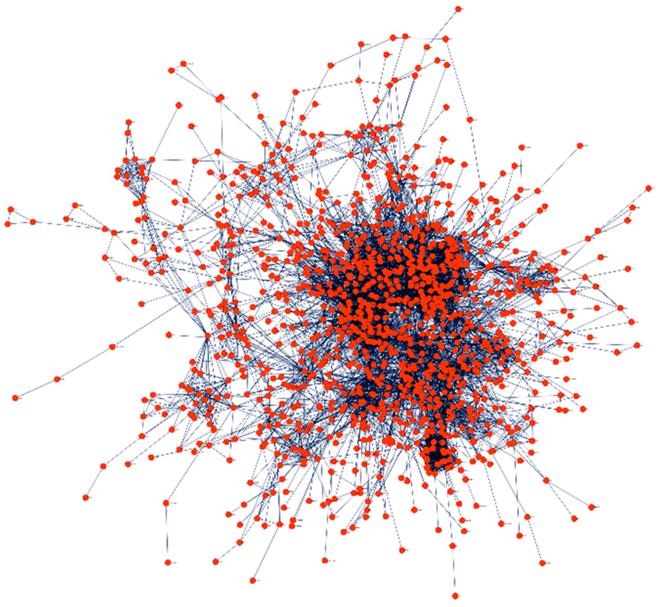
PPI network was created to explore the relationships between proteins to study the molecular process of HMs in a systematic approach (Figure 3). The PPI network was developed using STRING through Cytoscape at a confidence score of > 0.9. Additionally, all singletons (nodes without any association) were excluded from further analyses. We observed that about 96% of the DEGs had a significant association with at least one other gene, confirming the agreement in DEG detection among the various datasets and analysis tools.
Protein-protein interaction network of the shared DEGs using STRING. The nodes and edges represent query DEGs and relationships between the DEGs, respectively.
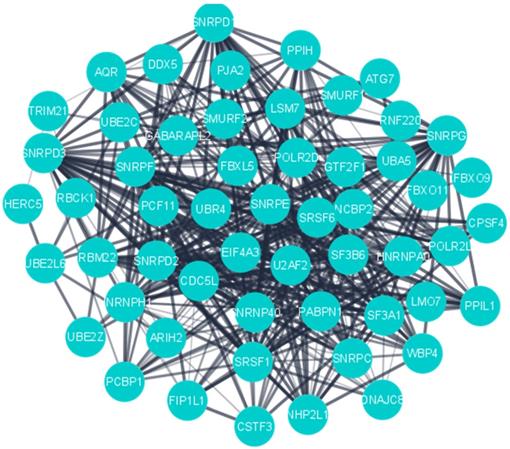
MCODE was used to detect the significant cluster modules present in the PPI network. It predicted 61 clusters and ranked them based on confidence scores (Figure 4). The module with the highest score (29.54) was selected and its genes (60) were used for enrichment analyses, which revealed ubiquitin-protein transferase activity (Padj =3.78×10⁻¹⁶), ubiquitin-like protein transferase activity (Padj = 1.08×10⁻¹⁵), mRNA splicing, via spliceosome (Padj = 8.59×10-36), RNA splicing via transesterification reactions (Padj = 1.13×10⁻³⁵), mRNA processing (Padj = 2.13×10⁻³²) and mRNA metabolic process (Padj = 1.11×10⁻²⁴) to be most significant terms (Supplementary Table S1).
PPI network of the highly interconnected hub genes.
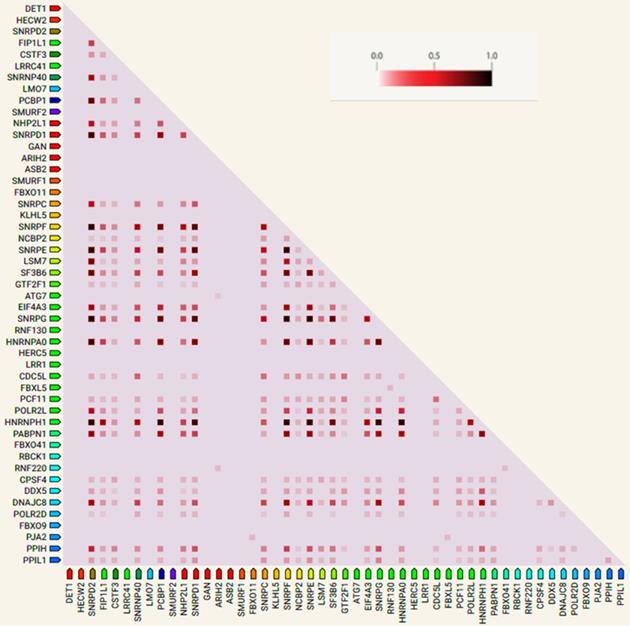
Gene co-expression analysis
STRING was used to perform gene co-expression analysis to infer the interactions between the genes (Figure 5). The confidence scores used to generate the associations were obtained from RNA expression patterns and protein co-expression values from the ProteomeHD database. STRING could accommodate 50 genes out of the 60 hub genes; hence the last ten less significant genes were excluded. From Figure 5, SNRPF, HNRNPH1, PABPN1, SNRPD2, SNRPE and SNRPG positively interact with all the other genes in the cluster.
Co-expression analysis of the top 50 hub genes. Deeper colors depict stronger associations.
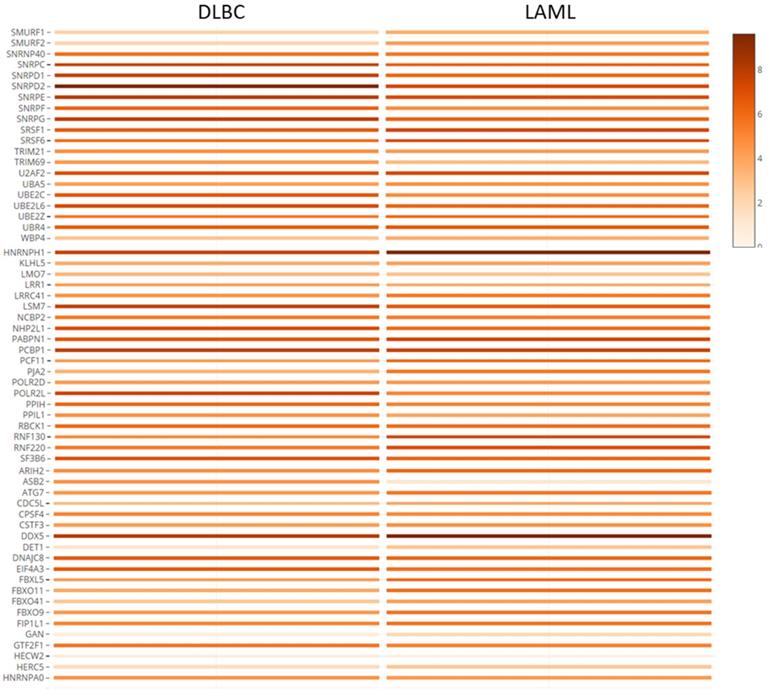
Hub genes expression in hematologic malignancies and other cancers
The hub genes were verified with gene expression datasets from the TCGA and GTEx projects. Using GEPIA online tool, we explored the median expression levels of the hub genes in two hematologic malignancies (diffuse large B cell lymphoma (DLBC) and acute myeloid leukemia (LAML)). From Figure 6, we observed that most of the genes were highly expressed in the HMs under study. Importantly, DDX5, HNRNPH, SNRPD2, PCBP1 and SF3B6 showed very high expression levels in the LAML and DLBC. However, ASB2 and HECW2; DET1, GAN, and HERW2 were expressed minimally in the LAML and DLBC cancers, respectively.
Co-expression analysis and verification of hub genes using TCGA and GTEx datasets. The shaded rectangles represent the median level of expression of a gene in DLBC and LAML. Color intensity is also proportional to expression levels.
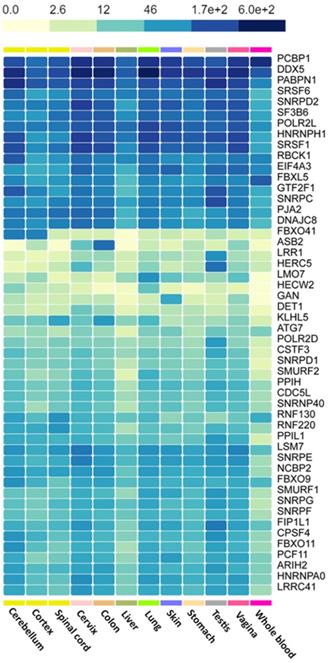
We used the GTEx portal to explore the level of hub gene expression in some tissues of the body (Figure 7). We focused on lymphocytes, blood cells, liver, spleen and brain as these are the organs most affected by hematologic malignancies [38]. As a control group, we generated similar plots using tissues not directly affected by HMs, such as the vagina, cervix, testis and stomach. Comparing the gene expression levels (proportional to color intensity) for each gene, we found that all the highly expressed genes in tissues implicated in HMs are also highly expressed in non-HM-related tissues. However, SRSF1 and SMURF1 showed subtle differences in gene expression levels.
Heatmap of the expression of hub genes across HM-related and non-HM-related GTEx tissues. Color intensity is proportional to gene expression levels.
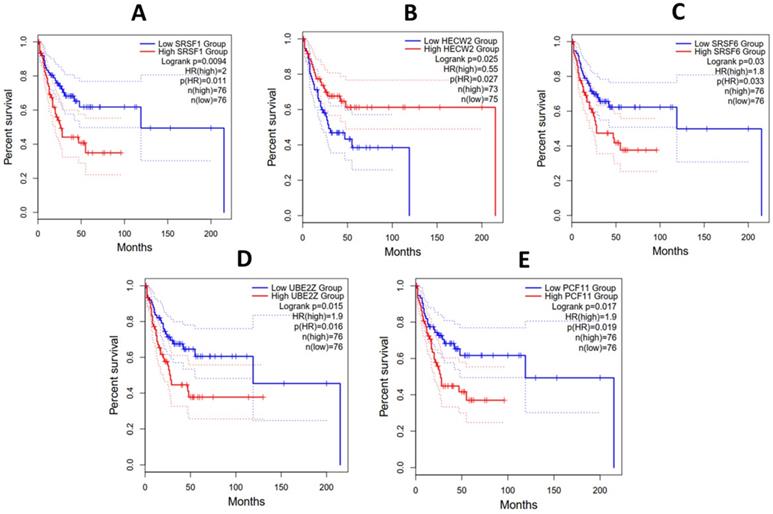
Hub gene survival analysis
The prognostic role of all the hub genes unraveled was investigated using the Kaplan-Meier method. The survival plots were used to measure the length of time it takes an event to occur in different patient groups. Hub genes with associated Padj values greater than or equal to 0.05 were excluded. Figure 8 shows that in DLBC and LAML, high SRSF6, UBE2Z, PCF11 and SRSF1 expression was associated with poor prognosis. Additionally, patients with low expression of HECW2 exhibited a lower survival advantage than those with higher expression levels. While making these extrapolations, we considered the median survival proportions from the y-axis of Figure 8.
Overall survival analysis of (A) SRSF1, (B) HECW2, (C) SRSF6, (D) UBE2Z and (E) PCF11 in patients with Acute Myeloid Leukemia and Diffuse Large B-cell Lymphoma from the TCGA project. The x and y axes represent the survival time in months and survival probability, respectively.
Somatic copy number alterations (SCNA) and Tumor immune infiltration level (TIIL) analysis
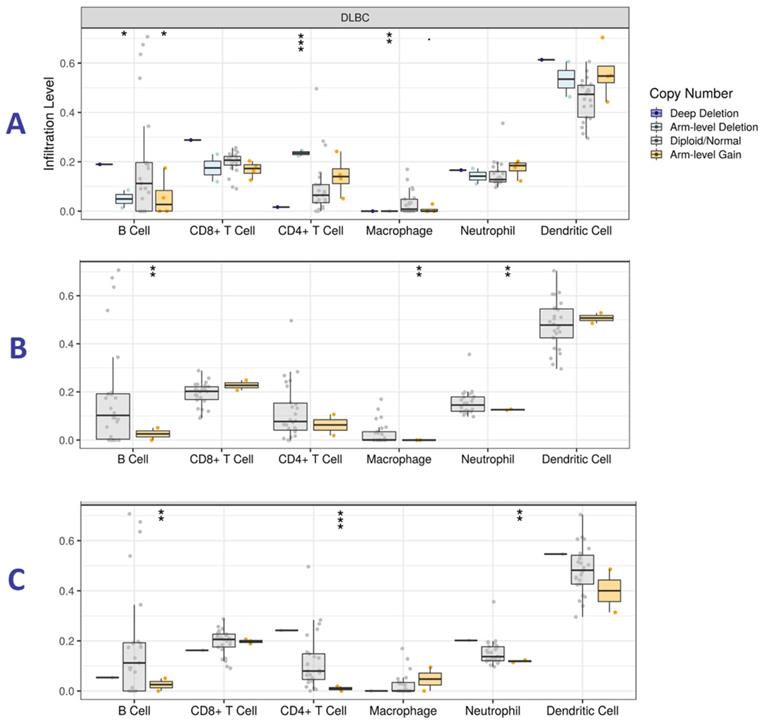
TIMER online tool was used to determine the presence of SCNAs and tumor immune cells (TICs) in HM patients. We focused on DLBCL since it is the only hematologic malignancy available in TIMER. Statistical significance in associations was measured with the two-sided Wilcoxon rank-sum test while analyzing all the hub genes. Here, we report on genes with higher levels of statistical significance in the immune cells under study. High expression of CDC5L, HNRNPH1 and RBCK1 was associated with infiltration by TICs, especially B cells (Figure 9), indicating a possible association between the genes and immune response.
Tumor immune infiltration levels analysis for (A) CDC5L, (B) HNRNPH1 and (C) RBCK1 in Diffuse Large B-cell Lymphoma (DLBC). The y-axis represents infiltration levels. P value definitions: 0 ≤ *** < 0.001 ≤ ** < 0.01 ≤ * < 0.05 ≤. < 0.1.
Gene expression in patients of different age groups, races and gender
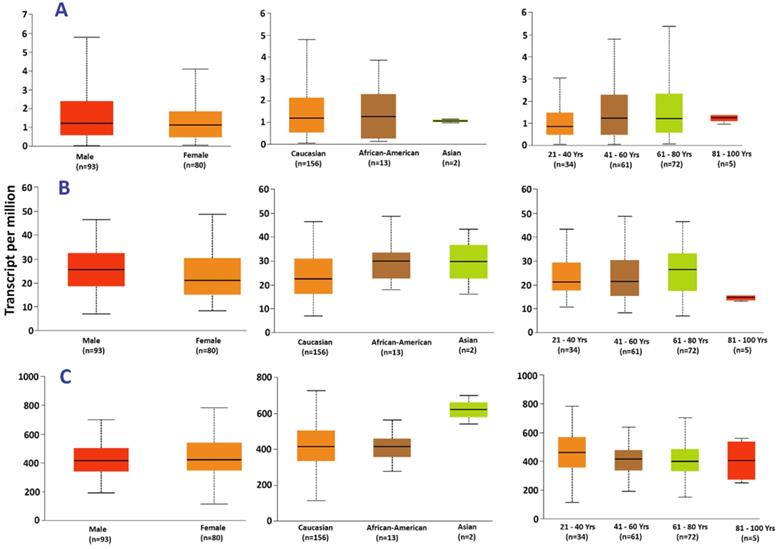
The UALCAN web tool was used to explore the difference in hub gene expression between races, age groups and gender of patients. HNRNPH1 had a significant difference in expression in patients of different races, such as Caucasian vs. Asians (p=2.32×10⁻²) and African/American vs. Asians (p=6.84×10⁻³). However, there was no significant difference in expression between Caucasians and Africans/Americans. Additionally, FBXO41 expression in patients of various age groups showed significant differences in the following pairs: 21-40 vs. 81-100 (p=9.82×10⁻⁴), 41-60 vs. 81-100 (p=5.57×10⁻⁴) and 61-80 vs. 81-100 (p=2.97×10⁻⁴).
Discussion
Hematological malignancies mortality rate remains high and constitutes about 11.5% of all cancer cases worldwide. The poor prognosis could be attributed to a limited understanding of its pathogenesis and other underlying mechanisms of HMs. In the present study, RNA-seq data from four HMs were integrated and analyzed to establish a typical gene expression pattern and other biological mechanisms that could guide the development of novel diagnostics for early detection and treatment to improve the prognosis of HMs.
In total, 2136 genes were differentially expressed between the HMs and non-HM controls. Subsequent gene ontology and pathway enrichment analyses revealed the genes to be enriched in steroid and cholesterol biosynthesis, cell cycle regulation and regulation of SREBF expression. Cholesterol is a precursor to steroid hormones and bile acids, which play critical roles in cell growth and differentiation [39]. In tumorigenesis and cancer progression, cholesterol can modulate signaling pathways by covalently binding to and modifying proteins such as hedgehog and smoothened [40, 41]. These have been observed in colon cancer [42], breast cancer [43] and prostate cancer [44]. SREBF, a master transcription factor, has also been reported to be upregulated in several human cancers, including glioblastoma [45]. Overall, cholesterol metabolism plays a significant role in cancer metastasis, progression, proliferation and differentiation [46, 47]. Investigating these critical pathways could help us better understand how HMs develop and may point to more reliable ways of diagnosis and treatment.
We created a PPI network for systematic analysis to investigate the pathogenesis of HMs. We avoided the introduction of noise and incomplete data that may affect the PPI network by setting the minimum interaction to 0.9 out of a possible 1.0. The resulting PPI network was run through MCODE, which used the connection data to find dense regions within the PPI networks. The network analysis revealed that there were 61 modules in the network, each with an accompanying score. The most closely connected module in the network was the first-rank module, which had a score of 29.54 and contained 60 genes. Studies Xia et al. [48], Yang et al. [49] and Yang et al. [50] on cervical cancer, glioblastoma and head and neck cancer, respectively, showed that modular analyses could be used to isolate related genes accurately and further accentuates the relevance of modular approach in the screening for biomarkers. The genes in the module with the highest scores were the ones that influenced HM occurrence.
Next, we performed hub gene co-expression analysis using STRING to confirm the interactions between the genes. Notably, we found SRSF1, HECW2, SRSF6, UBE2Z and PCF11, to be linked to carcinogenesis and cancer management [51-62] and are associated with poor prognosis in HMs. We also found that a high level of expression of PCF11 is associated with poor prognosis in HM. This is consistent with findings from Ogorodnikov et al. [63], in which low expression of PCF11 was associated with a good prognosis in neuroblastoma. The exact role of PCF11 in cancer development and progressing remains to be determined. However, evidence implicates PCF11 in cancers, including head and neck squamous cell carcinoma [64] and oral squamous cell carcinoma [65].
The PCF11 (Cleavage and Polyadenylation Factor Subunit) gene product is an mRNA 3' end processing complex protein, which plays a crucial role in producing mRNA isoforms with varying 3' untranslated region (UTR) lengths. 3' UTRs shortening is a hallmark of most cancer cells and that ubiquitination of PCF11 through MAGE-A11-HUWE1 ubiquitin ligase promotes 3' UTRs shortening that drives tumorigenesis [66].
Interestingly, we found HECW2 to be downregulated. E3 Ubiquitin-Protein Ligase gene (HECW2) codes for a member of the E3 ubiquitin ligase family and has been demonstrated to play a significant role in angiogenesis, the process by which new capillaries form from pre-existing blood vessels [67]. Many solid tumors, including HMs, require angiogenesis for growth and metastasis. HECW2 stabilizes AMOTL1, a cell-to-cell junction regulator; knockout of HECW2 in endothelial cells increases the rate of vascular permeability and sprouting angiogenesis [67]. Angiogenesis inhibition is a well-established treatment approach for many solid cancers. The anti-angiogenic role of HECW2 could be further explored as a potential therapeutic target.
Ubiquitin Conjugating Enzyme E2 Z (UBE2Z) is involved in the degradation of defective proteins and has been shown to be highly expressed in hepatocellular carcinoma compared to healthy controls and results in poor prognosis [68]. Gene knockout analysis of UBE2Z using siRNA has been found to drastically reduce tumor cell proliferation, migration and invasion [68]. These findings suggest that UBE2Z could be a predictive biomarker for human cancer, including hematological malignancies.
Alternative splicing (AS) is found in nearly every human gene, and aberrant alternative splicing has been associated with cancer [66]. The archetypal member of the serine/arginine-rich protein family, SRSF6, a proto-oncogene, has been identified as a significant regulator of alternative splicing in cancer-associated genes [69]. SRSF6 has been demonstrated to contribute to the regulation of alternative splicing in cervical cancer patients [66]. Studies by Yang et al. [66] revealed that in comparison to control cells, SRSF6 overexpression resulted in significantly increased apoptosis and decreased cell proliferation. Transcriptome analysis also showed that overexpression of SRSF6 in cancer cells induced large-scale changes in transcriptional expression levels and alternative splicing.
Expression of (A) ASB2, (B) FXB041, and (C) HNRNPH1 in acute myeloid leukemia based on patient's gender, race and age.
Additionally, AS genes have been implicated in DNA damage response (DDR) pathways such as double-strand break repair. Yang et al.'s report indicate that SRSF6 can influence cancer growth by activating DDR pathways via AS regulation. These findings add to our understanding of the mechanisms behind SRSF6-mediated gene regulation and points to the possibility of using SRSF6 as a cancer therapeutic target. SRSF6 is also highly expressed in skin cancer [70], pancreatic cancer [71], breast cancer [72] and colorectal cancer [73] and promotes the survival of cancer cells. SRSF6 has also been found to regulate exon skipping, making it highly important in the survival of leukemic cells [74]. Moreover, Moradpoor et al. [75] used SRSF6 to distinguish between metastatic and non-metastatic breast cancer at the time of diagnosis.
SRSF1 also belongs to the arginine/serine splicing factor family of genes, preventing exon skipping, invasion, and senescence and regulating splicing activities [76]. Dong et al. [77] found that downregulation of SRSF1 was associated with reduced apoptosis, proliferation and metastasis in cervical cancer patients. Zhou et al. [76] reported SRSF1 as a major onco-driver in several human cancers, including gastric cancer. Its overexpression has been linked to increased cell proliferation and metastasis of cancer cells, making it a potential candidate for further research as a prognostic biomarker in hematological malignancies. SRSF1 is consistently overexpressed in breast cancer samples and positively correlates with tumor grade and poor prognosis [78]. It also has the potential of increasing the rate of cell proliferation, migration and inhibition of apoptosis. Studies by Lei et al. [79] revealed that SRSF1 promoted tumor cell invasion and metastasis in hepatocellular carcinoma. Additionally, the knockout of SRSF1 in mouse models resulted in the inhibition of tumor cell migration.
To sum up, SRSF1, HECW2, SRSF6, UBE2Z and PCF11 are implicated in the proliferation, apoptosis or metastasis of cancer cells and offer potential research avenues for use as diagnostic and prognostic biomarkers of HM management.
Conclusion
The present study compared HM gene expression patterns to non-HM samples and revealed five genes, SRSF1, HECW2, SRSF6, UBE2Z and PCF11 to be associated with poor prognosis of HMs. The genes are novel and their exact contribution to HMs development and progression is unclear. Further research is needed to understand the precise mechanism by which gene deregulation leads to poor prognosis in HMs. The findings also provide important clues for HMs and could serve as prognostic markers for HM treatment and management.
Abbreviations
HMs: Hematologic malignancies; TCGA: The Cancer Genome Atlas; CPTAC: Clinical Proteomic Tumor Analysis Consortium; GTEx: Genotype-Tissue Expression; RNA-seq: RNA sequencing; DALYs: Disability-adjusted life-years; NHL: Non-Hodgkin's lymphoma; CLL: Chronic lymphocytic leukemia; AML: Acute myeloid leukemia; ALL: Acute lymphocytic leukemia; BL: Burkitt lymphoma; LCLs: lymphoblastoid cell lines; CNAG-CRG: National Center for Genomic Analysis-Centre for Genomic Regulation; DEA: Differential expression analysis; TMM: trimmed mean of M-values; GO: Gene ontology; DAVID: Database for Annotation, Visualization and Integrated Discovery; KEGG: Kyoto Encyclopedia of Genes and Genomes; DEGs: differentially expressed genes; MCODE: Molecular Complex Detection; PPI: Protein-protein interaction network; DLBC: Diffuse Large B-cell Lymphoma; TIMER: Tumor Immune Estimation Resource; GEPIA: Gene Expression Profiling Interactive Analysis; TIIC: tumor infiltration immune cells; SCNAs: somatic copy number alterations; STRING: search tool for retrieval of interacting genes.
Supplementary Material
Supplementary table.
Acknowledgements
Funding
This work is supported by the US National Institutes of Health Common Fund [grant numbers U24HG006941 to Samson Pandam Salifu and 1U2RTW010679 to Samson Pandam Salifu and Albert Doughan]. The content of this publication is solely the responsibility of the authors and does not necessarily represent the official views of the National Institutes of Health. The funding body did not play any roles in the design of the study, collection, analysis, and interpretation of data and in writing the manuscript.
Author Biography
Dr. Samson Pandam Salifu is a Senior Lecturer in Department of Biochemistry and Biotechnology, Faculty of Biosciences, Kwame Nkrumah University of Science and Technology. He is the Coordinator for postgraduate degree programs for Forensic Science, Biodata and Computational Genomics, and a Chair of the Department's Laboratories, Research and Grant Committee. He has special interest in application of genomics to profiling species and for studying diseases in humans. He also has interest in training the next generation of scientists and is currently a Co-PI for West African Sustainable Leadership and Innovation Training in Bioinformatics Research, a collaborative training project with Prof. Ezekiel Adebiyi, Covenant University and Prof. Seydou Doumbia, University of Sciences, Techniques and Technologies of Bamako, funded by Fogarty International Centre for Global Health Training in Bioinformatics Research. Dr. Salifu is also a Co-PI for the H3ABioNet - Human, Health and Heredity Africa Bioinformatics Network, a Pan African Bioinformatics network comprising 32 Bioinformatics research groups distributed amongst 15 African countries and 2 partner Institutions based in the USA to support H3Africa researchers. The current research interest of Dr. Salifu's group includes: (1) Development of novel tools for copy number detection in human genome and for analysis of single cell RNA Seq data; (2) Development of human reference genome for Africa population; (3) Unraveling biomarkers in cancers and (4) Sequencing serious infectious pathogens, metagenonomics and Microbiome of gastric cancers.
Albert Doughan holds a bachelor's degree in Biochemistry from the Kwame Nkrumah University of Science and Technology in Ghana. He is currently a registered master's student under the supervision of Dr. Samson Pandam Salifu. His research is centered on identifying biomarkers that could serve as diagnostic, prognostic and therapeutic targets for cancer management, specifically, hematological malignancies.
Competing Interests
The authors have declared that no competing interest exists.
References
1. Sung H, Ferlay J, Siegel RL, Laversanne M, Soerjomataram I, Jemal A. et al. Global cancer statistics 2020: GLOBOCAN estimates of incidence and mortality worldwide for 36 cancers in 185 countries. CA: A Cancer Journal for Clinicians. 2021;71:209-49
2. Fitzmaurice C, Akinyemiju TF, Al Lami FH, Alam T, Alizadeh-Navaei R, Allen C. et al. Global, regional, and national cancer incidence, mortality, years of life lost, years lived with disability, and disability-adjusted life-years for 29 cancer groups, 1990 to 2016: a systematic analysis for the global burden of disease study. JAMA Oncology. 2018;4:1553-68
3. Al-Azri MH. Delay in cancer diagnosis: causes and possible solutions. Oman Medical Journal. 2016;31:325-326
4. Brodersen J, Schwartz LM, Heneghan C, O'Sullivan JW, Aronson JK, Woloshin S. Overdiagnosis: what it is and what it isn't. Royal Society of Medicine. 2018;23:1-3
5. Heidrich I, Ačkar L, Mossahebi Mohammadi P, Pantel K. Liquid biopsies: Potential and challenges. International Journal of Cancer. 2021;148:528-45
6. Martins I, Ribeiro IP, Jorge J, Gonçalves AC, Sarmento-Ribeiro AB, Melo JB. et al. Liquid biopsies: applications for cancer diagnosis and monitoring. Genes. 2021;12:349-369
7. Wu Q, Jiang L, Li S, He Q, Yang B, Cao J. Small molecule inhibitors targeting the PD-1/PD-L1 signaling pathway. Acta Pharmacologica Sinica. 2021;42:1-9
8. Paver EC, Cooper WA, Colebatch AJ, Ferguson PM, Hill SK, Lum T. et al. Programmed death ligand-1 (PD-L1) as a predictive marker for immunotherapy in solid tumours: A guide to immunohistochemistry implementation and interpretation. Pathology. 2021;53:141-156
9. Atanackovic D, Luetkens T. Biomarkers for checkpoint inhibition in hematologic malignancies. Seminars in Cancer Biology. 2018;52:198-206
10. Sun J, Chen A, Lubben B, Adebayo O, Muz B, Azab AK. CD47-targeting antibodies as a novel therapeutic strategy in hematologic malignancies. Leukemia Research Reports. 2021;16:1-8
11. Eladl E, Tremblay-LeMay R, Rastgoo N, Musani R, Chen W, Liu A. et al. Role of CD47 in hematological malignancies. Journal of Hematology Oncology. 2020;13:1-14
12. Testa U, Pelosi E, Castelli G. CD123 as a therapeutic target in the treatment of hematological malignancies. Cancers. 2019;11:1-13
13. Witten L, Slack FJ. miR-155 as a novel clinical target for hematological malignancies. Carcinogenesis. 2020;41:2-7
14. Xue JM, Liu Y, Wan LH, Zhu YX. Comprehensive analysis of differential gene expression to identify common gene signatures in multiple cancers. Medical Science Monitor. 2020;26:e919953-1
15. Cocciardi S, Dolnik A, Kapp-Schwoerer S, Rücker FG, Lux S, Blätte TJ. et al. Clonal evolution patterns in acute myeloid leukemia with NPM1 mutation. Nature Communications. 2019;10:1-11
16. Black KL, Naqvi AS, Asnani M, Hayer KE, Yang SY, Gillespie E. et al. Aberrant splicing in B-cell acute lymphoblastic leukemia. Nucleic Acids Research. 2018;46:11357-69
17. Lombardo KA, Coffey DG, Morales AJ, Carlson CS, Towlerton AM, Gerdts SE. et al. High-throughput sequencing of the B-cell receptor in African Burkitt lymphoma reveals clues to pathogenesis. Blood Advances. 2017;1:535-44
18. CNAG-CRG consortium, Riches JC, Davies JK, McClanahan F. et al. T cells from CLL patients exhibit features of T-cell exhaustion but retain capacity for cytokine production. Blood. 2013;121:1612-1621
19. Ouyang Z, Ren C, Liu F, An G, Bo X, Shu W. The landscape of the A-to-I RNA editome from 462 human genomes. Scientific Reports. 2018;8:1-13
20. Andrews S. (2010). FASTQC. A quality control tool for high throughput sequence data.
21. Ewels P, Magnusson M, Lundin S, Käller M. MultiQC: summarize analysis results for multiple tools and samples in a single report. Bioinformatics. 2016;32:3047-8
22. Bolger AM, Lohse M, Usadel B. Trimmomatic: A flexible trimmer for Illumina sequence data. Bioinformatics. 2014;30:2114-20
23. Dobin A, Davis CA, Schlesinger F, Drenkow J, Zaleski C, Jha S. et al. STAR: Ultrafast universal RNA-seq aligner. Bioinformatics. 2013;29:15-21
24. Liao Y, Smyth GK, Shi W. featureCounts: An efficient general-purpose read summarization program. Bioinformatics. 2014;30:923-30
25. Love MI, Huber W, Anders S. Moderated estimation of fold change and dispersion for RNA-seq data with DESeq2. Genome Biology. 2014;15:550-571
26. Robinson MD, McCarthy DJ, Smyth GK. edgeR: A Bioconductor package for differential expression analysis of digital gene expression data. Bioinformatics. 2010;26:139-40
27. Ritchie ME, Phipson B, Wu D, Hu Y, Law CW, Shi W. et al. limma powers differential expression analyses for RNA-sequencing and microarray studies. Nucleic Acids Research. 2015;43:e47
28. Huang W, Brad TS, Stephens R, Baseler MW, Lane HC, Lempicki RA. DAVID gene ID conversion tool. Bioinformation. 2008;2:428-30
29. Reimand J, Kull M, Peterson H, Hansen J, Vilo J. g:Profiler—A web-based toolset for functional profiling of gene lists from large-scale experiments. Nucleic Acids Research. 2007;35:W193-W200
30. Shannon P, Markiel A, Ozier O, Baliga NS, Wang JT, Ramage D. et al. Cytoscape: A software environment for integrated models of biomolecular interaction networks. Genome Research. 2003;13:2498-504
31. Szklarczyk D, Gable AL, Lyon D, Junge A, Wyder S, Huerta-Cepas J. et al. STRING v11: Protein-protein association networks with increased coverage, supporting functional discovery in genome-wide experimental datasets. Nucleic Acids Research. 2019;47:D607-D13
32. Bader GD, Hogue CW. An automated method for finding molecular complexes in large protein interaction networks. BMC Bioinformatics. 2003;4:1-27
33. Tang Z, Li C, Kang B, Gao G, Li C, Zhang Z. GEPIA: A web server for cancer and normal gene expression profiling and interactive analyses. Nucleic Acids Research. 2017;45:W98-W102
34. Li T, Wang B, Traugh N, Chen Q, Liu JS, Li B. et al. TIMER: A web server for comprehensive analysis of tumor-infiltrating immune cells. Cancer Research. 2017;77:e108-e10
35. Robinson DR, Wu YM, Lonigro RJ, Vats P, Cobain E, Everett J. et al. Integrative clinical genomics of metastatic cancer. Nature. 2017;548:297-303
36. Edwards NJ, Oberti M, Thangudu RR, Cai S, McGarvey PB, Jacob S. et al. The CPTAC data portal: A resource for cancer proteomics research. Journal of Proteome Research. 2015;14:2707-13
37. Chandrashekar DS, Bashel B, Balasubramanya SAH, Creighton CJ, Ponce-Rodriguez I, Chakravarthi BV. et al. UALCAN: A portal for facilitating tumor subgroup gene expression and survival analyses. Neoplasia. 2017;19:649-58
38. Deshantri AK, Moreira AV, Ecker V, Mandhane SN, Schiffelers RM, Buchner M. et al. Nanomedicines for the treatment of hematological malignancies. Journal of Controlled Release. 2018;287:194-215
39. Huang B, Song B, Xu C. Cholesterol metabolism in cancer: mechanisms and therapeutic opportunities. Nature Metabolism. 2020;2:132-41
40. Porter JA, Young KE, Beachy PA. Cholesterol modification of hedgehog signaling proteins in animal development. Science. 1996;274:255-9
41. Xiao X, Tang JJ, Peng C, Wang Y, Fu L, Qiu ZP. et al. Cholesterol modification of smoothened is required for hedgehog signaling. Molecular Cell. 2017;66:154-62
42. Degirolamo C, Modica S, Palasciano G, Moschetta A. Bile acids and colon cancer: Solving the puzzle with nuclear receptors. Trends in Molecular Medicine. 2011;17:564-72
43. Finlay-Schultz J, Sartorius CA. Steroid hormones, steroid receptors, and breast cancer stem cells. Journal of Mammary Gland Biology Neoplasia. 2015;20:39-50
44. Attard G, Cooper CS, de Bono JS. Steroid hormone receptors in prostate cancer: A hard habit to break? Cancer Cell. 2009;16:458-62
45. Lewis C, Brault C, Peck B, Bensaad K, Griffiths B, Mitter R. et al. SREBP maintains lipid biosynthesis and viability of cancer cells under lipid-and oxygen-deprived conditions and defines a gene signature associated with poor survival in glioblastoma multiforme. Oncogene. 2015;34:5128-40
46. Chimento A, Casaburi I, Avena P, Trotta F, De Luca A, Rago V. et al. Cholesterol and its metabolites in tumor growth: Therapeutic potential of statins in cancer treatment. Frontiers in Endocrinology. 2019;9:1-14
47. Ding X, Zhang W, Li S, Yang H. The role of cholesterol metabolism in cancer. American Journal of Cancer Research. 2019;9:219-227
48. Xia L, Su X, Shen J, Meng Q, Yan J, Zhang C. et al. ANLN functions as a key candidate gene in cervical cancer as determined by integrated bioinformatic analysis. Cancer Management Research. 2018;10:663-670
49. Yang Q, Wang R, Wei B, Peng C, Wang L, Hu G. et al. Candidate biomarkers and molecular mechanism investigation for glioblastoma multiforme utilizing WGCNA. BioMed Research International. 2018 4246703: 1-10
50. Yang B, Chen Z, Huang Y, Han G, Li W. Identification of potential biomarkers and analysis of prognostic values in head and neck squamous cell carcinoma by bioinformatics analysis. OncoTargets Therapy. 2017;10:2315-2321
51. Liu J, Chen Y, Huang Q, Liu W, Ji X, Hu F. et al. IRAK2 counterbalances oncogenic Smurf1 in colon cancer cells by dictating ER stress. Cellular Signalling. 2018;48:69-80
52. Yang H, Yu N, Xu J, Ding X, Deng W, Wu G. et al. SMURF1 facilitates estrogen receptor ɑ signaling in breast cancer cells. Journal of Experimental Clinical Cancer Research. 2018;37:1-12
53. Jiang M, Shi L, Yang C, Ge Y, Lin L, Fan H. et al. miR-1254 inhibits cell proliferation, migration, and invasion by down-regulating Smurf1 in gastric cancer. Cell Death Disease. 2019;10:1-16
54. Li T, Xing Y, Yang F, Sun Y, Zhang S, Wang Q. et al. LncRNA SNHG3 sponges miR-577 to up-regulate SMURF1 expression in prostate cancer. Cancer Medicine. 2020;9:3852-62
55. Sheng J, Zhao Q, Zhao J, Zhang W, Sun Y, Qin P. et al. SRSF1 modulates PTPMT1 alternative splicing to regulate lung cancer cell radioresistance. EBioMedicine. 2018;38:113-26
56. Sheng J, Zhao J, Xu Q, Wang L, Zhang W, Zhang Y. Bioinformatics analysis of SRSF1-controlled gene networks in colorectal cancer. Oncology Letters. 2017;14:5393-9
57. Wang J, Liu T, Wang M, Lv W, Wang Y, Jia Y. et al. SRSF1-dependent alternative splicing attenuates BIN1 expression in non-small cell lung cancer. Journal of Cellular Biochemistry. 2020;121:946-53
58. Deng YY, Wu W, Zhang PA. Aberrant Expression Notch1 and Asb2 mRNA in Bone Marrow from Patients with P210 (+) Chronic Myeloid Leukemia. Hongguo Journal of Experimental Hematology. 2016;24:667-71
59. Wu W, Nie L, Zhang L, Li Y. The notch pathway promotes NF-κB activation through Asb2 in T cell acute lymphoblastic leukemia cells. Cellular Molecular Biology Letters. 2018;23:1-13
60. Lv C, Sun L, Guo Z, Li H, Kong D, Xu B. et al. Circular RNA regulatory network reveals cell-cell crosstalk in acute myeloid leukemia extramedullary infiltration. Journal of Translational Medicine. 2018;16:1-15
61. Spinner CA, Lamsoul I, Métais A, Febrissy C, Moog-Lutz C, Lutz PG. The E3 ubiquitin ligase ASB2Α in T helper 2 cells negatively regulates antitumor immunity in colorectal cancer. Cancer Immunology Research. 2019;7:1332-44
62. Li Z, Weng H, Su R, Weng X, Zuo Z, Li C. et al. FTO plays an oncogenic role in acute myeloid leukemia as a N6-methyladenosine RNA demethylase. Cancer Cell. 2017;31:127-41
63. Ogorodnikov A, Levin M, Tattikota S, Tokalov S, Hoque M, Scherzinger D. et al. Transcriptome 3′ end organization by PCF11 links alternative polyadenylation to formation and neuronal differentiation of neuroblastoma. Nature Communications. 2018;9:1-16
64. Wu ZH, Yue JX, Zhou T, Xiao HJ. Integrated analysis of the prognostic values of RNA-binding proteins in head and neck squamous cell carcinoma. BioFactors. 2021;47:478-488
65. Lu Y, Yan Y, Li B, Liu M, Liang Y, Ye Y. et al. A novel prognostic model for oral squamous cell carcinoma: The functions and prognostic values of RNA-binding proteins. Frontiers in Oncology. 2021;11:1-12
66. Yang X, Zhan P, Feng S, Ji H, Tian W, Wang M. et al. SRSF6 regulates alternative splicing of genes involved in DNA damage response and DNA repair in HeLa cells. Oncology Reports. 2020;44:1851-62
67. Choi KS, Choi HJ, Lee JK, Im S, Zhang H, Jeong Y. et al. The endothelial E3 ligase HECW2 promotes endothelial cell junctions by increasing AMOTL1 protein stability via K63-linked ubiquitination. Cellular Signalling. 2016;28:1642-51
68. Shi CX, Zhu YX, Bruins LA, de Campos CB, Stewart W, Braggio E. et al. Proteasome subunits differentially control Myeloma cell viability and proteasome inhibitor sensitivity. Molecular Cancer Research. 2020;18:1453-64
69. Aenkoe ML. Regulation of gene expression programmes by serine-arginine rich splicing factors. Seminars in Cell and Developmental Biology. 2014;32:11-21
70. Jensen MA, Wilkinson JE, Krainer AR. Splicing factor SRSF6 promotes hyperplasia of sensitized skin. Nature Structural Molecular Biology. 2014;21:189-97
71. Li M, Wu P, Yang Z, Deng S, Ni L, Zhang Y. et al. miR-193a-5p promotes pancreatic cancer cell metastasis through SRSF6-mediated alternative splicing of OGDHL and ECM1. American Journal of Cancer Research. 2020;10:38-59
72. Karni R, de Stanchina E, Lowe SW, Sinha R, Mu D, Krainer AR. The gene encoding the splicing factor SF2/ASF is a proto-oncogene. Nature Structural Molecular Biology. 2007;14:185-93
73. Cohen-Eliav M, Golan-Gerstl R, Siegfried Z, Andersen CL, Thorsen K, Ørntoft TF. et al. The splicing factor SRSF6 is amplified and is an oncoprotein in lung and colon cancers. The Journal of Pathology. 2013;229:630-9
74. Zhou Y, Han C, Wang E, Lorch AH, Serafin V, Cho BK. et al. Posttranslational regulation of the exon skipping machinery controls aberrant splicing in leukemia. Cancer Discovery. 2020;10:1388-409
75. Moradpoor R, Gharebaghian A, Shahi F, Mousavi A, Salari S, Akbari ME. et al. Identification and validation of stage-associated PBMC biomarkers in breast cancer using MS-based proteomics. Frontiers in Oncology. 2020;10:1-14
76. Zhou X, Wang R, Li X, Yu L, Hua D, Sun C. et al. Splicing factor SRSF1 promotes gliomagenesis via oncogenic splice-switching of MYO1B. The Journal of Clinical Investigation. 2019;129:676-93
77. Dong M, Dong Z, Zhu X, Zhang Y, Song L. Long non-coding RNA MIR205HG regulates KRT17 and tumor processes in cervical cancer via interaction with SRSF1. Experimental Molecular Pathology. 2019;111:1-6
78. Du JX, Luo YH, Zhang SJ, Wang B, Chen C, Zhu GQ. et al. Splicing factor SRSF1 promotes breast cancer progression via oncogenic splice switching of PTPMT1. Journal of Experimental Clinical Cancer Research. 2021;40:1-19
79. Lei S, Zhang B, Huang L, Zheng Z, Xie S, Shen L. et al. SRSF1 promotes the inclusion of exon 3 of SRA1 and the invasion of hepatocellular carcinoma cells by interacting with exon 3 of SRA1pre-mRNA. Cell Death Discovery. 2021;7:1-15
Author contact
![]() Corresponding author: Dr. Samson Pandam Salifu, Department of Biochemistry and Biotechnology, KNUST, Ghana. E-mail: sspandamedu.gh; Phone: +233 54 908 6608.
Corresponding author: Dr. Samson Pandam Salifu, Department of Biochemistry and Biotechnology, KNUST, Ghana. E-mail: sspandamedu.gh; Phone: +233 54 908 6608.