Impact Factor ISSN: 1837-9664

 Global reach, higher impact
J Cancer 2023; 14(1):9-23. doi:10.7150/jca.76809 This issue Cite
Research Paper
Six Cell Cycle-related Genes Serve as Potential Prognostic Biomarkers and Correlated with Immune Infiltrates in Hepatocellular Carcinoma
Ying Shi1, Xiaopu Sang2, Jiali Deng1, Yihang Wang1, Xiaoni Chen3, Shan Lin3, Fenfang Wu1,3 ![]() , Anlong Xu1,2
, Anlong Xu1,2 ![]()
1. State Key Laboratory of Biocontrol, Guangdong Province Key Laboratory of Pharmaceutical Functional Genes, College of Life Sciences, Sun Yat-Sen University, Guangzhou, China.
2. School of Life Sciences, Beijing University of Chinese Medicine, Beijing, China.
3. Department of Central Laboratory, Shenzhen Hospital, Beijing University of Chinese Medicine, Shenzhen, China.
Received 2022-7-4; Accepted 2022-11-13; Published 2023-1-1
Abstract

Background: Cell cycle-related genes (CDK1, CDK5, CDC20, CCNA2, CCNB1, and CCNB2) play important roles in the regulation of mitotic cell cycle in eukaryotes. However, the correlation between cell cycle-related genes and tumor-infiltrating and prognosis of hepatocellular carcinoma (HCC) needs further investigation.
Methods: Two public websites, Tumor Immune Estimate Resource (TIMER) and Oncomine, were used to assess the expression levels of cycle-related genes. We also analyzed the protein expression levels of six cell cycle-related genes using the HPA database. In addition, Kaplan-Meier plotter and Gene Expression Profiling Interactive Analysis (GEPIA) database were used to investigate the impact of cell cycle-related gene expression levels on the clinical prognosis of HCC. The correlation between cell cycle-related genes and cancer immune infiltrates was analyzed through TIMER site. Subsequently, GEPIA and TIMER database were used to assess the correlation between the expression of six cell cycle-related genes and polygenic markers in monocytes and macrophages, respectively. The cell cycle-related genes were also analyzed to find the associated genes with the highest alteration frequency, by the Kyoto Encyclopedia of Genes and Genomes (KEGG) and Gene Ontology (GO) approaches of Metascape and String database, respectively.
Results: The expression levels of cell cycle-related genes were up-regulated in tumor tissues compared with normal tissues. Subsequently, the expression of high cell cycle-related genes was positively correlated with poor overall survival (OS) and progression-free survival (PFS) in HCC, for CDK1 (OS: HR = 2.15, P = 1.1E-05 PFS: HR = 2.03, P = 2.3E-06), CDK5 (OS: HR = 1.85, P = 0.0035 PFS: HR = 1.26, P = 0.17), CDC20 (OS: HR = 2.49, P = 5.1E-07 PFS: HR = 1.77, P = 0.00012), CCNA2 (OS: HR = 1.92, P = 0.00018 PFS: HR = 1.96, P = 5.2E-06), CCNB1 (OS: HR = 2.34, P = 3.4E-05 PFS: HR = 1.97, P = 5.3E-06), and CCNB2 (OS: HR = 1.91, P = 0.0013 PFS: HR = 1.63, P = 0.0011), respectively. Furthermore, the transcription level of cell cycle-related genes was significantly correlated with immune infiltrating levels of CD4+ T and CD8+ T cells, neutrophils, macrophages, and dendritic cells (DCs) in HCC, respectively. Amongst them, the expression levels of CDK1, CDC20, CCNA2, CCNB1 and CCNB2 manifest strongly correlated with diverse immune marker sets in HCC.
Conclusions: Our results demonstrated that cell cycle-related genes played key roles in the prognosis of HCC. Meanwhile, they were significantly correlated with immune infiltrating levels of CD4+ T cells, CD8+ T cells, neutrophils, macrophages and DCs in HCC, respectively. In addition, CDK1, CDC20, CCNA2, CCNB1 and CCNB2 expressions may be involved in the regulation of monocytes and tumor-associated macrophages (TAMs) in HCC, respectively. These findings strongly suggested that cell cycle-related genes could be used as novel biomarkers for exploring the prognosis and immune cells infiltration of HCC.
Keywords: cell cycle-related genes, hepatocellular carcinoma, tumor-infiltrating, prognostic biomarker, immune
Introduction
The hepatocellular carcinoma (HCC) is the third most prevalent cause of cancer-related deaths in worldwide, with more than 800,000 new cases annually all over the world [1, 2]. In particular, HCC has the highest incidence in China due to susceptibility to hepatitis B virus (HBV) infection. Only 30% of HCC patients are diagnosed at an early stage and are amenable to reasonable treatment by tumor resection or liver transplantation [3]. Although treatments (e.g., targeted therapeutics) and clinical medicine (e.g., sorafenib and regorafenib) have improved, but these therapies still do not improve satisfactory overall survival (OS) and progression-free survival (PFS) among clinical patients with HCC. Immune infiltration-related mechanisms play a key role in multiple cancer types, and immunotherapy may be considered as a promising approach for the treatment of HCC in future. Recently it has been reported that cytotoxic T lymphocyte antigen 4 (CTLA4) and programmed cell death 1 (PD1) complement each other functionally while protecting the body from pathogens and neoplasia [4, 5]. Another immunotherapeutic method is the chimeric antigen receptor (CAR) T cell therapy that has been used to treat refractory disease, such as leukemia and lymphoma, successfully [6]. In recent years, numerous studies has been reported that the multiple tumor-infiltrating lymphocytes, dendritic cells, monocyte, and tumor-associated macrophages (TAMs) affect the prognosis through greatly efficacy of chemotherapy and immunotherapy in HCC [7]. Therefore, there is an urgent and meaningful need to find specific biomarkers to predict the prognosis and to guide the therapeutic goals of HCC. Recently, the public bioinformatics platform of molecular targets and networks provides a rich and convenient resource for cancer biomarker research, which can better explore the pathogenesis of HCC and identify novel functional genomic targets for therapeutic intervention.
Cell cycle-related genes play important roles in the regulation of the cycle by controlling the mitotic onset and centrosome cycle in eukaryotic cell; effectively regulating G1 progress and G1-S transition, and promoting G2-M transition [8]. Researches showed that the disorder in cell cycle may lead to malignancy [9, 10]. However, the underlying functions and regulatory mechanisms of cell cycle-related genes in HCC progression and tumor immunology are not fully elucidated.
Our study aimed to comprehensively explored cell cycle-related genes (cyclin dependent kinase 1: CDK1, cyclin dependent kinase 5: CDK5, Cell-division cycle protein 20 homologue: CDC20, Cyclin A2: CCNA2, Cyclin B1: CCNB1, and Cyclin B2: CCNB2) expression levels and correlation with prognosis features of HCC patients based on the online databases. These six-cell cycle-related genes not only control G2/M phase, but also function through the formation of specific serine/threonine protein kinase holoenzyme complexes with the cyclin-dependent protein kinases. Then, we analyzed the correlation of these genes with diverse tumor-infiltrating immune cells in HCC immune microenvironments via TIMER. This findings shed light on the key role of cell cycle-related genes in HCC, as well as provide an underlying molecular mechanism for tumor-immune interactions.
Materials and methods
Oncomine Database Analysis
Oncomine (https://www.oncomine.org) is a freely available web-based data-mining platform contain 65 gene expression datasets. The Oncomine database was used to analyze the transcription levels of the six-cell cycle-related genes in 20 cancers compared with normal tissues [11,12]. The threshold level was measured as follow: P-value ≤ 0.01, fold change (FC) ± 2 and rank of top 10% genes.
Gene Expression Profiling Interactive Analysis (GEPIA) Dataset
GEPIA is a convenient and versatile bioinformatics analysis platform that enables comprehensive analysis of material RNA sequencing through the TCGA and GTEx data with the normalized processing pipeline. The mRNA expression levels of cell cycle-related genes was analyzed by GEPIA in HCC dataset, and the profiling and pathologic stage, overall survival and correlation were analyzed with the following values of P-value ≤0.01, FC ± 2.
The Human Protein Atlas Database Analysis
The public protein database, Human Protein Atlas (HPA, https://www.proteinatlas.org/), contains immunohistochemistry-based expression data for approximately 20 most common types of cancers. We used HPA database to analyze the protein expression levels of six cell cycle-related genes in normal tissues and HCC tissues, respectively.
Cell culture
The HepG2 cells, BEL-7402 cells and LO2 cells were cultured in Dulbecco's Modified Eagle Medium (Gibco) containing 10% fetal bovine serum (Gibco), 100 μg/mL streptomycin sodium and 100 U/mL penicillin G sodium (MP Biomedicals) at 37 °C and 5% CO2.
Real-time quantitative PCR
Total cell RNA was isolated using RNAiso (Takara). 500 ng of total RNA was used for reverse transcription with PrimeScrip RT reagent Kit (Takara). Real-time quantitative PCR was performed using SYBR Premix Ex Taq (Takara) with the following primer: CDK1 (Forward: AAAATTGGAGAAGGTACCTATGGA, Reverse: CCCTTCCTCTTCACTTTCTAGTCTG), CDK5 (Forward: CGCCGCGATGCAGAAATACGAGAA, Reverse: TGGCCCCAAAGAGGACATC), CDC20 (Forward: CTGGGTTCCTCTGCAGACAT, Reverse: CGAATGTGTCGATCACTGGT), CCNA2 (Forward: CGCTGGCGGTACTGAAGTC, Reverse: GAGGAACGGTGACATGCTCAT), CCNB1 (Forward: AATAAGGCGAAGATCAACATGGC, Reverse: TTTGTTACCAATGTCCCCAAGAG) and CCNB2 (Forward: GCGTTGGCATTATGGATCG, Reverse: TCTTCCGGGAAACTGGCTG).
All steps were performed as described in the user manual of the kit.
Immunofluorescence
Cells were fixed using 4% paraformaldehyde for 15 min at room temperature and then washed 3 times with PBS. Cells were permeabilized by incubation in 0.2% Triton X-100 (Sigma-Aldrich) at room temperature for 15 min. Cells were blocked with 5% BSA, and incubated with CDK1 antibodies (Sangon Biotech, D190678), CDK5 antibodies (Sangon Biotech, D199878), CDC20 antibodies (Sangon Biotech, D120392), CCNA2 antibodies (Sangon Biotech, D160233), CCNB1 antibodies (Sangon Biotech, D260234), and CCNB2 antibodies (Sangon Biotech, D260235), at 4 °C overnight. Subsequently, cells were incubated with secondary antibodies in 1% donkey serum for 45 min at RT. Finally, the nuclei were counterstained with DAPI. Images were captured on an Olympus FV1000 Confocal Laser Scanning microscope. Leica TCS-SP5 confocal microscope. LAS X software (Leica) was used for image processing.
Kaplan-Meier Plotter Database Analysis
Kaplan-Meier plotter (http://kmplot.com/analysis/index.php?p=service&cancer=liver_rnaseq) is an online platform for analyzing the correlation between the expression of the 54,675 genes on tumor survival rates in more than 20 different cancers through 10,461 cancer samples, including 364 liver cancer samples on the HGU133 Plus 2.0 array [13]. A correlation analysis was conducted between CDK1, CDK5, CDC20, CCNA2, CCNB1 and CCNB2 mRNA transcription expression levels and survival rates in HCC using Kaplan-Meier survival curve. We also calculated the HR with 95% confidence intervals and log-rank P-value, with the following values of P-value ≤ 0.01, fold change ± 2.
TIMER Database Analysis
The newly designed free web server, TIMER database (https://cistrome.shinyapps.io/timer/) [14] contains 10,897 samples from TCGA for comprehensive analysis of immune infiltrates information across 32 different cancer types. We analyzed the cell cycle-related gene expression in HCC and correlated the expression with the all kinds of immune infiltrates cells, such as B cells, CD8+ T cells, CD4+ T cells, macrophages, neutrophils and dendritic cells through gene modules [15, 16]. Meanwhile, correlations between cell cycle-related genes mRNA expression levels and multiple gene markers of tumor-infiltrating immune cells were also estimated through correlation modules. The gene expression level was displayed with log2 RSEM.
HCCDB Database Analysis
The HCCDB (http://lifeome.net/database/hccdb) is an available online database containing 15 public HCC expression datasets across 3917 clinical samples to exploring gene expression and clinic-pathological features of HCC. The expression level of cell cycle-related genes was confirmed by HCCDB database [17]. The P-value was calculated by student's t-test. The P value and threshold fold change were set at 0.01 and 2.
Metascape Database Analysis
The online bioinformatics analysis platform, Metascape (http://metascape.org), contains comprehensive bioinformatic knowledge bases, which is used to extract the enriched pathways and construct the protein-protein interaction (PPI) network based on the lists of multiple proteins and gene identifiers [17]. The six-cell cycle-related genes were analyzed using the KEGG and GO methods of Metascape database, finally the linked genes with the highest alteration frequency were found.
UALCAN Database Analysis
The UALCAN (http://ualcan.path.uab.edu/index.html) is a comprehensive online analysis tool; it enables the analysis of mRNA expression differences to compare normal samples with primary tumor tissue samples, as well as the access to different tumor pathological stages, detection of tumor grades and other clinic-pathologic features [18].
STRING Database Analysis
The STRING (https://string-db.org/) is available online network. The STRING database is to create an exhaustive and convenient global platform, including PPI. For the enrichment analysis, STRING implements well-known classification systems and offers unique classification systems that rely on high-throughput data mining [19, 20].
Statistical Analysis
The results analysis by Oncomine database are showed with P value, threshold fold changes, and ranks. The results obtained in Kaplan-Meier plots and GEPIA database are displayed with HR and P value from a log-rank test. The correlation of gene expression was generated by statistical significance: *P <0.05, **P <0.01, ***P <0.001.
Results
The Expression Levels of Cell Cycle-related Genes and Correlation with Pathological Parameters in HCC
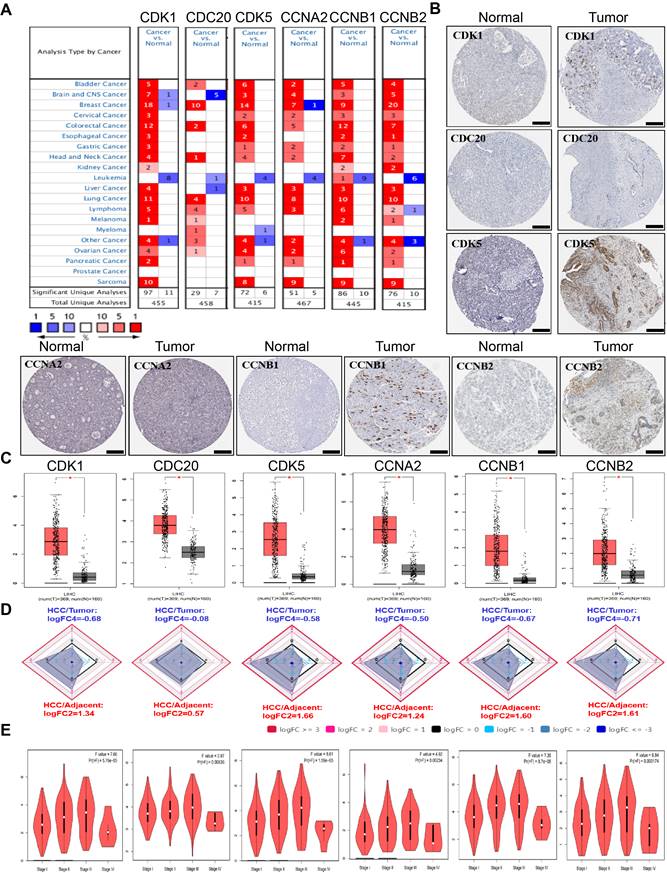
To study the different expression levels of cell cycle-related genes in HCC patients, the CDK1, CDK5, CDC20, CCNA2, CCNB1 and CCNB2 mRNA expression levels in tumor and normal sample from 20 types of malignant tumors were analyzed using the Oncomine database. Our findings demonstrated that mRNA expression levels of six cell cycle-related genes were all remarkably increased among patients with HCC (Figure 1A). In addition, lower expression levels were observed in leukemia, melanoma and prostate cancer in some data sets. To further assesse cell cycle-related genes expression in HCC, we evaluated CDK1, CDK5, CDC20, CCNA2, CCNB1 and CCNB2 expression using the protein data in HPA database. It revealed from HPA database analysis that protein levels of CDK1, CDK5, CDC20, CCNA2, CCNB1 and CCNB2 were obviously upregulated in the HCC tissues compared with the normal tissues. Specifically, we compared the mRNA levels of six cell cycle-related genes of the tumor tissues with the adjacent normal tissues through the GEPIA, Ualcan and HCCDB database of HCC in TCGA (tumor sample: n = 369 vs. normal sample: n = 160) (Figure 1B-D, Supplementary Figure 1). The result also showed that CDK1, CDK5, CDC20, CCNA2, CCNB1 and CCNB2 mRNA expression levels within tumor tissues were significantly increased compared with the adjacent normal tissues. The P values were listed in Table 1 for this six-cell cycle-related genes from 12 datasets in HCCDB. The CDK1, CDK5, CDC20, CCNA2, CCNB1 and CCNB2 expression levels (tumor sample: n = 369 vs. normal sample: n = 160) were upregulated in HCC group compared with the non-carcinoma group (Analysis by GEPIA dataset). And then, the association between the expression levels of these genes and the HCC stages was also analyzed. The expression levels of CDK1 (P = 5.76E-05), CDK5 (P = 0.00836), CDC20 (P = 1.59E-05), CCNA2 (P = 0.00234), CCNB1 (P = 8.7E-05) and CCNB2 (P = 0.000174) were significantly increased in every major stage, respectively (Figure 1E, Supplementary Figure 2), (P <0.05).
P-value of the six up-regulated cell cycle-related genes in HCCDB database
| Dataset | CDK1 | CDK5 | CDC20 | CCNA2 | CCNB1 | CCNB2 |
|---|---|---|---|---|---|---|
| HCCDB1 | 5.010e-42 | 1.250e-22 | 6.990e-40 | 8.920e-50 | 6.970e-52 | 1.970e-55 |
| HCCDB3 | 5.750e-53 | 1.740e-46 | 3.760e-36 | 5.030e-11 | 4.530e-47 | 7.410e-45 |
| HCCDB4 | 2.460e-39 | 1.530e-55 | 1.870e-90 | 8.970e-59 | 8.720e-48 | 2.050e-82 |
| HCCDB6 | 1.040e-67 | 8.120e-27 | 8.420e-64 | 1.590e-48 | 2.820e-87 | 3.200e-60 |
| HCCDB7 | 5.190e-8 | 0.8876 | 3.800e-9 | 3.320e-7 | 6.830e-12 | 2.120e-7 |
| HCCDB11 | 0.5330 | 0.5333 | 0.0007623 | 0.2078 | 0.00001180 | 0.4481 |
| HCCDB12 | 3.540e-15 | 0.00002120 | 1.360e-10 | 8.250e-12 | 3.510e-16 | 6.790e-14 |
| HCCDB13 | 1.510e-43 | 2.990e-41 | 3.690e-8 | 2.570e-43 | 2.310e-55 | 4.490e-47 |
| HCCDB15 | 7.150e-28 | 9.000e-25 | 4.110e-29 | 2.690e-27 | 1.290e-38 | 1.810e-27 |
| HCCDB16 | 7.480e-11 | 1.180e-13 | 9.120e-12 | 2.650e-14 | 1.710e-11 | 8.010e-15 |
| HCCDB17 | 7.700e-17 | 1.180e-13 | 7.770e-14 | 1.170e-14 | 1.930e-17 | 8.420e-18 |
| HCCDB18 | 3.710e-76 | 6.680e-71 | 2.630e-63 | 1.200e-57 | 1.200e-76 | 4.420e-63 |
Bold values indicate statistically significant (P < 0.05).
The expression levels of CDK1, CDK5, CDC20, CCNA2, CCNB1 and CCNB2 in HCC. (A) Transcriptional pattern of CDK1, CDK5, CDC20, CCNA2, CCNB1 and CCNB2 in major malignant tumors compared with those in normal tissues using the Oncomine database. The heat-map represents data with statistically significant upregulation (red) or downregulation (blue). The numbers in the heat-map indicate the published independent datasets of mRNA microarray experiments. (B) The protein expression levels of CDK1, CDK5, CDC20, CCNA2, CCNB1 and CCNB2 in HCC from HPA. Scale bar: 200μm. (C) The mRNA expression levels of CDK1, CDK5, CDC20, CCNA2, CCNB1 and CCNB2 in GEPIA. (*P < 0.05). (D) The mRNA expression levels of CDK1, CDK5, CDC20, CCNA2, CCNB1 and CCNB2 compared with the normal tissues in HCCDB. (E) Correlation of the CDK1, CDK5, CDC20, CCNA2, CCNB1 and CCNB2 expression levels with various tumor stages among HCC tissues in GEPIA.
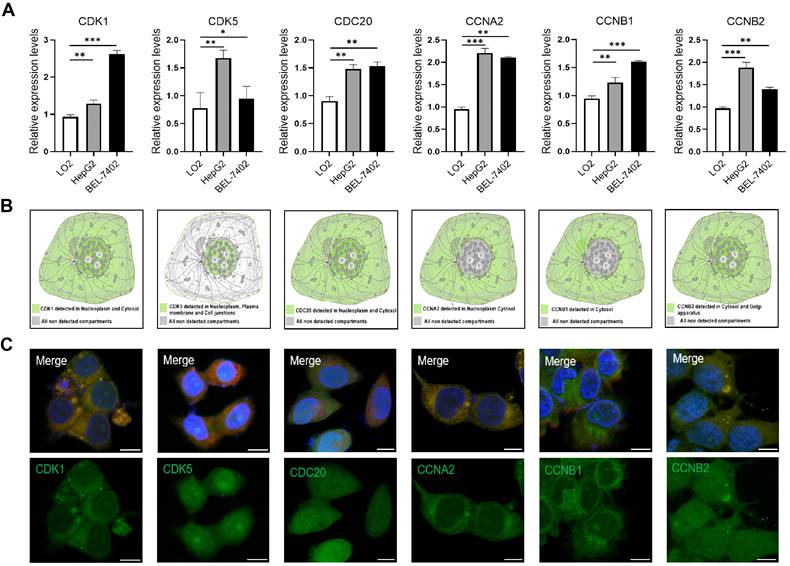
To confirm our results from the database, we analyzed the expression levels of six cell cycle related genes in normal liver cells (LO2) and tumor liver cells (HepG2, BEL-7402) using quantitative PCR. The results showed that the expression levels of CDK1, CDK5, CDC20, CCNA2, CCNB1 and CCNB2 were significant up-regulated in HepG2 and BEL-7402 cells compare with LO2 cells (Figure 2A). We also analyzed the subcellular localization of cell cycle-related proteins using the HPA database. In addition, immunofluorescence showed that CDK1, CDC20 and CCNB2 were mainly distributed in cytoplasm and nucleus (Figure 2B, C). CCNA2 and CCNB1 were only distributed in cytoplasm, and CDK5 was only distributed in nucleus.
(A) The expression of CDK1, CDK5, CDC20, CCNA2, CCNB1 and CCNB2 in HepG2 and BEL-7402 cells compared with LO2 cells by quantitative PCR analysis. *p <0.05, **p <0.01, ***p <0.001; n = 3. (B) The subcellular localization of the six-cell cycle related protein analyzed in HPA database. (C) Immunofluorescence images of CDK1, CDK5, CDC20, CCNA2, CCNB1 and CCNB2 in HepG2 cells. The nucleuses were stained blue, the microtubules were stained red, and the cell cycle related proteins were stained green. Scale bar = 10μm.
Expression of Cell Cycle-related Genes in the Present of TP53 Mutation Status in HCC
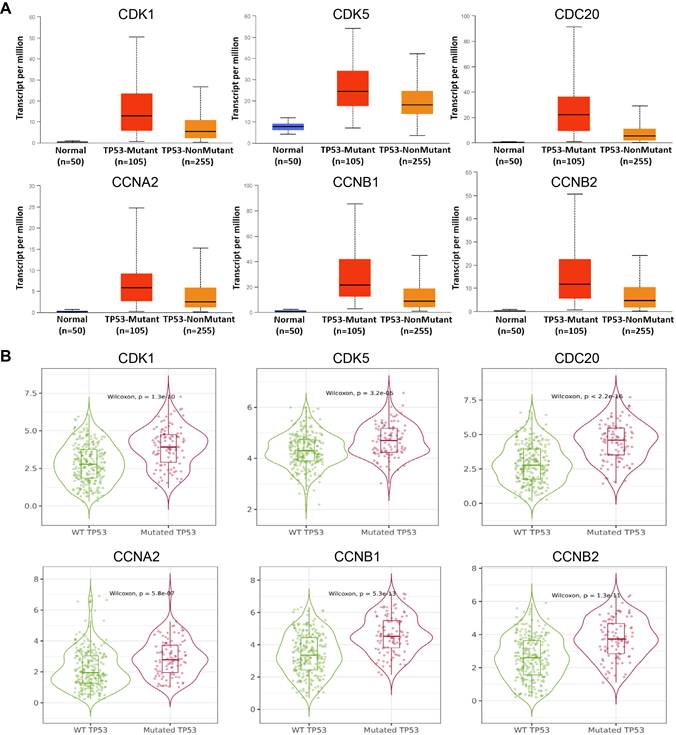
As a tumor suppressor in cells, TP53 lead to growth arrest and apoptosis depending on the physiological conditions and cell type [21]. TP53 mutation in HCC is associated with worse clinical stage and prognosis [22]. Therefore, we individually analyzed the expression of 6 hub cell cycle-related genes in HCC when the TP53 mutated. The results showed that the mRNA expression levels of CDK1 (P = 8.44949999967426E-07), CDK5 (P = 2.18779999999752E-05), CDC20 (P = 3.42399997244058E-09), CCNA2 (P = 2.377900E-02), CCNB1 (P = 1.00539999658977E-08) and CCNB2 (P = 1.34450000022213E-08) were significantly increased in TP53-mutant specimens compared to those without TP53-mutant (Figure 3, Supplementary Table 1). These results suggested that TP53 mutation may an important role in the expression of cell cycle-related genes in HCC.
Expression levels of CDK1, CDK5, CDC20, CCNA2, CCNB1 and CCNB2 in HCC in the presence of TP53 mutation status in UALCAN (A) and (B) GEPIA database.
Relationship between the Increased mRNA Expression of CDK1, CDK5, CDC20, CCNA2, CCNB1 and CCNB2 and Dismal Prognosis for HCC
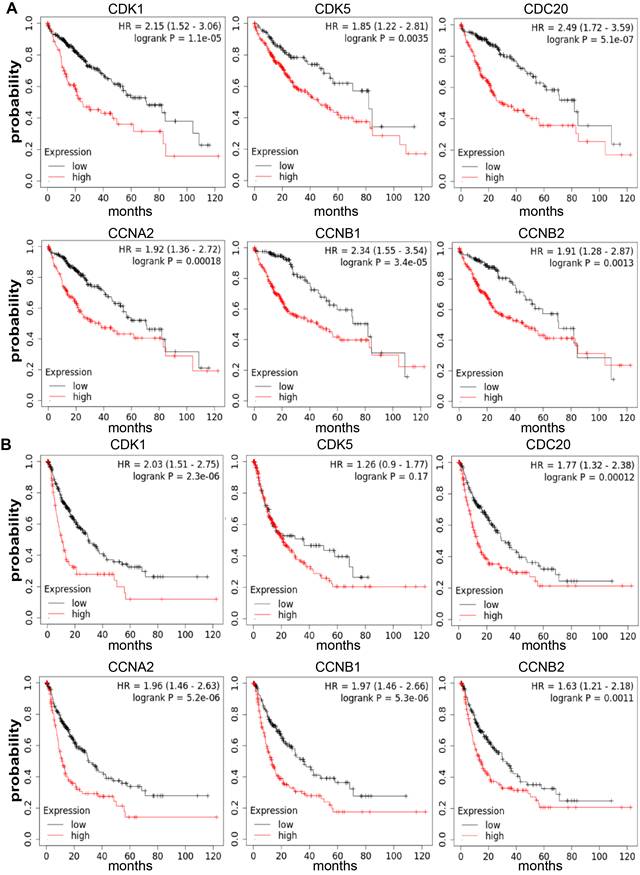
The crucial effect of cell cycle-related genes in HCC sample survival was also found. The Kaplan-Meier Plotter database was utilized to analyze the relationship between the CDK1, CDK5, CDC20, CCNA2, CCNB1 and CCNB2 mRNA expression and the outcome of HCC patients based on the public datasets. Our results displayed that the high expression levels of CDK1 (OS: HR=2.15, P = 1.1E-05 PFS: HR = 2.03, P = 2.3E-06), CDC20 (OS: HR = 2.49, P = 5.1E-07 PFS: HR = 1.77, P = 0.00012), CCNA2 (OS: HR = 1.92, P = 0.00018 PFS: HR = 1.96, P = 5.2E-06), CCNB1 (OS: HR = 2.34, P = 3.4E-05 PFS: HR = 1.97, P = 5.3E-06) and CCNB2 (OS: HR = 1.91, P = 0.0013 PFS: HR = 1.63, P = 0.0011) were positively associated with poor OS and PFS (P <0.05). However, the increased expression level of CDK5 (OS: HR = 1.85, P = 0.0035 PFS: HR = 1.26, P = 0.17) was significantly correlated with poor OS (P < 0.05), (Figure 4, Supplementary Figure 3). Therefore, high expression levels of cell cycle-related genes are considered to be an important risk factor for poor prognosis of HCC patients.
Contributions of CDK1, CDK5, CDC20, CCNA2, CCNB1 and CCNB2 mRNA expression levels in predicting prognosis of HCC patients (Kaplan-Meier plotter). (A) Relationship between high expression levels of CDK1, CDK5, CDC20, CCNA2, CCNB1 and CCNB2 with poor OS for HCC patients (n = 364). (B) Relationship between high expression levels of CDK1, CDC20, CCNA2, CCNB1 and CCNB2 with poor PFS for HCC patients (n = 370). OS, overall survival; PFS, Relapse free survival.
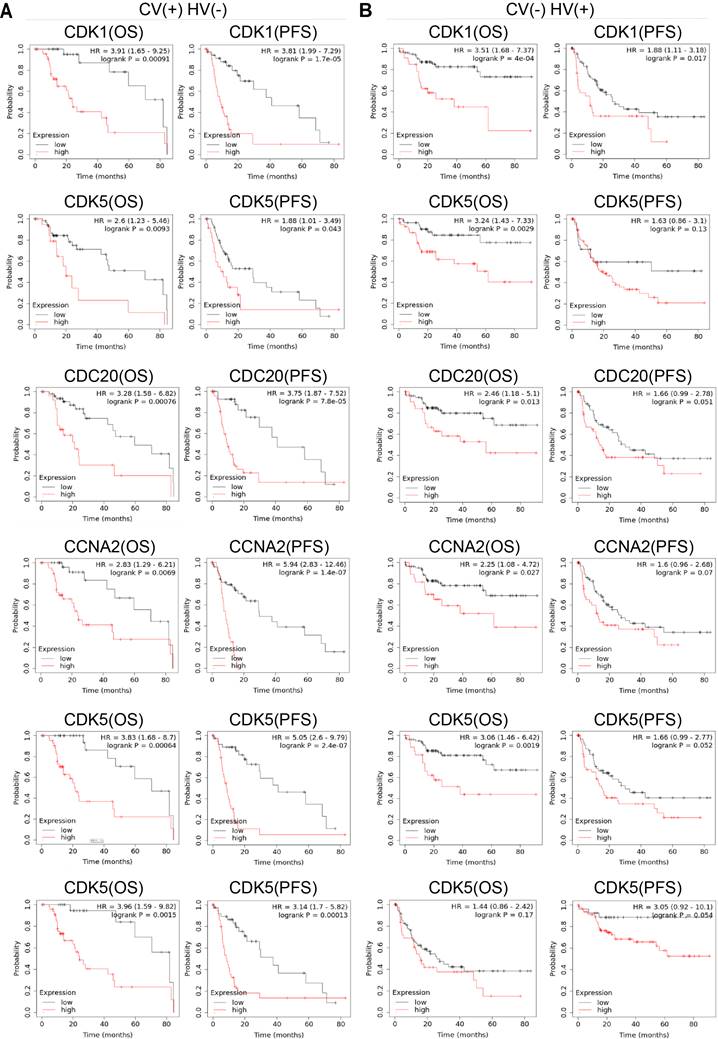
High Expression Levels of Cell Cycle-related Genes Impact the Prognosis in HCC Patients with Risk Factors
Hepatitis virus and alcohol consumption are the main causes of HCC. Approximately 45% of cases could be attributed to hepatitis B virus (HBV) infection, 26% to hepatitis C virus (HCV) infection, and 20% to alcoholic liver disease [23]. Then, Kaplan-Meier Plotter database was used to evaluate the correlation between the expression level of cell cycle-related genes and OS and PFS under different risk factors. CDK1 (OS: P = 0.00091 PFS: P = 1.7E-05), CDK5 (OS: P = 0.0093 PFS: P = 0.043), CDC20 (OS: P = 0.0076 PFS: P = 7.8E-05), CCNA2 (OS: P = 0.0069 PFS: P = 1.4E-07), CCNB1 (OS: P = 0.00064 PFS: P = 2.4E-07) and CCNB2 (OS: P = 0.0015 PFS: P = 0.00013) were up-regulated in HCC patients under poor OS and PFS with alcohol consumption. CDK5 (OS: P = 0.0029), CDC20 (OS: P = 0.0013), CCNA2 (OS: P = 0.027), and CCNB1 (OS: P = 0.0019) were up-regulated in HCC patients under poor OS with hepatitis virus. CDK1 (OS: P = 4E-04 PFS: P = 0.017) was up-regulated in those under poor OS and PFS with hepatitis virus.
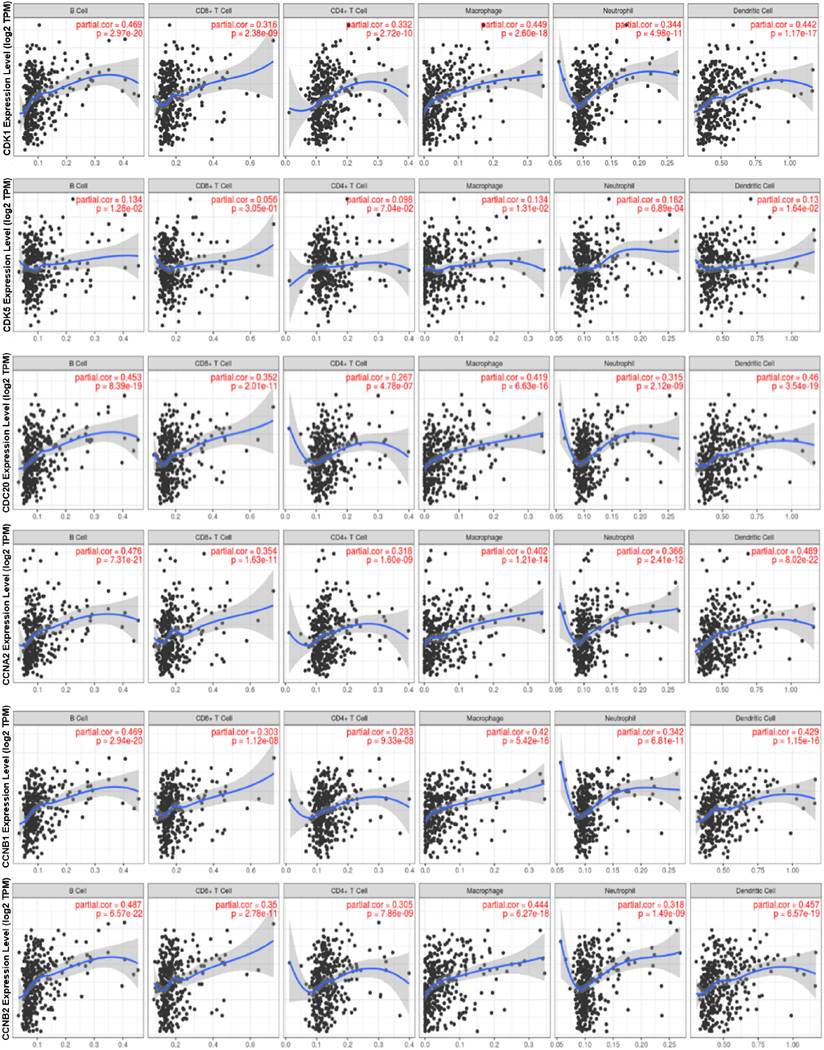
CDK1, CDK5, CDC20, CCNA2, CCNB1, and CCNB2 Expression Is Correlated with Immune Infiltration Level in HCC
Tumor-infiltrating lymphocytes are considered to be an independent predictor of sentinel lymph node status in multiple tumors and survival [24]. The free online database TIMER was used to analyze whether the expressions of CDK1, CDK5, CDC20, CCNA2, CCNB1 and CCNB2 were correlated with the level of HCC immune infiltration. Our results showed that the expression levels of cell cycle-related genes were significantly correlated with B cell, CD8+ T cells, CD4+ T cells, neutrophils, macrophages, and DCs in HCC (Figure 6). The P-values were listed in Supplementary Table 2.
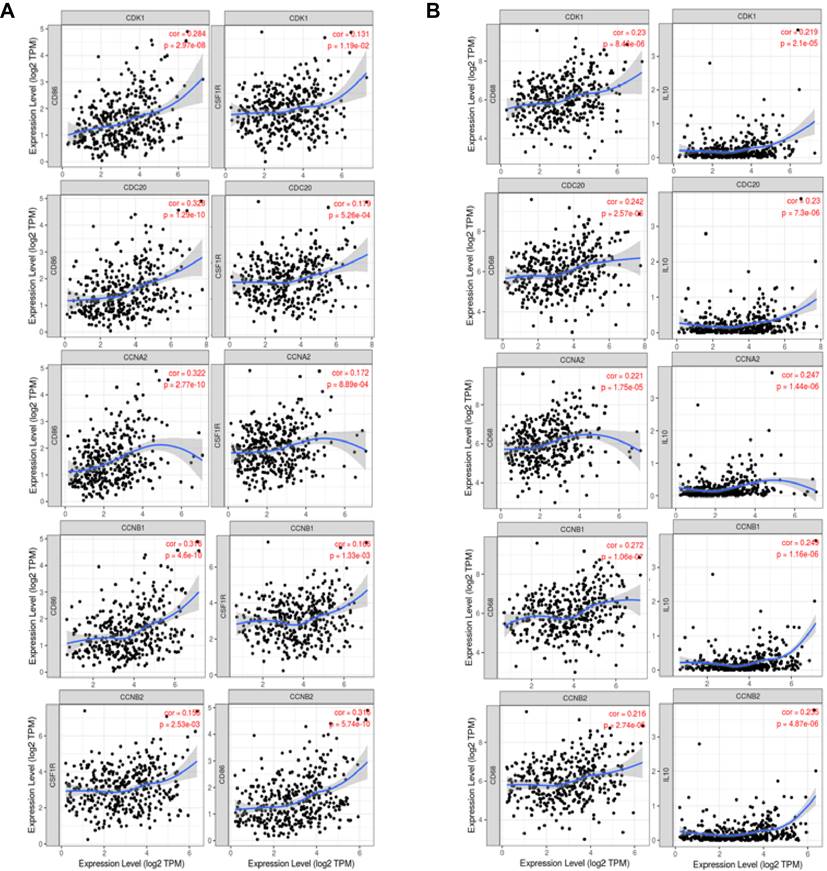
Correlation Analysis between Expression of CDK1, CDC20, CCNA2, CCNB1 and CCNB2 and Marker Sets of Immune Cells
Correlation Analysis between Expression of CDK1, CDC20, CCNA2, CCNB1 and CCNB2 and Marker Sets of Immune Cells
In order to better analyze the relationship between expression of CDK1, CDC20, CCNA2, CCNB1 and CCNB2 and multiple immune infiltrates, we further investigated the relationship between the expression of these genes and the levels of multiple marker sets of different HCC immune cells in GEPIA and TIMER databases, respectively. Including monocytes (CFS1R, CD86), TAMs (CD68, CCL2, IL10), M1 macrophages (COX2, IRF5, INOS) and M2 macrophages (MS4A4A, VSIG4, CD163) in HCC (Table 2 and Figures 7).
Correlation Analysis between Expression of CDK1, CDK5, CDC20, CCNA2, CCNB1 and CCNB2 and Levels of Markers of Immune Cells in TIMER
| Description | Gene markers | ||||||
|---|---|---|---|---|---|---|---|
| CDK1 | CDK5 | CDC20 | |||||
| Cor | P | Cor | P | Cor | P | ||
| Monocyte | CD86 | 0.284 | *** | 0.069 | *** | 0.326 | *** |
| CD115 (CSF1R) | 0.131 | * | 0.088 | 0.0918 | 0.179 | *** | |
| TAM | CCL2 | 0.039 | 0.459 | 0.02 | 0.701 | 0.038 | 0.464 |
| CD68 | 0.23 | *** | 0.076 | 0.142 | 0.242 | *** | |
| IL10 | 0.219 | *** | 0.012 | 0.822 | 0.23 | *** | |
| M1 Macrophage | INOS (NOS2) | 0.02 | 0.695 | 0.116 | * | 0.098 | 0.0588 |
| IRF5 | 0.394 | *** | 0.367 | *** | 0.325 | *** | |
| COX2(PTGS2) | 0.101 | 0.0526 | -0.109 | * | 0.034 | 0.514 | |
| M2 Macrophage | CD163 | 0.067 | 0.0197 | 0.043 | 0.406 | 0.046 | 0.38 |
| VSIG4 | 0.08 | 0.123 | 0.149 | * | 0.098 | 0.0588 | |
| MS4A4A | 0.089 | 0.0859 | 0.056 | 0.285 | 0.089 | 0.0869 | |
| CCNA2 | CCNB1 | CCNB2 | |||||
| Cor | P | Cor | P | Cor | P | ||
| Monocyte | CD86 | 0.322 | *** | 0.316 | *** | 0.318 | *** |
| CD115 (CSF1R) | 0.172 | *** | 0.166 | ** | 0.156 | * | |
| TAM | CCL2 | 0.076 | 0.144 | 0.034 | 0.512 | 0.065 | 0.211 |
| CD68 | 0.221 | *** | 0.272 | *** | 0.216 | *** | |
| IL10 | 0.247 | *** | 0.249 | *** | 0.235 | *** | |
| M1 Macrophage | INOS (NOS2) | 0.022 | 0.674 | 0.028 | 0.597 | 0.014 | 0.786 |
| IRF5 | 0.369 | *** | 0.377 | *** | 0.379 | *** | |
| COX2(PTGS2) | 0.125 | * | 0.08 | 0.124 | 0.078 | 0.133 | |
| M2 Macrophage | CD163 | 0.125 | ** | 0.082 | 0.114 | 0.059 | 0.253 |
| VSIG4 | 0.125 | * | 0.106 | ** | 0.077 | 0.141 | |
| MS4A4A | 0.133 | * | 0.106 | * | 0.087 | 0.0945 | |
One asterisk: P < 0.05, two asterisks: P < 0.01, three asterisks: P < 0.001.
Surprisingly, our results showed a strong correlation between the transcription levels of majority marker sets of monocytes, TAMs, and other immune cells and the expression levels of CDK1, CDK5, CDC20, CCNA2, CCNB1 and CCNB2 in HCC (Table 2, Supplementary Table 2). Furthermore, the expression levels of chemokine (C-C motif) ligand (CCL)-2, IL10 and CD68 of TAMs were significantly correlated with the expression levels of CDK1, CDC20, CCNA2, CCNB1 and CCNB2 in HCC (Figures 7A-B).
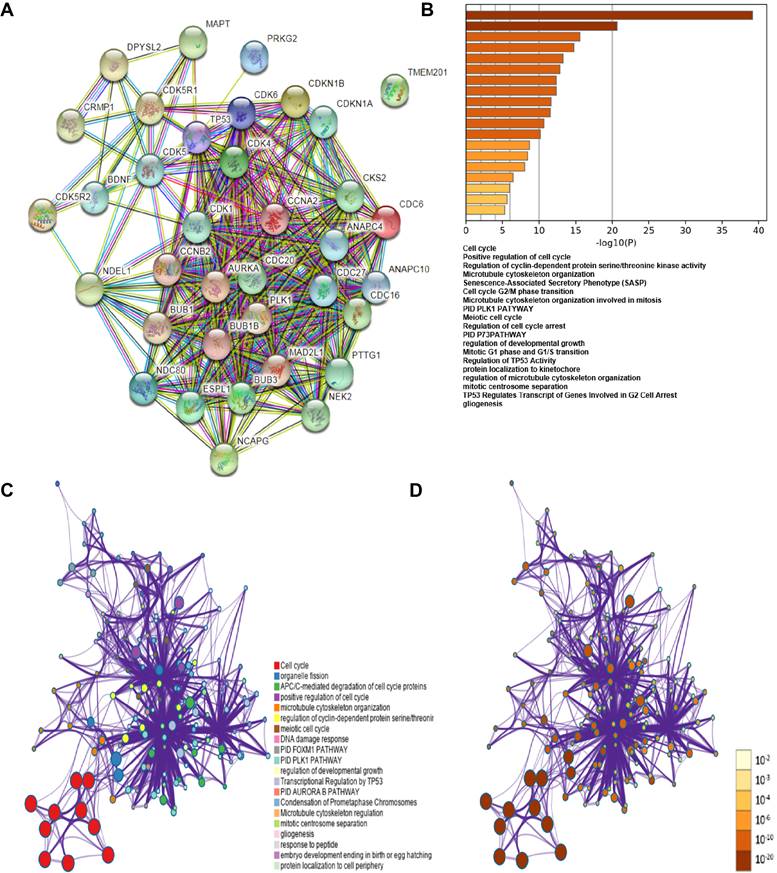
Prediction of the Functions and Pathway Enrichment Analyses of CDK1, CDK5, CDC20, CCNA2, CCNB1 and CCNB2 among HCC Cases
The co-expression genes of CDK1, CDK5, CDC20, CCNA2, CCNB1, CCNB2, BUB1, AURKA, PLK1, BUB1B, BUB3, MAD2L1, CDC6, NDC80, TP53 and CDKN18 were analyzed using STRING database and functional protein association networks (Figure 8A). Subsequently, the lists of all expressed cell cycle-related genes with the highest alteration frequency were compiled and analyzed using KEGG and GO methods from the Metascape database (Figure 8B, C, D). The results showed that changes in cell cycle-related genes affected the following cellular processes and pathways: cell cycle (hsa04110); positive regulation of cell cycle (GO: 0045787); regulation of cyclin-dependent protein serine/ threonine kinase activity (GO: 0000079); microtubule cytoskeleton organization (GO: 0000226), PLK1 PATHWAY (M129: PID).
Discussion
Cell cycle transitions are pivotal events in regulating cell proliferation in eukaryotic cells. This complex and thorough process are regulated by the cyclin dependent kinases family (CDKs), which are actuated by interacting with specific cyclins [8, 25]. This complex and thorough process is regulated by a family of cyclin dependent kinases family (CDKs), which are actuated by interacting with specific cyclins [8, 25]. CDK1 and CDK5, as main members of the CDK family, are originally known as threonine/serine-specific protein kinases activated to initiate the cell cycle. CDK1 has been found to be active in several tumor-regulating cell adhesion cycles and can be identified as a prognostic biomarker for various types of cancer [26, 27]. CDK5 is one of the most special members of the CDK family, which is one of the first CDK members to be found in non-cycling cells. There is increasing evidence that it can promote tumorigenesis in certain cellular environments [28]. Cyclin B cluster, a member of the cyclin B1 and cyclin B2 families in human beings, is an important cell cycle control protein and effectively regulates the cell entry into mitosis [29]. Cyclins A2 regulates the cell cycle by promoting the entry and progression of the S phase [29]. CDC20 is also an essential cell-cycle regulator, completing mitosis and mediating cell cycle-related protein-protein interactions [30, 31]. However, few reports have described the prognostic characteristics of different cell cycle-related genes. Furthermore, there are few reports on the correlation between cycle-related genes and immune infiltration in HCC. Therefore, our current work provides a new perspective for exploring the potential function of cell cycle-related genes in tumor immunology, which can be regarded as biomarker for HCC.
Here we analyzed the expression levels and systemic prognostic status of 6 cell cycle-related genes in HCC using public independent dataset of Oncomine, HPA, GEPIA, and HCCDB. The results showed that the expression of CDK1, CDK5, CDC20, CCNA2, CCNB1 and CCNB2 in HCC tissues were higher than those in normal or adjacent tissues (Figure 1). Overexpression of CDC20 and CDK1 has been reported in various malignancies, which are also associated with high tumor grade in cervical, colon, and renal carcinomas [32-34]. TCGA database also showed that increased transcription of cell cycle-related genes was correlated with poor HCC prognosis (Supplementary Figure 1). Next, these six-cell cycle-related genes with different major stages and grades of HCC were analyzed by GEPIA, TISIDB and Ualcan online database, respectively. The results showed that the transcription level of CDK1, CDC20, CCNA2, CCNB1 and CCNB2 in stage II and stage III was significantly increased than that in stage I in HCC (Figure 1E, Supplementary Figure 2). The results also showed that the expression level of CDK1, CDC20, CCNA2, CCNB1 and CCNB2 in grade II, grade III and grade Ⅳ were up-regulated compared to that in grade I. These results indicated that these cell cycle-related genes may play an important role in the end-stage of HCC. To confirm our results from the database, we analyzed the expression levels of six cell cycle related genes in normal liver cells (LO2) and tumor liver cells (HepG2, BEL-7402) using quantitative PCR and immunofluorescence. The results showed that the expression levels of six cell cycle related genes were significant up-regulated in HepG2 and BEL-7402 cells compare with LO2 (Figure 2). TP53 mutations are considered to be the leading cause of HCC. Our results showed that the expression levels of CDK1, CDK5, CDC20, CCNA2, CCNB1 and CCNB2 were higher in TP53-mutant sample than that in TP53-nonmutant sample (Figure 3, Supplementary Table 1). In addition, Kaplan-Meier Plotter database results showed that high cell cycle-related genes expression was associated with a low positive hazard ratio of OS and PFS in HCC patients (Figure 4). These findings strongly suggest that cell cycle-related genes may be prognostic biomarker for HCC.
Hepatitis B virus (HBV) and hepatitis C virus (HCV), along with alcohol abuse and metabolic syndrome are the most attributable causes in HCC [35]. We also evaluated the association of cell cycle-related genes between OS and PFS under different risk factors at Kaplan-Meier Plotter database. The high expression of CDK1, CDK5, CDC20, CCNA2, CCNB1 and CCNB2 was associated with poor PFS and OS induced by alcohol consumption (Figure 5). The high expression of CDK5, CDC20, CCNA2 and CCNB1 was only associated with poor OS of hepatitis virus. CDK1 was up-regulated in dismal PFS and OS with hepatitis virus. However, the mechanistic relationship between six cell cycle-related genes and viral-infected HCC remains to be further explored.
The relationship between the expression levels of CDK1, CDK5, CDC20, CCNA2, CCNB1 and CCNB2 and the prognosis of HCC with risk factors. (A) Relationship of up-regulation expression levels of six cell cycle-related genes with OS (n = 117) and PFS (n = 169) of HCC patients with AC, (B) The correlation between high transcription levels of six cell cycle-related genes with OS (n = 153) and PFS (n = 205) of HCC patients with HV.
Another important finding of our study was that cell cycle-related gene transcription was positively correlated with the infiltration level of B cell, CD8+ T cells, CD4+ T cells, macrophages, neutrophils and dendritic cells in HCC (Figure 6, Supplementary Table 2). Afterwards, the correlation between cell cycle-related gene expression and multiple immune cell marker genes suggests the role of these genes in regulating tumor immunology in HCC (Figure 7). Firstly, M1 macrophage markers such as PTGS2 were weakly correlated with cell cycle-related gene expression, while M2 macrophage markers such as MS4A4A, VSIG4 and CD163 were moderately or strongly correlated with CCNA2 and CCNB1 (Table 2, Supplementary Table 3). These results revealed the potential regulatory role of cell cycle-related genes in polarization of tumor-associated macrophages (TAM). In addition, TAMs-related immune interactions could be a potential indicator of cell cycle-related genes markers. Together our findings suggested that cell cycle-related genes play an important role in the recruitment and regulation of immune infiltrating cells in HCC.
The relationship between the expression of CDK1, CDK5, CDC20, CCNA2, CCNB1, CCNB2 and the level of HCC immune infiltration. The expressions of CDK1, CDC20, CCNA2, CCNB1 and CCNB2 were significantly positively correlated with the infiltration levels of B cells, CD8+ T cells, CD4+ T cells, neutrophils, macrophages and DCs in HCC (n = 457). CDK5 was positively correlated with infiltrating level of B cell, Macrophage, neutrophils and DCs.
The expression levels of CDK1, CDC20, CCNA2, CCNB1 and CCNB2 were correlated with the polarization of macrophages in HCC. Markers included CSF1R and CD86 of monocytes; IL10 and CD68 of TAMs (tumor-associated macrophages). (A) Scatterplots of correlations between six cell cycle-related genes expression and gene markers of monocytes. (B) Scatterplots of correlations between six cell cycle-related genes expression and gene markers of TAMs.
To further explore the mechanisms of cell cycle-related gene transcription associated with immune infiltration and poor prognosis, we constructed and analyzed related gene network using GO and KEGG methods (Figure 8). PLK1 (Polo-like kinase 1) plays a key role in regulating chromosome segregation, harmonizing centrosome, and mediating cytokinesis and meiosis [36-38]. The PLK1 pathway has been revealed to play an indispensable role in patients with advanced solid malignancies, and its overexpression is associated with poor prognosis in patients with cancers, such as HCC [39, 40]. Cell cycle-related genes may be involved in the PLK1 pathway to accelerate tumorigenesis.
Gene co-expression among HCC cases. (A) Gene co-expression among HCC cases (STRING). (B) Functions of CDK1, CDK5, CDC20, CCNA2, CCNB1 and CCNB2 showed positive correlation with these genes alterations. (C) Network of KEGG and GO enriched terms colored by clusters. (D) Network of KEGG and GO enriched terms colored by P-value (Metascape database).
In conclusion, we found that up-regulated expression of CDK1, CDK5, CDC20, CCNA2, CCNB1 and CCNB2 in HCC tissues was associated with poor prognosis, and significantly improved immune infiltration levels of CD8+T cells, CD4+ T cells, neutrophils, macrophages and DCs. Meanwhile, the high expression of these genes has a remarkably impact on the poor OS and PFS in HCC patients under viral infection or alcohol intake. Thus, we speculated that CDK1, CDK5, CDC20, CCNA2, CCNB1 and CCNB2 might be novel prognostic biomarkers and promising immunity therapeutic targets for HCC patients.
Supplementary Material
Supplementary figures and tables.
Acknowledgements
Funding
This study was supported by the National Natural Science Foundation of China (82172107, 31871244), Natural Science Foundation of Guangdong Province (2020A1515011314, 2021A1515011927, 2020B121206003), the District Key Laboratory Fund of Longgang District of Shenzhen City (LGKCZSYS2019000051), and Foundation of Beijing University of Chinese Medicine Department of Hepatopathy, Shenzhen Hospital (2020-BUCMSZYLRC04).
Author Contributions
AX and FW designed the project and revised the manuscript. YS analyzed the data and wrote the manuscript. JD and XC participated in discussion and searching the data. XS, SL and YW made a lot of work in language editing and revising the manuscript. All authors read and approved the final manuscript. FW and AX obtained funding and study supervision.
Data Availability
The data used to support the findings of this study are available from the corresponding author upon request.
Competing Interests
The authors have declared that no competing interest exists.
References
1. Sia D, Villanueva A, Friedman SL, Llovet JM. Liver Cancer Cell of Origin, Molecular Class, and Effects on Patient Prognosis. Gastroenterology. 2017;152(4):745-761
2. Marengo A, Rosso C, Bugianesi E. Liver Cancer: Connections with Obesity, Fatty Liver, and Cirrhosis. Annual review of medicine. 2016;67:103-117
3. Zhuang L, Yang Z, Meng Z. Upregulation of BUB1B, CCNB1, CDC7, CDC20, and MCM3 in Tumor Tissues Predicted Worse Overall Survival and Disease-Free Survival in Hepatocellular Carcinoma Patients. Biomed Res Int. 2018;2018:7897346
4. Waldman AD, Fritz JM, Lenardo MJ. A guide to cancer immunotherapy: from T cell basic science to clinical practice. Nature reviews Immunology. 2020;20(11):651-668
5. P Dariavach MGM, P Golstein, M P Lefranc. Human Ig superfamily CTLA-4 gene: chromosomal localization and identity of protein sequence between murine and human CTLA-4 cytoplasmic domains. Eur J Immunol. 1988;18(12):1901-1905
6. Lu P, Takai K, Weaver VM, Werb Z. Extracellular matrix degradation and remodeling in development and disease. Cold Spring Harbor perspectives in biology. 2011;3(12):a005058
7. Kubo N, Araki K, Kuwano H, Shirabe K. Cancer-associated fibroblasts in hepatocellular carcinoma. World journal of gastroenterology. 2016;22(30):6841-6850
8. Jones MC, Askari JA, Humphries JD, Humphries MJ. Cell adhesion is regulated by CDK1 during the cell cycle. The Journal of cell biology. 2018;217(9):3203-3218
9. Ragkousi K, Gibson MC. Epithelial integrity and cell division: Concerted cell cycle control. Cell cycle. 2018;17(4):399-400
10. Ardalani H, Sengupta S, Harms V, Vickerman V, Thomson JA, Murphy WL. 3-D culture and endothelial cells improve maturity of human pluripotent stem cell-derived hepatocytes. Acta biomaterialia. 2019;95:371-381
11. Rhodes DR, Kalyana-Sundaram S, Mahavisno V, Varambally R, Yu J, Briggs BB. et al. Oncomine 3.0: Genes, Pathways, and Networks in a Collection of 18,000 Cancer Gene Expression Profiles. Neoplasia. 2007;9(2):166-180
12. D'Arcangelo D, Giampietri C, Muscio M, Scatozza F, Facchiano F, Facchiano A. WIPI1, BAG1, and PEX3 Autophagy-Related Genes Are Relevant Melanoma Markers. Oxidative medicine and cellular longevity. 2018;2018:1471682
13. Wang B, Ran Z, Liu M, Ou Y. Prognostic Significance of Potential Immune Checkpoint Member HHLA2 in Human Tumors: A Comprehensive Analysis. Frontiers in Immunology. 2019;10:1573
14. Aran D, Sirota M, Butte AJ. Systematic pan-cancer analysis of tumour purity. Nature Communications. 2015;6(1):8971
15. Pu N, Chen Q, Gao S, Liu G, Zhu Y, Yin L. et al. Genetic landscape of prognostic value in pancreatic ductal adenocarcinoma microenvironment. Annals of Translational Medicine. 2019;7(22):645-645
16. Li B, Severson E, Pignon JC, Zhao H, Li T, Novak J. et al. Comprehensive analyses of tumor immunity: implications for cancer immunotherapy. Genome biology. 2016;17(1):174
17. Lian Q, Wang S, Zhang G, Wang D, Luo G, Tang J. et al. HCCDB: A Database of Hepatocellular Carcinoma Expression Atlas. Genomics, proteomics & bioinformatics. 2018;16(4):269-275
18. Chandrashekar DS, Bashel B, Balasubramanya SAH, Creighton CJ, Ponce-Rodriguez I, Chakravarthi B. et al. UALCAN: A Portal for Facilitating Tumor Subgroup Gene Expression and Survival Analyses. Neoplasia. 2017;19(8):649-658
19. Szklarczyk D, Gable AL, Lyon D, Junge A, Wyder S, Huerta-Cepas J. et al. STRING v11: protein-protein association networks with increased coverage, supporting functional discovery in genome-wide experimental datasets. Nucleic acids research. 2019;47(D1):D607-D613
20. Guan Y, Enejder A, Wang M, Fang Z, Cui L, Chen SY. et al: A human multi-lineage hepatic organoid model for liver fibrosis. Nature communications. 2021;12(1):6138
21. Khemlina G, Ikeda S, Kurzrock R. The biology of Hepatocellular carcinoma: implications for genomic and immune therapies. Molecular Cancer. 2017;16(1):149
22. Takai A, Dang HT, Wang XW. Identification of drivers from cancer genome diversity in hepatocellular carcinoma. Int J Mol Sci. 2014;15(6):11142-11160
23. Yang JD, Roberts LR. Hepatocellular carcinoma: A global view. Nature reviews Gastroenterology & hepatology. 2010;7(8):448-458
24. Jochems C, Schlom J. Tumor-infiltrating immune cells and prognosis: the potential link between conventional cancer therapy and immunity. Experimental biology and medicine. 2011;236(5):567-579
25. Takebe T, Zhang RR, Koike H, Kimura M, Yoshizawa E, Enomura M. et al. Generation of a vascularized and functional human liver from an iPSC-derived organ bud transplant. Nature protocols. 2014;9(2):396-409
26. Malumbres M, Barbacid M. Cell cycle, CDKs and cancer: a changing paradigm. Nature reviews Cancer. 2009;9(3):153-166
27. Malumbres M, Sotillo R, Santamaria D, Galan J, Cerezo A, Ortega S. et al. Mammalian cells cycle without the D-type cyclin-dependent kinases Cdk4 and Cdk6. Cell. 2004;118(4):493-504
28. Arif A. Extraneuronal activities and regulatory mechanisms of the atypical cyclin-dependent kinase Cdk5. Biochemical Pharmacology. 2012;84(8):985-993
29. Alfonso-Perez T, Hayward D, Holder J, Gruneberg U, Barr FA. MAD1-dependent recruitment of CDK1-CCNB1 to kinetochores promotes spindle checkpoint signaling. The Journal of cell biology. 2019;218(4):1108-1117
30. Yu H. Cdc20: A WD40 Activator for a Cell Cycle Degradation Machine. Molecular Cell. 2007;27(1):3-16
31. Zhao D, Chen S, Duo S, Xiang C, Jia J, Guo M. et al. Promotion of the efficient metabolic maturation of human pluripotent stem cell-derived hepatocytes by correcting specification defects. Cell research. 2013;23(1):157-161
32. Dong S, Huang F, Zhang H, Chen Q. Overexpression of BUB1B, CCNA2, CDC20, and CDK1 in tumor tissues predicts poor survival in pancreatic ductal adenocarcinoma. Bioscience reports. 2019;39(2):BSR20182306
33. Kato T, Daigo Y, Aragaki M, Ishikawa K, Sato M, Kaji M. Overexpression of CDC20 predicts poor prognosis in primary non-small cell lung cancer patients. Journal of surgical oncology. 2012;106(4):423-430
34. Gayyed MF, El-Maqsoud NM, Tawfiek ER, El Gelany SA, Rahman MF. A comprehensive analysis of CDC20 overexpression in common malignant tumors from multiple organs: its correlation with tumor grade and stage. Tumour biology: the journal of the International Society for Oncodevelopmental Biology and Medicine. 2016;37(1):749-762
35. Gao Q, Zhu H, Dong L, Shi W, Chen R, Song Z. et al. Integrated Proteogenomic Characterization of HBV-Related Hepatocellular Carcinoma. Cell. 2019;179(2):561-577
36. Olesen K, Rodin S, Mak WC, Felldin U, Osterholm C, Tilevik A. et al. Spatiotemporal extracellular matrix modeling for in situ cell niche studies. Stem cells. 2021;39(12):1751-1765
37. Matsuda M, Seki E. The liver fibrosis niche: Novel insights into the interplay between fibrosis-composing mesenchymal cells, immune cells, endothelial cells, and extracellular matrix. Food and chemical toxicology: an international journal published for the British Industrial Biological Research Association. 2020;143:111556
38. Li M, Liu Z, Wang X. Exploration of the Combination of PLK1 Inhibition with Immunotherapy in Cancer Treatment. Journal of oncology. 2018;2018:3979527
39. Parrilla A, Barber M, Majem B, Castellvi J, Morote J, Sanchez JL. et al. Aurora Borealis (Bora), Which Promotes Plk1 Activation by Aurora A, Has an Oncogenic Role in Ovarian Cancer. Cancers. 2020 12(4)
40. Parrilla A, Cirillo L, Thomas Y, Gotta M, Pintard L, Santamaria A. Mitotic entry: The interplay between Cdk1, Plk1 and Bora. Cell cycle. 2016;15(23):3177-3182
Author contact
![]() Corresponding authors: Anlong Xu (E-mail: xuanlongedu.cn); Fenfang Wu (E-mail: wufenfang19com).
Corresponding authors: Anlong Xu (E-mail: xuanlongedu.cn); Fenfang Wu (E-mail: wufenfang19com).