Impact Factor ISSN: 1837-9664

 Global reach, higher impact
J Cancer 2023; 14(5):707-716. doi:10.7150/jca.81050 This issue Cite
Research Paper
Rapid microRNA detection method based on DNA strand displacement for ovarian cancer cells
Gege Sun1,*, Congzhou Chen2,*, Xin Li1, ![]() , Shangwei Hong3, Chuanqi Gu1, Xiaolong Shi3
, Shangwei Hong3, Chuanqi Gu1, Xiaolong Shi3
1. Department of Gynecology 2, Renmin Hospital of Wuhan University, 430072, Wuhan, China
2. School of Computer Science, Beijing University of Technology, 100124, Beijing, China
3. Institute of Computing Science & Technology, Guangzhou University, 510006, Guangzhou, China
* These authors contributed equally to this work
Received 2022-11-20; Accepted 2023-2-26; Published 2023-3-13
Abstract

The current cancer detection methods are heavily dependent on the component analysis of corresponding cancer antigens. There is a lack of effective and simple clinical methods of ovarian cancer screening, which hinders the early identification for ovarian cancer and its treatment. To develop a simple and rapid method for quantitative analysis of ovarian cancer, we developed a DNA strand displacement-based method and finished the rapid detection of miR-21 in ovarian cancer cells within 5 min by a one-step isothermal reaction. The fluorescence intensity trajectory had a good linear relationship with miR-21 concentrations in the range of 100 fM-100 nM, with a lower limit of 6.05 pM. This detection method is simple, faster, and accurate. Besides, it can be applied to detect the miRNA biomarkers of other cancers by changing the preset sequences of toehold.
Keywords: ovarian cancer, miR-21 detection, DNA isothermal strand displacement reaction
Introduction
Ovarian cancer is the most aggressive gynecologic malignancy. According to the global cancer statistics, ovarian cancer-related deaths accounted for 23.3% of the total incidences in 2018 [1], ranking among the top causes of cancer-related deaths. Ovarian cancer has an insidious onset and is difficult to diagnose, while the mortality rate in the middle and late stages is high. The lack of early identification methods makes it difficult for effective intervention and treatment [2].
High miR21 expression is regarded as a crucial indicator of ovarian cancer in clinical ovarian cancer examinations. miR21 is expected to have great potential in tumor diagnosis and therapy [3, 4]. Dynamic monitoring of miR-21's expression in human circulating blood could provide intuitive and visual guidance for early tumor diagnosis, chemotherapy efficacy evaluation, and prognosis prediction. miR21's upregulation promotes the proliferation and invasion of ovarian cancer cells, inhibits apoptosis, and is strongly associated with the development of chemotherapy resistance [5].
Relevant literature has found that miR-21 can be used as a biomarker for the diagnosis of a variety of cancers. For example, some studies have shown that miR-21 in extracellular vesicles in cerebrospinal fluid can be used as a biomarker for the diagnosis of glioma. miR-21 is also significant in the diagnosis of prostate cancer, and miR-21 expression in serum and stool can be used as a potential diagnostic indicator for colorectal cancer. A related meta-analysis also showed that serum miR-21 has good diagnostic value in ovarian cancer [6, 7]. Besides, higher expression of miR-21, 92 and 93 in the serum of patients with ovarian cancer before CA-125 elevation suggests that miR-21 can be used as a marker for early diagnosis [3]. Except for the diagnostic value, miR-21 affects the proliferation and apoptosis of ovarian cancer cells by regulating the PTEN/PI3K/AKT pathway [4] and the jagged-1 pathway [8], and it regulates ovarian cancer cell invasion, migration, and colony formation through the Wnt/CD44v6 pathway [9]. Upregulation of miR-21 was observed to be positively correlated with tumor grade and stage in ovarian cancer tumor tissues [10]. Therefore, it is reasonable to consider miR-21 as a specific diagnostic marker for the detection of ovarian cancer.
Currently, miRNA biomarker-based ovarian cancer screening mainly relies on exponential amplification methods [11, 12], such as quantitative reverse transcription polymerase chain reaction (qRT-PCR) [13], Northern blotting [14], microarray [15], and RNA sequencing [16]. However, a slight variation in the serum sample might have a great deviation on these ultra-high sensitivity techniques. Therefore, it is extremely demanding in terms of experimental technique. Meanwhile, studies have found that miR-21 exists in various cells, tissues, and blood samples [17]. Ultrasensitive detection findings can only reveal the target gene's presence but not its quantity. For an early diagnosis, the expression should be quantified, and the concentration range for a disease diagnosis should be determined.
Therefore, it is meaningful to design a method that is convenient, fast, non-PCR dependent, and can quantify the miRNA expression in serum samples. To solve this problem, we designed a toehold-mediated strand displacement reactions (TSDR)-based method to quantify the expression of miRNA21 and to achieve the early diagnosis of ovarian cancer.
TSDR was first proposed by Yurke et al. [18]. It involves three main processes as follows: toehold binding, branching chain migration, and chain dissociation [19]. Specifically, TSDRS is driven by Gibbs free energy. A short invading strand binds to the toehold region on the DNA or RNA double strand, undergoes higher affinity base complementary pairing through progressive strand displacement, and then gradually replaces the original single strand bound to the underlying gating strand. Finally, the complex forms a more stable double-strand structure [20, 21]. By changing the sequence and length of the toehold, the strand displacement rate constant may vary by more than 106 folds [22]. This kinetic change is similar to the strand replacement reaction with DNA duplex and RNA duplex as substrates [23].
So far, TSDRs have been applied in various fields, including biocomputing systems [24-27], artificial neuro systems [28, 29], bio-electronical circuits [30, 31], and biosensors [32, 33]. In the field of biosensors, many remarkable works have been accomplished.
Mohammadniaei et al. designed a nonenzymatic isothermal strand displacement and amplification assay (NISDA) based on TSDR. They used intercalating nucleic acid technology to enhance binding affinity. Severe acute respiratory syndrome coronavirus 2 (SARS-CoV-2) was detected by NISDA [34]. Gao et al. [35] combined carbon dot (CD)-labeled fuel DNA and graphene oxide, and developed a fluorescent biosensor to detect miRNA let-7a. If let-7a is present, two consecutive toehold-mediated strand displacement reactions (TSDRs) are triggered, fuel DNA-CDs separate from the graphene oxide surface, and the fluorescence signal can be recovered. These novel biosensors consisted of two reactions, signal recognition and signal enhancement, which greatly improved the detection efficiency. Chen et al. [36] developed a new self-assembled DNA nanoprobe to measure the expression of miR-21. When miR-21 was present, three DNA hairpin probes equipped with free G-quadruplexes turned on assembly to form DNA nanospheres, which increased the fluorescence emission intensity of thioflavin.
Although these assays can detect target genes with high sensitivity, the operation is complicated and time-consuming, which is not conducive to the clinic. Besides, most of these assays only analyze a single indicator. Traditional assays detect the presence of target gene expression in a lesion as well as provide a qualitative judgment. The up- or downregulation of a target gene should be judged by an experienced physician. Due to these limitations, it is important and clinically relevant to develop a quantitative assay with convenient, fast, non-PCR properties.
Here, we propose a non-laboratory, enzyme-free, simple, and structurally stable isothermal strand displacement reaction for the rapid analysis of miR-21. We designed two toehold domains in the loop region and 3' end free stem region of the hairpin probe HP1. Generally, toehold either locates at the loop of the hairpin strand or at the stem of the hairpin. The reaction efficiency would be hampered when the toehold domain sites at the loop. As the toehold domain "hidden" in the metastable DNA structure [37]. When the toehold domain sits at the stem of the hairpin, it will affect the efficiency of DSD reactions. Toehold overhang at the end of the hairpin stem region requires internal fluorophore or quencher labeling, which imposes more cost and improper quenching of the fluorophore. More importantly, these molecular tools are not efficient for long DNA or RNA targets (the whole genome), and they typically use enzymatic steps to produce short cDNAs for subsequent signal amplifications [34]. The addition of the two toehold domains does not affect the labeling of the fluorophore and quencher but also facilitates the invasion of the target chain and accelerates the reaction efficiency.
Materials and Methods
Materials and reagents
The ovarian cancer cell line (SKOV3) and human normal ovarian epithelial cell line (IOSE80) were purchased from China Center for Type Culture Collection (Wuhan, China). Fetal bovine serum (FBS) and Roswell Park Memorial Institute (RPMI) 1640 media were obtained from Gibco (Shanghai, China). Total RNA extraction kit, microRNA Reverse Transcription Kit, and 2× SYBR Green qPCR master mix were supplied by Sangon Biotech Co., Ltd. (Shanghai, China). RNA-related operations required the involvement of Rnase-free water.
Preparation of the testing system
The sequence of miR-21 was obtained from the NCBI (National Center for Biotechnology Information). Hairpin DNA structures HP1 and HP2 were designed and free Gibbs energy (ΔG) calculations were performed with a Nupack webserver (http://www.nupack.org/), with the following parameters: Tm ≥ 37°C; ΔG ≤ -13.9 kcal mol-1; 30% ≤ GC% ≤ 55% (Table 1). Mimic-miR21, HP1, and HP2 in were solubilized with 1× TAE Mg2+ (40 mM Tris, pH = 8.2, 2 mM EDTA,12.5 mM Mg2+) buffer. Annealing of HP1 and HP2 was completed by gradual cooling from 95°C to room temperature in 5 min, and finally stored at 4°C. All oligonucleotide sequences are listed in Table 2.
Analytical data corresponding to the predicted binding energy (ΔG) at 37 °C, melting temperature (Tm), GC content (GC%), and base pair formation of different probes
| Target gene | Oligo | 37°C ΔG (kcal mole-1) | Tm (°C) | GC % | Base pairs |
|---|---|---|---|---|---|
| miR21 | HP1 | -13.9 | 64,1 | 39.6 | 15 |
| HP2 | -15.27 | 66.5 | 41.5 | 15 | |
| HP1:HP2 duplex | -53.46 | - | - | 30 | |
| HP1:miR-21 (cDNA) duplex | -30.44 | - | - | 25 | |
| HP1:miR-21 duplex | -27.67 | - | - | 22 |
Oligonucleotides sequences
| Oligo name | Sequence 5'-3' |
|---|---|
| miR-21 | UAGCUUAUCAGACUGAUGUUGA |
| Mimic-miR21 | TAGCTTATCAGACTGATGTTGA |
| HP1-FAM/BHQ | BHQ1-TAGCTTATCAGACTGCAACCTACTCAACATCAGTCTGATAAGCTAATG-FAM |
| HP1#-FAM/BHQ | BHQ1-TAGCTTATCAGACTGCAACCTACTCAACATCAGTCTGATAAGCTA-FAM |
| HP2 | CAACCTACTCAACATTAGCTTATCAGACTGATGTTGAGTAGGTTGCAGTCTGA |
| miR-10b | UACCCUGUAGAACCGAAUUUGUG |
| miR-196a | UAGGUAGUUUCAUGUUGUUGGG |
| miR-21 forward primer | TTTTTTTTTTCAACAT |
| miR-21 reverse primer | AGTGCAGGGTCCGAGGTATT |
| U6 forward primer | AGAGAAGATTAGCATGGCCCCTG |
| U6 reverse primer | ATCCAGTGCAGGGTCCGAGG |
PAGE analysis
The 12% PAGE (polyacrylamice gel electrophoresis) was performed in 6 mL of 1× TAE buffer, 3 mL of polyacrylamide, 60 µL of 10% ammonium persulfate and 6 µL of tetramethylethylenediamine (TMED). Gels were set by leaving at RT for 20 min. The reacted DNA samples and 6× DNA loading buffer were mixed at a 5:1 ratio and the mixture was then added to the samples in a certain order. Electrophoresis was performed in 1× TAE running buffer at 80 V constant voltage for 120 min. Then, the products were placed in GelRed DNA gel stain solution for 15 min and the gel image was obtained using the JY04S-3C Gel Documentation Imaging System (Beijing).
Serum stability analysis
HP1 and HP2 were incubated with 10% FBS in a metal bath at 37°C for 0-12 h. The difference in stability of HP1 and HP2 over time was confirmed via agarose gel electrophoresis.
Cell culture and total RNA extraction
IOSE80 and SKOV3 cells were grown in RPMI 1640 with 1% penicillin-streptomycin solution and 10% FBS. The incubator was kept at a constant temperature of 37°C and filled with 5% CO2.
All tips and tubes used for RNA experiments were enzyme-free. Total RNA was extracted from the cells using the Trizol method. Add Trizol (1 ml) to a 6 cm dish, let stand for 2 min, then transfer to a new 1.5 ml tube. leave for 5 min at RT to achieve cell lysis. Add 200 μL of chloroform to each tube, mix upside down for 15 s, and allowed to stand for 2 min, and the tubes were centrifuged at 4°C and 12000×g for 15 min. RNA was then transferred to a new 1.5 mL tube. Next, 500 µL of isopropanol was added to each tube, mixed for 15 s, and then left to stand at RT for 5 min before centrifuging the samples at 4°C, 12,000 x g for 10 min for RNA precipitation. The upper supernatant was discarded and left to dry for 5 minutes. One mililiter of 75% ethanol prepared with DEPC water was added to each tube and centrifuged at 7500×g for 5 min at 4°C. To remove excess ethanol, discard the supernatant and air dry again for 10 minutes. Finally, add 30 μL of DEPC water to each tube to dissolve it.
qRT-PCR and linear PCR
The mixture for microRNA reverse transcription contains 2 x miRNA qRT solution mixture (10 µL), miRNA qRT enzyme mixture (2 µL) and total RNA (2 µg), and made up with RNase-free water to 20 µL. The procedure was performed as follows: 37°C for 1 h and 85°C for 5 min. Then, the reaction products were placed in -20°C refrigerator for freezing and storage.
The newly synthesized cDNA were served as a template for qRT-PCR. The solution mixture was prepared as follows: 2× miRNA qPCR master mix (10 µL), forward primer(0.5ul) and reverse primer (0.5 µL), cDNA (2 µL), and RNase-free water (7 µL). The qPCR was run for 39 cycles as follows: 95°C for 5 s and 60°C for 30 s. The relative expression of cell samples was assessed with U6 gene expression as a reference (Table 2).
Linear PCR was performed using MicroRNA qPCR Kit. The reaction mixture was prepared as follows: 2× miRNA qPCR master mix (10 µL), miR21-forward primer (0.5 µL), cDNA (1 µL), and RNase-free water (8.5 µL). qPCR was run for 40 cycles as follows: 95°C for 5 s, 60°C for 10 s.
miR-21 detection
The detection mixture consisted of 1 µL of HP1 (150±2ng/µL), 2 µL of HP2 (215±3ng/µL), 1 µL of miR-21 (80±2ng/µL) and 6 µL of RNase-free water. Incubate at 37°C for 60 min.
Statistical analysis
Statistical analysis was carried out using GraphPad Prism 8. At least three independent replications were performed for each experimental data acquisition. Data were expressed as the mean ± standard deviation. An unpaired two-tailed t-test was used to calculate the difference between the two groups, and a p-value of < 0.05 was considered significant.
Results
Principle of assay
As shown in Fig. 1 and Fig.2, this RNA detection method contains only two DNA hairpins, HP1 and HP2. Mimic-miR21 (Synthesized ss-DNA with the same sequence of miR21) was used as the invasion chain to validate the feasibility of the protocol. BHQ1 quencher and FAM fluorophore were labeled at the 5' end and 3' end of HP1, respectively.
Schematic diagram of the RNA detection system. (A) Double toehold hairpin probe HP1 comparing with single toehold hairpin probe HP1#, a1 is the toehold domain in the loop region while a2 is a free toehold at 3' end. Black point at 5' end of HP1 indicates the BHQ1 quencher, and yellow point at 3' end indicates the 6-Fam fluorescent group. (B)Practical efficiency of the double toehold sequence. With the presence of miR-21 (cDNA), it can also play a dual role in binding to a2, which is more efficient than HP1# application. (C) Schematic design of the hairpin probe HP2. (D) The reaction of miR-21 with HP1 to form an unstable double chain, and its chain substitution reaction with HP2 is shown in the flow chart.
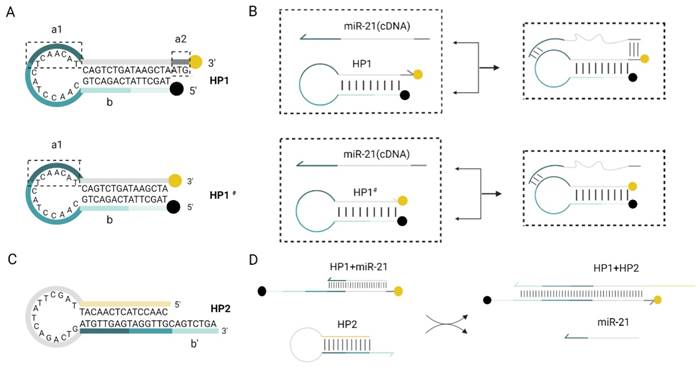
Flow chart for rapid detection of miR-21. (A) Scheme diagram of the testing program. (B) The reaction mixture includes 3 critical components, hairpin probes HP1, HP2 and miR21. 2-step toehold-mediated strand replacement reaction occurs sequentially in the presence of invading strand RNA/DNA, and fluorescence detection is performed at 37°C, 30 min.
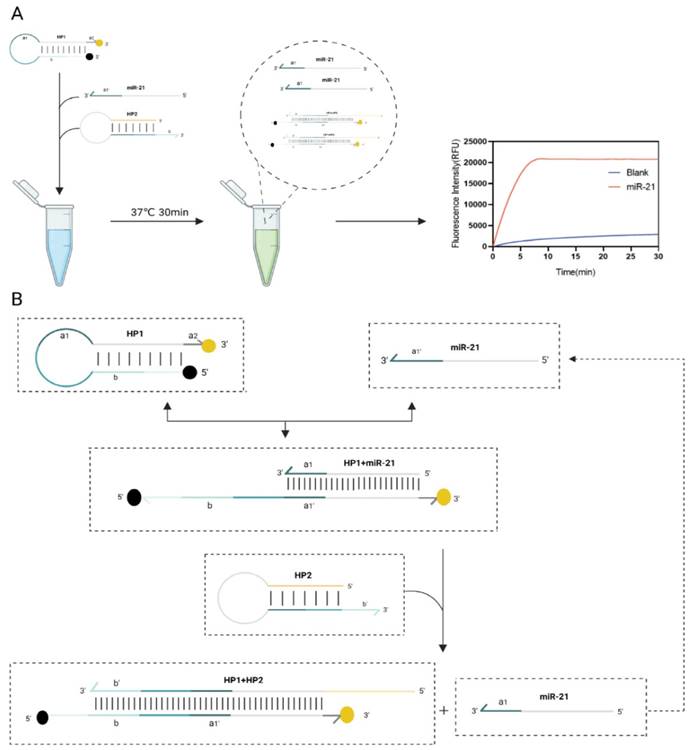
When miR-21 was present, it recognized double toehold a1and a2 of HP1. HP1 was gradually unchained and the fluorescence is restored. After this DNA strand displacement reaction, a new toehold domain b of HP1 was exposed. It could pair with the b' domain of HP2, free outside the stem-loop, which in turn gradually displaces miR-21 a more stable HP1:HP2 double chain, and the fluorescence can be continuously excited. Finally, the displaced miR-21 continued into the next DNA strand displacement reaction cycle. This fluorescence amplification process can detect RNA with high sensitivity. After 30 min of reaction at 37°C, almost all HP1 and HP2 were bound into stable duplexes and the fluorescence signal intensity increased significantly.
Design of molecular structure
We selected mir-21 to be tested in our study. Due to the stringent requirements for temperature and enzyme-free environment for conducting RNA-related experiments, previously published conditions [18] were not conducive to demonstrating the superiority of our assay. Therefore, we chose mimic-miR21 for the follow-up experiments.
Validation of the advantages of the dual toehold was also performed. Two toehold sequences, a1 and a2, were designed on HP1. The toehold a1 was located in the loop region of HP1, which could bind to miR-21 and undergo a strand displacement reaction. The toehold a2 was an ATG sequence free outside the stem at the 3' end of HP1. HP1 with only toehold a1 and the HP1 with double toehold a1 and a2 were incubated with HP2 and miR-21, respectively, at 37°C. Comparing the reaction time and fluorescence signal intensity between the two groups, we found that the addition of toehold a2 did not affect the reaction rate (Fig. 3D and E). The double toehold sequence was designed to apply the assay in practice better. We first amplified the cDNA generated via reverse transcription with the tailing method, and the amplified product base extended out of the CAT sequence, which had complementary base pairing with the toehold a2. The unzipping of the hairpin structure of HP1 was because the toehold sequence free outside the hairpin structure was more likely to bind to the foreign single strand than the toehold sequence contained in the loop region. Therefore, the addition of toehold c greatly increased the efficiency of DNA strand displacement in practical applications. Meanwhile, the RNA single strand could bind directly to the toehold a1. The addition of toehold a2 did not affect the invasion of RNA.
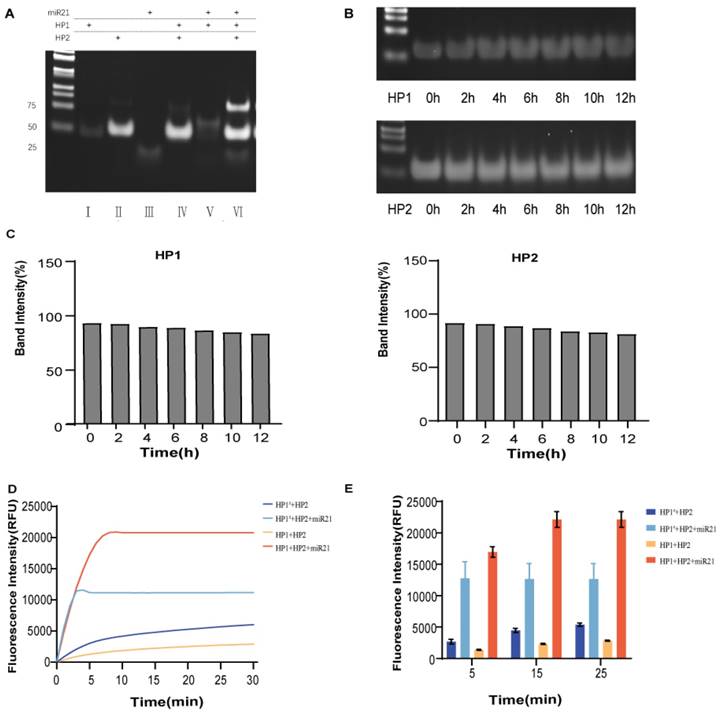
Rapid miR21 detection by the double toehold hairpin system. (A) PAGE analysis of the feasibility of this assay protocol. Lane 1: HP1. lane 2: HP2; lane 3: mimic-miR21; lane 4: HP1+HP2; lane 5: HP1+mimic-miR21; lane 6: for HP1+HP2+mimic-miR21. (B) PAGE analysis of the stability of hairpin probes HP1 and HP2 at 12 h incubation in 10% FBS. (C) Semiquantitative analysis of the relative band intensity. (D) Fluorescence was collected by real-time quantitative PCR instrument to compare the difference in the change of reaction rate between the double toehold HP1 and single toehold HP1# participation. (E) The fluorescence values of each group at 5 min, 15 min and 25 min were taken as graphs to quantitatively compare the difference in the rate of change of the reaction involving a double toehold HP1 and a single toehold HP1#. Error bars were calculated in three independent experiments.
Optimization of optimal conditions
The stability of HP1 and HP2 was affected by temperature. At incubation temperatures lower than the optimal temperature, the free energy of the hairpin decreased and its stability increased, making it less likely to be unzipped by the invasion chain. When the incubation temperature was too high, the HP1 and HP2 would spontaneously unwind to form a small amount of HP1:HP2 duplexes in the presence of no target molecules, producing a certain fluorescence leakage and giving a false positive result. Therefore, we optimized the incubation temperature by comparing the fluorescence intensity at different incubation temperatures. Fig. 4A shows the fluorescence intensity change curve of the input group incubated at different temperatures of 36 - 42°C at 30 min. When incubated at 36-38°C, the fluorescence intensity was found to be proportional to temperature. After about 5 min, one could make a clear diagnosis by the obvious difference in fluorescence response, and the fluorescence intensity reached the maximum within 15 min. At reaction temperatures above 38°C, the fluorescence intensity gradually decreased with increasing incubation temperature. At 38°C, the fluorescent group and the quencher were stably separated and the fluorescence signal intensity was the strongest due to the stable double strands formed by HP1 and HP2. When the temperature exceeded the optimum, the duplex became unstable, in which case the partially free single-strand HP1 became aggregated. The fluorophore and quencher were in close proximity to each other, resulting in a decrease in fluorescence signal intensity, resulting in a decrease of fluorescence signal intensity. signal intensity. Although the fluorescence intensity reached its maximum at 38°C, similar experimental results were obtained for the reaction at 37°C. To explore the clinical value better, 37°C was chosen as the optimum temperature for subsequent experiments.
Optimization of reaction conditions. (A) Optimal reaction temperature for this assay method. (B) Optimal reaction time for this assay method. Error bars were calculated in three independent experiments.
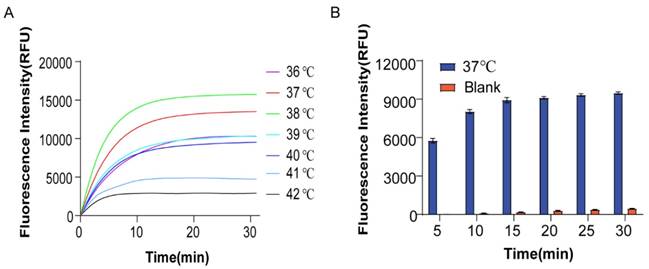
We also optimized the optimal reaction time. As shown in Fig. 4B, after adding miR-21, the fluorescence signal was not recovered after incubation at 37°C for 15 min, implying that the reaction was completed. Therefore, we selected 15 min for the optimum reaction time. At the same time, it was easy to observe the results as the obvious fluorescence effect appeared after 5 min incubation at 37°C, indicating fast detection.
Validation of sensitivity and specificity
The sensitivity of the assay was assessed by testing it under optimal reaction conditions. Fig. 5A and 5B show that the fluorescence intensity increased with the increase of target chain concentration (10-100 nm). Fig. 5C shows a good linear relationship between the ratio of fluorescence signal intensity/blank control fluorescence signal intensity (F/F0) and CmiR-21 for each group after 5, 15, and 25 min.
Validation of sensitivity and specificity. (A) Fluorescence change when miR-21 concentration is at 0-50nm. (B) Fluorescence change when miR-21 concentration was at 50-100 nm. (C) Changes in F/F0 with miR-21 concentration when the reaction time was 5 min, 15 min, 25 min, respectively. (D) Fluorescence change when miR-21 concentration was varied at 1nm, 100pm, 10pm, 1pm, 100fm. (E) Change of F/F0 with miR-21 concentration. (F) The sequences of the detection of different miRNA targets. (G) Selectivity of the assay for miRNA-21 detection.
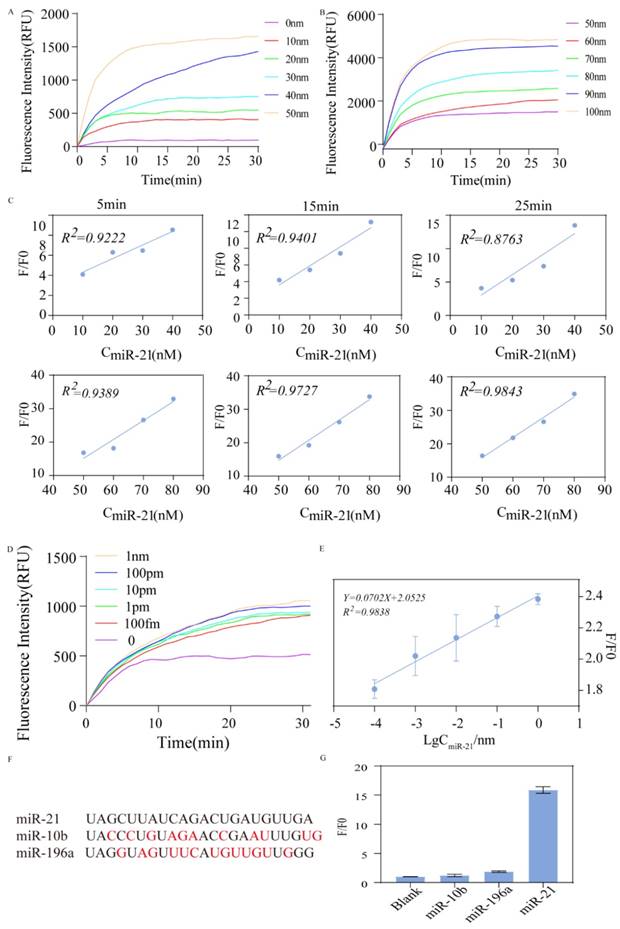
To further validate the detection sensitivity limit of this protocol, we observed changes in fluorescence signal intensity when miR21 concentrations were 10-4, 10-3, 10-2, 10-1, and 1 nm. As shown in Figure 5D, the higher the concentration of miR21, the faster the fluorescence signal was saturated. Even at very low template concentrations (down to 100 fm), a rapid fluorescence effect was detected within 30 min. The corresponding F/F0 was graphed against LogCmiR-21 as shown in Fig. 5E to obtain a calibration curve with a linear relationship. The regression equation is Y=0.0702X+2.0525 (R2=0.9838) (Y means F/F0 and X means the concentration of miR-21). The LOD was 6.05 pm.
To assess the specificity of the method, we added different invasion chains under the same experimental conditions. The fluorescence signal intensity of miR-21, miR-10b, miR-196a, and blank control was compared. The corresponding F/F0 for each group was 1, 1.22, 1.87, and 15.87, respectively. A strong fluorescent signal was observed with miR-21 as the input, while the nonspecific molecule's fluorescence signal intensity approached that of the blank, showing the extremely high specificity of the scheme. There was little interference or crosstalk between non-target chains (Fig. 5F and G).
Detection of miR-21 in actual samples
As Fig. 6A shown, RNA was extracted from SKOV3 and IOSE80, and cDNA was obtained via reverse transcription to verify the actual application of the assay. First, the expression of miR21 in two cell lines was verified using qRT-PCR, and the results revealed that miR21 was overexpressed in SKOV3 (Fig. 6B). cDNA was amplified and the products were mixed with HP1 and HP2 after 40 cycles and incubated at constant temperature for 15 min. The results showed different expression levels of miR21 in the two types of cell lines, and the differences with the blank control group were obvious (Fig. 6C). This result was in accordance with the RT-qPCR assay. Similarly, we used synthetic miR-21 RNA samples as input to verify the feasibility of this scheme and found that the RNA as the invasion strand could also catalyze the strand replacement reaction with satisfactory experimental results (Fig. 6D).
Rapid Detection of ovarian cancer cells. (A) qRT-PCR detection of miR-21 expression in IOSE80 and SKOV3. (B) After extracting total RNA from IOSE80 and SKOV3, respectively, the reverse transcribed product was used as the invasion strand to observe the fluorescence changes. (C) The fluorescence changes of different groups at different incubation times of 5 min, 15 min and 25 min were quantified by doing histogram analysis. (D) Fluorescence change over time by using the synthesized miR-21 directly as input.
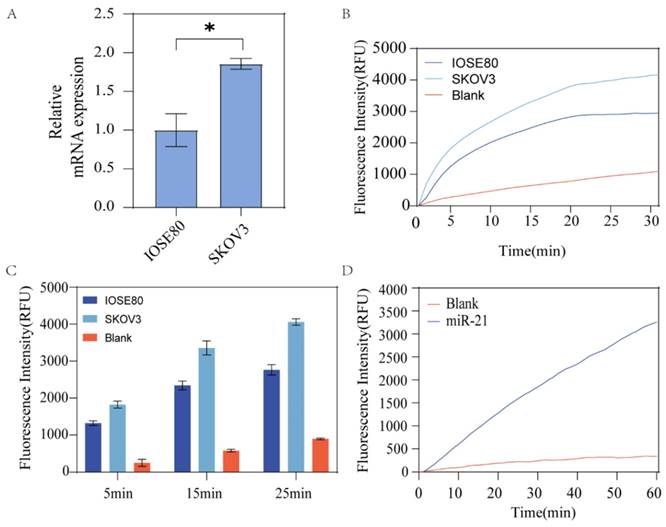
These results showed that miR-21 expression was upregulated in SKOV3, and the results were statistically different. Figure 6B shows the results of the actual sample assay in the reaction, showing that the SKOV3 group produced stronger fluorescence compared to the IOSE80 group, and the assay results converged with qrt-pcr, validating the feasibility of the assay protocol.
Conclusion
In this study, we developed a rapid isothermal signal amplification assay without enzyme involvement for the detection of miR-21 in ovarian cancer cells. We added target genes, HP1 and HP2 to amber EP tubes, and the fluorescence signal can be detected. The lower detection limit of LOD is 6.05 pM. In addition, quantitative analysis based on the change in fluorescence intensity at miR21 concentrations from 10-100 nM revealed a good linear relationship between miR21 concentration and F/F0. The serum stability results of HP1 and HP2 showed superior stability of the molecular structures.
To apply this assay, we built the hairpin probe HP1 with double toehold regions. Compared with single toehold assays, such as NISDA, adding a short sequence of 3 base length footholds at the free end does not affect fluorophore termination. Additionally, this strategy can make HP1 more susceptible to hybridization with miR-21, which forms an irreversible and stable double-stranded structure. The twin-toehold design is RNA and DNA compatible. This reduces response time and boosts fluorescence intensity.
Our study revealed that this assay can rapidly detect mir21 in ovarian cancer cells within 5 min at the optimal temperature of 37°C, with a limit of detection as low as 6.05 pM. Meanwhile, the quantitative analysis revealed a good linear relationship between F/F0 and the concentration of miR-21 in the range of 10 nm-100 nm. Further, the assay was able to distinguish between miR-21 expression in ovarian cancer cells and normal ovarian epithelial cells. The detection results converged with the validation of qPCR with high specificity. It is well known that there is still a lack of clinical methods to perform large-scale screening of people at high risk for ovarian cancer development, and our assay is simple, rapid, and combines high sensitivity and specificity for all types of medical sites. By changing the sequence of the toehold, we are able to build a universal platform for the detection of other genes.
Acknowledgements
This study was supported by the National Natural Science Foundation of China under grants 621722302, 62072129, and 62272009.
Competing Interests
The authors have declared that no competing interest exists.
References
1. Bray F, Ferlay J, Soerjomataram I. et al. Global cancer statistics 2018: GLOBOCAN estimates of incidence and mortality worldwide for 36 cancers in 185 countries. CA: a cancer journal for clinicians. 2018;68(6):394-424
2. Holschneider C H, Berek J S. Ovarian cancer: epidemiology, biology, and prognostic factors. Semin Surg Oncol. 2000;19(1):3-10
3. Resnick KE, Alder H, Hagan JP. et al. The detection of differentially expressed microRNAs from the serum of ovarian cancer patients using a novel real-time PCR platform. Gynecol Oncol. 2009;112(1):55-9
4. Liu HY, Zhang YY, Zhu BL. et al. miR-21 regulates the proliferation and apoptosis of ovarian cancer cells through PTEN/PI3K/AKT. Eur Rev Med Pharmacol Sci. 2019;23(10):4149-4155
5. Hao B. and J Zhang. miRNA-21 inhibition suppresses the human epithelial ovarian cancer by targeting PTEN signal pathway. Saudi J Biol Sci. 2019;26(8):2026-2029
6. Qiu L, Weng G. The diagnostic value of serum miR-21 in patients with ovarian cancer: a systematic review and meta-analysis. J Ovarian Res. 2022;15(1):51
7. Shi J. Considering Exosomal miR-21 as a Biomarker for Cancer. J Clin Med. 2016;5(4):42
8. Li X, Tao S, Dong L. et al. MiR-21 promotes proliferation and inhibits apoptosis of ovarian cancer cells via targeted regulation of jagged-1 pathway. Panminerva Med. 2019 DOI: 10.23736/s0031-0808.19.03720-0
9. Wang Y, Yang X, Yuan M. et al. Promotion of ovarian cancer cell invasion, migration and colony formation by the miR-21/Wnt/CD44v6 pathway. Oncol Rep. 2019;42(1):91-102
10. Chen Y, Chen Q, Liu Q. et al. Human epididymis protein 4 expression positively correlated with miR-21 and served as a prognostic indicator in ovarian cancer. Tumour Biol. 2016;37(6):8359-65
11. Peng S. et al. Integrating CRISPR-Cas12a with a DNA circuit as a generic sensing platform for amplified detection of microRNA. Chem Sci. 2020;11(28):7362-7368
12. Yu L. et al. Electrochemiluminescence Biosensor Based on Entropy-Driven Amplification and a Tetrahedral DNA Nanostructure for miRNA-133a Detection. Anal Chem. 2021;93(34):11809-11815
13. Mayer G, J Muller, CE Lunse. RNA diagnostics: real-time RT-PCR strategies and promising novel target RNAs. Wiley Interdiscip Rev RNA. 2011;2(1):32-41
14. Varallyay EJ Burgyan, Z Havelda MicroRNA detection by northern blotting using locked nucleic acid probes. Nat Proto. 2008; 3(2): 190-6.
15. Li W, K Ruan. MicroRNA detection by microarray. Anal Bioanal Chem. 2009;394(4):1117-24
16. Chen C. et al. Integrated sRNAome and RNA-Seq analysis reveals miRNA effects on betalain biosynthesis in pitaya. BMC Plant Biol. 2020;20(1):437
17. Yang Y. et al. Prognostic role of circulating microRNA-21 in cancers: evidence from a meta-analysis. Tumour Biol. 2014;35(7):6365-71
18. AJ Turberfield, J Mitchell, Yurke B. et al. DNA fuel for free-running nanomachines. Physical review letters. 2003;11(90):118102
19. Chen RP. et al. Controlling metabolic flux by toehold-mediated strand displacement. Curr Opin Biotechnol. 2020;66:150-157
20. Simmel FC, Yurke B, Singh HR. Principles and Applications of Nucleic Acid Strand Displacement Reactions. Chem Rev. 2019;119(10):6326-6369
21. Lu H. et al. Toehold-Mediated Strand Displacement Reaction for Dual-Signal Electrochemical Assay of Apolipoprotein E Genotyping. ACS Sens. 2020;5(9):2959-2965
22. Zhang D.Y. and E. Winfree, Control of DNA strand displacement kinetics using toehold exchange. J Am Chem Soc. 2009;131(47):17303-14
23. Liu H. et al. Kinetics of RNA and RNA: DNA Hybrid Strand Displacement. ACS Synth Biol. 2021;10(11):3066-3073
24. Zhu E, Luo X, Liu C. et al. An Operational DNA Strand Displacement Encryption Approach. Nanomaterials. 2022;12(5):877
25. Chen X, Liu X, Wang F. et al. Massively parallel DNA computing based on domino DNA strand displacement logic gates. ACS Synthetic Biology. 2022;11(7):2504-2512
26. Liu C, Liu Y, Zhu E. et al. Cross-Inhibitor: a time-sensitive molecular circuit based on DNA strand displacement. Nucleic acids research. 2020;48(19):10691-10701
27. Tang Z, Yin Z, Wang L. et al. Solving 0-1 integer programming problem based on DNA strand displacement reaction network. ACS Synthetic Biology. 2021;10(9):2318-2330
28. Zhang C, Zhao Y, Xu X. et al. Cancer diagnosis with DNA molecular computation. Nature nanotechnology. 2020;15(8):709-715
29. Cherry K M, Qian L. Scaling up molecular pattern recognition with DNA-based winner-take-all neural networks. Nature. 2018;559(7714):370-376
30. Song T, Shah S, Bui H. et al. Programming DNA-based biomolecular reaction networks on cancer cell membranes. Journal of the American Chemical Society. 2019;141(42):16539-16543
31. Chen C, Wang H, Zhu E. et al. DNA logic multiplexing using toehold-mediated strand displacement. IEEE Access. 2020;8:88108-88114
32. Shi X, Wang Z, Deng C. et al. A novel bio-sensor based on DNA strand displacement. PLoS One. 2014;9(10):108856
33. Dai Y, Furst A, Liu C C. Strand displacement strategies for biosensor applications. Trends in biotechnology. 2019;37(12):1367-1382
34. Mohammadniaei M, Zhang M, Ashley J. et al. A non-enzymatic, isothermal strand displacement and amplification assay for rapid detection of SARS-CoV-2 RNA. Nat Commun. 2021;12(1):5089
35. Gao Y, Yu H, Tian J. et al. Nonenzymatic DNA-Based Fluorescence Biosensor Combining Carbon Dots and Graphene Oxide with Target-Induced DNA Strand Displacement for microRNA Detection. Nanomaterials (Basel). 2021;11(10):2608
36. Chen N. et al. Label-free and self-assembled fluorescent DNA nanopompom for determination of miRNA-21. Mikrochim Acta. 2020;187(8):432
37. Xing Y, Yang Z, Liu D. A responsive hidden toehold to enable controllable DNA strand displacement reactions. Angewandte Chemie International Edition. 2011;50(50):11934-11936
Author contact
![]() Corresponding author: Tel: [+8615307198388]; Email: lixinwhucn
Corresponding author: Tel: [+8615307198388]; Email: lixinwhucn