Impact Factor ISSN: 1837-9664

 Global reach, higher impact
J Cancer 2024; 15(14):4551-4565. doi:10.7150/jca.95456 This issue Cite
Research Paper
Relationship between sex differences in drinking, smoking, and exercising and the incidence of malignancies and medical procedures: a cross-sectional study of 21,916 participants in China
Mingyan Hao1, Yifan Li2 ![]() , Wenjun Ma3, Lizheng Wang4, Janzhong Zheng3
, Wenjun Ma3, Lizheng Wang4, Janzhong Zheng3 ![]() , Yibo Wu5
, Yibo Wu5 ![]()
1. School of Public Health, Shanxi Medical University, Shanxi Hospital Affiliated to Carcinoma Hospital, Chinese Academy of Medical Sciences, Shanxi Province Carcinoma Hospital, Carcinoma Hospital Affiliated to Shanxi Medical University, Taiyuan, 030001, China.
2. Hepatobiliary, Pancreatic and Gastrointestinal Surgery, Shanxi Hospital Affiliated to Carcinoma Hospital, Chinese Academy of Medical Sciences, Shanxi Province Carcinoma Hospital, Carcinoma Hospital Affiliated to Shanxi Medical University, Taiyuan, Shanxi, 030013, China.
3. School of Public Health and Preventive Medicine, Shanxi Medical University, Taiyuan, 030001, China.
4. Shanxi Hospital Affiliated to Carcinoma Hospital, Chinese Academy of Medical Sciences, Shanxi Province Carcinoma Hospital, Carcinoma Hospital Affiliated to Shanxi Medical University, Taiyuan, Shanxi, 030013, China.
5. School of Public Health, Peking University, Beijing 100191, China.
Received 2024-2-18; Accepted 2024-6-3; Published 2024-6-17
Abstract

Objectives: The unresolved issue of the relationship between sex differences in tea, coffee, and beverage consumption and malignancy risk prompted our study in 2022.
Methods: Logistic proportional hazards models were used to estimate odds ratios (ORs) and 95% confidence intervals (CIs) in our investigation of the associations between cancer risk and tea, coffee, and beverage consumption.
Results: Our findings revealed that frequent consumption of white tea significantly reduced the occurrence of malignant tumours, but this effect was detected only in the fully adjusted model for males (OR: 0.736, 95% CI: 0.095-5.704). The amount of sugar added to coffee was associated with an increased risk of malignancy in a dose-dependent manner (P for trend = 0.001), with significance observed for both men (P for trend = 0.049) and women (P for trend = 0.005) in the final model. Notably, individuals who consumed more than 2100 ml of sugary beverages daily had a statistically significant reduction in malignancy risk (OR: 0.219, 95% CI: 0.052-0.917). Interestingly, the intake of sugary beverages had a protective effect on cancer incidence, with a significant effect on males (P for trend = 0.031) but not females (P for trend = 0.096) in the final model.
Conclusions: Our study highlights the substantial impact of regular white tea consumption on reducing the risk of malignant tumours in males. This study first reported that the potential protective effect of consuming sugary beverages is predominantly observed in males, and a correlation between the amount of sugar added to coffee and a heightened risk of malignancy.
Keywords: malignancy, sex difference, tea consumption, coffee consumption, sugary beverages
Introduction
According to the 2023 Chinese National Cancer Report [1], both the number of cancer cases and deaths in China are continuing to increase. The annual medical expenditure caused by cancer has now exceeded 220 billion yuan. These trends can be attributed to socioeconomic development, changes in lifestyle, and the aging population.
Among lifestyle factors, drinking habits, including tea, water, coffee, and other beverages, play a significant role [2]. Numerous meta-analyses of epidemiological studies have been conducted in recent years to examine the relationship between tea consumption and cancer outcomes [3,4,5]. Accumulating evidence from cellular, animal, clinical, and epidemiological research suggests that tea consumption is associated with various health benefits [6,7,8,9]. These benefits include chemoprevention of cancers [10], a reduction in chronic inflammation [11], protection against heart and liver diseases [12], management of diabetes, prevention of neurodegenerative diseases, protection against skin aging induced by UVB radiation, and prevention of bone fracture [13]. Furthermore, tea consumption has been found to have other beneficial effects, such as chemosensitizing, antioxidant, and stress-reducing effects [14].
Coffee and tea are popular drinks that are consumed globally [15]. A breast cancer diagnosis revealed a link between increased coffee consumption and enhanced breast cancer and overall survival rates [16]. Likewise, greater tea consumption post-diagnosis may be linked to improved overall survival. Nevertheless, the study delves into sex disparities in the connection between drinking habits and cancer occurrence. In essence, drinking behaviours can be both good and bad for Chinese residents. The ultimate aim of our research was to determine whether different drinking behaviours of males and females are associated with the incidence of cancer.
Methods
Study population
The study was performed on individuals from the Chinese psychological and behavioural survey, which included 10,958 males and 10,958 females in its population-based cohort. The study spanned from July 10, 2022, to September 15, 2022, and included individuals from all 22 provinces, 5 autonomous regions, and 4 municipalities across mainland China. To execute the research, survey teams, consisting of no more than 10 members, were openly recruited and rigorously trained within the designated sample cities. In each city, at least one investigator or survey team was enlisted, whereby the former collected 30-90 questionnaires and the latter collected 100-200 questionnaires in their respective areas.
We employed Wenjuanxing, the survey platform in China (https://www.wjx.cn/ accessed on July 1, 2022). to conduct our survey. Our team personally distributed the questionnaires to residents, carefully maintaining adherence to ethical practices. Each participant was required to sign a consent form to ensure that the participants provided informed consent. The questionnaire was made available online through a provided link, and we diligently recorded the unique questionnaire number for every respondent. In situations where participants had the cognitive ability to comprehend the questions but could not respond, we conducted one-on-one interviews and captured their answers on their behalf.
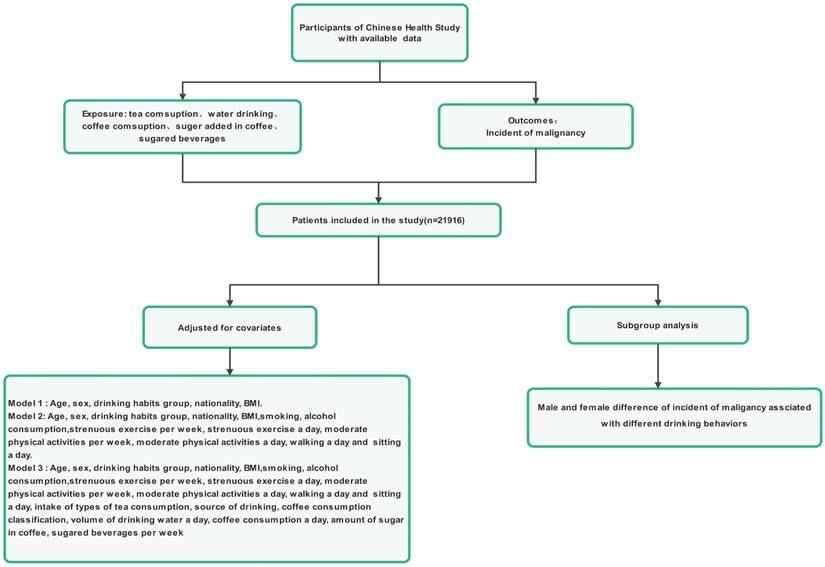
The inclusion criteria for participation in the study were people aged more than 12 years old, permanent residents, and who travelled for ≤1 month annually. Participation in the study was voluntary, as the participants had the freedom to either independently complete the online questionnaire survey or seek assistance from the investigators if required and were capable of understanding the importance of each question within the survey (Figure 1). The reasoning behind selecting teenagers aged 12 years and older for our study is outlined below. First, we have observed that both teenagers and adults now embrace death education, benefiting from an improved-quality education and an overall societal environment that encourages open conversations about this topic. Teenagers aged 12 years and older have the means and environment necessary to develop their perspectives on life and death, which could lead to mature ideas about hospice care. Second, these teenagers can understand and independently respond to the questionnaire, particularly if they have access to a smartphone. The exclusion criteria were individuals who (1) suffer from mental illnesses or have insanity, (2) are enrolled in analogous research projects, or (3) refuse to collaborate.
Flowchart for the enrolment of participants
Statistical analysis
Data analysis for this research utilized SPSS™ software, specifically version 25.0, by SPSS, Inc., Chicago, IL, USA. Statistical analysis involved using descriptive statistics to calculate the mean values and standard deviations (SDs) of continuous variables and determining p values for each variable. The comparative analysis was performed using ANOVA and t-tests to assess the relationships between factors and malignancy-related drinking behaviours. Logistic regression was performed to investigate variables connected to malignancy occurrence, with entry criteria set at P = 0.05 and removal criteria set at P = 0.01.
Results
In this study, a total of 21916 participants from the primary care dataset were included at baseline (Figure 1). The distribution ratio of men to women was 1:1, 9.5% of participants were 12-17 years old, 71.4% of participants were 18-59 years old, and 19.2% of participants were above 60 years old. Table 1 displays the baseline features of participants categorized by the presence of cancer. Participants who had malignancies were older, more likely to smoke, more likely to consume tea, more likely to drink water, more likely to consume coffee, added a greater volume of sugar to coffee, and more likely to drink sugary beverages. Malignancy is also associated with higher BMIs, more frequent use and weekly use, less walking, and more sitting. No notable differences in sex, age, or nationality distribution were observed among participants with normal health status and those with malignancies.
Participants' baseline characteristics categorized based on malignancy occurrence
| Variable | All participants (n=21916) | No incident malignant tumours (n=21797) | Incident malignant tumours (n=119) | P value |
|---|---|---|---|---|
| Sex, n (%) | 0.408 | |||
| Male | 10958 (50.0) | 10903 (50.0) | 55 (46.2) | |
| Female | 10958 (50.0) | 10894 (50.0) | 64 (53.8) | |
| Age, n (%) | 0.184 | |||
| 12-17 years | 2072 (9.5) | 2063 (9.5) | 9 (7.6) | |
| 18-59 years | 15647 (71.4) | 15588 (71.5) | 59 (49.6) | |
| ≥60 years | 4197 (19.2) | 4146 (19.0) | 51 (42.9) | |
| Ethnic groups, n (%) | 0.407 | |||
| Han | 19970 (91.1) | 19859 (91.1) | 8 (6.7) | |
| Minority | 1946 (8.9) | 1938 (8.9) | 111 (93.3) | |
| BMI, Mean±SD | 21.55±4.12 | 21.55±4.12 | 21.98±3.72 | |
| Smoking, n (%) | 0.013 | |||
| No | 17901 (81.7) | 17816 (81.7) | 85 (71.4) | |
| Ordinary cigarettes | 2731 (12.5) | 2708 (12.4) | 23 (19.3) | |
| Electronic cigarettes | 248 (1.1) | 248 (1.1) | 0 | |
| Ordinary and electronic cigarettes | 279 (1.3) | 276 (1.3) | 3 (2.5) | |
| Quit smoking | 757 (3.5) | 749 (3.4) | 8 (6.7) | |
| Wine consumption, n (%) | 0.234 | |||
| 0-25 ml | 19607 (89.5) | 19504 (89.5) | 103 (86.6) | |
| 26-50 ml | 1010 (4.6) | 1000 (4.6) | 10 (8.4) | |
| 51-150 ml | 720 (3.3) | 717 (3.3) | 3 (2.5) | |
| 151-450 ml | 381 (1.7) | 378 (1.7) | 3 (2.5) | |
| >451 ml | 198 (0.9) | 198 (0.9) | 0 | |
| Tea consumption, n (%) | <0.001 | |||
| No | 10911 (49.8) | 10872 (49.9) | 39 (32.8) | |
| Green tea | 411 (1.9) | 407 (1.9) | 4 (3.4) | |
| Black tea | 245 (1.1) | 241 (1.1) | 4 (3.4) | |
| Oolong tea | 2165 (9.9) | 2151 (9.9) | 14 (11.8) | |
| White tea | 1670 (7.6) | 1665 (7.6) | 5 (4.2) | |
| Yellow tea | 118 (0.5) | 115 (0.5) | 3 (2.5) | |
| Dark green tea | 173 (0.8) | 170 (0.8) | 3 (2.5) | |
| Compressed tea | 4526 (20.7) | 4491 (20.6) | 35 (29.4) | |
| Scented tea | 979 (4.5) | 971 (4.5) | 8 (6.7) | |
| Others | 718 (3.3) | 714 (3.3) | 4 (3.4) | |
| Drinking water, n (%) | 0.017 | |||
| ≤1200 ml | 6351 (29.0) | 6319 (29.0) | 32 (26.9) | |
| 1200-1499 ml | 8037 (36.7) | 7994 (36.7) | 43 (36.1) | |
| 1500-1699 ml | 4805 (21.9) | 4784 (21.9) | 21 (17.6) | |
| 1700-2099 ml | 1621 (7.4) | 1612 (7.4) | 9 (7.6) | |
| ≥2100 ml | 1102 (5.0) | 1088 (5.0) | 14 (11.8) | |
| Source of drinking water, n (%) | 0.016 | |||
| Running water | 11221 (51.2) | 11165 (51.2) | 56 (47.1) | |
| Plain boiled water | 2526 (11.5) | 2513 (11.5) | 13 (10.9) | |
| Bottled water | 1779 (8.1) | 1773 (8.1) | 6 (5.0) | |
| Well water | 3349 (15.3) | 3335 (15.3) | 14 (11.8) | |
| Barrelled water | 863 (3.9) | 857 (3.9) | 6 (5.0) | |
| Home water purifier | 357 (1.9) | 352 (1.6) | 5 (4.2) | |
| Community water purifier | 1769 (8.1) | 1751 (8.0) | 18 (15.1) | |
| Others | 52 (0.2) | 51 (0.2) | 1 (0.8) | |
| Coffee consumption classification, n (%) | <0.001 | |||
| None | 16994 (77.5) | 16919 (77.6) | 75 (63.0) | |
| Decaf coffee | 527 (2.4) | 522 (2.4) | 5 (4.2) | |
| Instant coffee | 211 (1.0) | 209 (1.0) | 2 (1.7) | |
| Abrasive coffee | 409 (1.9) | 406 (1.9) | 3 (2.5) | |
| other coffee | 2250 (10.3) | 2238 (10.3) | 12 (10.1) | |
| Don't know | 1525 (7.0) | 1503 (6.9) | 22 (18.5) | |
| Coffee consumption per day, n (%) | 0.032 | |||
| None | 16994 (77.5) | 16889 (77.5) | 105 (88.2) | |
| <250 ml | 2715 (12.4) | 2711 (12.4) | 4 (3.4) | |
| 250 ml | 1140 (5.2) | 1135 (5.2) | 5 (4.2) | |
| 500 ml | 583 (2.7) | 582 (2.7) | 1 (0.8) | |
| 750 ml | 152 (0.7) | 151 (0.7) | 1 (0.8) | |
| >750 ml | 332 (1.5) | 329 (1.5) | 3 (2.5) | |
| Amount of sugar in coffee, n (%) | <0.001 | |||
| No | 19594 (89.1) | 19438 (89.2) | 86 (72.3) | |
| <2.5 g | 858 (3.9) | 852 (3.9) | 6 (5.0) | |
| 2.5 g | 687 (3.1) | 680 (3.1) | 7 (5.9) | |
| 5 g | 584 (2.7) | 575 (2.6) | 9 (7.6) | |
| 10 g | 173 (0.8) | 168 (0.8) | 5 (4.2) | |
| 15 g | 90 (0.4) | 84 (0.4) | 6 (5.0) | |
| Sugary beverages per week | <0.001 | |||
| Never | 8403 (38.3) | 8331 (38.2) | 72 (60.5) | |
| <900 ml | 9565 (43.8) | 9557 (43.8) | 38 (31.9) | |
| 1200-1800 ml | 2768 (12.6) | 2761 (12.7) | 7 (5.9) | |
| >2100 ml | 1150 (5.2) | 1148 (5.3) | 2 (1.7) | |
| Strenuous exercise per week, n (%) | 0.266 | |||
| None | 12599 (57.5) | 12534 (57.5) | 65 (54.6) | |
| 1 day | 2443 (11.1) | 2431 (11.2) | 12 (10.1) | |
| 2 days | 2339 (10.7) | 2330 (10.7) | 9 (7.6) | |
| 3 days | 1496 (6.8) | 1483 (6.8) | 13 (10.9) | |
| 4 days | 1074 (4.9) | 1069 (4.9) | 5 (4.2) | |
| 5 days | 618 (2.8) | 613 (2.8) | 5 (4.2) | |
| 6 days | 406 (1.9) | 401 (1.8) | 5 (4.2) | |
| 7 days | 941 (4.3) | 936 (4.3) | 5 (4.2) | |
| The mean time of strenuous exercise per day ± SD (minutes) | 25.97±40.30 | 25.98±40.29 | 23.71±42.50 | 0.696 |
| Moderate physical activities per week, n (%) | 0.029 | |||
| None | 9953 (45.4) | 9899 (45.4) | 54 (45.4) | |
| 1 day | 2990 (13.6) | 2982 (13.7) | 8 (6.7) | |
| 2 days | 2564 (11.7) | 2548 (11.7) | 16 (13.4) | |
| 3 days | 2466 (11.3) | 2446 (11.2) | 20 (16.8) | |
| 4 days | 1309 (6.0) | 1298 (6.0) | 11 (9.2) | |
| 5 days | 956 (4.4) | 950 (4.4) | 6 (5.0) | |
| 6 days | 392 (1.8) | 389 (1.8) | 3 (2.5) | |
| 7 days | 1286 (5.9) | 1285 (5.9) | 1 (0.8) | |
| Mean time of moderate physical activities per day (minutes) | 105.83±180.04 | 105.60±179.60 | 148.77±245.57 | <0.001 |
| Mean amount of walking per day (minutes) | 5.01±2.13 | 5.02±2.31 | 4.18±2.59 | 0.007 |
| Mean time of sitting per day (minutes) | 447.23±293.58 | 447.21±293.71 | 450.99±269.73 | 0.347 |
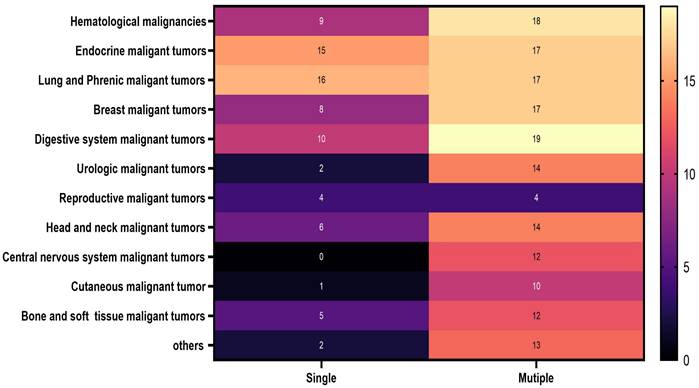
Specific information on the malignant cancers included in this study is clearly shown in Figure 2. Details regarding the malignant cancers of men and women examined in this study are prominently displayed in Figure 3.
The distribution of all participants in 2022
The distribution of malignancies among male and female participants in 2022: A. male and B. female
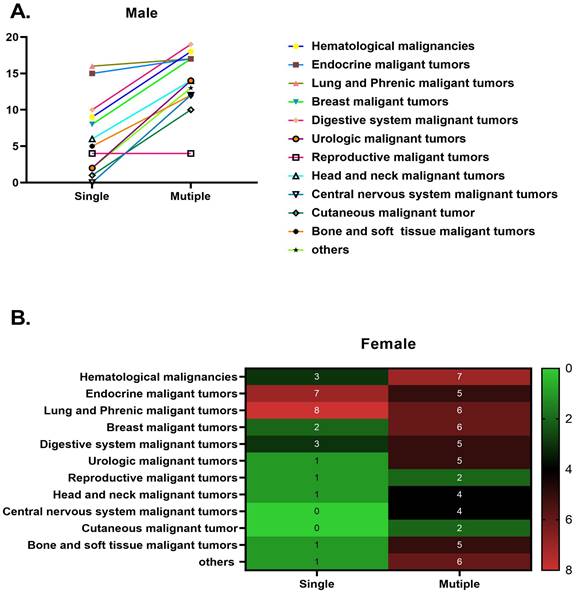
Table 2 presents the findings of our study examining the relationship between the incidence of cancer and the consumption of tea, coffee, and other beverages. Specifically, we analyzed the impact of the addition of sugar to coffee on the risk of malignancy and observed a dose-dependent association (P for trend = 0.001). Our results indicated that individuals who regularly added more sugar to their coffee face a significantly elevated risk of developing malignancies. Notably, this risk increased with the frequency of coffee consumption and the quantity of sugar added per day. For instance, when comparing individuals who added more than 5 g of sugar to their coffee (including subgroups with 5 g, 10 g, and 15 g of sugar added), we observed a significantly greater risk of malignancy among daily coffee drinkers who added larger volumes of sugar. These findings suggest that excessive consumption of sugar in coffee may contribute to an increased risk of cancer. Therefore, limiting the amount of sugar added to coffee and considering potential alternatives are advisable to reduce this risk. For the 15 g/day group with the highest sugar intake, the odds ratio (OR) was 9.362 (95% CI: 2.680-32.709). Compared with those who did not consume sugary beverages, daily consumers of more than 2100 ml of sugary beverages had a significantly reduced risk of malignancy (OR: 0.219, 95% CI: 0.052-0.917). We observed that the risk estimates for individuals who consumed less than 900 ml of sugary beverages daily (OR: 0.553, 95% CI: 0.366-0.835) and those who consumed between 900-1800 ml (OR: 0.365, 95% CI: 0.164-0.812) were similar. Moreover, the risk of cancer increased as the consumption of sugary beverages and the amount of sugar added to coffee increased. Similarly, the amount of water consumed was closely linked to a greater incidence of cancer (P for trend=0.027), especially for those who drank more than 2100 ml of water (OR:2.253, 95% CI: 1.130-4.493, P=0.021), than for those who drank less water (≤1200 ml). However, no notable variation in the likelihood of cancer was observed for participants consuming 1200-1499 ml (P=0.878), 1500-1699 ml (P=0.210), or 1700-2099 ml (P=0.492) of water. The consumption of yellow tea (OR: 4.033, 95% CI: 1.102-14.765, P=0.035) and compressed tea (OR: 2.023, 95% CI: 1.250-3.273, P=0.004) was significantly correlated with an increased risk of cancer.
The relationship between various beverage types and the malignancy risk among participants in the Chinese Health Study (N = 21,916)
| Beverage | Cases | Persons | #Model 1 OR (95% CI) | *Model 2 OR (95% CI) | &Model 3 OR (95% CI) |
|---|---|---|---|---|---|
| Tea consumption n | |||||
| No | 39 | 10911 | 1.000 | 1.000 | 1.000 |
| Green tea | 4 | 411 | 2.987(1.059-8.425) | 2.398(0.837-6.868) | 1.894(0.638-5.620) |
| Black tea | 4 | 245 | 4.311(1.520-12.226) | 4.180(1.456-12.001) | 3.024(0.934-9.786) |
| Oolong tea | 14 | 2165 | 1.867(1.010-3.451) | 1.676(0.900-3.120) | 1.536(0.807-2.925) |
| White tea | 5 | 1670 | 0.980(0.385-2.499) | 0.968(0.378-2.480) | 0.815(0.310-2.144) |
| Yellow tea | 3 | 118 | 6.215(1.881-20.532) | 4.113(1.191-14.202) | 4.033(1.102-14.765) |
| Dark green tea | 3 | 173 | 5.490(1.646-18.312) | 4.206(1.201-14.728) | 3.754(0.991-14.220) |
| Compressed tea | 35 | 4526 | 2.243(1.412-3.563) | 2.199(1.379-3.508) | 2.023(1.250-3.273) |
| Scented tea | 8 | 979 | 2.546(1.184-5.476) | 2.311(1.067-5.005) | 1.933(0.866-4.315) |
| Others | 4 | 718 | 1.832(0.651-5.160) | 1.494(0.522-4.272) | 1.232(0.417-3.643) |
| P for trend | 0.001 | 0.008 | 0.064 | ||
| Source of drinking water | |||||
| Running water | 56 | 11221 | 1.000 | 1.000 | 1.000 |
| Plain boiled water | 13 | 2536 | 1.119(0.610-2.052) | 1.140(0.620-2.097) | 0.916(0.487-1.722) |
| Bottled water | 6 | 1779 | 0.879(0.375-2.063) | 0.812(0.345-1.910) | 0.592(0.244-1.438) |
| Well water | 14 | 3349 | 1.017(0.562-1.839) | 1.049(0.579-1.902) | 0.945(0.517-1.728) |
| Barrelled water | 6 | 863 | 1.659(0.710-3.876) | 1.595(0.679-3.749) | 1.593(0.688-3.795) |
| Home water purifier | 5 | 357 | 2.518(0.996-6.364) | 1.997(0.774-5.152) | 1.286(0.452-3.662) |
| Community water purifier | 18 | 1769 | 2.134(1.249-3.649) | 1.831(1.062-3.160) | 0.815(0.357-1.860) |
| Others | 1 | 52 | 4.749(0.640-35.237) | 2.762(0.300-25.433) | 1.623(0.765-3.422) |
| P for trend | 0.055 | 0.323 | 0.298 | ||
| Coffee consumption classification | |||||
| None | 75 | 16994 | 1.000 | 1.000 | 1.000 |
| Decaf coffee | 5 | 527 | 3.051(1.217-7.650) | 2.551(1.003-6.492) | 1.340(0.464-3.865) |
| Instant coffee | 2 | 211 | 2.937(0.710-12.138) | 2.210(0.521-9.372) | 0.497(0.084-2.926) |
| Abrasive coffee | 3 | 409 | 2.215(0.691-7.100) | 1.726(0.531-5.609) | 0.575(0.144-2.305) |
| Other coffee | 12 | 2250 | 1.688(0.906-3.147) | 1.543(0.821-2.901) | 0.815(0.357-1.860) |
| Don't know | 22 | 1525 | 4.436(2.716-7.245) | 3.608(2.165-6.013) | 1.623(0.765-2.422) |
| P for trend | <0.001 | <0.001 | 0.295 | ||
| Drinking water | |||||
| ≤1200 ml | 32 | 6351 | 1.000 | 1.000 | 1.000 |
| 1200-1499 ml | 43 | 8037 | 0.941(0.593-1.493) | 0.971(0.609-1.548) | 0.963(0.597-1.553) |
| 1500-1699 ml | 21 | 4805 | 0.733(0.420-1.279) | 0.724(0.411-1.274) | 0.689(0.385-1.233) |
| 1700-2099 ml | 9 | 1621 | 0.963(0.457-2.030) | 0.925(0.433-1.974) | 0.756(0.340-1.682) |
| ≥2100 ml | 14 | 1102 | 2.256(1.354-4.825) | 2.692(1.402-5.171) | 2.253(1.130-4.493) |
| P for trend | 0.007 | 0.005 | 0.027 | ||
| Coffee consumption per day | |||||
| None | 86 | 16994 | 1.000 | 1.000 | 1.000 |
| <250 ml | 6 | 2715 | 0.246(0.091-0.669) | 0.251(0.092-0.685) | 0.339(0.122-0.942) |
| 250 ml | 7 | 1140 | 0.739(0.300-1.818) | 0.760(0.306-1.885) | 0.980(0.387-2.481) |
| 500 ml | 9 | 583 | 0.288(0.040-2.067) | 0.260(0.036-1.891) | 0.344(0.047-2.531) |
| 750 ml | 5 | 152 | 1.008(0.139-7.286) | 0.970(0.132-7.104) | 1.095(0.041-8.532) |
| >750 ml | 6 | 332 | 1.381(0.435-4.385) | 1.387(0.425-4.524) | 1.279(0.372-4.397) |
| P for trend | 0.085 | 0.089 | 0.352 | ||
| Amount of sugar in coffee | |||||
| None | 86 | 19524 | 1.000 | 1.000 | 1.000 |
| <2.5 g | 6 | 858 | 1.926(0.836-4.438) | 1.633(0.699-3.811) | 1.269(0.452-3.563) |
| 2.5 g | 7 | 687 | 2.968(1.359-6.437) | 2.216(0.995-4.938) | 1.764(0.645-4.824) |
| 5 g | 9 | 584 | 4.780(2.367-9.650) | 3.850(1.876-7.902) | 3.518(1.406-8.805) |
| 10 g | 5 | 173 | 7.968(3.145-19.883) | 6.316(2.452-16.272) | 5.690(1.816-17.830) |
| 15 g | 6 | 90 | 18.433(7.730-43.955) | 10.685(4.180-27.312) | 9.362(2.680-32.709) |
| P for trend | <0.001 | <0.001 | 0.001 | ||
| Sugary beverages per week | |||||
| Never | 72 | 8403 | 1.000 | 1.000 | 1.000 |
| <900 ml | 38 | 9595 | 0.474(0.320-0.704) | 0.476(0.319-0.710) | 0.553(0.366-0.835) |
| 1200-1800 ml | 7 | 2768 | 0.295(0.135-0.642) | 0.294(0.134-0.646) | 0.365(0.164-0.812) |
| >2100 ml | 2 | 1150 | 0.199(0.049-0.814) | 0.188(0.046-0.774) | 0.219(0.052-0.917) |
| P for trend | <0.001 | <0.001 | 0.002 | ||
CI, confidence interval; OR, odds ratio.
#Model 1 was adjusted for age at recruitment, sex, drinking habit groups, nationality, and BMI.
*Model 2 was modified to include smoking, alcohol consumption, weekly strenuous exercise, daily strenuous exercise, weekly moderate physical activity, daily moderate physical activity, daily walking, and daily sitting, in addition to the variables in Model 1.
&Model 3 was adjusted for all variables in Model 2, plus the intake of different types of tea, source of drinking water, coffee consumption classification, volume of drinking water per day, coffee consumption per day, amount of sugar in coffee, and sugary beverages per week.
Various habits of tea consumption had varying effects on the incidence of malignancy based on sex differences (Table 3 and Figure 4). Among females, except for those who chose secreted tea (OR: 2.909, 95% CI: 1.028-8.232, P=0.044), different tea consumption choices did not seem to have any negative effects on the incidence of malignancy compared to non-tea drinkers. However, in males, different tea consumption patterns were strongly linked to greater chances of developing cancer—malignancy (p for trend= 0.033). Specifically, the groups consuming black tea (OR: 5.563, 95% CI: 1.479-20.925, P=0.011), yellow tea (OR: 7.350, 95% CI: 1.739-31.063, P=0.007), dark green tea (OR: 5.453, 95% CI: 1.04-27.192, P=0.039), and compressed tea (OR: 2.680, 95% CI: 1.358-5.286, P=0.004) had the highest risk of malignancy in the fully adjusted model (Model 3).
Sex differences in tea consumption and the risk of malignancy
| Tea consumption | No | Green tea | Black tea | Oolong tea | White tea | Yellow tea | Dark green tea | Compressed tea | Scented tea | Others | P for trend |
|---|---|---|---|---|---|---|---|---|---|---|---|
| Male | |||||||||||
| #Model 1 OR (95% CI) | 1.000 | 1.589 (0.209-12.709) | 6.188 (1.770-21.627) | 2.500 (1.101-5.681) | 0.618 (0.082-4.676) | 13.497 (3.813-47.781) | 11.929 (3.341-42.589) | 2.868 (1.506-5.464) | 2.117 (0.614-7.308) | 2.181 (0.497-9.563) | <0.001 |
| *Model 2 OR (95% CI) | 1.000 | 1.079 (0.137-8.492) | 5.948 (1.668-21.205) | 2.287 (0.990-5.283) | 0.718 (0.094-5.478) | 8.173 (2.131-31.348) | 8.257 (2.077-32.823) | 2.785 (1.448-5.358) | 1.757 (0.497-6.212) | 1.813 (0.403-8.165) | 0.005 |
| &Model 3 OR (95% CI) | 1.000 | 1.023 (0.125-8.388) | 5.563 (1.479-20.925) | 2.016 (0.829-4.902) | 0.736 (0.095-5.704) | 7.350 (1.739-31.063) | 5.453 (1.04-27.192) | 2.680 (1.358-5.286) | 1.370 (0.361-5.200) | 1.464 (0.305-7.040) | 0.033 |
| Female | |||||||||||
| #Model 1 OR ( 95% CI) | 1.000 | 4.537 (1.341-15.351) | 2.496 (0.332-18.970) | 1.335 (0.505-3.526) | 1.118 (0.383-3.565) | 0 | 0 | 1.736 (0.860-3.535) | 3.135 (1.170-8.403) | 1.661 (0.387-7.129) | 0.292 |
| *Model 2 OR (95% CI) | 1.000 | 3.770 (1.065-13.342) | 1.811 (0.204-16.100) | 1.170 (0.437-3.134) | 1.065 (0.361-3.141) | 0 | 0 | 1.639 (0.805-3.338) | 2.858 (1.054-7.752) | 1.202 (0.268-5.378) | 0.506 |
| &Model 3 OR (95% CI) | 1.000 | 3.334 (0.892-12.532) | 0.811 (0.029-22.359) | 1.104 (0.399-3.056) | 0.902 (0.283-2.873) | 0 | 0 | 1.608 (0.767-3.371) | 2.909 (1.028-8.232) | 1.393 (0.308-6.292) | 0.579 |
Sankey plot of sex differences in tea consumption classification and the risk of malignancy
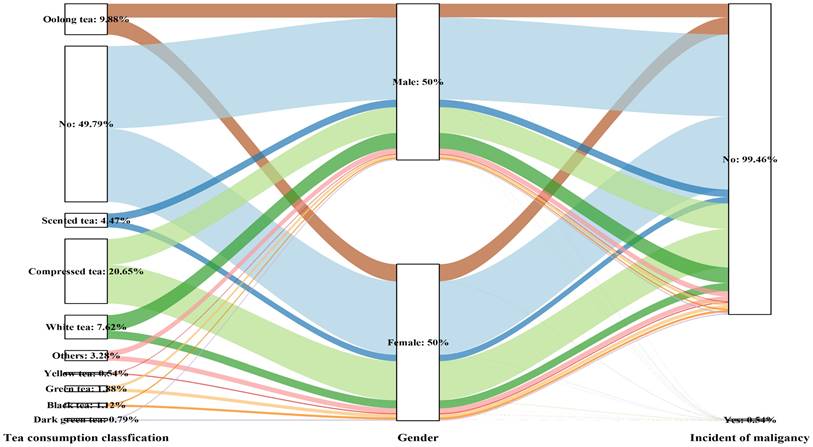
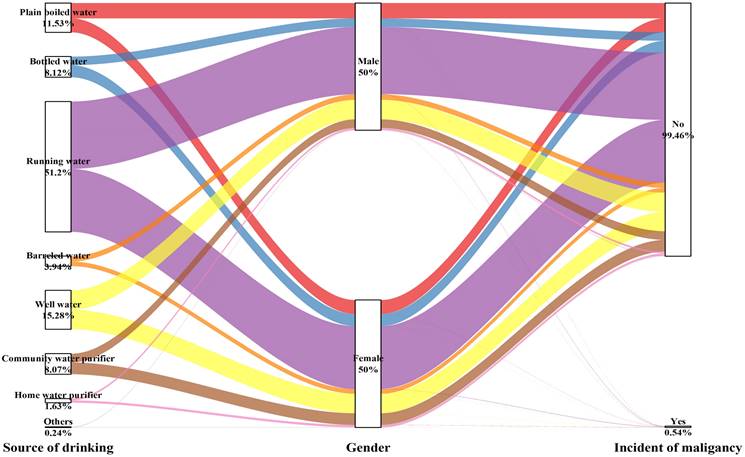
Table 4 and Figure 5 show that the choice of the drinking water source had no impact on the occurrence of malignancy for either men (P for trend= 0.201) or women (P for trend= 0.949), except for the male subgroup using community water purifiers, which showed significant outcomes (OR: 2.448, 95% CI: 1.179-5.081, P=0.016).
Sex differences in the source of drinking water and the risk of malignancy
| Source of drinking water | Running water | Plain boiled water | Bottled water | Well water | Barrelled water | Home water purifier | Community water purifier | Others | P for trend |
|---|---|---|---|---|---|---|---|---|---|
| Male | |||||||||
| #Model 1 OR (95% CI) | 1.000 | 1.409 (0.637-3.114) | 0.501 (0.118-2.129) | 1.162 (0.523-2.582) | 1.805 (0.543-6.008) | 3.063 (0.913-10.272) | 2.549 (1.284-5.060) | 9.925 (1.272-77.467) | 0.033 |
| *Model 2 OR (95% CI) | 1.000 | 1.472 (0.660-3.282) | 0.456 (0.107-1.951) | 1.151 (0.514-2.577) | 1.474 (0.433-5.020) | 2.168 (0.607-7.737) | 2.255 (1.113-4.571) | 5.300 (0.462-60.854) | 0.219 |
| &Model 3 OR (95% CI) | 1.000 | 0.970 (0.402-2.340) | 0.309 (0.065-1.473) | 0.933 (0.406-2.144) | 1.193 (0.422-4.427) | 1.531 (0.385-6.086) | 2.448 (1.179-5.081) | 2.102 (0.088-50.363) | 0.201 |
| Female | |||||||||
| #Model 1 OR (95% CI) | 1.000 | 0.841 (0.324-2.181) | 1.483 (0.511-4.306) | 0.867 (0.356-2.109) | 1.514 (0.457-5.017) | 1.984 (0.463-8.493) | 1.665 (0.687-4.037) | 0 | 0.856 |
| *Model 2 OR (95% CI) | 1.000 | 0.869 (0.333-2.565) | 1.445 (0.494-4.266) | 0.921 (0.376-2.257) | 1.639 (0.490-5.482) | 1.784 (0.391-8.137) | 1.435 (0.584-3.530) | 0 | 0.942 |
| &Model 3 OR (95% CI) | 1.000 | 0.804 (0.300-2.153) | 1.091 (0.354-3.357) | 0.773 (0.308-1.940) | 1.752 (0.512-5.992) | 1.677 (0.282-9.967) | 1.325 (0.511-3.434) | 0 | 0.949 |
Sankey plot of sex differences in the source of drinking water and risk of malignancy
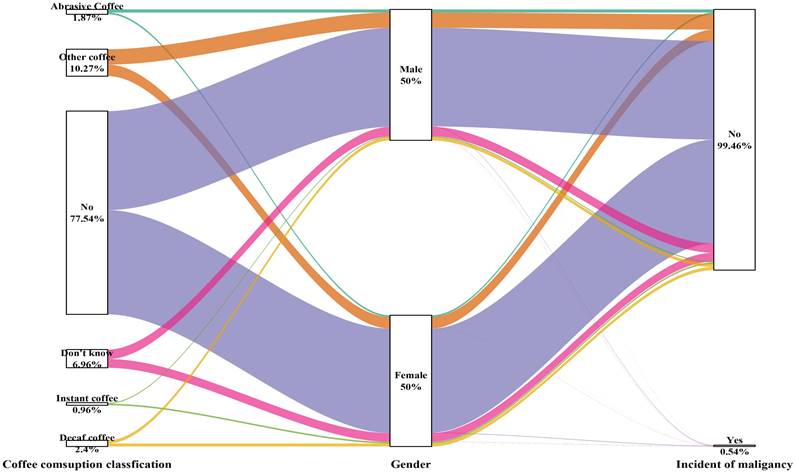
The type and amount of coffee consumed were not related to the development of cancer in either male or female participants (Table 5 and Figure 6).
Sex differences in the coffee consumption classification and risk of malignancy
| Coffee consumption classification | None | Decaf coffee | Instant coffee | Abrasive Coffee | Other coffee | Don't know | P for trend |
|---|---|---|---|---|---|---|---|
| Male | |||||||
| #Model 1 OR (95% CI) | 1.000 | 2.517 (0.596-10.626) | 4.741 (1.118-20.093) | 3.908 (0.926-16.490) | 2.462 (1.131-5.357) | 4.398 (2.212-8.746) | <0.001 |
| *Model 2 OR (95% CI) | 1.000 | 2.067 (0.478-8.948) | 3.430 (0.759-15.497) | 3.041 (0.695-13.312) | 2.197 (0.984-4.906) | 3.252 (1.560-6.778) | 0.021 |
| &Model 3 OR (95% CI) | 1.000 | 1.127 (0.222-5.729) | 0.856 (0.115-6.367) | 0.975 (0.155-6.130) | 1.309 (0.438-3.913) | 1.478 (0.500-4.370) | 0.974 |
| Female | |||||||
| #Model 1 OR (95% CI) | 1.000 | 3.602 (1.086-11.945) | 0 | 1.113 (0.151-8.212) | 1.008 (0.352-2.889) | 4.346 (2.153-8.773) | 0.001 |
| *Model 2 OR (95% CI) | 1.000 | 3.004 (0.883-10.225) | 0 | 0.977 (0.131-7.292) | 0.944 (0.325-2.743) | 3.780 (1.830-7.807) | 0.009 |
| &Model 3 OR (95% CI) | 1.000 | 1.464 (0.336-6.376) | 0 | 0.346 (0.035-3.453) | 0.475 (0.123-1.841) | 1.654 (0.558-4.903) | 0.336 |
Sankey plot of sex differences in the coffee consumption classification and risk of malignancy
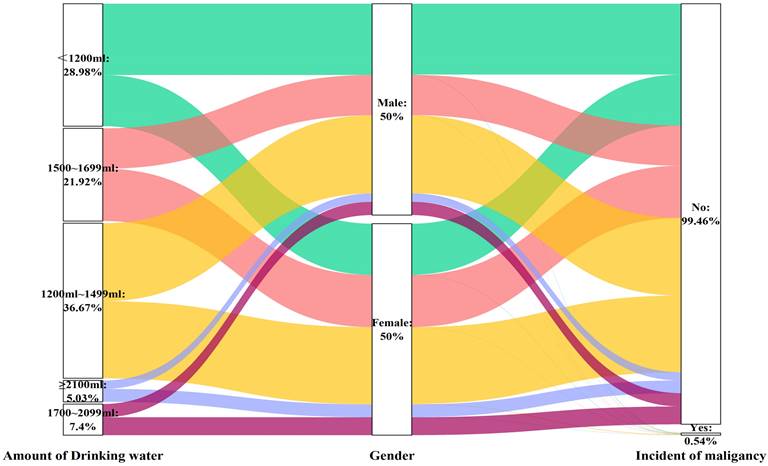
Similarly, the volume of water consumed was not associated with the likelihood of developing cancer in individuals of either sex (Table 6 and Figure 7), except for the male subgroup who consumed more than 2100 ml of water (OR: 2.989, 95% CI: 1.150-7.770, P=0.025), in the fully adjusted model (Model 3).
Sex differences in the volume of drinking water and risk of malignancy
| Drinking water | ≤1200 ml | 1200-1499 ml | 1500-1699 ml | 1700-2099 ml | ≥2100 ml | P for trend |
|---|---|---|---|---|---|---|
| Male | ||||||
| #Model 1 OR (95% CI) | 1.000 | 1.254 (0.642-2.449) | 0.618 (0.263-1.451) | 1.424 (0.565-3.589) | 3.048 (1.291-7.197) | 0.017 |
| *Model 2 OR (95% CI) | 1.000 | 1.311 (0.663-2.595) | 0.611 (0.256-1.460) | 1.441 (0.560-3.711) | 3.146 (1.289-7.676) | 0.016 |
| &Model 3 OR (95% CI) | 1.000 | 1.290 (0.632-2.634) | 0.545 (0.220-1.348) | 1.172 (0.422-3.250) | 2.989 (1.150-7.770) | 0.022 |
| Female | ||||||
| #Model 1 OR (95% CI) | 1.000 | 0.692 (0.357-1.341) | 0.905 (0.435-1.886) | 0.483 (0.112-2.087) | 2.128 (0.788-5.744) | 0.219 |
| *Model 2 OR (95% CI) | 1.000 | 0.718 (0.368-1.400) | 0.900 (0.426-1.903) | 0.466 (0.105-2.075) | 2.302 (0.825-6.423) | 0.213 |
| &Model 3 OR (95% CI) | 1.000 | 0.736 (0.369-1.467) | 0.892 (0.408-1.949) | 0.425 (0.091-1.997) | 2.174 (0.725-6.516) | 0.300 |
Sankey plot of sex differences in the volume of drinking water and risk of malignancy
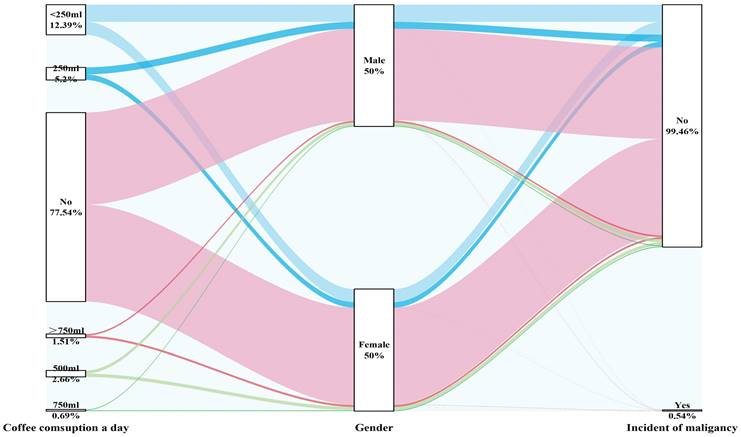
The amount of coffee consumed daily was not related to the incidence of malignancy, regardless of sex, and this effect remained consistent in both the crude and fully adjusted models (Figure 8).
Sankey plot of sex differences in daily coffee consumption and the risk of malignancy
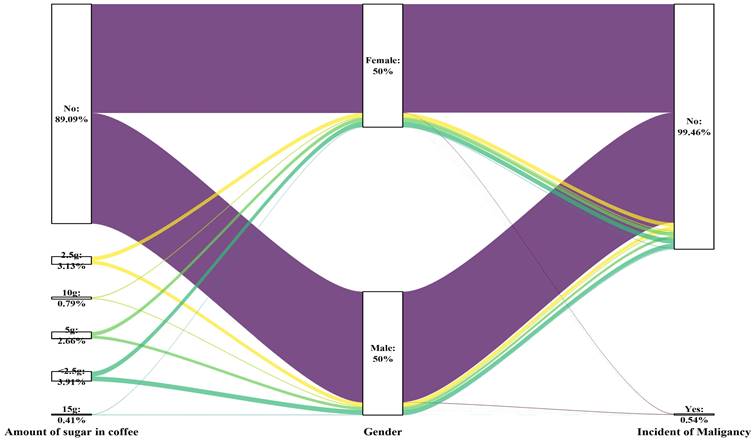
A notable correlation between cancer incidence and the level of sugar added to coffee was observed among both genders (p for trend= 0.049 for males, p for trend= 0.005 for females). However, after adjusting for various factors (Model 3), the biological effects varied among the different groups, depending on the amount of sugar added to the coffee. In the male subgroup, consuming 15 g of sugar (equivalent to three teaspoons) added to coffee had potentially harmful effects on the germination of malignancy (P=0.003). In the female population, the consumption of 10 g of sugar (equivalent to two teaspoons) in coffee was correlated with a heightened cancer risk (P<0.001). This information is presented in Table 7, as well as Figures 9 and 11.
Sex differences in the amount of sugar added to the coffee and the risk of malignancy
| Amount of sugar added to coffee | None | <2.5 g | 2.5 g | 5 g | 10 g | 15 g | P for trend |
|---|---|---|---|---|---|---|---|
| Male | |||||||
| #Model 1 OR (95% CI) | 1.000 | 2.464 (0.878-6.920) | 4.213 (1.643-10.799) | 6.149 (2.375-15.919) | 2.975 (0.402-22.006) | 20.938 (7.093-61.808) | <0.001 |
| *Model 2 OR (95% CI) | 1.000 | 2.121 (0.731-6.154) | 2.546 (0.932-6.957) | 5.192 (1.922-14.030) | 2.626 (0.340-20.303) | 11.807 (3.593-38.802) | <0.001 |
| &Model 3 OR (95% CI) | 1.000 | 1.403 (0.352-5.586) | 1.588 (0.408-6.181) | 4.096 (1.115-15.049) | 1.750 (0.183-16.778) | 11.243 (2.224-56.843) | 0.049 |
| Female | |||||||
| #Model 1 OR (95% CI) | 1.000 | 1.316 (0.315-5.494) | 1.681 (0.402-7.036) | 3.694 (1.299-10.505) | 12.986 (4.477-37.662) | 14.881 (3.405-65.031) | <0.001 |
| *Model 2 OR (95% CI) | 1.000 | 1.068 (0.247-4.610) | 1.410 (0.332-5.985) | 3.184 (1.099-9.220) | 12.067 (3.978-36.598) | 8.273 (1.535-44.583) | <0.001 |
| &Model 3 OR (95% CI) | 1.000 | 1.294 (0.240-6.974) | 1.264 (0.229-6.978) | 3.341 (0.852-13.103) | 15.870 (3.663-68.759) | 5.896 (0.594-58.536) | 0.005 |
Sankey plot of sex differences in the amount of sugar added to the coffee and the risk of malignancy
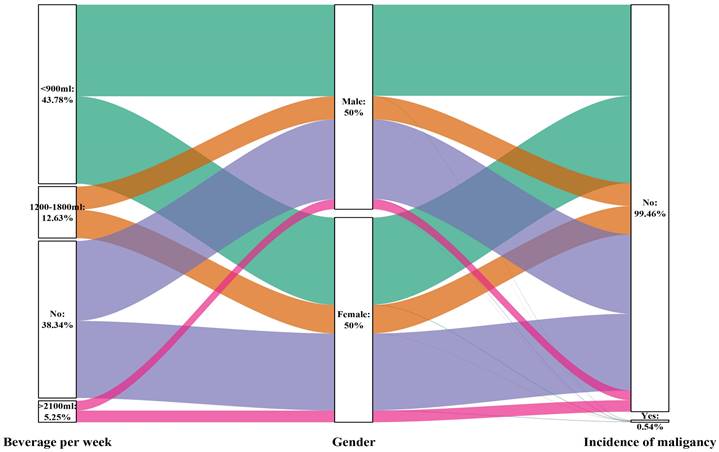
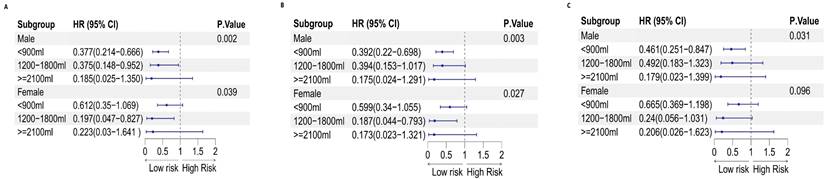
On the other hand, the intake of sugary beverages may have a protective effect on the occurrence of cancer. This effect was significant for men (P for trend= 0.031) but not for women (P for trend= 0.096). For men who consumed less than 900 ml of sugary beverages, a 54% reduction in the chance of developing cancer was observed (OR: 0.461, 95% CI: 0.251-0.847; P=0.013). This information is presented in Table 8, as well as Figures 10 and 12.
Sex differences in sugars consumed per week and the risk of malignancy
| Sugary beverages per week | Never | <900 ml | 1200-1800 ml | ≥2100 ml | P for trend |
|---|---|---|---|---|---|
| Male | |||||
| Model 1 OR (95% CI) | 1.000 | 0.377 (0.214-0.666) | 0.375 (0.148-0.952) | 0.185 (0.025-1.350) | 0.002 |
| Model 2 OR (95% CI) | 1.000 | 0.392 (0.22-0.698) | 0.394 (0.153-1.017) | 0.175 (0.024-1.291) | 0.003 |
| Model 3 OR (95% CI) | 1.000 | 0.461 (0.251-0.847) | 0.492 (0.183-1.323) | 0.179 (0.023-1.399) | 0.031 |
| Female | |||||
| Model 1 OR (95% CI) | 1.000 | 0.612 (0.35-1.069) | 0.197 (0.047-0.827) | 0.223 (0.03-1.641) | 0.039 |
| Model 2 OR (95% CI) | 1.000 | 0.599 (0.34-1.055) | 0.187 (0.044-0.793) | 0.173 (0.023-1.321) | 0.027 |
| Model 3 OR (95% CI) | 1.000 | 0.665 (0.369-1.198) | 0.24 (0.056-1.031) | 0.206 (0.026-1.623) | 0.096 |
Sankey plot of sex differences in the consumption of sugary beverages per week and the risk of malignancy
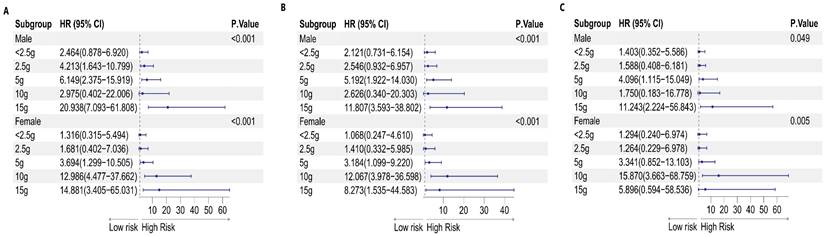
Forest plot of sex differences in the amount of sugar added to coffee and the risk of malignancy: A. Model 1, B. Model 2, and C. Model 3
Forest plot of sex differences in sugary beverage consumption per week and the risk of malignancy: A. Model 1, B. Model 2, and C. Model 3
Discussion
Tea, a widely consumed traditional beverage, possesses a wide array of health benefits due to its natural attributes [17]. Research has primarily concentrated on the relationships between green tea and black tea with cancer. However, a recent study explored the impact of white tea on various types of cancer cells, expanding our understanding of its potential ability to combat cancer. The distinct properties of white tea make it promising for the development of novel anticancer treatments [18]. Studies have shown that tea can augment the production of antioxidant enzymes, impede the growth of cancer cells, and facilitate apoptosis [19]. These findings further highlight the significant role that tea can play in cancer prevention and intervention. However, an extensive investigation of 500,000 Chinese individuals did not find a clear connection between drinking tea and the occurrence of cancer [20]. On the other hand, a subsequent study in the U.S. followed 98,786 postmenopausal women aged 50 to 79 years and discovered that those who consumed one or more sugary drinks per day had a greater chance of developing liver cancer and dying from chronic liver illness [21]. Undoubtedly, tea has emerged as an exceptional beverage with abundant health benefits. While the potential of white tea for combating cancer cells is a captivating avenue for further research, continued explorations of the intricate relationship between tea consumption and cancer incidence in diverse populations are essential.
An examination of 33,106 teenagers revealed a correlation between a high intake of basic sugars and sweet drinks in youth and a heightened chance of developing typical adenoma, notably rectal adenoma [22]. In a separate investigation within the Iowa Women's Health Study group, the consumption of water containing elevated nitrate levels may be associated with the onset of endometrial cancer [23]. Likewise, a case-control analysis conducted in Spain explored the potential connection between water consumption levels and prostate cancer risk [24]. Approximately 37 prospective cohort studies provided evidence suggesting that consuming added sugars and sugary beverages increases the likelihood of developing cancer [25]. The latest prospective study with Swedish adults, totalling 70,832 subjects from the Swedish Mammography Cohort, showed that a high intake of sweetened drinks might increase the chance of biliary tract cancer [26]. Findings from a combined analysis of 22 global studies, with a sample of 9,438 cases and 20,451 controls, revealed an inverse connection between tea intake and stomach cancer [27]. Recent research has consistently indicated that the consumption of sugar-sweetened beverages is linked to a greater risk of liver cancer [28], as well as pancreatic cancer [29], along with increased mortality from colorectal cancer and an increased risk of early-onset colorectal cancer in women [30]. Furthermore, an association between obesity and certain cancer types is known [31].
Both previous and recent studies have shown a correlation between water consumption and the risk of bladder and kidney cancers, primarily due to varying levels of carcinogens present in drinking water [32,33,34]. Our findings support the evidence that overall fluid intake is linked to a decrease in bladder cancer risk [35]. Specifically, higher water consumption is also associated with a reduced risk of malignancy.
Sex disparities in drinking habits and their impacts on the incidence of malignancies were investigated in our study. We found that different patterns of tea consumption were closely linked to the occurrence of malignant cancers. While most types of tea were associated with an increased risk of malignancy, white tea was an exception. Regular consumption of white tea significantly decreased the likelihood of developing malignant tumours, particularly in males. However, tea consumption did not affect the incidence of malignancy in females. Interestingly, the source of drinking water did not have any significant impact on the risk of malignancy, except for a possible preventive effect of moderate water intake (less than 2100 ml). This effect was more pronounced in males consuming 1500-1699 ml of water per day. In contrast, our study revealed no association between coffee consumption and the risk of malignancy in either men or women. However, the amount of sugar added to coffee was positively correlated with the risk of developing malignancy, with higher sugar intake leading to a greater risk. This trend was consistent across both sexes. Surprisingly, our findings revealed a reverse association between sugary beverage consumption and the malignancy risk. The more sugary beverages consumed, the lower the risk of developing malignancy, and this effect was observed in both men and women.
Overall, our study highlights the complex relationships between drinking habits and the incidence of malignancies. While white tea, moderate water, and sugary beverage intake may have protective effects, caution should be exercised when adding sugar to coffee. Further research is needed to better understand these patterns and their implications for cancer prevention.
Our study has several limitations. First, the potential for inaccuracies in categorizing caffeine, coffee, and tea intake is a notable limitation because we solely relied on baseline intake information, which may not have accurately reflected participants' actual consumption patterns over time. Moreover, the lack of follow-up data on the consumption of different types of tea is another limitation of our study. By not distinguishing between various types of tea, we may have overlooked potential differences in their cancer risk profiles.
Additionally, data on additional possible cancer risk factors, including familial history, exposure to radiation or chemicals, and dietary patterns, were not available in our study. These factors could have confounded our findings or influenced the observed associations. Consequently, the applicability of our findings to a wider population could be restricted.
In summary, our findings suggest a sex difference in the cancer risk for men and women who consume sweetened coffee and beverages. Specifically, according to our research, consuming large amounts of sweetened caffeinated beverages might lower the likelihood of cancer among males. Nevertheless, these results should be interpreted carefully in light of the mentioned constraints. Moving forward, we hope that our study will promote further research aimed at identifying the specific components of coffee and tea responsible for this potential protective effect. Additionally, exploring the role of sugar in cancer risk would also be of interest.
Abbreviations
OR: Odds ratio; CIs: Confidence intervals; BMI: Boss mass index; SD: Standard deviation.
Acknowledgements
I would like to extend my sincere appreciation to my mentor, Zheng Jianzhong, for his invaluable guidance and illuminating recommendations during the research project. Additionally, I want to thank Li Yifan for aiding in methodology and data, Ma Wenjun for valuable input in data analysis and software assistance, Wu Yibo for overseeing and validating the study, and Wang Lizheng for support in project management and resource allocation.
Ethical approval and consent to participate
The research included individuals as subjects and was sanctioned by the Ethics Research Committee of the Health Culture Research Centre of Shaanxi (JKWH-2022-02). Informed consent was acquired from all participants before data collection. Before engaging in the study, participants provided their informed consent.
Availability of data and materials
The data can be requested through reasonable inquiry. They are not accessible to the public but can be obtained from the authors upon request. The data utilized in this research were collected from the Psychology and Behaviours' Investigation of Chinese Residents (PBICR) conducted by Yibo Wu, the corresponding author.
Author contributions
MH drafted the initial manuscript, managed the data, performed the formal analysis, and collaborated on the methodology section. YL supervised the overall data collection, research, and methodology of the investigation. WM managed the data, utilized software, and collaborated on the methodology section. LW acted as the project coordinator. YW provided oversight and validation of the research. JZ was in charge of composing, reviewing, and revising the research article, as well as the overall conception of the study. All authors have reviewed and authorized the manuscript.
Competing Interests
The authors have declared that no competing interest exists.
References
1. Wang Y, Yan Q, Fan C. et al. Overview and countermeasures of cancer burden in China. Sci China Life Sci. 2023;66(11):2515-2526
2. Papies EK. The Psychology of Desire and Implications for Healthy Hydration. Ann Nutr Metab. 2020;76(Suppl 1):31-36
3. Arthur R, Kirsh VA, Rohan TE. Associations of coffee, tea and caffeine intake with risk of breast, endometrial and ovarian cancer among Canadian women. Cancer Epidemiol. 2018;56:75-82
4. Porro C, Cianciulli A, Panaro MA. A cup of coffee for a brain-long life. Neural Regen Res. 2024;19(1):158-159
5. Yi M, Wu X, Zhuang W. et al. Tea Consumption and Health Outcomes: Umbrella Review of Meta-Analyses of Observational Studies in Humans. Mol Nutr Food Res. 2019;63(16):e1900389
6. Kaluza J, Stackelberg O, Harris HR, Björck M, Wolk A. Tea consumption and the risk of abdominal aortic aneurysm. Br J Surg. 2022;109(4):346-354
7. Zhang Y, Yang H, Li S. et al. Consumption of coffee and tea and risk of developing stroke, dementia, and poststroke dementia: A cohort study in the UK Biobank. PLoS Med. 2021;18(11):e1003830 Published 2021 Nov 16
8. Li M, Duan Y, Wang Y. et al. The effect of Green green tea consumption on body mass index, lipoprotein, liver enzymes, and liver cancer: An updated systemic review incorporating a meta-analysis. Crit Rev Food Sci Nutr. 2024;64(4):1043-1051
9. Inoue-Choi M, Ramirez Y, Cornelis MC. et al. Tea Consumption and All-Cause and Cause-Specific Mortality in the UK Biobank: A Prospective Cohort Study. Ann Intern Med. 2022Sep;175(9):1201-1211
10. Perletti G, Magri V, Vral A. et al. Green tea catechins for chemoprevention of prostate cancer in patients with histologically-proven HG-PIN or ASAP. Concise review and meta-analysis. Arch Ital Urol Androl. 2019;91(3):10.4081
11. Liu H, Guan H, He F. et al. Therapeutic actions of tea phenolic compounds against oxidative stress and inflammation as central mediators in the development and progression of health problems: A review focusing on microRNA regulation. Crit Rev Food Sci Nutr. 2023Apr;19:1-31
12. Samynathan R, Thiruvengadam M, Nile SH. et al. Recent insights on tea metabolites, their biosynthesis and chemo-preventing effects: A review. Crit Rev Food Sci Nutr. 2023;63(18):3130-3149
13. Nash LA, Ward WE. Tea and bone health: Findings from human studies, potential mechanisms, and identification of knowledge gaps. Crit Rev Food Sci Nutr. 2017;57(8):1603-1617
14. Feng X, Chen M, Song H. et al. A systemic review on Liubao tea: A time-honored dark tea with distinctive raw materials, process techniques, chemical profiles, and biological activities. Compr Rev Food Sci Food Saf. 2023;22(6):5063-5085
15. Karabegović I, Portilla-Fernandez E, Li Y. et al. Epigenome-wide association meta-analysis of DNA methylation with coffee and tea consumption. Nat Commun. 2021;12(1):2830 Published 2021 May 14
16. Farvid MS, Spence ND, Rosner BA, Willett WC, Eliassen AH, Holmes MD. Post-diagnostic coffee and tea consumption and breast cancer survival. Br J Cancer. 2021;124(11):1873-1881
17. Xu XY, Zhao CN, Cao SY, Tang GY, Gan RY, Li HB. Effects and mechanisms of tea for the prevention and management of cancers: An updated review. Crit Rev Food Sci Nutr. 2020;60(10):1693-1705
18. Liu L, Liu B, Li J. et al. Responses of Different Cancer Cells to White Tea Aqueous Extract. J Food Sci. 2018;83(10):2593-2601
19. Thomas R, Greef B, McConnachie A, Stanley B, Williams M. Dietary consumption of tea and the risk of prostate cancer in the Prostate, Lung, Colorectal and Ovarian Cancer Screening Trial. Br J Nutr. 2022;128(4):653-658
20. Li X, Yu C, Guo Y. et al. Association between tea consumption and risk of cancer: a prospective cohort study of 0.5 million Chinese adults. Eur J Epidemiol. 2019;34(8):753-763
21. Zhao L, Zhang X, Coday M. et al. Sugar-Sweetened and Artificially Sweetened Beverages and Risk of Liver Cancer and Chronic Liver Disease Mortality. JAMA. 2023;330(6):537-546
22. Joh HK, Lee DH, Hur J. et al. Simple Sugar and Sugar-Sweetened Beverage Intake During Adolescence and Risk of Colorectal Cancer Precursors. Gastroenterology. 2021;161(1):128-142.e20
23. Medgyesi DN, Trabert B, Sampson J. et al. Drinking Water Disinfection Byproducts, Ingested Nitrate, and Risk of Endometrial Cancer in Postmenopausal Women. Environ Health Perspect. 2022;130(5):57012 doi:10.1289/EHP10207
24. Schmidt S. Nitrates and Prostate Cancer: Long-Term Drinking Water Exposures Associated with Risk of Tumors. Environ Health Perspect. 2023;131(5):54003
25. Makarem N, Bandera EV, Nicholson JM, Parekh N. Consumption of Sugars, Sugary Foods, and Sugary Beverages in Relation to Cancer Risk: A Systematic Review of Longitudinal Studies. Annu Rev Nutr. 2018;38:17-39
26. Larsson SC, Giovannucci EL, Wolk A. Sweetened Beverage Consumption and Risk of Biliary Tract and Gallbladder Cancer in a Prospective Study. J Natl Cancer Inst. 2016Jun8;108(10):djw125
27. Murphy N, Campbell PT, Gunter MJ. Are sugar-sweetened beverages contributing to the rising occurrence of colorectal cancer in young adults? Gut. 2021Dec;70(12):2222-2223
28. Zoltick ES, Smith-Warner SA, Yuan C. et al. Sugar-sweetened beverage, artificially sweetened beverage, sugar intake, and colorectal cancer survival. Br J Cancer. 2021;125(7):1016-1024
29. Davis EW, McCann SE, Joseph JM. et al. Sugar-Sweetened and Artificially Sweetened Beverage Consumption and Pancreatic Cancer: A Retrospective Study. Nutrients. 2023Jan5;15(2):275
30. Hur J, Otegbeye E, Joh HK. et al. Sugar-sweetened beverage intake in adulthood and adolescence and risk of early-onset colorectal cancer among women. Gut. 2021Dec;70(12):2330-2336
31. Hodge AM, Bassett JK, Milne RL, English DR, Giles GG. Consumption of sugar-sweetened and artificially sweetened soft drinks and risk of obesity-related cancers. Public Health Nutr. 2018;21(9):1618-1626
32. Zhang Y, Liu M, Wang J, Han K, Han F, Wang B, Xie S, Yuan C, Zhao M, Li S, Wang J. Bibliometric analysis of the association between drinking water pollution and bladder cancer. Front Oncol. 2023Jun29;13:1170700
33. Qiu Y, Chen X, Yan X. et al. Gut microbiota perturbations and neurodevelopmental impacts in offspring rats concurrently exposure to inorganic arsenic and fluoride. Environ Int. 2020;140:105763
34. Rosenberg K. Sugar-Sweetened Beverage Intake Linked to Early-Onset Colorectal Cancer Risk. Am J Nurs. 2021;121(10):52
35. Jochems SHJ, van Osch FHM, Reulen RC. et al. Total Fluid Intake and the Risk of Recurrence in Patients With Non-Muscle Invasive Bladder Cancer: A Prospective Cohort Study. Bladder Cancer. 2018Jul30;4(3):303-310
Author contact
![]() Corresponding authors: Janzhong Zheng, Zjzhong4183com, Yifan Li, lyf8028com, Yibo Wu bjmuwuyibocom.
Corresponding authors: Janzhong Zheng, Zjzhong4183com, Yifan Li, lyf8028com, Yibo Wu bjmuwuyibocom.