Impact Factor ISSN: 1837-9664

 Global reach, higher impact
J Cancer 2024; 15(15):4789-4800. doi:10.7150/jca.96655 This issue Cite
Research Paper
Prognostic Value of Tumor Deposits in Patients with Colorectal Cancer
Manuel Díez Alonso1,2, Fernando Mendoza Moreno1, Cristina Vera Mansilla1, Belén Matías1, Rubén Jimenez1, Youssef Allaoua1, Ignacio Busteros Moraza4, Alberto Vilar1, Silvestra Barrena1,3,5, Raúl Díaz-Pedrero1,2,3, Miguel A Ortega3,4 ![]() , Melchor Alvarez de Mon3,4,6, Alberto Gutierrez1,2
, Melchor Alvarez de Mon3,4,6, Alberto Gutierrez1,2 ![]()
1. Department of General and Digestive Surgery, University Hospital Príncipe de Asturias, 28805 Madrid, Spain.
2. Department of Surgery, Medical and Social Sciences. Faculty of Medicine and Health Sciences, University of Alcalá, 28801 Alcalá de Henares, Spain.
3. Ramón y Cajal Institute of Sanitary Research (IRYCIS), University Hospital Príncipe de Asturias, 28034 Madrid, Spain.
4. Department of Medicine and Medical Specialities, (CIBEREHD), Faculty of Medicine and Health Sciences, University of Alcalá, 28801 Alcalá de Henares, Spain.
5. Department of Nursing and Physiotherapy, Faculty of Medicine and Health Sciences, University of Alcalá, 28801 Alcalá de Henares, Spain.
6. Immune System Diseases-Rheumatology and Internal Medicine Service, University Hospital Príncipe de Asturias, (CIBEREHD), 28806 Alcalá de Henares, Spain.
Received 2024-3-26; Accepted 2024-6-1; Published 2024-7-9
Abstract

Tumor nodules or tumor deposits (TDs) are a histopathological prognostic factor that are associated with a negative evolutionary course in patients with colorectal cancer (CRC). There are still controversial aspects of TDs, including how they should be integrated into the TNM classification system. The objective of this study was to analyze the predictive value of TDs for cancer-related survival (CRS) and time-to-recurrence survival (TTR) and to evaluate the prognostic value of TDs in patients whose tumors also presented lymph node metastasis (LNM). In this retrospective observational study, all patients treated for CRC between January 2010 and December 2020 at the same hospital were included. CRS and TTR were classified by tumor stage. The results were compared between patients whose tumors had TDs and patients whose tumors did not. A total of 1426 patients met the criteria for inclusion in the analysis. TDs were detected in 178 patients (12.5%): 60 had tumors without LNM, and 118 had LNM. Patients with TD tumors had a lower CRS at 60 months after diagnosis (42% vs. 82%; p < 0.001) and a shorter TTR (34% vs. 79%; p < 0.001). Cox multiple regression analysis revealed that the presence of TD was associated with an increased risk of death from CRC (HR: 1.820; 95% CI: 1.327-2.496) and an increased risk of recurrence (HR: 2.315; 95% CI: 1.743-3.073). In each N stage category, the CRS was significantly lower in the subgroup with TD+: in patients with N1a tumors, the CRS was 44% when TD+ vs. 70% when TD- (p = 0.019); in the N1b group it was 36% vs. 66% (p < 0.001); in the N2a group it was 34% vs. 58% (p = 0.012); and in N2b tumors it was 23% vs. 53% (p = 0.031). The present study shows that the information on the presence of TDs is complementary to that provided by LNM and allows the identification of subgroups of patients in each N stage determined by two metrics, CRS and TTR. TDs should be included in the definition of TNM system categories in patients who simultaneously present with LNM.
Keywords: tumor nodules, colorectal cancer, cancer-related survival, time to recurrence, prognostic factors
Introduction
Colorectal cancer (CRC) has a high incidence and mortality rate, being one of the leading causes of death from cancer worldwide. There is particular interest in the identification of clinical or histopathological factors that could reflect its evolutionary course and help us estimate the prognosis of survival or recurrence.
The tumor-node-metastasis (TNM) classification system developed by the American Joint Committee on Cancer (AJCC) and the Union for International Cancer Control is the most widely used system for describing the extent of disease, classifying patients and guiding treatment. The 5th edition of the AJCC TNM staging system, published in 1997, recognized the prognostic value of certain histopathological characteristics of tumors among which the tumor nodules or tumor deposits (TDs) was adopted as a staging factor [1]. The definition of TD has been progressively modified as these have been studied in a more systematic way. Initially, they were considered extensions of the primary tumor in the pericolic fat, regardless of their histology, and were included in category T [2]. In the 7th edition of the AJCC TNM staging system, published in 2009, a histological criterion was used for its definition: "irregular contour and no evidence of residual lymphatic tissue", and was included in category N. In addition, a new subcategory was introduced, named N1c [3]. Patients with stage I or II tumors, with TDs and without regional lymph node metastasis (LNM), were included in this subcategory. This update signifies the recognition of the predictive value for the evolutionary course that TDs bring and was made to indicate the need to administer postoperative adjuvant chemotherapy in this group of patients [2,4]. The AJCC 8th edition, published in 2017, defined TDs more restrictively, as “nodules without histological evidence of residual lymph node or identifiable vascular or neural structure”, though the pN1c subcategory remained unchanged [4].
Various publications have analyzed the association between the presence of TDs and the evolutionary course of the disease. Patients in whom TDs are detected have a lower overall survival (OS) and a lower disease-free survival (DFS) [5-9]. The controversial aspects of TDs include their poorly understood biological significance, the predictive weight associated with their presence, and the effect of the coexistence of LNM. Therefore, the way in which these systems should be integrated into the TNM classification system has been discussed. In the current TNM system, TDs are not considered if they coexist at the same time as LNM. Patients with tumors classified as N1a, N1b, or N2 did not have their classification modified if a TD was detected. However, several publications have reported that patients with stage N1 or N2 tumors exhibit worse disease progression if they present with both LNM and TDs [10-13]. Clinicians doubt how they should interpret the prognostic role of TDs in patients with CRC.
The objective of this study was to analyze the prognostic value of TDs for cancer-related survival (CRS) and time-to-recurrence survival (TTR) and to evaluate the prognostic value of TDs in patients whose tumors also present LNM.
Material and Methods
This was a retrospective observational study. All patients treated for colorectal adenocarcinoma between January 2010 and December 2020 in the General Surgery Department of Hospital Universitario Príncipe de Asturias, Alcala de Henares, Madrid, Spain, were included. The main objective of this study was to analyze the prognostic value of TDs for CRS and TTR in patients with CRC. Survival was calculated for all patients who met the inclusion criteria, and the results were compared between patients with and without TDs. The study adhered to the STROBE guidelines for designing and reporting observational studies. Patients were identified from the computerized database of the Coloproctology Unit, which was prospectively developed during these years. The study was approved by the Ethics Committee of Hospital Príncipe de Asturias (Code: OE 37/2021).
Patients and data
The inclusion criteria were as follows: age over 18 years, histopathology of the primary tumor compatible with colorectal adenocarcinoma, and curative surgical resection of the primary tumor. The exclusion criteria were familial multiple polyposis, adenomatous polyps or tumors in situ, recurrent CRC, mucinous appendicular tumors, surgery performed with noncurative intent, synchronous metastasis, and incomplete pathology (Figure 1).
Flowchart detailing the selection of the patients in this study.
After the diagnosis of CRC, all patients were evaluated by a multidisciplinary medical committee that assessed the possible therapeutic options according to the grade of extension, presence of metastasis in other organs, presence of local complications produced by the tumor, and functional status of the patient.
The clinical data of the patients were obtained from the electronic medical records of the hospital and were stored in an electronic database. The following data related to coincident predictor variables were collected: demographic information (sex and age), location of the primary tumor, surgical procedures, postoperative complications, medical oncological treatment received, and long-term outcome. CRC was staged according to the 8th edition of the TNM classification of the AJCC [4]. Patients with tumors located in the cecum, ascending colon, hepatic angle, or transverse colon were classified as right-sided tumors; those with tumors originating in the splenic flexure, descending colon, or sigmoid colon were classified as left-sided tumors; and those located in the proximal 15 cm of the anus were classified as rectal tumors. There were no missing data for any of the variables that were included in the analysis.
Pathology was reviewed by a gastrointestinal pathologist in order to evaluate the presence of TDs, tumor grade, degree of differentiation, histological type, mucinous component, number of lymph nodes examined, number of lymph nodes metastasized, degree of local tumor infiltration, and extent of perineural or lymphovascular infiltration. TDs were defined as “macroscopic or microscopic nest of cancer, in the pericolorectal adipose tissue`s lymph drainage area of a primary carcinoma, discontinuous from the primary and without histological evidence of residual lymph node or identifiable vascular or neural structure”, as indicated by the 8th edition of the TNM classification of the AJCC [4,5].
After the initial treatment, the patients were followed up in accordance with the current guidelines by means of physical examination, analytical assessment every 6 months during the first 2 years and annually thereafter, annual computed tomography (CT) scans up to the 5th year, and colonoscopy 1 and 3 years after surgery.
Main outcome measures
The primary outcomes of interest were CRS and TTR. Survival was estimated in months from the date of diagnosis to the date of death or the last date of follow-up. To calculate CRS, deaths due to colorectal cancer were considered deaths, and those due to another cause were censored. The TTR was defined as the time from diagnosis to the time of recurrence. Patients with no disease recurrence were censored at the last time when they were known to be recurrence free.
Statistical analysis
The variables were input into a Microsoft Excel 2019 (v.27) (Microsoft, Redmond, WA, USA) spreadsheet. Statistical analysis was performed with SPSS (v.23) (IBM, Armonk, New York, NY, USA).
Initially, the distributions of clinical and histopathological characteristics among patients with tumors with TDs (TD++) and tumors without TD (TD-) were compared using the χ-squared test. Next, survival up to 60 months after diagnosis and median survival for each variable included in the present study were analyzed using the Kaplan‒Meier estimator. The log-rank test was used to compare survival curves.
Finally, the effect of each variable on survival was evaluated using Cox proportional-hazard regression. Cox regression models were built using the backward method. Variables included in the adjusted models were those that had p < 0.05 for the outcome of interest in the univariate analysis. These variables were kept in the final model if they were still significant at p < 0.05. The assumption of proportional hazards across different covariates was tested by inspecting the log (-log) plots. The risk of death or recurrence was expressed as the hazard ratio (HR) with its 95% confidence interval (CI). To avoid collinearity in this analysis, the two factors that make up the N stage, LNM and TD, were studied separately.
Results
Patients and characteristics
A total of 1426 patients met the criteria for inclusion. There were 884 (62%) men and 542 (38%) women. The mean age was 68 ± 11 years (range: 69). The mean follow-up was 56 ± 34 months (median: 51). The tumor was located in the right colon in 471 (33%) patients, in the left colon in 576 (40.4%) patients and in the rectum in 379 (26.6%) patients. Overall, 353 (24.8%) patients had TNM stage I tumors, 582 (40.8%) had stage II tumors, and 491 (34.4%) had stage III tumors. Table 1 shows the distribution of the clinical and histopathological characteristics of the patients.
Patient and tumor characteristics categorised by presence of Tumor Deposit
| NUMBER OF PATIENTS (n=1426) | TUMOR DEPOSIT NEGATIVE (n=1248) | TUMOR DEPOSIT POSITIVE (n=178) | P value | |
|---|---|---|---|---|
| SEX | 0.318 | |||
| Women | 542 | 471 (86.9%) | 71 (13.1%) | |
| Men | 884 | 777 (87.9%) | 107 (12.1%) | |
| TUMOR SITE | 0.885 | |||
| Right Colon | 471 | 413 (87.8%) | 58 (12.3%) | |
| Left Colon | 576 | 506 (87.8%) | 70 (12.2%) | |
| Rectum | 379 | 329 (86.8%) | 50 (13.2%) | |
| AGE (years) | 0.333 | |||
| <50 | 105 | 94 (89.5%) | 11 (10.5%) | |
| 50-69 | 609 | 540 (88.6%) | 69 (11.4%) | |
| >69 | 712 | 614 (86.2%) | 98 (13.7%) | |
| T STAGE | <0.001 | |||
| T1 | 161 | 160 (99.4) | 1 (0.6) | |
| T2 | 246 | 239 (97.2) | 7 (2.8) | |
| T3 | 845 | 729 (86.3) | 116 (13.7) | |
| T4 | 174 | 120 (68.9%) | 54 (31.1%) | |
| LYMPH NODE METASTASIS | <0.001 | |||
| 0 | 994 | 934 (93.9%) | 60 (6.1%) | |
| 1-3 | 319 | 259 (81.2%) | 60 (18.8%) | |
| >3 | 113 | 55 (48.7%) | 58 (51.3%) | |
| TUMOR GRADE | <0.001 | |||
| Well-Moderately Differentiated | 1317 | 1168 (88.7%) | 149 (11.3%) | |
| Poorly Differentiated | 109 | 80 (73.4%) | 29 (26.6%) | |
| LYMPHOVASCULAR INFILTRATION | <0.001 | |||
| No | 1202 | 1112 (92.5%) | 90 (7.5%) | |
| Yes | 224 | 136 (60.7%) | 88 (39.3%) | |
| PERINEURAL INFILTRATION | <0.001 | |||
| No | 1225 | 1124 (91.7%) | 101 (8.3%) | |
| Yes | 201 | 124 (61.7%) | 77 (38.3%) | |
| HISTOLOGIC TYPE | 0.098 | |||
| Adenocarcinoma | 1292 | 1136 (88%) | 156 (12%) | |
| Mucinous | 134 | 112 (83.6%) | 22 (16.4%) | |
| INTESTINAL OBSTRUCTION | 0.041 | |||
| Absent | 1304 | 1148 (88%) | 156 (12%) | |
| Present | 122 | 100 (82%) | 22 (18%) | |
| TUMOR PERFORATION | <0.001 | |||
| Absent | 1360 | 1202 (88.4%) | 158 (12.6%) | |
| Present | 66 | 46 (69.7%) | 20 (30.7%) | |
| POSTOPERATIVE ADJUVANT CHEMOTHERAPY | <0.001 | |||
| No | 796 | 743 (93.3%) | 53 (6.7%) | |
| Yes | 623 | 513 (82.3%) | 110 (17.7%) |
χ2 test was used to calculate the P‑values.
Patient and tumor characteristics categorized by the detection of tumor depth
TDs were detected in 178 patients (12.5%) (Figure 2). Of these, 60 (33.7%) had tumors that did not present LNM, while in 118 (66.3%) the TD coexisted with LNM. The incidence of TD increased as the number of LNMs increased (6.1% in LNM-negative tumors, 18.8% in tumors with 1-3 LNMs and 51.3% in tumors with > 3 LNMs; p < 0.001).
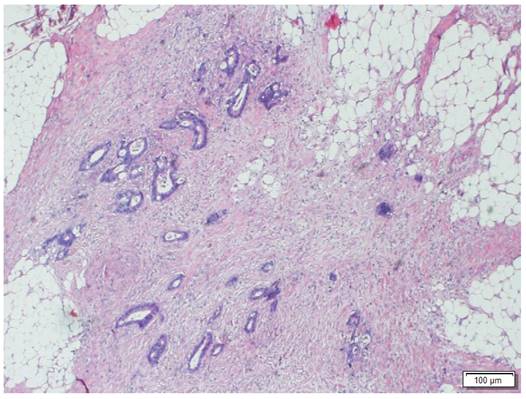
Morphologic image of a Tumor Deposit. Neoplastic cells infiltrating pericolic adipose tissue. Hematoxylin and Eosin staining, 40 X.
The incidence of TDs did not differ by sex, age, location of the primary tumor, or histologic type. TDs were associated with higher T stage (0.6% in T1, 2.8% in T2, 13.7% in T3 and 31.1% in T4; p < 0.001), poorly differentiated tumors (26.6 vs. 11.3%; p < 0.001), lymphovascular infiltration (39.3 vs. 7.5%; p < 0.001), perineural infiltration (38.3 vs. 8.3%; p < 0.001), tumors that presented intestinal obstruction (18 vs. 12%; p = 0.041), and perforated tumors (30.7 vs. 12.6%; p < 0.0.001). Among the 178 tumors with TDs, 88 (49.3%) also had lymphovascular infiltration, and 77 (43.2%) also had perineural infiltration.
Cancer-related survival
During follow-up, 262 patients died due to CRC. Kaplan-Meier estimates of CRS at 60 months after diagnosis for the entire cohort were 77%. CRS at 60 months was lower in patients with TD (42% vs. 82%; p < 0.001) (HR: 4.497; 95% CI: 3.466-5.835). The results of the univariate survival analysis are shown in Table 2, including all the clinical and histopathological variables analyzed.
Tumor characteristics and Kaplan-Meier estimates of Cancer Related Survival at 60 months after diagnosis.
| PATIENTS (n) | CANCER RELATED SURVIVAL (60 months) | P VALUE | HAZARD RATIO | 95% CI | |
|---|---|---|---|---|---|
| AGE (years) | <0.001 | ||||
| >70 | 712 | 71 | 1 | ||
| 50-69 | 609 | 82 | 0.559 | 0.334-0.934 | |
| <50 | 105 | 81 | 0.528 | 0.407-0.686 | |
| SEX | 0.496 | ||||
| Male | 884 | 76 | 1 | ||
| Female | 542 | 79 | 0.917 | 0.712-1.179 | |
| TUMOR LOCALIZATION | 0.073 | ||||
| Right Colon | 471 | 74 | 1 | ||
| Left Colon | 576 | 79 | 0.747 | 0.546-1.020 | |
| Rectum | 379 | 79 | 0.751 | 0.568-0.993 | |
| T STAGE | <0.001 | ||||
| T1 | 161 | 96 | 1 | ||
| T2 | 246 | 89 | 17.349 | 7.130-43.691 | |
| T3 | 845 | 76 | 6.436 | 2.644-15.670 | |
| T4 | 174 | 48 | 2.629 | 0.987-7.006 | |
| LYMPH NODE METASTASIS | <0.001 | ||||
| 0 | 994 | 87 | 1 | ||
| 1-3 | 319 | 63 | 5.987 | 4.339-8.261 | |
| >3 | 113 | 39 | 2.896 | 2.202-3.811 | |
| INTESTINAL OBSTRUCTION | <0.001 | ||||
| Absent | 1304 | 78 | 1 | ||
| Present | 122 | 62 | 2.075 | 1.465-2.938 | |
| TUMOR PERFORATION | <0.001 | ||||
| Absent | 66 | 79 | 1 | ||
| Present | 1360 | 46 | 3.853 | 2.632-5.639 | |
| TUMOR DEPOSIT | <0.001 | ||||
| Absent | 1248 | 82 | 1 | ||
| Present | 178 | 42 | 4.497 | 4.366-5.835 | |
| LYMPHOVASCULAR INFILTRATION | <0.001 | ||||
| Absent | 1202 | 82 | 1 | ||
| Present | 224 | 51 | 3.567 | 2.765-4.603 | |
| PERINEURAL INFILTRATION | <0.001 | ||||
| Absent | 1225 | 81 | 1 | ||
| Present | 201 | 56 | 2.907 | 2.223-3.802 | |
| HISTOLOGIC TUMOR TYPE | 0.015 | ||||
| Classical Adenocarcinoma | 1292 | 78 | 1 | ||
| Mucinous Carcinoma | 134 | 71 | 1.558 | 1.086-2.233 | |
| GRADE OF DIFFERENTIATION | <0.001 | ||||
| Well-Moderately Differentiated | 1317 | 78 | 1 | ||
| Poorly Differentiated | 109 | 60 | 2.410 | 1.702-3.413 | |
| POSTOPERATIVE ADJUVANT CHEMOTHERAPY | 0.304 | ||||
| No | 796 | 78 | 1 | ||
| Yes | 623 | 77 | 1.136 | 0.890-1.499 |
95% CI: 95% Confidence Interval
Other factors that were significantly associated with survival were T stage (96% in T1, 89% in T2, 76% in T3, 48% in T4; p <p.001), Lymph Node Metastasis (87% in tumors with 0 LNM, 63% in tumors with 1-3 LNM and 39% in tumors with more than 3 LNM; p< 0.001), presence of intestinal obstruction (62 vs. 78%; p< 0.001), presence of tumor perforation (46 vs. 79%; p< 0.001), lymphovascular infiltration (51 vs. 82%; p< 0.001), perineural infiltration (56 vs. 81%; p< 0.001), poor grade of differentiation (60 vs. 78%; p.001), and mucinous histologic type (71 vs. 78%; p=0.015).
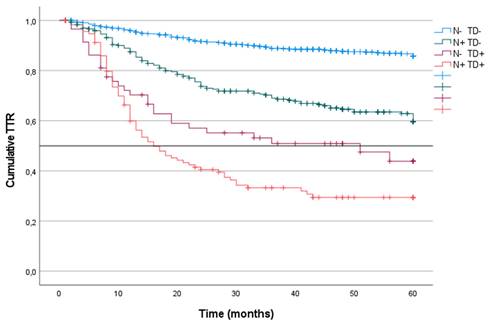
CRS categorized by the presence of tumor deposits and lymph node metastases
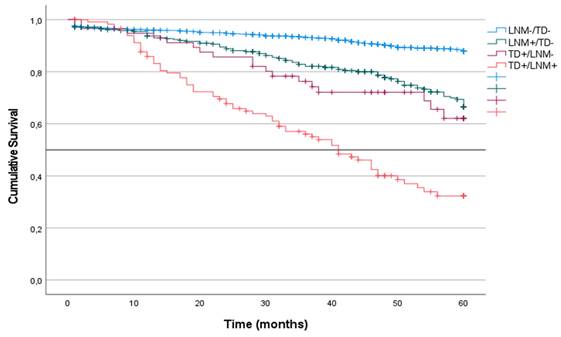
CRS was analyzed in the four groups of patients in the cohort. CRS incidence was defined according to the presence or absence of LNM or TD without considering other coinciding factors. Patients with TD- or LNM- tumors had the highest survival at 60 months of follow-up (87%). CRS was similar in patients with LNM+/TD- and in patients with TD++/LNM- (62% and 63%, respectively). In contrast, patients with TD++/LNM+ tumors had the lowest survival (36%; median: 41) (p < 0.001) (Figure 3).
Kaplan-Meier estimates of CRS for the entire cohort according to the presence of Tumor Deposit and Lymph Node Metastasis. Horizontal bar denotes median survival.
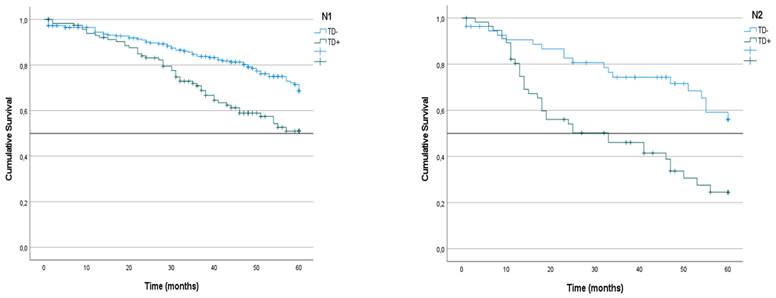
Next, CRS was analyzed in the three subgroups of patients included in the N1 subgroup according to the 8th edition of the AJCC TNM system. Survival was higher in the N1a subgroup (67%) than the N1b (57%) and N1c subgroups (63%), although the difference between them was not statistically significant (p = 0.086).
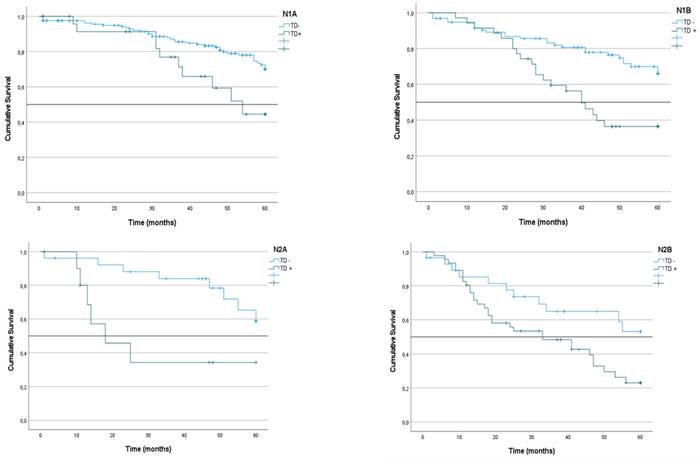
We analyzed the CRS of patients with LNM classified according to the presence or absence of TDs. In the group of patients with N1 tumors, survival was lower among those with TD+ tumors than among those with TD- tumors (51% vs. 68%; p < 0.001) (Figure 4). The same difference was seen in the subgroups with TD+ N1a tumors (44% vs. 70%; p = 0.019) and TD+ N1b tumors (36% vs. 66%; p < 0.001) (Table 3) (Figure 5). Similarly, in the group of patients with N2 tumors, CRS was lower among the patients with TD++ tumors (25% vs. 56%; 0 < 0.001) (Figure 3), including in the subgroups of patients with N2a tumors TD+ (34% vs. 58%; p = 0.012) and N2b tumors (23% vs. 53%; p = 0.031) (Table 3) (Figure 4).
Kaplan-Meier estimates of CRS in N1 and N2 tumors according to presence of Tumor Deposit. Horizontal bars denote median survival.
Kaplan-Meier estimates of Overall Survival in N1 and N2 subgroups categorized by presence/absence of Tumor Deposits
| CRS ACCORDING TO TNM SYSTEM | CRS CATEGORIZED BY PRESENCE/ABSENCE OF TD | ||||||
|---|---|---|---|---|---|---|---|
| TD positive | TD Negative | ||||||
| CRS | median | CRS | median | CRS | median | P value | |
| N1 | 63 | - | 51 | - | 68 | - | <0.001 |
| N2 | 39 | 51 | 24 | 33 | 56 | - | <0.001 |
| N1a | 67 | - | 44 | 54 | 70 | - | 0.019 |
| N1b | 57 | - | 36 | 40 | 66 | - | <0.001 |
| N1c | 63 | - | 63 | - | - | - | - |
| N2a | 51 | - | 34 | 18 | 58 | - | 0.012 |
| N2b | 34 | 46 | 23 | 33 | 53 | - | 0.031 |
Kaplan-Meier estimates of CRS in N1a, N1b, N2a and N2b tumors according to presence of Tumor Deposit. Horizontal bars denote median survival.
According to our multiple regression analysis, the presence of TDs had a significant adverse effect on CRS (HR: 1.820; 95% CI: 1.397-2.496; p< 0.001) (Table 4). The other factors that showed an independent predictive value are listed in Table 4. The negative effect of LNM on the prognosis of survival had a HR of 2.661 (95% CI: 1.804-3.926) in patients with 1-3 vs. 0 LNMs and 1.961 (95% CI: 1.466-2.622) in patients with > 3 vs. 1-3 LNMs.
Predictive factors of Cancer Related Survival analyzed using Cox's proportional hazards model.
| P VALUE | HR | 95% CI | |
|---|---|---|---|
| AGE | <0.001 | ||
| >70 | 1 | ||
| 50-69 | 0.434 | 0.256-0.736 | |
| <50 | 0.530 | 0.405-0.692 | |
| TUMOR LOCALIZATION | 0.034 | ||
| Right Colon | 1 | ||
| Left Colon | 1.045 | 0.755-1.446 | |
| Rectum | 0.722 | 0.541-0.962 | |
| T STAGE | <0.001 | ||
| T1 | 1 | ||
| T2 | 7.324 | 2.878-18.635 | |
| T3 | 3.739 | 1.519-9.201 | |
| T4 | 2.362 | 0.886-6.300 | |
| LYMPH NODE METASTASIS | <0.001 | ||
| 0 | 1 | ||
| 1-3 | 2.661 | 1.804-3.926 | |
| >3 | 1.961 | 1.466-2.622 | |
| TUMOR DEPOSIT | <0.001 | 1.820 | 1.327-2.496 |
| LYMPHOVASCULAR INFILTRATION | 0.001 | 1.628 | 1.208-2.195 |
| INTESTINAL OBSTRUCTION | 0.003 | 1.751 | 1.208-2.538 |
| TUMOR PERFORATION | 0.001 | 2.086 | 1.363-3.194 |
HR: Hazard Ratio, 95% CI: 95% Confidence Interval
In addition, we analyzed separately the effect of TDs on CRS in the group of TNM Stage III patients (Table 5). The multiple regression analysis, showed that in this group TDs had, also, a significant adverse effect on CRS (HR: 2.040; 95% CI: 1.411-2.950).
Prognostic factors of Cancer Related Survival in TNM Stage III patients analysed using Cox´s proportional hazards model
| P VALUE | HR | 95% CI | |
|---|---|---|---|
| AGE | <0.001 | ||
| >70 | 1 | ||
| 50-69 | 0.506 | 0,282-0.910 | |
| <50 | 0.482 | 0.345-0.674 | |
| T STAGE | 0.002 | ||
| T1 | 1 | ||
| T2 | 4.322 | 0.588-31.784 | |
| T3 | 2.156 | 0.298-15.577 | |
| T4 | 2.545 | 0.327-19.795 | |
| LYMPH NODE METASTASIS | 0.003 | ||
| 0 | 1 | ||
| 1-3 | 2.628 | 1.474-4.687 | |
| >3 | 1,927 | 1.087-3.415 | |
| TUMOR DEPOSIT | <0.001 | 2.040 | 1.411-2.950 |
| LYMPHOVASCULAR INFILTRATION | 0.014 | 1.536 | 1.091-2.161 |
HR: Hazard Ratio, 95% CI: 95% Confidence Interval
Time to recurrence
During follow-up, 320 (22.4%) patients experienced tumor recurrence. The Kaplan-Meier estimate of TTR at 60 months after diagnosis for the entire cohort was 73%. TTR at 60 months was lower in patients with TD+ tumors than in patients with TD- tumors (34% vs. 79%; p < 0.001) (HR: 5.172; 95% CI: 4.082-6.551). The results of the univariate survival analysis are given in Table 6.
Tumor characteristics and Kaplan-Meier estimates of Time to Recurrence Survival at 60 months after diagnosis.
| PATIENTS (n) | TIME TO RECURRENCE (60 months) | P value | Hazard Ratio | 95% CI | |
|---|---|---|---|---|---|
| AGE (years) | 0.107 | ||||
| >70 | 712 | 71 | 1 | ||
| 50-69 | 609 | 76 | 0.869 | 0.571-1.324 | |
| <50 | 105 | 75 | 0.782 | 0.624-0.984 | |
| SEX | 0.142 | ||||
| Male | 884 | 71 | 1 | ||
| Female | 542 | 76 | 0.842 | 0.668-1.060 | |
| TUMOR SITE | 0.234 | ||||
| Right Colon | 471 | 73 | 1 | ||
| Left Colon | 576 | 75 | 1.101 | 0.836-1.450 | |
| Rectum | 379 | 71 | 0.879 | 0.676-1.143 | |
| T STAGE | <0.001 | ||||
| T1 | 161 | 95 | 1 | ||
| T2 | 246 | 87 | 18.573 | 8.103-42.571 | |
| T3 | 845 | 71 | 7.050 | 3.131-15.876 | |
| T4 | 174 | 42 | 2.862 | 1.178-6.953 | |
| LYMPH NODE METASTASIS | <0.001 | ||||
| 0 | 994 | 83 | 1 | ||
| 1-3 | 319 | 57 | 6.224 | 4.635-8.358 | |
| >3 | 113 | 32 | 2.397 | 2.397-3.931 | |
| INTESTINAL OBSTRUCTION | 0.003 | ||||
| Present | 1304 | 74 | 1 | ||
| Absent | 122 | 60 | 1.680 | 1.193-2.367 | |
| TUMOR PERFORATION | <0.001 | ||||
| No | 1360 | 74 | 1 | ||
| Yes | 66 | 51 | 2.582 | 1.689-3.947 | |
| TUMOR DEPOSIT | <0.001 | ||||
| Absent | 1248 | 79 | 1 | ||
| Present | 178 | 34 | 5.172 | 4.082-6.551 | |
| LYMPHOVASCULAR INFILTRATION | <0.001 | ||||
| Absent | 1202 | 78 | 1 | ||
| Present | 224 | 45 | 3.532 | 2.794-4.464 | |
| PERINEURAL INFILTRATION | <0.001 | ||||
| Absent | 1225 | 77 | 1 | ||
| Present | 201 | 49 | 3.058 | 2.393-3.907 | |
| HISTOLOGIC TUMOR TYPE | 0.273 | ||||
| Classical Adenocarcinoma | 1292 | 74 | 1 | ||
| Mucinous Carcinoma | 134 | 70 | 1.219 | 0.854-1.739 | |
| GRADE OF DIFFERENTIATION | <0.001 | ||||
| Well-Moderately Differentiated | 1317 | 75 | 1 | ||
| Poorly Differentiated | 109 | 58 | 2.093 | 1.497-2.962 | |
| POSTOPERATIVE ADJUVANT CHEMOTHERAPY | <0.001 | ||||
| Yes | 623 | 67 | 1 | ||
| No | 796 | 79 | 0.627 | 0.502-0.783 |
HR: Hazard Ratio. 95%CI: 95% Confidence Interval
Other factors that were associated with TTR were T stage (95% in T1, 87% in T2, 71% in T3, 42% in T4; p < 0.001), number of LNMs (83% in tumors with 0 LNM, 57% in tumors with 1-3 LNM, 32% in tumors with more than 3 LNM; p< 0.001), presence of intestinal obstruction (60% vs. 74%; p< 0.001), presence of tumor perforation (51% vs. 74%; p< 0.001), lymphovascular infiltration (45% vs. 78%; p< 0.003), perineural infiltration (49% vs. 77%; p< 0.001), and poor grade of differentiation (58 vs. 75%; p<0.001) (Table 6).
Time to recurrence categorized by the presence of tumor nodes and lymph node metastasis
The TTR was analyzed at 60 months in the four groups of patients in the entire cohort according to the presence or absence of LNM and TD. Patients with TD- or LNM- tumors (85%) had a greater TTR than did patients with LNM+/TD- tumors (59%) or TD+/LNM- tumors (43%; mean: 51). The LNM+/TD+ patients had the lowest TTR (29%; mean: 16) (p < 0.001) (Figure 6).
Kaplan-Meier estimates of TTR for the entire cohort according to the presence of Tumor Deposit and Lymph Node Metastasis. Horizontal bar denotes median Survival.
We analyzed the TTR at 60 months of follow-up in the three subgroups of patients defined within category N1 according to the definition of the 8th edition of the AJCC TNM system. TTRs were significantly lower in N1c patients (44%; mean: 51) than in N1a patients (59%) and N1b patients (54%) (p = 0.033) (Table 7).
Kaplan-Meier estimates of TTR in N1 and N2 subgroups categorized by presence/absence of Tumor Deposits
| CRS ACCORDING TO TNM SYSTEM | CRS CATEGORIZED BY PRESENCE/ABSENCE OF TD | ||||||
|---|---|---|---|---|---|---|---|
| TD positive | TD negative | ||||||
| TTR | Median | TTR | Median | TTR | Median | P value | |
| N1 | 55 | - | 39 | 28 | 63 | - | <0.001 |
| N2 | 31 | 22 | 23 | 15 | 42 | 50 | 0.008 |
| N1a | 59 | - | 45 | 43 | 62 | - | 0.020 |
| N1b | 54 | - | 27 | 16 | 65 | - | <0.001 |
| N1c | 44 | 51 | 44 | 51 | - | - | - |
| N2a | 39 | 60 | 36 | 12 | 42 | 60 | 0.276 |
| N2b | 27 | 17 | 20 | 16 | 41 | 41 | 0.053 |
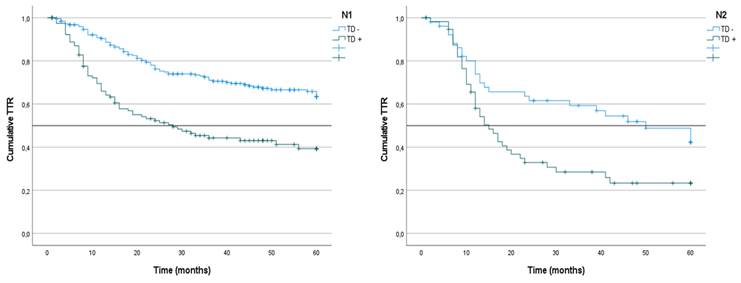
We analyzed the TTR of patients who were LNM+ classified according to the presence or absence of TD. In the N1 patients as a whole, the TTR was lower among the cases that presented LNM+/TD+ (39%; mean: 28) than in the LNM+/TD- patients (63%) (p < 0.001) (Figure 6). In the N1a subgroup, the TTR was lower in the TD+ patients (45%; median 43) than in the TD- patients (62%) (p = 0.020). Similarly, in N1b patients, the TTR was lower in TD+ patients (27%; median: 16) than in TD- patients (65%) (p < 0.001) (Table 7).
In N2 patients, the TTR was lower among the TD+LNM+/TD+ patients (23%; mean 15) than among the LNM+/TD- patients (42%; mean: 50) (p = 0.008) (Figure 7). Among the N2a patients, the TTR was lower in patients with TD+ tumors, although the difference was not significant (36%; median: 12 vs. 42%; median: 50) (p = 0.276). Similarly, in N2b patients, the TTR was also lower among TD+ patients (20%; median: 16 vs. 41%; median: 41) (p = 0.053) (Table 7).
Kaplan-Meier estimates of TTR in N1 and N2 tumors according to presence of Tumor Deposit. Horizontal bars denote median Survival.
According to our multiple regression analysis, the presence of TDs was associated with a significant adverse effect on the TTR (HR=2.315; 95% CI: 1.743-3.073; p< 0.001) (Table 8). The other factors that showed an independent predictive value are shown in Table 8. The negative effect of LNM on the prognosis of TTR had a HR of 2.455 (95% CI: 1.719-3.507) in patients with 1-3 vs. 0 LNMs and 2.061 (95% CI: 1.588-2.676) in patients with > 3 vs. 1-3 LNMs.
Predictive factors of Time to Recurrence Survival analyzed using Cox's proportional hazards model.
| P value | HR | 95% CI | |
|---|---|---|---|
| TUMOR LOCALIZATION | 0.002 | ||
| Right Colon | 1 | ||
| Left Colon | 1.333 | 1.005-1.767 | |
| Rectum | 0.820 | 0.628-1.070 | |
| T STAGE | <0.001 | ||
| T1 | 1 | ||
| T2 | 8.942 | 3.825-20.903 | |
| T3 | 4.569 | 2.014-10.365 | |
| T4 | 2.530 | 1.040-6.151 | |
| LYMPH NODE METASTASIS | <0.001 | ||
| 0 | 1 | ||
| 1-3 | 2.455 | 1.719-3.507 | |
| >3 | 2.061 | 1.588-2.676 | |
| TUMOR DEPOSIT | <0.001 | 2.315 | 1.743-3.073 |
| LYMPHOVASCULAR INFILTRATION | 0.005 | 1.492 | 1.353-2.674 |
HR: Hazard Ratio, 95% CI: 95% Confidence Interval
In addition, we analyzed separately the effect of TDs on TTR in the group of TNM Stage III patients (Table 9). The multiple regression analysis, showed that in this group TDs had, also, a significant adverse effect on CRS (HR: 1.902; 95% CI: 1.411-2.950).
Prognostic factors of Time to Recurrence in TNM Stage III analysed using Cox´s proportional hazards model
| P VALUE | HR | 95% CI | |
|---|---|---|---|
| T STAGE | 0.007 | ||
| T1-2 | 1 | ||
| T3 | 2.368 | 1.232-4.549 | |
| T4 | 1.512 | 0.831-2.752 | |
| LYMPH NODE METASTASIS | 0.121 | ||
| 0 | 1 | ||
| 1-3 | 1.460 | 0.905-2.354 | |
| >3 | 1.142 | 0.711-1.837 | |
| TUMOR DEPOSIT | <0.001 | 1.902 | 1.353-2.674 |
| LYMPHOVASCULAR INFILTRATION | 0.019 | 1.438 | 1.062-1.947 |
HR: Hazard Ratio, 95% CI: 95% Confidence Interval
Discussion
The results obtained in this study confirm that a negative prognosis is associated with the presence of TDs in patients with CRC. Patients with TD+ tumors had lower CRSs and TTRs at 60 months after diagnosis. According to our multiple regression analysis, the presence of TD was associated with an increased risk of death from CRC (HR: 1,820; 95% CI: 1,327-2,496) and an increased risk of recurrence (HR: 2.315; 95% CI: 1,743-3,073). Although the prognostic value of the presence of TDs was lower than that of LNM, the TD density had independent prognostic value and provided complementary information to that brought by LNM.
We found that patients with LNM+/TD- and patients with LNM-/TD++ presented comparable CRS and TTR (CRS: 63% and 62%; TTR: 59% and 43%, respectively). Patients with tumors in which both factors were present had the lowest survival (36%; median: 41) (p < 0.001) and the lowest TTR (29%; median: 16) (p < 0.001). On the other hand, in each category of N stage, the CRS and TTR were lower in the patients who had TDs, which allowed us to identify two subgroups of patients differentiated by each of CRS and TTR.
The interest for the presence of TD in CRC is not new. This mater has been extensively investigated since 1997, when the AJCC adopted TD as a staging factor. TD has been gaining importance due to its prognostic value and subsequent implications in staging and treatment of CRC, which is shown by the high number of studies published during the last years. However, the pathobiological significance is still poorly understood, and its possible inclusion in the TNM classification system is still controversial. Our study has been performed following of definition of TD indicated by 8th edition of the AJCC TNM staging system. There are two publications designed according to those criteria [14,15]. We coincide with those publications that the incidence of TD in non-metastatic CRC (9-12%) is lower than that found in studies developed following the previous criteria defined in the 7th edition of the TNM system (7%-35%, dependent on the studied population; average 22%) [2,5]. In addition, we have studied a clinical series of patients and not a population-based cohort, which allows a closer follow-up and a more detailed collection of clinical data. This fact enabled to analyze concurrently survival and recurrence”.
LNM and TD were the histopathological variables that had the greatest independent prognostic weight in our study, which supports the inclusion of both variables in the definition of N-stage in the TNM system. The discussion ought to be on how to include TDs in that classification. The current system only considers TD when LNM does not coexist, which, in view of the results obtained, is insufficient. The TDs provide information independent of that provided by LNM and that is complementary. We verified that the determination of TDs allows the identification of risk subgroups within each N stage category that are not identified by the current system and characterized by having differentiated CRS and TTR. According to the 8th edition of the TNM system, a patient with a tumor containing 1-3 LNMs but without TD should be classified as the N1, as would another patient with the same number of LNMs but with TD+, which, as we have shown, is not appropriate. According to our data, the prognosis of patients in the latter group was closer to that of patients in the N2b subgroup. Additionally, a tumor with 4 or more LNMs but with a TD+ status was classified as N2b when the survival observed in our study was more typical of a stage IV tumor.
These data coincide with what has been published by several authors who, like us, have evaluated the prognostic value of TDs by classifying them in a categorical way (presence or absence) [6,15-18]. Therefore, it has been proposed to modify the current classification system so that two subgroups are considered in each category of N stage (patients with or without TD). Pei [19] compared the predictive results provided by a new classification system carried out according to this principle and the 7th edition of the TNM system. The new classification showed greater prognostic power (AUC = 0.628, 95% CI=0.616-0.640) than did the TNM classification (AUC = 0.618; 95% CI=0.606-0.630) (p = 0.006). Furthermore, the creation of a new category called category N2c or N3 has been proposed; this category includes patients in which both factors coexist [13,20].
Other authors have reported that quantifying the number of TDs can provide more information than can determine the presence or absence [5,9,21,22]. These authors proposed a new way to classify category N, in which the total sum of the number of deposits and the number of metastasized nodes was considered. Thus, a patient with 3 LNMs and a deposit, which would be classified, according to the current TNM system, as N1a, would progress, according to this proposal, to N2a. In three publications based on retrospective data [11,21,23], the new N category based on the “quantitative approach” provided better prediction of DFS and OS than the N category collected in the current TNM system. The results of two studies in which the prognostic value of TDs was analyzed on data from phase III clinical trials are also known [24,25]. The patients in whom the N stage was modified from N1 to N2 according to the number of TDs and LNMs had significantly shorter DFS than the N1 patients, and the DFS was comparable to that of patients initially classified as N2. A retrospective study carried out with 500 stage III patients revealed that the number of TDs was correlated with DFS and OS [26]. In this study, four groups of patients were defined according to the combination of TD and LNM, and a new category, N3, was incorporated, which included tumors with more than 10 TD+ LNMs. The three-year DFS was 86% in the N1, 74% in N2a, 58% in N2b, and 39% in N3 (p < 0.001).
The authors who have evaluated the results of this “quantitative” approach recognize that the differences between TDs and LNMs are evident in multiple ways, such as anatomical distribution, biological aggressiveness of the primary tumor, and predictive value. They do agree that the sum of the number of TDs and LNMs provides a better estimate of the evolutionary prognosis than the current classification [2].
Two other publications have compared the results of the two proposals for a new definition of category N [16,27]. The evaluation of the number of TDs provided more information than that provided only by their presence/absence. In Liu's study [18], the OS of patients with 1 TD was slightly worse than that of patients with 1 LNM (p = 0.02), but no differences were found when 2 or more TDs were present. We were not able to include the number of TDs as a study variable, so we cannot support one option over another. We believe that the categorical classification of the presence/absence of TDs provides valuable predictive information that allows us to differentiate risk subgroups within each of the N categories that are not identified by the current TNM system. The presence of TD provides an added risk, so patients who meet these two criteria should move to a higher risk category. We consider Lino-Silva's proposal [20] to create a category N3, which includes patients who are currently classified as N2b but have TD+, and that patients now classified as N1b but with TD+ should now be considered N2b. More prospective studies are needed to determine how to integrate TDs into category N of the TNM system in patients who have both TDs and LNMs.
TDs are carcinoma foci separated from the primary tumor and located in the lymphatic drainage area. It is thought that these differences may be due to various causes, such as discontinuous local infiltration or lymphovascular or perineural spread. These lesions may represent lymph nodes or vascular or nerve structures completely filled with carcinoma. TDs are a histopathological marker that reflects the degree to which a tumor is aggressive, possibly through a greater capacity for migrating or infiltrating neighboring mesenchymal tissues. This means that patients with TD+ tumors have a lower survival rate and a higher incidence of recurrence [2].
Conclusions
The results of our study showed that the presence of TDs was associated with a negative evolutionary course in patients with CRC, characterized by a lower CRS and TTR at 60 months after diagnosis. The predictive information derived from TD complements that provided by the presence of LNM and allows the identification of two subgroups of patients in each N stage category, CRS and TTR. The TD should be included in the definition of the TNM system in patients who simultaneously present with LNM.
Acknowledgements
Funding
This research was coordinated by ProA Capital, Halekulani S.L., MJR and cofinanced by the Euro-pean Development Regional Fund “A way to achieve Europe”, as well as P2022/BMD-7321 (Co-munidad de Madrid).
Author contributions
Conceptualization, MDA, FMM and AGC; validation, CVM, and BM; formal analysis, MDA, MAO and FMM, IBM.; investigation, MDA, FMM, and AGC; data curation, MDA, BM, RJ, YA, AV; writing—original draft preparation, MDA, SB, RDP, MAO.; writing—review and editing, MDA, MAO, SB, RDP, BM, CVM, RJ, and YA; supervision, MDA, and AGC; project administration, MDA, and MAM; funding acquisition, MAO, and MAM. All authors have read and agreed to the published version of the manuscript.
Institutional review board statement
The study was carried out in accordance with the basic ethical principles of autonomy, beneficence, nonmaleficence and distributive justice, and its development followed the rules of Good Clinical Practice, the principles contained in the most recent Declaration of Helsinki (2013) and the Oviedo Convention (1997). The collected data and information complied with the current legislation on data protection (Organic Law 3/5 December 2018 on the Protection of Personal Data and the Guarantee of Digital Rights and Regulation (EU) 2016/679) approved by Hospital Universitario Principe de Asturias (OE 37/2021).
Data availability statement
The data used to support the findings of the present study are available from the corresponding author upon request.
Competing Interests
The authors have declared that no competing interest exists.
References
1. Sobin LH, Fleming ID. TNM Classification of Malignant Tumors, fifth edition (1997). Union International Contre le Cancer and American Joint Committee on Cancer. Cancer. 1997;80:1803-4
2. Ueno H, Nagtegaal ID, Quirke P, Sugihara K, Ajioka Y. Tumor deposits in colorectal cancer: Refining their definition in the TNM system. Ann Gastroenterol Surg. 2023;7:225-235
3. Sobin LH, Gospadarowicz MK, Wittekind C. TNM Classification of Malignant Tumors (7th edn). Chischester. Wiley-Blackwell. 2009
4. Amin MB, Edge SB. (2017) AJCC cancer staging manual 8th edition. Springer International Publishing AG, New York, NY.
5. Nagtegaal ID, Knijn N, Hugen N, Marshall HC, Sugihara K, Tot T. et al. Tumor deposits in colorectal cancer: improving the value of modern staging- a systematic review and meta-analysis. J Clin Oncol. 2017;35:1119-1127
6. Lundstrom S, Agger E, yDrup ML, Jorgen F, Buchwald P. Adverse impact of tumor deposits in lymph node negative rectal cancer. A national cohort study. Int J Colorectal Dis. 2023;38:66
7. Khan H, Radomski S, Siddiqi A, Zhou N, Paneitz D, Johnston FM, Grer JB. Tumor deposits are associated with a higher risk of peritoneal disease in non-metastatic colorectal cancer patients. J Surg Oncol. 2023;127:975-982
8. Wu W, Zeng S, Zhang X, Liu P, Li S, Gong P. The value of tumor deposits in evaluating colorectal cancer survival and metastasis: a population-based retrospective cohort study. World J Surg Oncol. 2022;20:41
9. Pu H, Pang X, Fu J, Zheng R, Chen R, Chen Y. et al. Significance of tumor deposits combined with lymph node metastasis in stage III colorectal cancer patients: a retrospective multi-center cohort from China. Int J Colorectal Dis. 2022;37:1411-1420
10. Wong-Chong N, Motl J. Hwang G, Nassif GJ, Albert MR, Monson JRT, et al. Impact of tumor deposits on oncologic outcomes in stage III colon cancer. Dis Colon Rectum. 2018;61:1043-1052
11. Delattre JF, Selcen A, Cohen R, Shi Q, Emile JF, Taieb J, A comprehensive overview of tumour deposits in colorectal cancer. towards a next TNM classification. Cancer Treat Rev. 2022;103:102325
12. Zheng P, Chen L, Yang W, Chen Z. Prognostic significance of Tumor Deposits in combination with Lymph Node Metastasis in Stage III Colon Cancer: A Propensity Score Matching Study. Am Surgeon. 2020;86:164-170
13. Pricolo VE, Steingrimsson J, McDuffie TJ, McHale JM, McMillen B, Shparber M. Tumor Deposits in Stage III Colon Cancer. Correlation with other Histopathologic variables, Prognostic Value, and Risk Stratification - Time to consider “N2c”. Am J Clin Oncol. 2020;43:133-138
14. Jorgren F, Agger E, Lydrup ML, Buchwald P. Tumor deposits in colon cancer predict recurrence and reduced survival in a nationwide population-based study. BJS Open. 2023;7:zrad122
15. Hakki L, Khan A, Do E, Gonen M, Firat C, Vakiani E. et al. Tumour deposits are independently associated with recurrence in colon cancer. Colorectal Disease. 2024;26:459-464
16. Mirkin K, Kulaylat AS, Hollenbeak CS, Messaris E. Prognostic Significance of Tumor Deposits in Stage III Colon Cancer. Ann Surg Oncol. 2018;25:31793184
17. Mayo E, Llanos AA, Xi X, Duan SZ, Zhang L. Prognostic value of tumour deposit and perineural invasion status in colorectal cancer patients: a SEER-based population study. Histopathology. 2016;69:230-238
18. Liu F, Zhao J, Li C, Wu Y, Song W, Guo T. et al. The unique prognostic characteristics of tumor deposits in colorectal cancer patients. Ann Transl Med. 2019;7:769
19. Pei JP, Zhang CD, Fu X, Ba Y, Yue S, Zhao ZM, Dai DQ. A modified tumor-node-metastasis classification for stage III colorectal cancers based on treating tumor deposits as positive lymph nodes. Front Med. 2020;7:571154
20. Lino-Silva L, Xinaxtle D, Salcedo-Hernandez RA. Tumor deposits in colorectal cancer: the need for a new “pN” category. Ann Transl Med. 2020;8:733
21. Song YX, Gao P, Wang ZN, Liang JW, Sun Z, Wang MX. et al. Can the tumor deposits be counted as metastatic lymph nodes in the UICC TNM staging system for colorectal cancer? PLos One. 2012;7:e34087
22. Li J, Yang S, Hu J, du F, Yin J, Liu S. et al. Tumor deposits counted as positive lymph nodes in TNM staging for advanced colorectal cancer: a retrospective multicenter study. Oncotarget. 2016;7:18269-79
23. Athanasakis E, Xenaki S, Venianaki M, Chalkiadakis G, Chrysos E. Newly recognized extratumoral features of colorectal cancer challenge the tumor-node-metastasis staging system. Ann Gastroenterol. 2018;31:525-534
24. Cohen R, Shi Q, Meyers J, Jin Z, Svrcek M, Fuchs C. et al. Combining tumor deposits with the number of lymph node metastases to improve the prognostic accuracy in stage III colon cancer: a post hoc analysis of the CALGB/SWOG 80702 phase III study (Alliance). Ann Oncol. 2021;32:1267-75
25. Delattre JF, Cohen R, Henriques J, Falcoz A, Emile JF, Fratte S. et al. Prognostic value of tumor deposits for disease-free survival in patients with stage III colon cancer: a post hoc analysis of the IDEA France phase III trial (PRODIGE-GERCOR). J Clin Oncol. 2020;38:1702-10
26. Pyo DH, Kim SH, Ha SY, Yun SH, Cho YB, Hub JW. et al. Revised nodal staging integrating tumor deposit counts with positive lymph nodes in patients with stage III colon cancer. Ann Surg. 2023;277:e825-e831
27. Basnet S, Lou QF, Liu N, Rana R, Shah A, Khadka M. et al. Tumor deposit is an independent prognostic indicator in patients who underwent radical resection for colorectal cancer. J Cancer. 2018;9:3979-3985
Author contact
![]() Corresponding author: miguel.angel.ortega92com.
Corresponding author: miguel.angel.ortega92com.