Impact Factor ISSN: 1837-9664

 Global reach, higher impact
J Cancer 2024; 15(15):5101-5117. doi:10.7150/jca.96886 This issue Cite
Research Paper
ELF4 was a prognostic biomarker and related to immune infiltrates in glioma
Zhongwei Zhuang1#, Chunyu Zhang2#, Yinqiu Tan3#, Jing Zhang2,4* ![]() , Chunlong Zhong1,2*
, Chunlong Zhong1,2* ![]()
1. Department of Neurosurgery, Shanghai East Hospital, Nanjing Medical University, Nanjing, China.
2. Department of Neurosurgery, Shanghai East Hospital, School of Medicine, Tongji University, Shanghai, China.
3. Department of Neurosurgery, Union Hospital, Tongji Medical College, Huazhong University of Science and Technology, Wuhan, China
4. Institute for Advanced Study, Tongji University, Shanghai, China.
# These authors contributed equally.
* These authors contributed equally.
Received 2024-4-2; Accepted 2024-7-18; Published 2024-8-6
Abstract

ELF4 (E74-like factor 4) is a transcription factor, dysregulation of which has been associated with carcinogenesis and cancer development. Nevertheless, the precise role of ELF4 in glioma pathology and its impact on clinical outcomes remains to be investigated. In the present research, comprehensive analyses demonstrated that elevated expression of ELF4 in glioma tissues correlates with malignant phenotypes and adverse clinical outcomes. Multivariate Cox regression analysis determined that ELF4 expression could serve as a reliable predictor of glioma outcomes. (CGGA, hazard ratio [HR]: 1.21, 95% confidence interval [CI]: 1.09-1.34, p<0.001; TCGA, HR: 1.19, 95%CI: 1.01-1.41, p=0.043; and Gravendeel, HR: 1.44, 95%CI: 1.15-1.80, p=0.002). Knockdown of ELF4 reduced the cell viability and migration capacity of glioma cells in vitro. In addition to the tumor invasive role, enrichment analysis revealed the overexpressed ELF4 was involved in the immune regulation, characterized by the elevated activity of Il6/Jak/Stat3 signaling, interferon alpha (IFN-α) response, and IL2/Stat5 signaling. Single-cell RNA sequencing (scRNA)-seq and spatial transcriptome (ST)-seq analyses revealed that ELF4 could induce reprogramming of tumor-associated monocytes/macrophages (TAMMs). Molecular docking analysis revealed ELF4 might be targeted by drugs/compounds, including Veliparib (ABT-888), Motesanib (AMG 706), and EHT 1864. Genomic analysis revealed that, in LGG, in the low ELF4 expression subgroup, IDH1 demonstrated a higher mutation rate, and TP53 and ATRX Chromatin Remodeler (ATRX) displayed the lower mutation rates, than the high ELF4 expression group.
Conclusion: Our research suggests that ELF4 may contribute to the prognostic assessment of glioma and personalized medicine.
Keywords: glioma, prognosis, immune, GlioVis, scRNA-seq
Introduction
Glioma is highly aggressive and could cause significant nerve damage[1]. Despite the utilization of therapeutic modalities like surgical resection, and chemo-radiotherapy, the prognosis for glioma patients remains unsatisfactory, particularly for those with glioblastoma (GBM) [2]. Therefore, this study seeks to investigate novel and efficient targets for personalized treatment approaches and the management of glioma.
The ETS family encompasses a vast array of transcriptional factors that possess a shared DNA-binding domain known as the ETS domain[3], regulating tumor and non-tumor disease progression[3, 4]. A pan-cancer bioinformatic analysis demonstrated overexpressed ELF4 could result in an aggressive cancer phenotype and sensitivity to anti-cancer drugs, such as Dasatinib, WH-4-023, and Ponatinib[5]. In addition, ELF4 could be targeted by miR-124 to promote neuroblastoma cell proliferation and differentiation[6]. There is evidence that ELF4 plays an important role in pathological processes, such as the regulation of cell differentiation and cell cycle in cancers. Research has indicated that ELF4 is involved in the process of cellular differentiation for specific cell types, including neural progenitor cells[7]. Recent research reveals the potential of ELF4 as a promising biomarker for cancers. In one study, researchers investigated the role of ELF4 and found that it is upregulated in breast cancer cells and leads to tumor growth and metastasis[8]. ELF4 is also found to be involved in encouraging the invasion of pancreatic cancer cells[9]. ELF4 has been implicated in immune-related functions according to certain research studies. One example is its role in controlling the expression of immune response-related cytokines like interleukin-2 (IL-2)[10]. Moreover, ELF4 has been identified as having a function in the development of CD8+ T cells, which are crucial in detecting and eliminating cancerous cells[11]. These findings imply that ELF4 might participate in both the progression of cancer and the modulation of the immune system. In glioma, recent research demonstrates that the long non-coding RNA PVT1 oncogene enhances stemness and resistance to temozolomide (TMZ) in glioma through the miR-365/ELF4/SRY-Box Transcription Factor 2 (SOX2) pathway[12]. In addition, the study highlights the critical role of ELF4 in maintaining the identity of GBM cells by regulating genes involved in two interdependent pathways: receptor tyrosine kinases (RTK) signaling and lipid metabolism[13]. Nonetheless, more investigation is needed to ascertain the exact ways in which ELF4 influences the development and prognosis of glioma.
The key objective of the present research was to comprehensively analyze the prognostic value of ELF4 in glioma. We assessed the expression of ELF4 mRNA in both glioma and non-tumor tissues and explored its correlation with glioma patient prognosis and clinical characteristics. Enrichment analysis was conducted to identify ELF4-associated biological pathways and the relationship of ELF4 with immune infiltration was examined. Our findings indicated that ELF4 was a promising biomarker to predict the clinical outcomes of glioma.
Materials and methods
Data preparation
The data for this research was obtained from the GlioVis data platform, which consisted of three cohorts: TCGA, CGGA, and Gravendeel[14]. The detailed criteria for patient selection were displayed as follows: (a) samples were diagnosed as glioma; (b) samples had overall survival (OS) > 1 month and an age≥18; (c) samples had no other comorbidities. We retrieved the RNA-seq and clinical data of 942 glioma samples from the CGGA set, 249 samples from the Gravendeel cohort, as well as 554 samples from the TCGA set (Table S1).
Variations in copy number, genome, and methylation
DNA methylation and genomic alterations significantly contribute to the deregulation of cancer-associated genes, leading to the disruption of cellular functions such as proliferation, adhesion, and metastasis[15, 16]. These mechanisms are crucial in developing and progressing cancer, making it crucial to understand them for developing effective prevention and treatment measures[17]. The copy number variations (CNVs) of ELF4 were analyzed by the cBioPortal database. The online tool CAMOIP offers several functions for the analysis of cancer data, including mutational landscape analysis[18]. The MEXPRESS database was introduced to illustrate the association between ELF4 expression and its DNA methylation sites[19]. The SNV neoantigens, number of segments, fraction altered, aneuploidy score silent mutation rate, non-silent mutation rate, and fraction altered were obtained from the previous research[20].
Calculation of prognostic value of ELF4 expression in glioma
Using the median expression value of ELF4 in each set, an optimal cutoff value was selected to divide the subjects into two distinct subgroups. By generating Kaplan-Meier curves and calculating p-values via the log-rank test, ELF4 expression was evaluated for prognostic potential. Furthermore, receiver operating characteristic (ROC) curve analysis was conducted to assess the ability of ELF4 to accurately predict glioma prognosis. Furthermore, the independent significance of ELF4 expression was also evaluated through multivariate Cox regression analysis. The TCGA, Gravendeel, and CGGA databases offered an opportunity to explore the possible links between ELF4 expression and clinical and pathological characteristics of glioma. To comprehensively examine the correlation between ELF4 expression and clinicopathological characteristics, including diagnostic age, gender, IDH mutational status, and chromosome 1p/19q deletion/codeletion status.
Construction of protein-protein interaction networks
Two online databases, GeneMANIA and STRING were employed to predict protein associations to explore the ELF4-related protein network[21, 22]. Additionally, the co-expression analysis between ELF4 and co-interacting genes was carried out using the GEPIA database, providing further insight into potential functions of ELF4.
Correlation analysis of the ELF4 with immune infiltrates
To understand the association of ELF4 and tumor immunity, the Sangerbox was introduced to analyze the correlation of ELF4 and immune infiltrates from the ESTIMATE method. The online tool, TIMER, was used to calculate the correlation of ELF4 expression with the six types of TME components and immune checkpoints[23]. The Cancer-Immunity Cycle (CIC) is a sequential process that enables the initiation, progression, and amplification of the immune response to effectively eliminate cancer cells[24]. For each step in CIC, ssGSEA was applied to exhibit differences among distinct groups. The xCell approach was utilized to compute the proportions of 64 distinct immune cell types as well as the scores of immunological, stromal, and tumor microenvironment (TME) components[20]. Aneuploidy score, silent mutation rate, non-silent mutation rate, fraction altered, number of segments, and SNV neoantigens were obtained from the previous research in the TCGA cohort[25].
Single-cell RNA-seq (scRNA-seq) and spatial transcriptome (ST)-seq analyses
The Tumor Immune Single Cell Center (TISCH) database allows the exploration of TME for glioma on a scRNA-seq level. The ST-seq sample was downloaded from the STOmicsDB online database (sample ID: STDS0000040)[26]. The scRNA-seq and ST-seq glioma data were processed based on the Seurat package. The CellMarker database was used to annotate cell clusters on the GSE89567 set[27]. The R package CellChat was applied to illustrate intercellular communications in the scRNA-eq level[28].
Drug prediction
Data from GDSC, a pharmacogenomic database, is used as a way to predict the sensitivity of clinical samples to drugs/compounds. R package pRRophetic was applied for predicting drug response[29]. A ridge regression model was used to estimate the drug response of clinical samples[30]. For each ELF4 subgroup, a drug was considered specific for this subtype if its IC50 value for a particular drug was significantly lower (FDR < 0.05) than that of the other subtypes.
Molecular docking
The protein structure of ELF4 was downloaded from the protein data bank (PDB) database (http://www.rcsb.org). The Chem3D software (version 15.1) was used to demonstrate the structure of drug-receptor interactions. AutoDock software (Version 4.1) molecularly docks ELF4 with small molecule drugs/compounds, including Motesanib (AMG 706), EHT 1864, Veliparib (ABT-888), CCT007093 after water molecule removal and hydrogen addition. PyMol (v2.5) and MOE2015 were used to visualize the docking findings.
Cell culture
Glioma cell lines U251 and U87MG were acquired from the Cell Bank of the Chinese Academy of Sciences (Shanghai, China). U87MG and U251 cells were cultured in Dulbecco's modified Eagle's medium (DMEM, Servicebio, China), supplemented with 10% fetal bovine serum (FBS, Servicebio, China), at 37 °C with a humidity of 90-95 and 5% CO2.
Small interfering RNA (siRNA) transfection
After propagation, cells were transfected with 100 nM Lipofectamine 2000 reagent (Invitrogen, Carlsbad, CA, USA). ELF4-specific small interfering RNA (si-RNA) was purchased from GenePharma (Shanghai, China). The siRNA sequences of ELF4 and normal control were displayed in Figure S1. Quantitative reverse transcription PCR (RT-qPCR) was applied to verify the effectiveness of ELF4 siRNA transfection.
Transwell and cell viability assays
The lower chamber was filled with 600 μl of DMEM containing 30% FBS when the transwell assay was performed. In an incubator with a CO2 concentration of 5% and a temperature of 37°C, the transwell chambers were subsequently incubated for 24 hours. Following this incubation period, the cells present in the upper chamber were fixed using 4% paraformaldehyde for 30 minutes. Subsequently, they were stained with 0.1% crystal violet for another 30 minutes. Finally, the cells were counted under an inverted microscope (Olympus CKX53, Japan). To perform the CCK8 assay, glioma cells were suspended in 100 μl of DMEM supplemented with 10% FBS, and subsequently placed into individual wells of a 96-well plate. The cell proliferation analysis was conducted using the CCK8 assay kit (APExBIO, USA), following the guidelines provided by the manufacturer.
RT-qPCR assay
Total RNA was isolated from the U87MG and U251 glioma cells using TRIzol (Invitrogen, USA) in line with the provided protocol from the manufacturer and transcribed into cDNA. RT‑qPCR was carried out by SYBR Premix Ex Taq (Takara Bio Inc, Japan). The following primer sets were used for RT-qPCR: ELF4-F 5'-CCTGATCTTTGAGTTCGCAAGC-3'; ELF4-R 3'-AGTCCCGAGTACAGATGCAGT-5'; GADPH-F 5'-ACAACTTTGGTATCGTGGAAGG-3'; GADPH-R 3'-GCCATCACGCCACAGTTTC-5'. GADPH was used for normalization.
Human samples
Human samples were acquired from the Department of Neurosurgery in Dongfang Hospital of Tongji University from July 2022 to July 2023. Three non-tumor brain tissues and six glioma samples, all paraffin-embedded, were chosen for immunohistochemical (IHC) staining. The follow-up information of the included samples was provided in Table S2. The patients included in the study underwent a biopsy without receiving any prior treatment. Before participating in the study, each subject provided written informed consent. Institutional Review Board (IRB) approval was obtained from Dongfang Hospital of Tongji University. The present research received approval from the Institutional Ethical Boards of Dongfang Hospital of Tongji University (Number: 2018013).
Immunohistochemistry (IHC) staining
The involved sample tissues were fixed by 4 % paraformaldehyde and then embedded in paraffin. The sections underwent deparaffinization and hydration, and were then subjected to antigen retrieval using 10 mM sodium citrate (PH 6.0). The endogenous peroxidase activity was blocked by treating with 3% H2O2 for a duration of 30 minutes. The sections were blocked using 10% normal goat serum and then incubated overnight with primary antibodies. Following this, they were incubated with a secondary antibody. The antibody information was displayed in Table S3. The signals were assessed through DAB staining (Servicebio, China) and nuclei were stained by hematoxylin. IHC images were captured by the Olympus BX51 microscope (Olympus). The distribution and intensity of ELF4 staining were characterized using a semiquantitative scoring system. (0 = background staining, 1 = faint staining, 2 = moderate staining, 3 = strong staining, 4 = very strong staining).
Statistical analysis
The R project (v4.0.2) was applied to process and analyze data. To examine the statistical significance between the two subgroups, the Wilcoxon test was employed. To quantify the degree of association between ELF4 expression and tumor immunity, immune checkpoints, and markers of immune cells, Spearman correlation analysis was employed. P<0.05 was regarded significant.
Results
Expression patterns of ELF4 in glioma
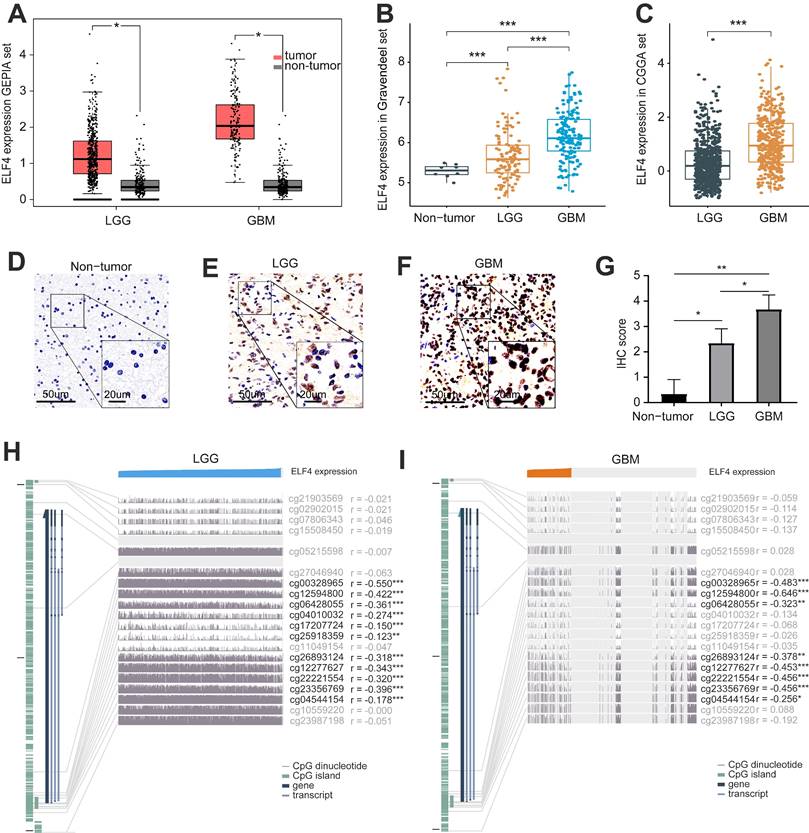
Using data from the GEPIA database, we identified that ELF4 was elevated in glioma, in comparison with ELF4 mRNA expression in the non-tumor brain tissues (Fig. 1A) and validated the finding in Gravendeel set (p<0.001, Fig. 1B). Using CGGA set, ELF4 expression level was increased with glioma grade (p<0.001, Fig. 1C). The representative IHC images demonstrated the ELF4 were upregulated in glioma samples (Fig. 1D-G and S1A), which was validated by the IHC images in HPA database (Fig. S1B-C). At the genomic level, we found 1% changes occurred in ELF4, which demonstrated little influence on ELF4 expression (Fig. S1D-E). According to the online MEXPRESS database, we identified a negative correlation between ELF4 expression with ELF4 methylation in LGG and GBM. In detail, ELF4 expression was significantly correlated with cg00328965 (cor=-0.550, p<0.001), cg12594800 (cor=-0.422, p<0.001), cg06428055 (cor=-0.361, p<0.001), cg26893124 (cor=-0.318, p<0.001), cg12277627 (cor=-0.343, p<0.001), cg22221554 (cor=-0.320, p<0.001), and cg23356769 (cor=-0.396, p<0.001) in LGG samples (Fig. 2D). In addition, ELF4 expression was negatively related to cg00328965 (cor=-0.483, p<0.001), cg12594800 (cor=-0.646, p<0.001), cg06428055 (cor=-0.323, p=0.009), cg12277627 (cor=-0.453, p<0.001), cg22221554 (cor=-0.456, p<0.001), cg26893124 (cor=-0.378, p=0.002) and cg23356769 (cor=-0.456, p<0.001) in GBM samples (Fig. 1H and 1I).
Changes in expression and methylation of ELF4 in glioma. (A-C) ELF4 is upregulated in glioma explored based on public data. (D-F) Representative images of ELF4 expression in non-tumor samples and glioma samples. (G-H) Correlation analysis of ELF4 expression with methylation of CpG islands in LGG and GBM using the MEXPRESS database. (*p < 0.05; **p < 0.01; ***p < 0.001).
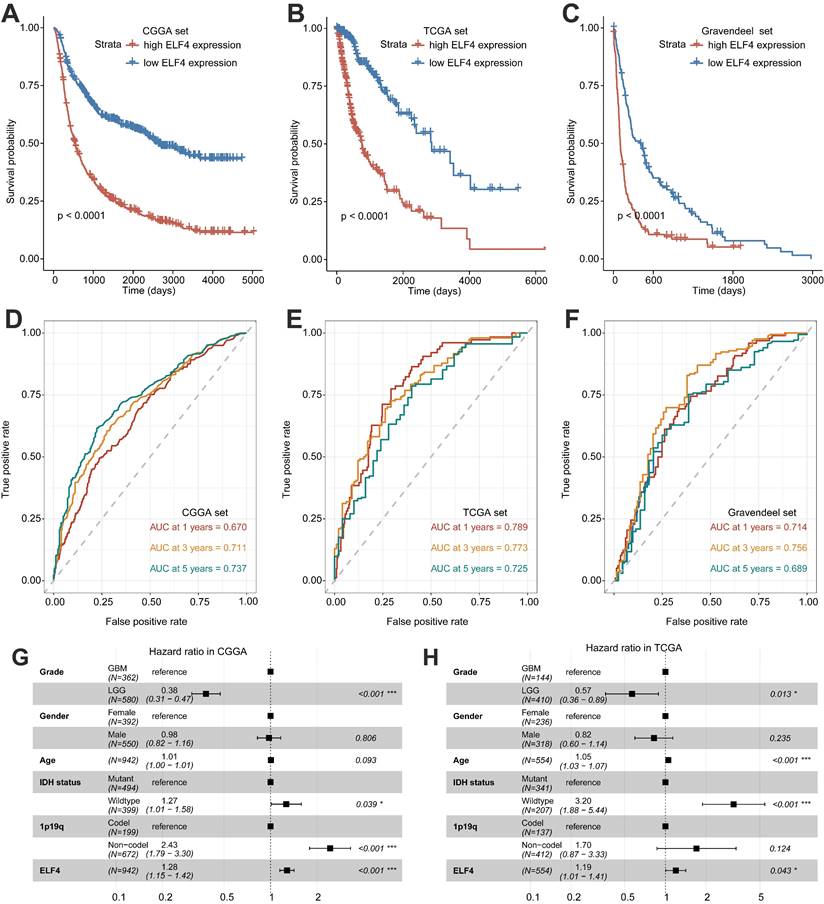
Survival analysis of ELF4 expression and prediction accuracy assessment. (A-C) Kaplan-Meier curves of survival differences between ELF4 subgroups in the CGGA set, TCGA set, and Gravendeel set. (D-F) ROC curves calculating the predictive accuracy of ELF4 in the CGGA set, TCGA set, and Gravendeel set for OS at 1, 3, and 5 years. (G-H) Multivariate Cox analysis of ELF4 expression and clinicopathological features of glioma. The forest plots demonstrated ELF4 was an independent prognostic biomarker for glioma in CGGA and TCGA cohorts.
ELF4 might be a prognostic biomarker for glioma
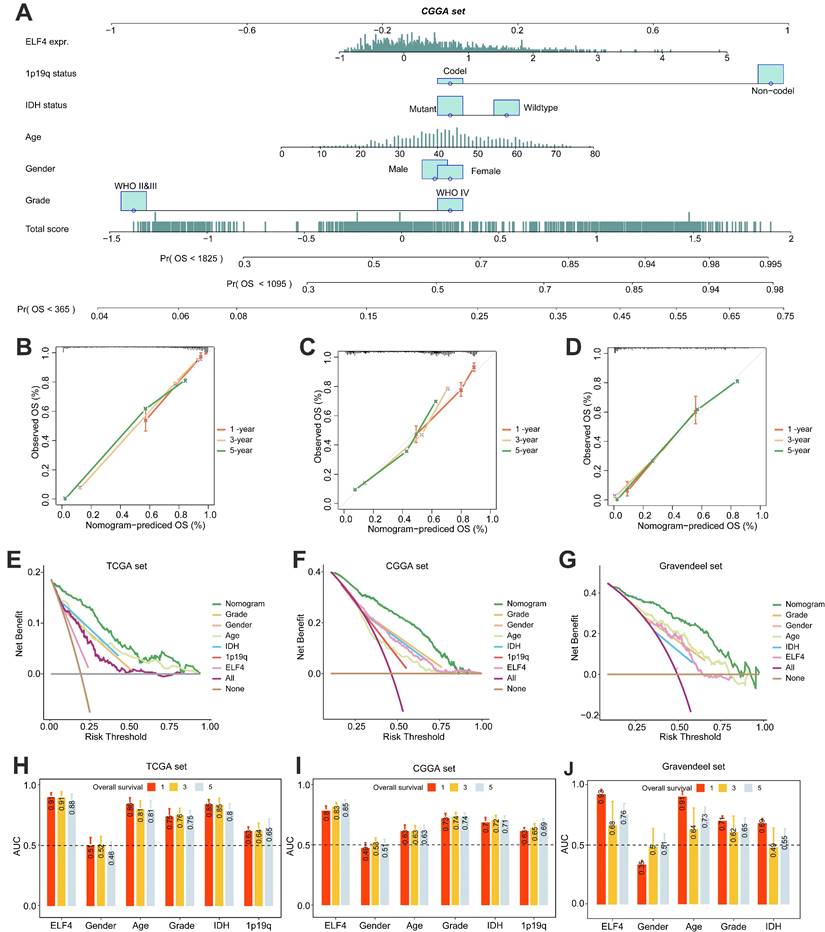
Significant differences in survival between ELF4 subgroups were displayed by K-M plots. As demonstrated in Figures 2A-C, patients in the high ELF4 subgroup displayed disadvantageous outcomes, in comparison with those in the low ELF4 expression group in CGGA (p<0.001), TCGA (p<0.001), and Gravendeel (p<0.001). As indicated by AUC values, ELF4 expression demonstrated a strong and accurate ability to predict glioma OS at 1 year (CGGA: 0.670; TCGA: 0.789; Gravendeel: 0.714), at 3 years (CGGA: 0.711; TCGA: 0.773; Gravendeel: 0.756), and at 5 years (CGGA: 0.737; TCGA: 0.725; Gravendeel: 0.689) (Fig. 2D-F). The independent capacity of ELF4 to evaluate glioma outcomes was assessed through multivariate Cox regression analysis in CGGA (HR: 1.21, 95%CI: 1.09-1.34, p<0.001), TCGA (HR: 1.19, 95%CI: 1.01-1.41, p=0.043), and Gravendeel (HR: 1.44, 95%CI: 1.15-1.80, p=0.002) datasets, as presented in Fig. 2G-H and Fig. S2. Then, we constructed the nomogram to present an analysis of multivariate Cox regression to score each level of value for each indicator. Finally, nomograms were constructed to predict the probability of clinical survival (Fig. 3A and S3A-B). Calibration curves were applied to compute the strength of a nomogram in predicting the probability of individual clinical outcomes. In the three sets, the low deviations were displayed between the predicted results of the model and the actual results (Fig. 3B-D). DCA curves demonstrated that the nomogram constructed for gliomas could provide evidence to recognize high-risk patients for clinical intervention (Fig. 3E-G). Finally, we calculated the AUC values of the factors included in the nomogram to compare the predicting accuracy. As displayed in Fig. 3H-J, the nomogram had the maximum values of AUC in predicting 1, 3, 5-year OS of glioma. To sum up, these findings exhibited the nomogram offered a highest capacity of clinical application for glioma than the individual clinical and pathological features.
Nomogram construction and evaluation. (A) The established nomogram for glioma based on CGGA set. (B-D) Calibration curves demonstrated the nomogram could accurately reflect the degree of consistency between the predicted risk and the actual risk that occurred. (E-G) DCA curves displayed the gliomas could benefit more from the prognosis-predicting based on the nomogram. (H-J) AUC values of clinicopathological features and nomogram.
Association of ELF4 expression with clinical subgroup
Then, the correlation between ELF4 expression and clinical characteristics was detected using TCGA, Gravendeel, and CGGA datasets. In the CGGA set, The ELF4 expression was remarkably increased in IDH wildtype glioma samples, and 1p19q non-codeletion glioma samples (Fig. S4A). In the TCGA set, The ELF4 expression was remarkably elevated in IDH wildtype glioma samples, 1p19q non-codeletion glioma samples, and the aged glioma samples (age≥ 65 years) (Fig. S4B). In the Gravendeel set, ELF4 expression was increased in the aged glioma samples and IDH wildtype samples (Fig. S4C). In the three cohorts, the ELF4 demonstrated no significant changes between female and male patients.
Exploration of changed pathways and processes between ELF4 subgroups
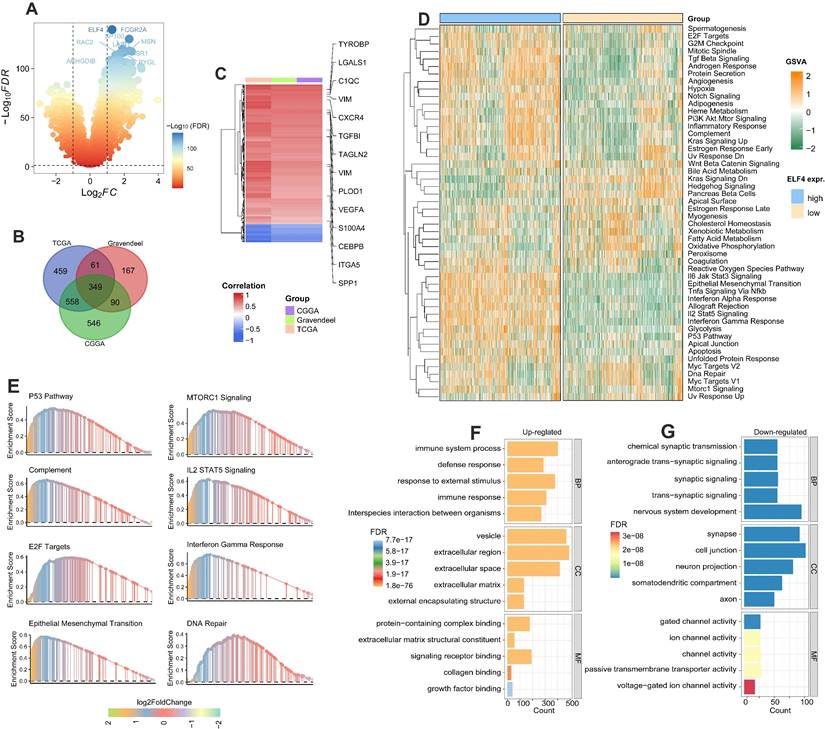
Firstly, the DEGs associated with ELF4 subgroups were detected by R package Limma in TCGA, CGGA, and Gravendeel glioma sets (Fig. 4A and S5A-B). By intersecting the DEGs, we found there were 349 DEGs shared among the three sets (Fig. 4B). In addition, the heatmap demonstrated inflammatory and angiogenic markers were expression-upregulated in the high ELF4 expression subgroup, including the angiogenesis-related markers such as vascular endothelial growth factor A (VEGFA), tumor-associated monocytes/macrophages (TAMMs)-related signatures such as transforming growth factor beta-induced (TGFBI), complement c1q C chain (C1QC), secreted shosphoprotein 1 (SPP1) (Fig. 4C). To further detect the potential biological changes of ELF4 subgroups, functional enrichment analyses were carried out. Specifically, the high ELF4 expression subgroup was endowed with high immune activity and tumor invasiveness phenotype, characterized by the elevated activity of Il6 Jak Stat3 signaling, TNFA signaling Via NFκB, interferon alpha response, IL2/Stat5 signaling, Myc targets, epithelial-mesenchymal transition (EMT), angiogenesis, and DNA repair (Fig. 4D). Significant upregulation features of pathways were validated by GSEA such as EMT, E2F Targets, complement, IL2/STAT5 Signaling interferon-gamma response, MTORC1 signaling, and glycolysis (Fig. 4E). In addition, GO analysis revealed extracellular matrix remodeling processes including collagen binding, protein-containing complex binding, and extracellular matrix structural constituent and immune system process were upregulated in the high ELF4 expression subgroup (Fig. 4F). Processes including cell junction, voltage-gated ion channel activity were enriched in the low ELF4 subgroup (Fig. 4G). We further conducted the enrichment analysis of ELF4 based on the online tool LinkOmics. The GSEA analysis of ELF4 in LGG demonstrated that the candidate gene was significantly enriched in the NOD-like receptor signaling pathway, cytokine-cytokine receptor interaction, and Fc gamma R-mediated phagocytosis (Fig. S5C). In GBM, the GSEA analysis revealed that ELF4 was significantly enriched in Leukocyte trans-endothelial migration, ECM-receptor interaction, and TNF signaling pathway (Fig. S5D).
DEGs detection and functional annotation of ELF4. (A) ELF4-related DEGs exploration based on the CGGA set. (B) There were 349 DEGs shared in the three glioma sets. (C) Spearman correlation analysis on the expression of ELF4 and the DEGs. Color red represented positive correlation and color represented negative correlation. (D) GSVA on the hallmark pathways between the ELF4 expression subgroups. The enrichment level was represented by z-values. (E) GSEA was conducted to validated the GSVA results. (F-G) GO analysis on the upregulated and down regulated DEGs.
ELF4 was related to TME reprogramming in glioma
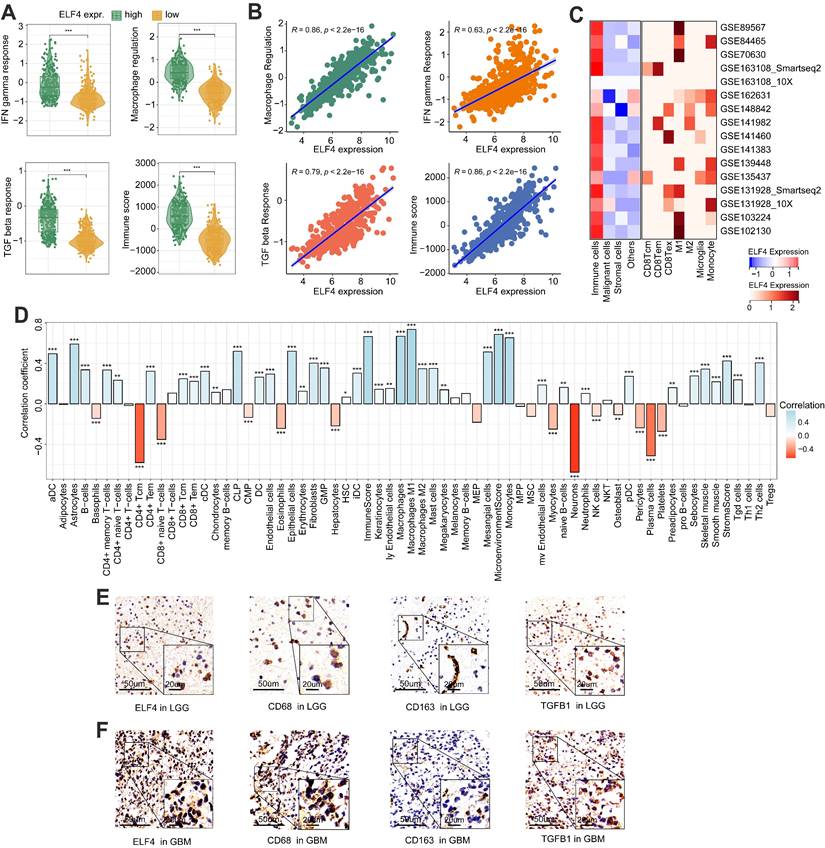
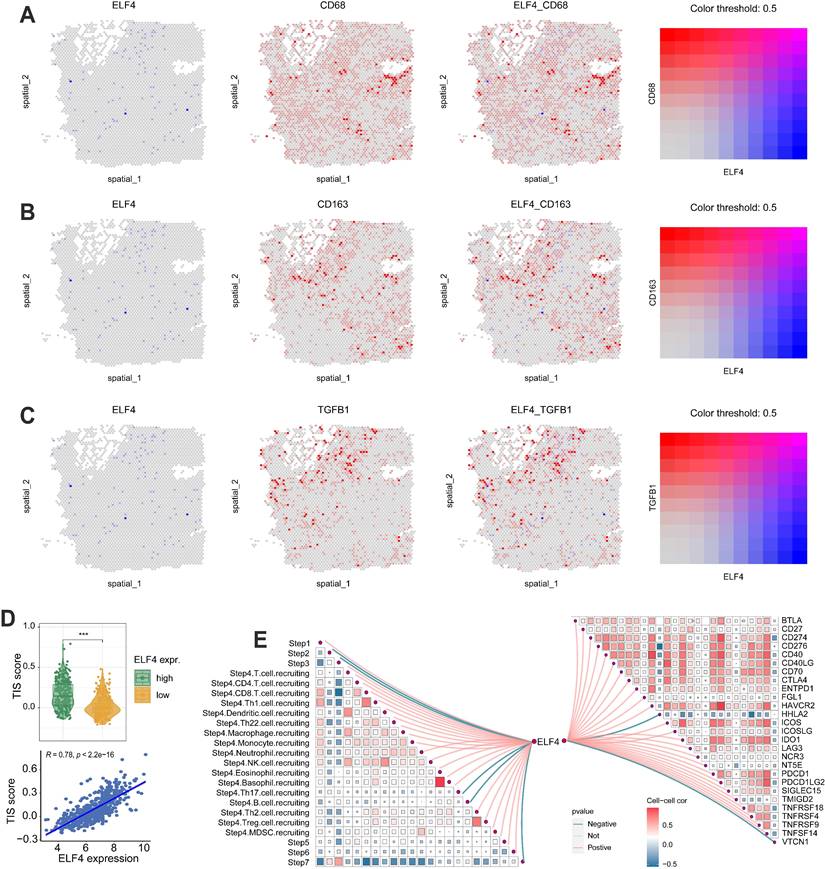
The levels of IFN gamma response, macrophage regulation, and TGF beta response were dramatically increased in high ELF4 expression, demonstrating the high level of immune activity (Fig. 5A-B). However, as suggested by Fig. S5E, the high ELF4 expression subgroup was endowed with high immune activity and low tumor purity. The scRNA-seq glioma sets demonstrated that ELF4 was involved in the infiltrates of immune cells and particularly highly expressed in TAMMs, including monocytes, macrophages, and microglia (Fig. 5C). Correlation analysis based on the xCell method revealed that ELF4 was strongly correlated with infiltrates of macrophages (cor = 0.669, p < 0.001), followed by monocytes (cor = 0.654, p < 0.001) and no significant association with CD8+ T cells, natural killer T (NKT) cells, and CD4+ T cells (Fig. 5D). Further analysis based on the TIMER database validated the association of ELF4 and TAMMs (Fig. S5F-G). Among the markers, TGFB1, CD68 and CD163 demonstrated constant great correlation with ELF4 both in LGG and in GBM (TGFB1, LGG: cor=0. 570, p<0.001, GBM: cor=0. 529, p<0.001; CD68, LGG: cor=0.774, p<0.001, GBM: 0.539, p<0.001; CD163, LGG: cor=0.579, p<0.001, GBM: 0.432, p <0.001) (Table S4). Then, representative IHC images demonstrated the ELF4 expression was correlated with the expression of macrophage-related markers such as CD68, CD163, and transforming growth factor beta 1 (TGFB1) (Fig. 5E-F). Such findings were validated by analyzing spatial location based on the ST-seq glioma samples (Fig. 6A-C). TAMMs reprogramming has been validated as a dismal factor for glioma prognosis and could decrease the sensitivity to immunotherapy, which might be responsible for the dismal outcomes of gliomas[31]. Here, the high ELF4 expression subgroup conveyed the higher TIS score, compared with the low ELF4 expression subgroup (Fig. 6D). The correlation analysis was performed between ELF4 expression and immune checkpoints as well as the cancer-immunity cycle. Clearly, high ELF4 expression was positively related to several immune checkpoints and negatively correlated with the majority of the cancer-immunity cycle (Fig. 6E).
Immune changes accompanied by the dysregulated ELF4 expression. (A-B) The associations of IFN gamma response, TGF beta response, Macrophage regulation, and Immune score with ELF4 expression in TCGA set. (C) Based on the TISCH database, ELF4 was found to be related to TAMMs reprogramming. (D) Correlation analysis of ELF4 expression with immune infiltrates estimated by xCell method. (E-F) Representative IHC images displayed expression features of ELF4 and classic markers for TAMMs. (*p < 0.05; **p < 0.01; ***p < 0.001)
Correlation analysis of ELF4 expression with antitumor immunity. (A-C) ST-seq glioma sample revealed the expression features of ELF4 with macrophage-related markers. (D) The association of tumor inflammation signature (TIS) score with ELF4 expression. (E) The correlation of ELF4 expression with the steps in cancer-immunity cycle and the expression of immune checkpoints. (***p < 0.001).
Analysis of cell-cell interactions
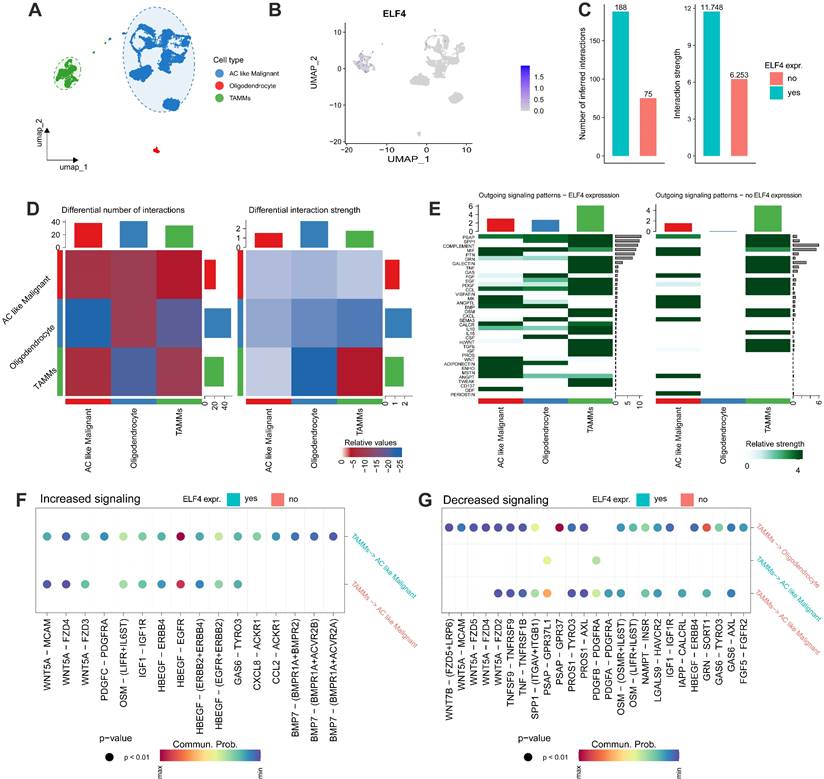
Firstly, the cell clusters were annotated into 3 cell subtypes (Fig. 7A) and ELF4 was expressed in the TAMMs and malignant cells (Fig. 7B). In the ELF4 expressed subgroup, there was a higher number of inferred interactions and higher weight values than the no ELF4 expression subgroup (Fig. 7C). As displayed in Fig. 7D, TAMMs played an important role in intercellular communication. Two ELF4 expression subgroups demonstrated outgoing signaling patterns. In the ELF4 expression subgroup, there were increased number and strength of the outgoing signaling patterns, compared with the no ELF4 expression subgroup (Fig. 7E). Analysis of dysregulated signaling ligand-receptor revealed c-x-c motif chemokine ligand 8(CXCL8)-atypical chemokine receptor 1 (Duffy blood group) (ACKR1), platelet-derived growth factor c (PDGFC)- platelet-derived growth factor receptor alpha (PDGFRA) and c-c motif chemokine ligand 2 (CCL2)-ACKR1 were significantly upregulated in the ELF4-expressed subgroup in the interactions of TAMMs with AC-like malignant (Fig. 7F). In the ELF4 no expression subgroup, interaction of prosaposin (PSAP) with G protein-coupled receptor 37 (GPR37) was significantly decreased (Fig. 7G).
Intercelluar communications between ELF4 subgroups. (A) Annotation of scRNA-seq glioma set into three cell categories. (B) ELF4 was mainly expressed in the annotated TAMMs cell clusters. (C) Comparing the total number and strength of interactions between ELF4 subgroups. (D) Heatmap demonstrated the changed number and strength of cell interactions. (E) Differences in the outgoing signaling patterns between ELF4 subgroups. (F-G) Exploration of upregulated and downregulated receptor-ligand pairs.
Genomic changes associated with ELF4 dysregulation
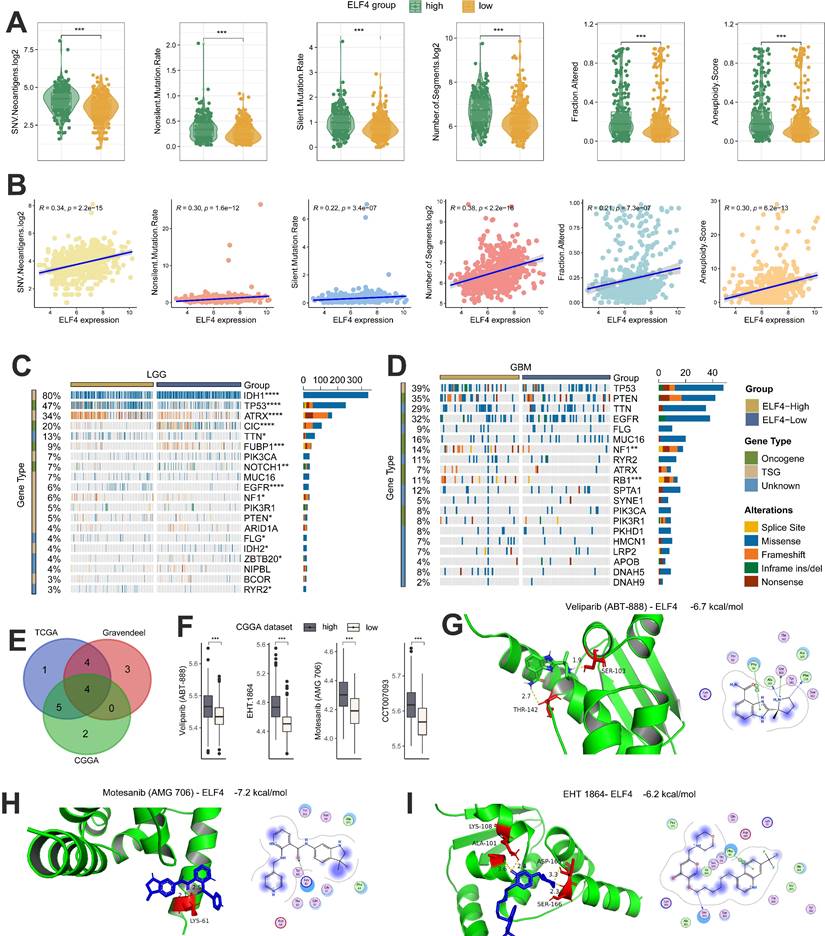
Several studies have demonstrated that tumors with a high level of tumor mutations may produce increased neoantigens, attracting tumor-infiltrating lymphocytes (TILs) into the TME. Based on TCGA data, we found that gliomas with high ELF4 expression displayed elevated levels of both silent and non-silent mutation rates, SNV neoantigens, number of segments, fraction altered as well as aneuploidy score (Fig. 8A). In addition, by the Spearman correlation analysis, the ELF4 expression demonstrated strong correlation with silent mutation rate (cor = 0.22, p = 3.4e-07), non-silent mutation rate (cor = 0.30, p = 1.6e-12), SNV neoantigens (cor = 0.34, p < 2.2e-15), number of segments (cor = 0.38, p < 2.2e-16), fraction altered (cor = 0.21, p < 7.3e-07) as well as aneuploidy score (cor = 0.30, p = 6.2e-13) (Fig. 8B). Then, we used the R package maftools to explore the detailed SNVs between the ELF4 expression groups. The top 20 genes with the highest variations were identified and shown in Figures 8A and B. In LGG samples, it was observed that mutation rates of RYR2, IDH2, FLG, PTEN, NF1, EGFR, NOTCH1, FUBP1, CIC, ATRX, TP53, and IDH1 significantly differed between high ELF4 expression group and the low ELF4 expression group (Fig. 8C). In GBM samples, it was observed that mutation rates of RB1 and NF1 were different between the two subgroups (Fig. 8D). In detail, RB1 and NF1 were highly mutated in the high ELF4 expression group.
Genomic changes and drug sensitivity of ELF4 in glioma. (A-B) Associations of the silent and non-silent mutation rates, SNV neoantigens, number of segments, fraction altered as well as aneuploidy score with ELF4 expression. (C-D) Genomic alterations between high and low ELF4 expression subgroups in LGG and GBM. (E)The drugs/compounds were filtered out which demonstrated strong correlation with ELF4 expression (F) Boxplots of the IC50 values between ELF4 expression subgroups. (G-I) Molecular docking analysis revealed ELF4 might interact with Veliparib (ABT-888), Motesanib (AMG 706) and EHT 1864. (*p < 0.05; **p < 0.01; ***p < 0.001)
ELF4 predicted the response to anti-tumor therapy
The correlation of IC50 values of the drugs/ compounds with ELF4 expression in the three glioma datasets were calculated and the Motesanib (AMG 706), EHT 1864, Veliparib (ABT-888), CCT007093 were filtered out based on the correlation analysis of compounds with ELF4 |cor|>0.30 and p<0.05 (Fig. 8E). In addition, the samples with low ELF4 expression demonstrated high sensitivity to the four compounds (Fig. 8F). By the molecular docking analysis, Motesanib (AMG 706), EHT 1864, Veliparib (ABT-888) might directly bind with ELF4, with binding energy<-5 kcal/mol (Fig. 8G-I).
PPI network analysis
The constructed PPI network using GeneMANIA tool demonstrated that ELF4 was related with VASP, CASP4, ARPC1B, PFN1, STK10, MICB, HDAC1, SPI1, METRNL, TRIM25, STK38, ELF2, RUNX1, PML, and PRF1 (Fig. S6A). And ELF4 interacted with IRF3, KLF2, PRR7, SELL, RUNX1, RLIM, MAVS based on STRING tool (Fig. S6B). In addition, PPI based on the STRING and GeneMANIA databases confirmed the interactions between ELF4 and MAVS, as well as RUNX1 (Fig. S6C). It was interesting to note that ELF4 and the two genes exhibited highly correlated interaction patterns, according to the PPI network. In detail, at the LGG level, ELF4 demonstrated a close correlation with RUNX1 (cor=0.57, p<0.001) and MAVS (cor=0.26, p<0.001) (Fig. S6D). In GBM samples, ELF4 demonstrated close correlations with RUNX1 (cor=0.61, p<0.001) and MAVS (cor=0.21, p=0.0075), based on data from the GEPIA database (Fig. S6E).
ELF4 knockdown reduced the growth of glioma cells
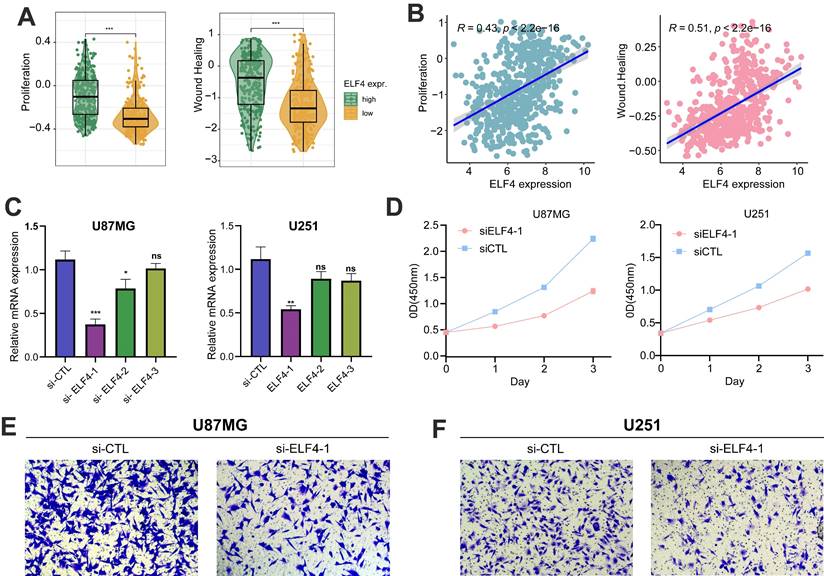
The samples with high ELF4 expression subgroup were characterized by tumor invasive and proliferative phenotypes (Fig. 9A-B). RT-qPCR demonstrated that ELF4 was effectively knockdown by si-ELF4-1 in U87MG and U251 glioma cells, compared with the mRNA expression level of ELF4 in the si-control (si-CTL) group (Fig. 9C). Then, the si-ELF4-1 was selected for the following analysis. To further evaluate the biological function of ELF4 in glioma cells, CCK-8, and transwell assays had been performed on glioma U87MG cells and U251 cells transfected with si-ELF4 or si-CTL. After the knockdown of ELF4 by siRNA, the cell viability of U87MG and U251 cells was significantly decreased when compared with the si-CTL group (Fig. 9C). In addition, si-ELF4 inhibited the migration of U87MG and U251 cells (Fig. 9E-F).
ELF4 knockdown decreased malignant progression of glioma cells. (A-B) ELF4 was related to glioma malignant behaviors. (C) RT-qPCR assay demonstrated the ELF4 was effectively knockdown by si-ELF4-1 in U87 and U251 glioma cells. (D) CCK8 assay displayed the ELF4 knockdown inhibited the cell viability of glioma cells. (E-F) Transwell assay displayed the ELF4 knockdown inhibited the migration capability of U87MG and U251 glioma cells.
Discussion
Advances in epigenomics have improved glioma classification and explored potential biomarkers. The present research comprehensively analyzed the association of ELF4 expression with epigenomics, clinical outcomes, tumor immunity, and sensitivity to anti-tumor drugs in glioma. In addition to the role of ELF4 in modulating RTK signaling and lipid dynamics, as well as glioma malignancy[12, 13, 32], the present research further provided insights into the epigenetic regulation of ELF4 and the influence of ELF4 on glioma outcomes, TAMMs infiltrate and sensitivity to veliparib, motesanib, and EHT 1864 in glioma samples.
Our research displayed that ELF4 was a reliable predictor of an unfavorable prognosis in glioma and correlated with clinicopathological characteristics such as IDH mutation status, 1p19q codeletion, and WHO grade, through a comprehensive analysis. Additionally, the functional analysis of ELF4 was systemically explored, and cancer-related and immune-associated processes and pathways were correlated to ELF4 expression. Finally, using xCell, TIMER and ESTIMATE methods, as well as TISCH database, ELF4 was confirmed to be related to the induction of TME reprogramming which might influence the sensitivity to immunotherapy.
Tumor cells exhibit a characteristic feature of increased mitotic recombination events caused by hypomethylation of repetitive, methylation-rich heterochromatin, resulting in genomic instability[33]. In our current study, we observed a significant correlation between elevated ELF4 expression and decreased methylation levels of ELF4, but not with single nucleotide variants (SNVs) and copy number variants (CNVs). In the early stage, cancer cells undergo de novo methylation of CpG islands, leading to the transcriptional suppression of genes that regulate growth[34]. ELF4 expression was significantly correlated with six CpG sites (cg00328965, cg06428055, cg26893124, cg22221554, and cg23356769) located in the DNA promoter regions of ELF4 (cor<-0.30, p<0.05, respectively). Additionally, it was found that methylation of the cg00328965, cg12594800, cg06428055, cg26893124, cg12277627, cg22221554, cg26893124, and cg23356769 sites in the promoter region negatively correlated with ELF4 expression in GBM tissues. Therefore, ELF4 hypomethylation might be the main factor to induce its dysregulated expression in gliomas.
Survival analysis revealed patients with elevated ELF4 expression levels had a higher likelihood of experiencing unfavorable outcomes which was confirmed in both TCGA and Gravendeel glioma cohorts. In addition, correlation analysis of the clinicopathological features with ELF4 expression revealed that ELF4 was significantly upregulated in patients with 1p/19q non-codeletion, IDH wildtype status, or glioblastoma tumors. Oligodendrogliomas are characterized by the presence of the 1p/19q codeletion which is linked to favorable treatment response and overall survival in affected patients[35]. Lower ELF4 expression in patients with 1p/19q codeletion may explain the favorable outcomes observed in our study. Our research discovered a higher frequency of IDH mutation in the low ELF4 expression subgroup in LGG samples, which might contribute to the advantageous outcomes of gliomas in the low ELF4 subgroup.
The STRING and GeneMANIA databases are powerful bioinformatics tools that predict protein-protein interactions and functional associations by integrating information from various sources, such as experimental data, computational predictions, and public databases. The databases generate a comprehensive network of protein interactions, making it a valuable resource to study protein functions and biological systems, and have been widely used in biomarker detection. In the present research, the two online databases were used to detect the proteins that interacted with ELF4, and we found that MAVS and RUNX1 were co-interacted with ELF4. In addition, the co-expression analysis performed based on the GEPIA database further validated such interactions. MAVS participates in the modulation of the immune response to viruses by activating antiviral genes[36], which is also associated with cancer immunity, since disruptions in this process can impede immune cells from detecting and eliminating cancer cells[37]. Furthermore, recent research suggests that modulating MAVS signaling could enhance anti-tumor immunity and improve the efficacy of cancer immunotherapy[38]. RUNX1 has a role in controlling the immune system, and any disruptions in its function may result in immunological malfunction and heightened vulnerability to cancer[39]. RUNX1 mutations are frequently observed in various immune disorders, such as primary immunodeficiencies and autoimmune diseases, underscoring the importance of RUNX1 in immune function[40]. Immunodeficiency syndromes such as SCID and CVID are linked to RUNX1 mutations[41]. Besides its role in leukemia, recent studies suggest that RUNX1 mutations are implicated in other immune cancers such as myeloma and lymphoma[42]. Furthermore, there is a connection between the loss of RUNX1 function and resistance to immunotherapy or immune evasion in solid tumors like lung cancer and melanoma[43, 44]. In light of interactions of ELF4 with MAVS and RUNX1 and the changed immune-associated pathways, the dysregulation of the antitumor immunity could be significantly influenced by ELF4.
The inflammatory and pro-angiogenic TME were created by tumor cells, to induce immune cells into TME and maintain a favorable TME for tumor growth and proliferation[45]. The correlation analysis of tumor immunity calculated by the ESTIMATE method with ELF4 expression demonstrated that ELF4 could influence TME reprogramming in glioma. Such findings were validated by the pathways from GSEA analysis, such as the NOD-like receptor signaling pathway, Fc gamma R-mediated phagocytosis, and NF-kappa B signaling pathway. Further analysis using the TISCH online tool confirmed the upregulated ELF4 could result in the TAMMs remodeling and induction of exhausted T cells (Tex), leading to immunosuppression. In glioma, TAMMs contribute to the growth and invasion of tumors by releasing a variety of chemokines and cytokines[46]. These molecules provide a favorable environment for the tumor to thrive and invade adjacent tissues, thereby enhancing the tumor's malignant potential[47]. TAMMs play a crucial role in regulating tumor progression and may represent a potential therapeutic target in cancer treatment. Exhausted T cells, also known as T cell exhaustion, are a subset of T cells that are unable to perform their normal functions due to prolonged antigen exposure or chronic infection[48]. Tex cells are characterized by the expression of a variety of inhibitory receptors, such as PDCD1, LAG3, and TIM-3, which decrease their ability to exert anti-tumor immunity[49, 50]. In the present research, ELF4 expression demonstrated a strong correlation with expression PD-1 and TIM-3 in glioma, which further illustrated that the overexpressed ELF4 could lead to the formation of the suppressive TME in glioma, and decreased anti-tumor immunity.
Previous findings demonstrate that ELF4 is implicated in the sensitivity to anti-cancer drugs/compounds at the pan-cancer level[5]. Our glioma-specific drug sensitivity analysis has been conducted further in this section and demonstrated that overexpressed ELF4 might elevate the response to veliparib, motesanib, and EHT 1864 in gliomas. The veliparib achieves therapeutic elimination of tumor cells by blocking the repair of tumor DNA damage through inhibition of PARP activity. In our research, we found ELF4 was related to increased activity of DNA damage repair, which might be responsible for the high sensitivity to veliparib. The motesanib could inhibit the transactivation of receptor tyrosine kinases (RTKs)[51], and the high ELF4 expression subgroup might provide guidance for glioma beneficiaries of motesanib. Recent research revealed that the compound EHT 1864 could decrease the capacity of glioma cell motion to inhibit disease progression. The detailed interactive mechanism of EHT 1864 with ELF4 needs further exploration.
Conclusion
In summary, our study performed a comprehensive examination of the possible mechanisms involved in ELF4 dysregulation in glioma and established its adverse effect on clinical outcomes. Furthermore, we demonstrated the differences in TME reprogramming associated with ELF4 expression in glioma. These findings have significant implications for the designation and implementation of clinical treatments investigating the therapeutic potential of ELF4 in glioma.
Supplementary Material
Supplementary figures and tables.
Acknowledgements
Funding
This research was supported by grants from the National Natural Science Foundation of China (82172820 and 81771332); the Fundamental Research for the Central University, the Natural Science Foundation of Shanghai (22ZR1466200 and 22ZR1451200; the Medical Discipline Construction Project of Pudong Health Committee of Shanghai (PWYgy 2021-07) and the Outstanding Leaders Training Program of Pudong Health Bureau of Shanghai (PWR12018-07).
Availability of data and materials
TCGA, CGGA, and Gravendeel datasets containing gene expression data were downloaded from the GlioVis database (http://gliovis.bioinfo.cnio.es/). The original contributions presented in the study are included in the article/Supplementary Material. Further inquiries could be obtained from the corresponding authors.
Author contributions
Performed the experiments and analyzed the data: ZCY, and TYQ; Designed the experiments and wrote the manuscript: ZCY and ZZW; Analyzed the data and provided critical technical and scientific discussion: ZJ, and ZCL. All authors read and approved the final manuscript.
Competing Interests
The authors have declared that no competing interest exists.
References
1. Reni M, Mazza E, Zanon S, Gatta G, Vecht CJ. Central nervous system gliomas. Critical reviews in oncology/hematology. 2017;113:213-234
2. Daniel AGS, Park KY, Roland JL, Dierker D, Gross J. et al. Functional connectivity within glioblastoma impacts overall survival. Neuro-oncology. 2021;23(3):412-421
3. Sharrocks AD. The ETS-domain transcription factor family. Nature Reviews Molecular Cell Biology. 2001;2(11):827-837
4. Tyler PM, Bucklin ML, Zhao M, Maher TJ, Rice AJ. et al. Human autoinflammatory disease reveals ELF4 as a transcriptional regulator of inflammation. Nature immunology. 2021;22(9):1118-1126
5. Kafita D, Daka V, Nkhoma P, Zulu M, Zulu E. et al. High ELF4 expression in human cancers is associated with worse disease outcomes and increased resistance to anticancer drugs. PloS one. 2021;16(4):e0248984
6. Kosti A, Du L, Shivram H, Qiao M, Burns S. et al. ELF4 Is a Target of miR-124 and Promotes Neuroblastoma Proliferation and Undifferentiated State. Molecular cancer research: MCR. 2020;18(1):68-78
7. Bazzoli E, Pulvirenti T, Oberstadt MC, Perna F, Wee B. et al. MEF promotes stemness in the pathogenesis of gliomas. Cell stem cell. 2012;11(6):836-844
8. Michaut M, Chin SF, Majewski I, Severson TM, Bismeijer T. et al. Integration of genomic, transcriptomic and proteomic data identifies two biologically distinct subtypes of invasive lobular breast cancer. Sci Rep. 2016;6:18517
9. Rovira-Rigau M, Raimondi G, Marín MÁ, Gironella M, Alemany R. et al. Bioselection Reveals miR-99b and miR-485 as Enhancers of Adenoviral On colysis in Pancreatic Cancer. Molecular therapy: the journal of the American Society of Gene Therap y. 2019;27(1):230-243
10. Lee PH, Puppi M, Schluns KS, Yu-Lee LY, Dong C. et al. The transcription factor E74-like factor 4 suppresses differentiation of proliferating CD4+ T cells to the Th17 lineage. Journal of immunology (Baltimore, Md: 1950). 2014;192(1):178-188
11. Yamada T, Park CS, Mamonkin M, Lacorazza HD. Transcription factor ELF4 controls the proliferation and homing of CD8 + T cells via the Krüppel-like factors KLF4 and KLF2. Nature immunology. 2009;10(6):618-626
12. Gong R, Li Z-Q, Fu K, Ma C, Wang W. et al. Long Noncoding RNA PVT1 Promotes Stemness and Temozolomide Resistance through miR-365/ELF4/SOX2 Axis in Glioma. Exp Neurobiol. 2021;30(3):244-255
13. Kosti A, Chiou J, Guardia GDA, Lei X, Balinda H. et al. ELF4 is a critical component of a miRNA-transcription factor network and is a bridge regulator of glioblastoma receptor signaling and lipid dynamics. Neuro-oncology. 2023;25(3):459-470
14. Bowman RL, Wang Q, Carro A, Verhaak RGW, Squatrito M. GlioVis data portal for visualization and analysis of brain tumor expression datasets. Neuro-oncology. 2016;19(1):139-141
15. Weisenberger DJ. Characterizing DNA methylation alterations from The Cancer Genome Atlas. The Journal of clinical investigation. 2014;124(1):17-23
16. Calabrese C, Davidson NR, Demircioğlu D, Fonseca NA, He Y. et al. Genomic basis for RNA alterations in cancer. Nature. 2020;578(7793):129-136
17. Pich O, Bailey C, Watkins TBK, Zaccaria S, Jamal-Hanjani M. et al. The translational challenges of precision oncology. Cancer Cell. 2022;40(5):458-478
18. Lin A, Qi C, Wei T, Li M, Cheng Q. et al. CAMOIP: a web server for comprehensive analysis on multi-omics of immunotherapy in pan-cancer. Briefings in Bioinformatics. 2022;23(3):bbac129
19. Koch A, De Meyer T, Jeschke J, Van Criekinge W. MEXPRESS: visualizing expression, DNA methylation and clinical TCGA data. BMC genomics. 2015;16(1):636
20. Oshi M, Patel A, Wu R, Le L, Tokumaru Y. et al. Enhanced immune response outperform aggressive cancer biology and is associated with better survival in triple-negative breast cancer. npj Breast Cancer. 2022;8(1):92
21. Warde-Farley D, Donaldson SL, Comes O, Zuberi K, Badrawi R. et al. The GeneMANIA prediction server: biological network integration for gene prioritization and predicting gene function. Nucleic acids research. 2010;38(Web Server issue):W214-220
22. Szklarczyk D, Gable AL, Nastou KC, Lyon D, Kirsch R. et al. The STRING database in 2021: customizable protein-protein networks, an d functional characterization of user-uploaded gene/measurement sets. Nucleic acids research. 2021;49(D1):D605-D612
23. Li T, Fan J, Wang B, Traugh N, Chen Q. et al. TIMER: A Web Server for Comprehensive Analysis of Tumor-Infiltrating Immune Cells. Cancer Res. 2017;77(21):e108-e110
24. Chen DS, Mellman I. Oncology meets immunology: the cancer-immunity cycle. Immunity. 2013;39(1):1-10
25. Thorsson V, Gibbs DL, Brown SD, Wolf D, Bortone DS. et al. The Immune Landscape of Cancer. Immunity. 2019;51(2):411-412
26. Xu Z, Wang W, Yang T, Li L, Ma X. et al. STOmicsDB: a comprehensive database for spatial transcriptomics data sharing, analysis and visualization. Nucleic Acids Res. 2024;52(D1):D1053-d1061
27. Hu C, Li T, Xu Y, Zhang X, Li F. et al. CellMarker 2.0: an updated database of manually curated cell markers in human/mouse and web tools based on scRNA-seq data. Nucleic Acids Res. 2023;51(D1):D870-d876
28. Jin S, Guerrero-Juarez CF, Zhang L, Chang I, Ramos R. et al. Inference and analysis of cell-cell communication using CellChat. Nature Communications. 2021;12(1):1088
29. Yang C, Chen J, Li Y, Huang X, Liu Z. et al. Exploring subclass-specific therapeutic agents for hepatocellular carcinoma by informatics-guided drug screen. Briefings in Bioinformatics. 2021;22(4):bbaa295
30. Geeleher P, Cox N, Huang RS. pRRophetic: an R package for prediction of clinical chemotherapeutic response from tumor gene expression levels. PloS one. 2014;9(9):e107468
31. Tang F, Wang Y, Zeng Y, Xiao A, Tong A. et al. Tumor-associated macrophage-related strategies for glioma immunotherapy. npj Precision Oncology. 2023;7(1):78
32. Gong R, Li ZQ, Fu K, Ma C, Wang W. et al. Long Noncoding RNA PVT1 Promotes Stemness and Temozolomide Resistance through miR-365/ELF4/SOX2 Axis in Glioma. Experimental neurobiology. 2021;30(3):244-255
33. Geistlinger L, da Silva VH, Cesar ASM, Tizioto PC, Waldron L. et al. Widespread modulation of gene expression by copy number variation in skeletal muscle. Scientific Reports. 2018;8(1):1399
34. Pan Y, Liu G, Zhou F, Su B, Li Y. DNA methylation profiles in cancer diagnosis and therapeutics. Clinical and experimental medicine. 2018;18(1):1-14
35. Suwala AK, Felix M, Friedel D, Stichel D, Schrimpf D. et al. Oligosarcomas, IDH-mutant are distinct and aggressive. Acta neuropathologica. 2022;143(2):263-281
36. Zhang W, Wang G, Xu ZG, Tu H, Hu F. et al. Lactate Is a Natural Suppressor of RLR Signaling by Targeting MAVS. Cell. 2019;178(1):176-189.e115
37. Liu S, Cai X, Wu J, Cong Q, Chen X. et al. Phosphorylation of innate immune adaptor proteins MAVS, STING, and TRIF induces IRF3 activation. Science (New York, NY). 2015;347(6227):aaa2630
38. Ran XB, Ding LW, Sun QY, Yang H, Said JW. et al. Targeting RNA Exonuclease XRN1 Potentiates Efficacy of Cancer Immunotherapy. Cancer Res. 2023;83(6):922-938
39. Bluteau D, Gilles L, Hilpert M, Antony-Debré I, James C. et al. Down-regulation of the RUNX1-target gene NR4A3 contributes to hematopoiesis deregulation in familial platelet disorder/acute myelogenous leukemia. Blood. 2011;118(24):6310-6320
40. Tejedor JR, Bueno C, Vinyoles M, Petazzi P, Agraz-Doblas A. et al. Integrative methylome-transcriptome analysis unravels cancer cell vulnerabilities in infant MLL-rearranged B cell acute lymphoblastic leukemia. J Clin Invest. 2021;131(13):e138833
41. Goyama S, Schibler J, Cunningham L, Zhang Y, Rao Y. et al. Transcription factor RUNX1 promotes survival of acute myeloid leukemia cells. The Journal of clinical investigation. 2013;123(9):3876-3888
42. Mill CP, Fiskus W, DiNardo CD, Birdwell C, Davis JA. et al. Effective therapy for AML with RUNX1 mutation by cotreatment with inhi bitors of protein translation and BCL2. Blood. 2022;139(6):907-921
43. Gao K, Zhou H, Zhang L, Lee JW, Zhou Q. et al. Systemic disease-induced salivary biomarker profiles in mouse models o f melanoma and non-small cell lung cancer. PLoS One. 2009;4(6):e5875
44. Pan S, Sun S, Liu B, Hou Y. Pan-cancer Landscape of the RUNX Protein Family Reveals their Potentia l as Carcinogenic Biomarkers and the Mechanisms Underlying their Action. J Transl Int Med. 2022;10(2):156-174
45. Fang J, Lu Y, Zheng J, Jiang X, Shen H. et al. Exploring the crosstalk between endothelial cells, immune cells, and immune checkpoints in the tumor microenvironment: new insights and therapeutic implications. Cell Death Dis. 2023;14(9):586
46. Zhu S, Yi M, Wu Y, Dong B, Wu K. Roles of tumor-associated macrophages in tumor progression: implications on therapeutic strategies. Experimental Hematology & Oncology. 2021;10(1):60
47. Bejarano L, Jordāo MJC, Joyce JA. Therapeutic Targeting of the Tumor Microenvironment. Cancer discovery. 2021;11(4):933-959
48. Wherry EJ. T cell exhaustion. Nature immunology. 2011;12(6):492-499
49. McLane LM, Abdel-Hakeem MS, Wherry EJ. CD8 T Cell Exhaustion During Chronic Viral Infection and Cancer. Annual review of immunology. 2019;37:457-495
50. Zhao L, Cheng S, Fan L, Zhang B, Xu S. TIM-3: An update on immunotherapy. International immunopharmacology. 2021;99:107933
51. Greenall SA, Donoghue JF, Van Sinderen M, Dubljevic V, Budiman S. et al. EGFRvIII-mediated transactivation of receptor tyrosine kinases in glioma: mechanism and therapeutic implications. Oncogene. 2015;34(41):5277-5287
Author contact
![]() Corresponding authors: Chunlong Zhong, drchunlongzhongedu.cn; Jing Zhang, zhangjingwtedu.cn.
Corresponding authors: Chunlong Zhong, drchunlongzhongedu.cn; Jing Zhang, zhangjingwtedu.cn.