Impact Factor ISSN: 1837-9664

 Global reach, higher impact
J Cancer 2024; 15(18):5942-5955. doi:10.7150/jca.100194 This issue Cite
Research Paper
Identification and Validation of a Prognostic Signature Based on Fibroblast Immune-related Genes to Predict the Prognosis and Therapeutic Response of renal clear cell carcinoma by Integrated Analysis of Single-Cell and Bulk RNA Sequencing Data
Shuwen Zhang1,2, Yuqian Yang2,3, Liyi Zhang2,3, Yijiang Liu3,4, Zihun Guo1, Jiajun Wu1, Weijun Zhou1, Zhengdong Hong3 ![]() , Wenxiong Zhang1
, Wenxiong Zhang1 ![]()
1. Department of Thoracic Surgery, The Second Affiliated Hospital, Jiangxi Medical College, Nanchang University, Nanchang, China, 330006.
2. Queen Mary School, Jiangxi medical college, Nanchang University, Nanchang, China, 330006.
3. Department of Urology Surgery, The Second Affiliated Hospital, Jiangxi Medical College, Nanchang University, Nanchang, China, 330006.
4. Jiangxi medical college, Nanchang University, Nanchang, China, 330006.
Received 2024-6-27; Accepted 2024-8-24; Published 2024-9-23
Abstract

Background: The importance of fibroblasts in cancer progression is becoming more acknowledged, particularly the significance of their immune-related genes. However, the precise roles these genes play in fibroblasts throughout tumor development remains unclear. Exploring how these genes function in advancing kidney renal clear cell carcinoma (KIRC) could provide answers to these uncertainties.
Material and method: The Cancer Genome Atlas (TCGA) database served as the source of data for KIRC patients. We distinguished fibroblast immune-related genes (FIGs), which are used to construct risk score. Further analysis conducted including enrichment analysis, assessment of tumor mutation burden (TMB), evaluation of tumor microenvironment (TME), analysis of immune cell infiltration, and drug sensitivity prediction.
Result: The risk score using 6 FIGs effectively predicts the outcomes for KIRC patients. Nomogram which is based on the risk score and clinical data, demonstrated superior predictive performance compared to the version without the risk score. Enrichment analysis identified that coagulation pathway predominates in high-risk group, the protein secretion pathway is prevalent in low-risk patients' cohort. The adverse prognosis in high-risk patient cohort could be linked to an elevated TMB. TME analysis showed that high-risk group's tumor tissues contain more immune and stromal cells. Furthermore, the amount of regulatory T cells increases with the risk score. Low-risk group response better to immunotherapy. Finally, RT-qPCR confirmed the differential expression of FIGs in KIRC patients.
Conclusion: This risk score and nomogram are valuable tools assessing KIRC patients' prognosis. Poorer prognosis in high-risk categories may have relationship with activation of coagulation pathway and a higher TMB.
Keywords: Fibroblast, Immune-related genes, Kidney renal clear cell carcinoma, Prognosis model, Single cell analysis.
Introduction
Renal cell cancer (RCC) is among the most prevalent genitourinary tract malignancies, exhibiting a mortality rate of 30% to 40% [1]. KIRC is its most common subtype, though its prognosis often proves challenging to determine [2]. While the American Joint Committee on Cancer put forward a tumor, node, metastasis (TNM) classification system for KIRC prognosis assessment, categorizing patients into stages I through IV [3]. Currently, prognostic markers for KIRC typically depend on imaging techniques, which lack high specificity [4]. This underscores the critical need for developing new, more effective prognostic models for patients with KIRC.
Fibroblasts, the predominant cells in connective tissue, are traditionally recognized for their significant contributions to wound healing and tissue repair [5]. However, nowadays' research has revealed that fibroblasts also play vital apart in the progression of several cancers, such as lung, breast, and kidney cancers [6-8]. Within TME, fibroblasts have been recognized to provoke tumor cell growth, proliferation, and metastasis [9]. Muhammad Khan et al. (2022) and Song-Chao Li et al. (2022) established distinct KIRC prognosis models employing pyroptosis relates genes and telomere-related genes respectively [10, 11]. Furthermore, Yixin Liu et al. (2023) created a model that uses cuproptosis-related genes to predict the prognosis for KIRC patients [12]. Single-cell analysis serves as a crucial tool for examining cellular heterogeneity within complex biological systems. This technique enables the identification of the full gene expression profile of individual cells, thereby aiding in the discovery of genes previously unidentifiable [13]. In recent studies, Jiayu Zhang et al. (2023) sought to propose a pan-cancer prognostic model by analyzing the single cell data of endothelial cells [14]. Similarly, Jing Zhang et al. (2023) explored the use of ferroptosis-associated genes for determining the prognosis of KIRC patients using single-cell data [15]. However, the prognostic significance of FIGs in KIRC still remains to be fully elucidated.
Consequently, we developed a risk score for KIRC centered on FIGs, designed to evaluate KIRC patients' prognosis. We further examined clinical applicability of this risk score by develop a nomogram. Through enrichment analysis, differential analysis of the TME, and TMB analysis, we want to find out the pathway involved. Drug sensitivity prediction can give clues for clinical personalized medicine.
Material and method
Data sources
We obtained transcriptome data from TCGA database (https://portal.gdc.cancer.gov/, as of January 25, 2024) for 614 samples, representing 533 KIRC patients, which included 533 tumor and 77 normal tissue samples. Additionally, we downloaded clinical pathologic data for 537 KIRC patients from the same database. We collected 2484 genes linked to immunity from the ImmPort online database (https://www.immport.org/, as of February 26, 2024) and 3714 genes which is related to immune response from the InnateDB website database (https://www.innatedb.ca/, as of February 26, 2024). After eliminating duplicates, we compiled 2533 unique immune related genes. Genomic mutation data for the tumor cells were also sourced from the TCGA. Furthermore, Tumor Immune Single-cell Hub 2 (TISCH2) database provided us with single cell data (http://tisch.comp-genomics.org/, as of February 26, 2024; sample ID: T010042; dataset name: KIRC-GSE111360).
Finding the genes that are differently expressed in fibroblasts
We acquired data of every single cell differentially expressed genes from the TISCH2 database. To isolate those genes which were significantly differentially expressed between other cell types and fibroblasts, we specifically analyzed the fibroblasts cell gene expression profile. Genes with a fold change more than 1.5 and an adjusted p-value less than 0.05 were our selections [14].
Construction of risk score
To pinpoint FIGs, we conducted an intersection analysis between known immune-related genes and the differentially expressed genes in fibroblasts, thereby identifying FIGs. We utilized the “VennDiagram” R package to graphically represent this intersection through a Venn diagram. Further, to explore the interactions among these identified genes, we uploaded the genes data set to STRING website database (https://cn.string-db.org/, as of February 26, 2024), where we set the minimum interaction score to 0.4. We were able to create a protein-protein interaction (PPI) network as a result. From this network relationship file downloaded from STRING, we identified genes that interact with more than 20 neighboring nodes, considering these as “most core” genes within the network. The gene with the highest number of adjacent interacting neighbors was designated as the core gene, potentially playing a momentous role in the contribution of fibroblasts for KIRC.
Initially, to create the risk score, every KIRC patient was divided into testing and training groups at random. We then operated univariate Cox regression analysis (p<0.05) by using the “survival” and “survminer” R packages to find genes linked to patient prognosis. Significant genes from this analysis were further refined through Least Absolute Shrinkage and Selection Operator (LASSO) regression by the usage of “glmnet” R package, aiming to eliminate the risk of overfitting. Finally, genes that were most closely associated with prognosis were selected via multivariate Cox regression for constructing risk score [12]. Risk score was established as follows: Risk score = ∑ (coefficient of gene n) × (expression of gene n). Based on the median of the risk score, patients, including those in the train and test group, were then separated into high-risk and low-risk categories.
Risk score accuracy validation
To validate the accuracy of our risk score, the “survival” and “survminer” R packages were utilized to perform Kaplan-Meier (K-M) survival analysis. This enabled the examination of differences in overall survival (OS) between different groups. Progression-free survival (PFS) curves were also generated. Furthermore, we made use of the R package “pheatmap” to create heatmaps of the risk scores for all patients, and those in the training and testing groups. These heatmaps made it easier to explore the connection between patient survival status and risk genes expression, enhancing our understanding of the model's construction principles. To delve deeper into the influence of specific genes on patient survival, we plotted survival curves for each gene and analyzed the association between these risk genes' expression and the risk scores.
Principal Component Analysis (PCA) was conducted using all FIGs and risk genes respectively to appraise the effectiveness of the grouping. Additionally, both multivariate and univariate Cox independent prognostic analysis help deciding the prognostic contribution of the risk score, with results presented in a forest plot. We also utilized the “timeROC” R package to draw 1, 3, and 5-year's Receiver Operating Characteristic (ROC) curves, calculating the area under the curve (AUC) to measure the predictive efficacy of risk score. Furthermore, validation of risk score within clinical subgroups, and clinical relevance analysis were carried out to deepen our understanding of the connection between risk score and various clinical phenotype.
Nomogram plotting to predict KIRC patients' prognosis
By using the “RMS” R package, we developed a nomogram that predict the 1, 3, and 5-year survival rates based on five key factors: gender, tumor grade, age, risk score, and tumor stage. This tool aims to provide precise predictions of patient outcomes. To assess the accuracy and utility of the nomogram, we generated calibration curves for the 1, 3, and 5-year. In addition, we employed the “ggDCA” package to produce decision curves, evaluating the clinical usefulness of the nomogram in making clinical decisions. The predictive accuracy of the nomogram was further analyzed by drawing ROC curves and calculating their AUC. To underscore the prediction efficacy of our nomogram has exceed traditional clinical data, we also plotted C-index curves.
Enrichment analysis to find relevant pathways
We acquired five representative gene sets which come from the Gene Set Enrichment Analysis (GSEA) database (https://www.gsea-msigdb.org/, as of February 26, 2024), and carried out enrichment analysis. To dig deeper into the biological pathways and functions related to the differentially expressed genes, we use the “ClusterProfiler” R package, and carried out enrichment analysis for Gene Ontology (GO) and the Kyoto Encyclopedia of Genes and Genomes (KEGG). The results of GO enrichment analysis were annotated utilizing Bioconductor annotation package “org.Hs.eg.db” [10].
Tumor microenvironment and immune-related analysis
We employed the “estimate” R package for analyzing the TME of samples from high-risk and low-risk groups, creating violin plots to compare the infiltration of non-tumor cells between these groups. For a more detailed examination of immune cell composition variations, we used the “CIBERSORT” R package to distinguish the variances in 22 immune cell lineages between 2 risk categories. To assist with immune phenotyping, we used the “RColorBrewer” R package. Additionally, single-sample gene set enrichment analysis (ssGSEA) was executed via “GSVA” R package. It was applied to evaluate variations in immune functions across the different risk groups. These analyses aim to highlight disparities in immune functionality between 2 risk categories, laying the groundwork for potential immunotherapy approaches. Lastly, we accessed the TIDE database website (http://tide.dfci.harvard.edu/, as of February 26, 2024) to retrieve TIDE score files, comparing these scores across different risk groups. This comparison aids in assessing the likely responsiveness of patients in different risk groups to immunotherapy.
Tumor mutation burden calculation
We processed tumor mutation data from TCGA database utilizing the “TCGAbiolinks” R package and used “maftools” R package for generating waterfall plots. These plots illustrate the variances in tumor mutation genes and their mutation rates between different risk groups. Additionally, we created violin plots to display the variations in TMB between 2 different risk groups. To further explore the impact of mutations on survival, we operated survival analysis for groups categorized by mutation level and risk.
Drug sensitivity prediction
We utilized the “parallel” and “oncoPredict” R packages to predict and analyze drug sensitivity in patients within the different risk groups. Utilizing the “ggplot2” R package, we then created comparative box plots to display the sensitivity of these two groups to 198 different drugs. This analysis helped us identify drugs which have significant variances in sensitivity between 2 different risk groups, using a relative stringent significance threshold (p-value < 0.001).
RT‒qPCR validation
The Typical Culture Preservation Commission Cell Bank of the Chinese Academy of Medical Sciences in Shanghai, China, provided the normal kidney epithelial cell lines (HK-2) and the KIRC cell lines (Caki-1 and Caki-2). HK-2 cells were cultured in Keratinocyte SFM (K-SFM) medium, whereas we grew Caki-1 and Caki-2 cells in a complete culture medium composed of 90% McCoy's 5a medium adding 10% fetal bovine serum. Trizol was employed to get total RNA extraction (Takara Bio, Inc., Otsu, Japan). Accurate Biology (Hunan, China) provided a reverse transcription kit for cDNA synthesis, which was followed by RT-qPCR using the SYBR Green premixed qPCR kit (Accurate Biology, Hunan, China) using a Roche LightCycler 480 II (Roche, Basel, China). We determined gene expression level through 2^-ΔΔCt method, we have shown the primer sequences in Table S1.
The Human Protein Atlas database (https://www.proteinatlas.org/) was utilized to assess the FIGs' expression at the protein level in both normal kidney tissues and KIRC tissues.
Statistical analysis for result data
Result analysis for statistics was undertook by R software (version 4.3.0), combining with Perl (Strawberry Perl 5.30.0.1). To compare variables across groups, we used the Wilcoxon t-test; statistically significant p-value was one that was less than 0.05.
Results
Single-cell data analysis identifies genes with differential expression in fibroblasts
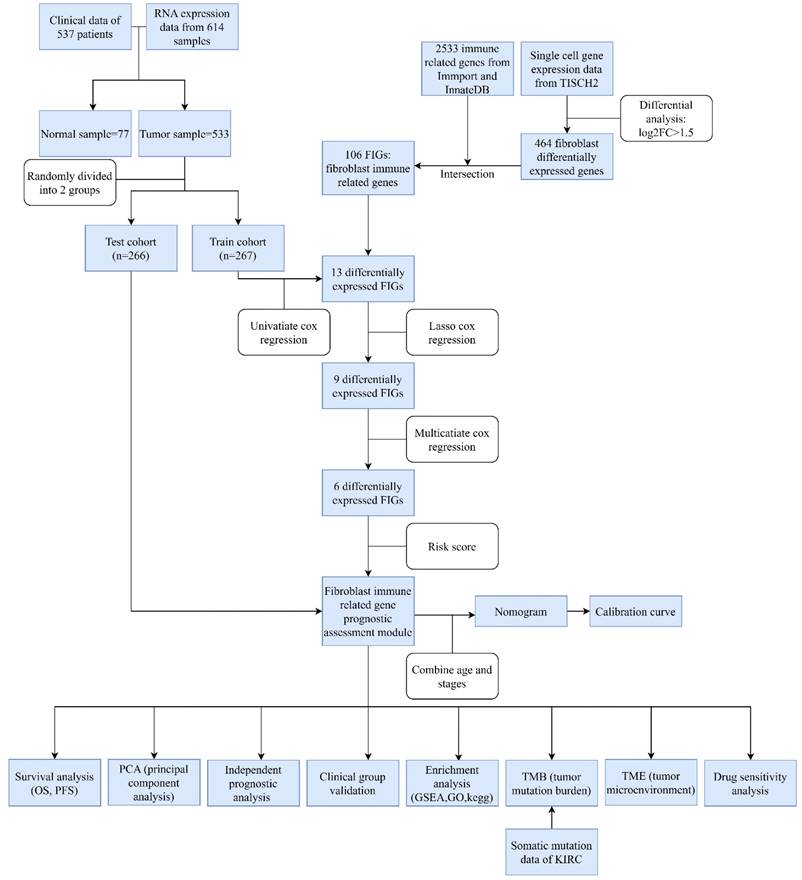
The design of this study is depicted in a flowchart as shown in Figure 1. Single cell gene expression information for KIRC patients were retrieved from the TISCH2 database. Then using the filter condition mentioned in method part, we pinpointed 464 genes that exhibited significant differential expression in fibroblasts (Table S2).
Flowchart.
Construction of the risk score
We performed an intersection analysis between the 464 differentially expressed fibroblast genes and 2533 genes which is related to immune response, 106 FIGs were identified as a consequence (Figure 2A). These 106 genes were then uploaded to the STRING database to examine their interactions, which facilitated the construction of a PPI network (Figure 2C). Further, we counted the number of adjacent nodes for each gene and found 22 genes with more than 20 neighboring nodes, for which we drew bar graphs of the number of adjacent nodes (Figure 2F). We suspect that the tumor necrosis factor (TNF) gene, with 73 neighboring nodes, was the core gene among the FIGs.
Intersection of immune-related genes and differentially expressed genes in fibroblasts resulted in 108 fibroblast immune-related genes (A), differential genes obtained through univariate Cox regression analysis (B), the protein interaction network of FIGs (C) and the screening of its core genes (F), Lasso regression analysis (D-E).
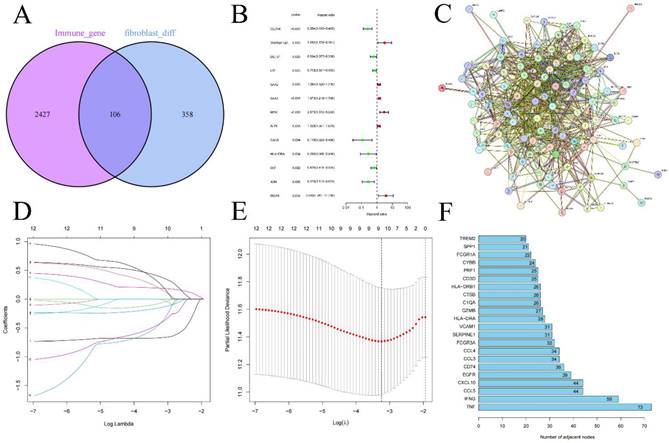
Randomly, we split the 533 KIRC patients into two groups: a training group for risk score foundation and a testing group to verify it (Table 1). Initially, through the use of univariate Cox regression analysis, 13 FIGs linked to prognosis were found, applying p-value less than 0.05 (Figure 2B) (Table S3). Subsequently, we performed LASSO regression analysis, selecting 9 prognosis associated FIGs from this process (Figures 2D, E). In the final step, multivariate Cox regression analysis helped us pinpoint 6 FIGs that were highly predictive of prognosis (Table S4). We then used these six genes to create our KIRC risk score. The risk score calculation formula for every sample is: (CLDN4's expression × -0.667) + (LTF's expression × -0.318) + (SAA1's expression × 0.261) + (MDK's expression × 0.741) + (HLA-DRA's expression × -1.302) + (ISG15's expression × 0.793).
Clinical information of the patients in the test and train groups.
| Characteristics | Train cohort (n=267) | Test cohort (n=266) | Entire cohort (n=533) | |||
|---|---|---|---|---|---|---|
| n | % | n | % | n | % | |
| Age | ||||||
| ≤65 | 166 | 62.17 | 183 | 68.8 | 349 | 65.48 |
| >65 | 101 | 37.83 | 83 | 31.2 | 184 | 34.52 |
| Status | ||||||
| Alive | 177 | 66.29 | 181 | 68.05 | 358 | 67.17 |
| Dead | 90 | 33.71 | 85 | 31.95 | 175 | 32.83 |
| Gender | ||||||
| Female | 94 | 35.21 | 94 | 35.34 | 188 | 35.27 |
| Male | 173 | 64.79 | 172 | 64.66 | 345 | 64.73 |
| Stage | ||||||
| Stage I | 137 | 51.31 | 130 | 48.87 | 269 | 50.09 |
| Stage II | 25 | 9.36 | 32 | 12.03 | 57 | 10.69 |
| Stage III | 63 | 23.60 | 60 | 22.56 | 123 | 23.08 |
| Stage IV | 41 | 15.36 | 42 | 15.79 | 83 | 15.57 |
| Unknow | 1 | 0.37 | 2 | 0.75 | 3 | 0.56 |
| T stage | ||||||
| T1 | 140 | 52.44 | 133 | 50.00 | 273 | 51.22 |
| T2 | 34 | 12.73 | 35 | 13.16 | 69 | 12.95 |
| T3 | 88 | 32.96 | 92 | 34.57 | 180 | 33.77 |
| T4 | 5 | 1.87 | 6 | 2.26 | 11 | 2.06 |
| M stage | ||||||
| M0 | 212 | 79.40 | 210 | 78.95 | 422 | 79.17 |
| M1 | 38 | 14.23 | 41 | 15.41 | 79 | 14.82 |
| Unknow | 17 | 6.37 | 15 | 5.64 | 32 | 6.01 |
| N stage | ||||||
| N0 | 120 | 44.94 | 120 | 45.11 | 240 | 45.03 |
| N1 | 8 | 3.00 | 8 | 3.01 | 16 | 3.00 |
| Unknow | 139 | 52.06 | 138 | 51.88 | 277 | 51.97 |
| Race | ||||||
| White | 232 | 86.89 | 230 | 85.19 | 462 | 86.68 |
| Black or African American | 29 | 10.86 | 27 | 10.00 | 56 | 10.51 |
| Asian | 2 | 0.74 | 6 | 2.22 | 8 | 1.50 |
| Unknow | 4 | 1.50 | 3 | 2.59 | 7 | 1.31 |
Abbreviation: M stage: metastasis stage; N stage: Node stage; T stage: Tumor stage.
Risk score accuracy verification
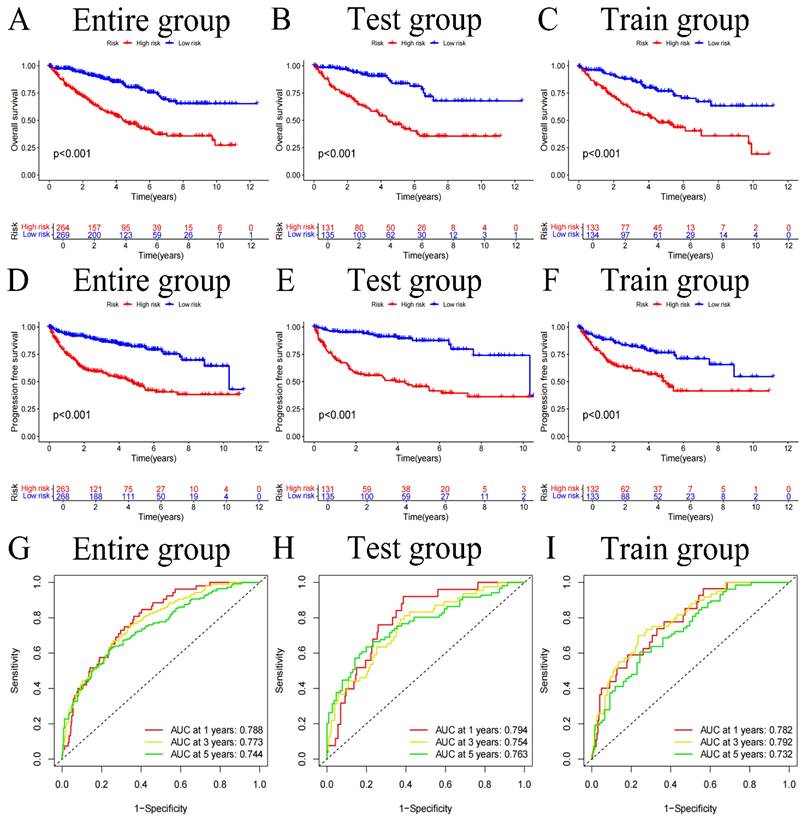
We divided the sample into high and low-risk groups based on the median value (0.938) of the risk score. After classifying the patient cohort into high-risk and low-risk categories (Table 2), we conducted analysis on OS and PFS. Based on the findings, the low-risk cohort's survival status was much better than those of the high-risk (all p-values<0.001) (Figure 3A-F). Additionally, a risk heatmap indicated that the low-risk cohort had higher levels of CLDN4, LTF, and HLA-DRA expression, identifying them as low-risk genes. The high-risk category exhibited elevated expression levels of SAA1, MDK, and ISG15, classifying them as high-risk genes (Figure S1A-C). This observation was further substantiated by the relationship curves for 6 FIGs and risk scores (Figure S2). According to scatter plots, patients in the high-risk category often had short survival times than low-risk patients (Figure S1D-I). Additionally, to predict the influence of each FIGs on the prognosis of KIRC patients, survival curves were plotted for each FIGs (Figure S3), showing that survival rates differed significantly even when considering the expression level of one FIGs (p-value<0.001). Subsequently to Cox independent prognostic multivariate and univariate analysis (Figure S4A, B), the results highlighted several key independent risk factors. In the univariate analysis, age (with p-value<0.001, HR=1.031, CI=1.018-1.045), tumor grade (with p-value<0.001, HR=2.275, CI=1.859-2.785), tumor stage (with p-value<0.001, HR=1.859, CI=1.631-2.119), and risk score (with p-value<0.001, HR=1.408, CI=1.310-1.514) were all identified as independent risk factors. The multivariate analysis further confirmed aforemen-tioned 4 factors continued to be significant independent predictors of prognosis: age (with p-value<0.001, HR=1.033, CI=1.018-1.048), tumor grade (with p-value=0.009, HR=1.355, CI=1.077-1.705), tumor stage (with p-value<0.001, HR=1.601, CI=1.375-1.865), and risk score (with p-value<0.001, HR=1.285, CI=1.177-1.404). PCA was applied to confirm that our risk score effectively differentiates patients into distinct risk categories (Figure S5H, I). Using this risk score, we forecast patient survival rates at 1, 3, and 5-year and generated the corresponding ROC curves (Figures 3G-I). The AUC values for 1, 3, and 5-year are 0.788, 0.773, and 0.744 respectively, demonstrate the risk score's high efficacy in prognostic prediction. Further clinical relevance analysis revealed that our risk score accurately predicts various clinical features of patients. Significant variations in tumor grade, stage, and T and M stages were found between the 2 risk categories (Figure S4C, D) (all p-values<0.001), with box plots corroborating these findings (Figure S5A-J). Survival curves segmented by clinical subgroups further underscored the validity of our risk score, demonstrating significantly lower survival times in high-risk cohort in contrast to low-risk (Figure S6, Figure S7) (all p-values<0.01).
Clinical information for 533 patients in different risk categories.
| Characteristics | High-risk group (n=264) | Low-risk group (n=269) | ||
|---|---|---|---|---|
| n | % | n | % | |
| Age | ||||
| ≤65 | 170 | 64.39 | 179 | 66.54 |
| >65 | 94 | 35.61 | 90 | 33.46 |
| Status | ||||
| Alive | 136 | 51.52 | 222 | 82.53 |
| Dead | 128 | 48.48 | 47 | 17.47 |
| Gender | ||||
| Female | 87 | 32.95 | 101 | 37.55 |
| Male | 177 | 67.05 | 168 | 62.45 |
| Stage | ||||
| Stage I | 94 | 35.61 | 173 | 64.31 |
| Stage II | 24 | 9.09 | 33 | 12.27 |
| Stage III | 78 | 29.55 | 45 | 23.08 |
| Stage IV | 67 | 25.38 | 16 | 5.95 |
| Unknow | 1 | 0.38 | 2 | 0.74 |
| T stage | ||||
| T1 | 99 | 37.50 | 174 | 64.68 |
| T2 | 33 | 12.50 | 36 | 13.38 |
| T3 | 121 | 45.83 | 59 | 21.93 |
| T4 | 11 | 4.17 | 0 | 0 |
| M stage | ||||
| M0 | 181 | 68.56 | 241 | 89.59 |
| M1 | 63 | 23.86 | 16 | 5.95 |
| Unknow | 20 | 7.58 | 12 | 4.46 |
| N stage | ||||
| N0 | 114 | 43.18 | 126 | 46.84 |
| N1 | 12 | 4.55 | 4 | 1.49 |
| Unknow | 138 | 52.27 | 139 | 51.67 |
| Race | ||||
| White | 230 | 87.12 | 232 | 84.98 |
| Black or African American | 29 | 10.98 | 27 | 9.89 |
| Asian | 2 | 0.76 | 6 | 2.20 |
| Unknow | 3 | 1.14 | 4 | 2.93 |
Abbreviation: M stage: metastasis stage; N stage: Node stage; T stage: Tumor stage.
Overall survival (OS) curves for the entire group, test group, and train group (A-C), Progression-free survival (PFS) curves (D-F), and ROC curves (G-I).
Nomogram construction
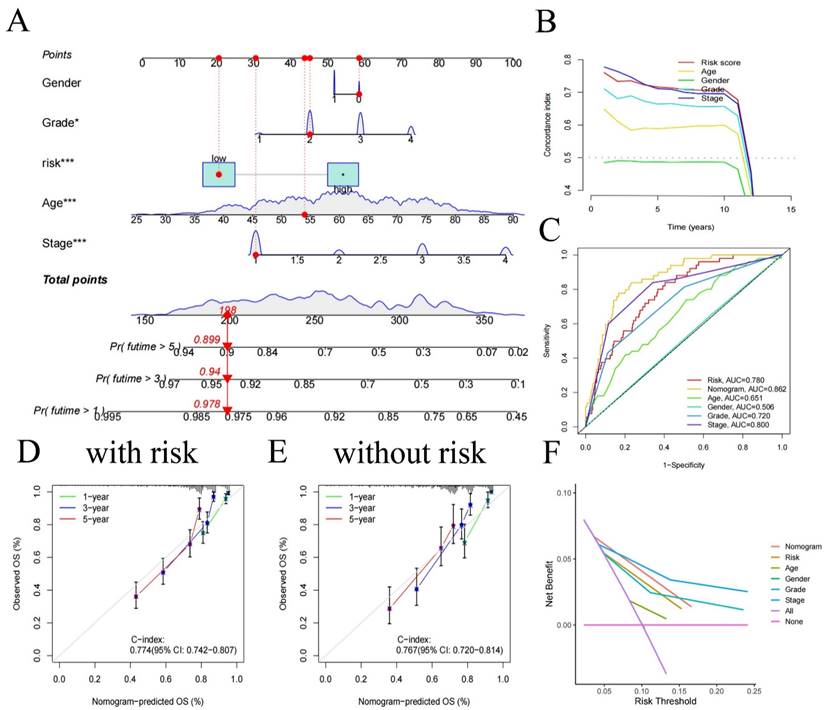
We created a nomogram (Figure 4A), offering a device for predicting patients' clinical prognosis using our risk score together with patient clinical data (age, gender, grade, and stage). The calibration curves provided proof of the precision of the nomogram (Figure 4D, E). To demonstrate the value of our nomogram in predicting patients' prognosis, we also plotted C-index curves, revealing the risk score's C-index (0.774) surpassed other clinical features', confirming our risk score has advantages in predicting patients' prognosis compared to other clinical traits (Figure 4B). At the same time, we made 1, 3, 5-year ROC for all clinical traits (Figure 4C), we found that the AUC of the nomogram (0.862 for 1-year, 0.825 for 3-year, 0.781 for 5-year) was higher than all clinical traits, indicating that using our nomogram to predict patient's prognosis is more accurate than any other single clinical trait. Decision curve analysis showed similar results (Figure 4F), indicating significant practical value of our nomogram in clinical decision-making of patient's prognosis.
Nomogram constructed using age, gender, risk, and stage (A) and its C-index curve (B), ROC curve (C), calibration curve for the risk model (D), and calibration curve for the no risk model (E), decision curve (F).
Enrichment analysis to identify pathways involved
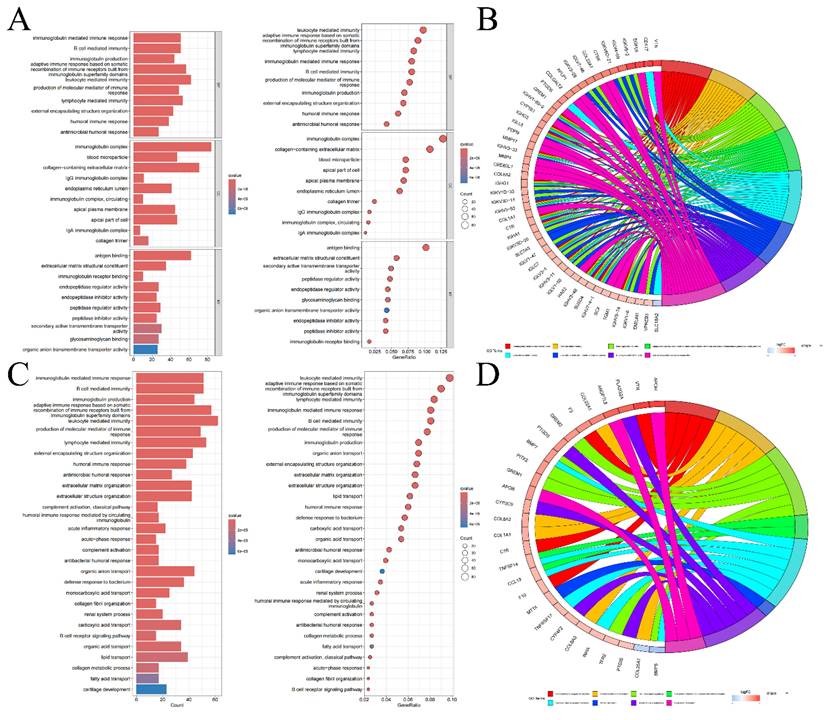
We conducted GSEA using five representative gene list files and identified the top 5 pathways concentrated in both high-risk and low-risk groups, as outlined in Table S5 and visualized in Figure S8. According to the GSEA results, in the high-risk category, genes differentially expressed were mostly concentrated in routes connected to coagulation, allograft rejection, complement, epithelial-mesenchymal transition, and xenobiotic metabolism. Conversely, the majority of the genes which differentially expressed in the low-risk cohort were concentrated in pathways connected to protein secretion, fatty acid metabolism, heme metabolism, oxidative phosphorylation, and androgen response. These insights imply that the poor prognosis in KIRC may be linked to the activation of genes involved in the coagulation pathway, whereas the upregulation of genes associated with the protein secretion pathway could potentially improve the prognosis of KIRC patients. Furthermore, according to the GO enrichment analysis, genes that showed variations in expression between 2 risk categories were primarily enriched in pathways for example antigen binding, the immunoglobulin complex, and leukocyte-mediated immune response (Figure 5A, B). KEGG enrichment analysis emphasized the notable concentration of genes with distinct expression patterns among 2 different risk cohorts in leukocyte-mediated immune response and immunoglobulin-mediated immune response pathways (Figure 5C, D). These results from the enrichment analysis suggest that the different prognosis between 2 different risk cohorts maybe due to dis-regulation of leukocyte and their immunogobulin secretion activity.
Bar graphs of GO enrichment analysis, bubble chart (A) and circle chart (B). Bar graphs of KEGG enrichment analysis, bubble chart (C), and circle chart (D).
Tumor mutation burden analysis
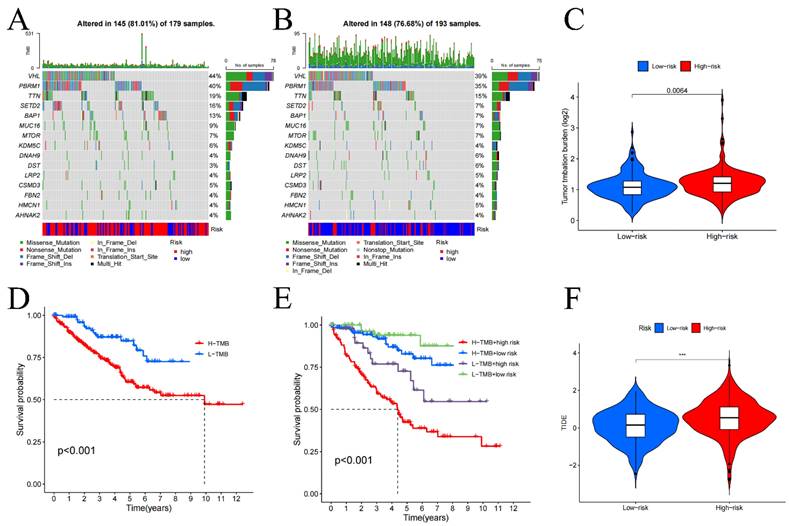
We performed a statistical analysis of the TMB and used waterfall charts (Figure 6A, B) to display the mutation patterns of the 2 risk categories' samples. Comparing the 2 risk cohorts, TMB is substantially higher for high-risk category (p-value=0.0064) (Figure 6C). In high-risk samples, the genes VHL (44%), PBRM1 (40%), TTN (19%), SETD2 (16%), and BAP1 (13%) exhibited the highest mutation rates. While the most altered genes in the low-risk group were VHL (39%), PBRM1 (35%), and TTN (15%). Additionally, survival analysis comparing low TMB group and high TMB group (Figure 6D, E) demonstrated that in contrast to the group with low TMB, the OS was considerably worse in high TMB group (p<0.001). These results point to a noteworthy connection between genes mutation numbers and the prognosis of KIRC patients, indicating that a higher TMB correlates with poorer prognosis.
Tumor mutation burden (TMB) in high (A) and low-risk groups (B), differential analysis of TMB between high and low-risk groups (C), and survival curves (D-E). TIDE analysis of immune evasion and immunotherapy (F). *p < 0.05, **p < 0.01, ***p < 0.001.
Tumor microenvironment and immune-related analysis
In our investigation of the TME, we utilized violin plots (Figure S9A) to demonstrate how the 2 risk categories' cell infiltration differs from one another. The research's findings demonstrated that comparing to low-risk cohort, high-risk cohort has higher stromal cell, and immune cell scores (all p-values<0.01). This suggests a notably greater presence of immune and stromal cells within the samples from the high-risk group. Further, immune phenotyping analysis highlighted significant differences in the immune characteristics between the two risk categories (Figure S9B) (p-value=0.001), emphasizing the distinct immune landscapes that correlate with patient risk categorization. Immune function analysis revealed that functions such as cell-mediated immunity, pro-inflammatory response, macrophage phagocytosis, co-stimulation of immune cells, and enhanced activity of helper T cells were noticeably greater in the group at high risk (all p-values<0.01), as shown in Figure S9C. In contrast, increased mast cell activity and a secondary tumor necrosis factor response, both significantly correlated with improved prognosis, were more prevalent in low-risk cohort (all p-value<0.01). Additionally, the analysis of immune cell infiltration in tumor tissues (Figure S9D) indicated that when compared to low-risk samples, the prevalence of regulatory T cells, plasma cells, follicular helper T cells, and M0 macrophages was considerably higher in high-risk samples (all p-value<0.01). On the other hand, the presence of monocytes, M1 macrophages, resting dendritic cells, resting NK cells, and mast cells was notably higher in low-risk samples (all p-value<0.01). These results were further corroborated by the risk score and immune cell infiltration association analysis, as detailed in Figure S10, underscoring the significant variances in immune profiles between the two risk groups. The analysis specifically highlighted that the infiltration of regulatory T cells increases markedly with higher risk scores, suggesting their potential role in contributing to the adverse prognosis of KIRC. It is noteworthy, although CD4+ T cells appear to act as a protective factor, as their numbers increase with decreasing risk scores, there was no discernible variation in CD4+ T cell infiltration between 2 risk categories. Additionally, in comparison to low-risk cohort, the high-risk cohort had higher TIDE scores (Figure 6F), suggesting that immunotherapy may work better for people in the low-risk category.
Drug sensitivity prediction
Following an assessment of 198 anti-cancer medications' sensitivity in high- and low-risk categories, we employed box plots to illustrate significant differences in response to 80 of these drugs between the two groups (Tables S6-S8). Specifically, the high-risk group generally showed heightened sensitivity to drugs that target the PI3K/AKT signaling pathway (Figure S11K), including Taselisib, Buparlisib, Afuresertib, AZD8055, Taselisib, Pictilisib, GNE-317, Alpelisib, AZD8186, MK-2206, AZD2014, and PF-4708671, Figure S11A-J exhibit some of the drugs. Samples in low-risk groups are more sensitive to drugs that block EGFR signaling pathway (Figure S11K), including AZD3759, Osimertinib, Gefitinib, Erlotinib and Afatinib.
Experimental validation in vitro
The Human Protein Atlas (HPA) database's immunohistochemical staining pictures were utilized to compare the protein expression levels of each FIGs in KIRC tissues to those in normal kidney tissues, as shown in Figure S10A. RT-qPCR analysis (Figure S12B-C) further quantified expression differences, revealing that the expression of HLA-DRA and CLDN4 was much higher in normal tissues than in cancerous tissues. In contrast, compared to normal tissues, tumor tissues showed noticeably elevated expression levels of SAA1, MDK, and ISG15. LTF showed increased expression in Caki-1 cells compared to normal tissues, despite this, there was no discernible variation in its expression between Caki-2 cells and normal tissues.
Discussion
RCC, especially its subtype KIRC, is marked by a high mortality rate of 30%-40% and an elusive pathogenesis [1]. Traditional TNM staging has shown limited effectiveness in prognosis prediction [2], highlighting the need for innovative prognostic models. Recent research has underscored the significant role of fibroblasts within the tumor microenvironment in driving cancer progression [16]. Leveraging single-cell data, we developed a risk score that aims to improve prognostic predictions for patients with KIRC. The risk score that utilized 6 FIGs is an independent predictive factor. It was discovered that patients placed in the high-risk category had a less favorable outcome. A nomogram, generated using clinical data and a risk score, demonstrated robust predictive accuracy. Additionally, enrichment analysis exhibited that genes linked to the protein secretion pathway might contribute to a more favorable prognosis. Through drug sensitivity analysis, this research also provides a crucial tool for tailoring anti-cancer treatment strategies in KIRC patients.
TNF expression in fibroblasts may play a significant role in KIRC. TNF, mainly produced by activated monocytes/macrophages [17], can kill and inhibit tumor cells [18] and promote the phagocytosis [19]. Our PPI demonstrated the core role of TNF in FIGs. Therefore, we suspect that TNF in fibroblasts can be a research direction for understanding KIRC. The risk heatmap revealed that CLDN4, LTF, and HLA-DRA are low-risk genes, whereas SAA1, MDK, and ISG15 were classified as high-risk genes. CLDN4, Claudin-4 mainly responsible for tight connections between cells [20]. The overexpression of CLDN4 may inhibit epithelial-mesenchymal transition [21]. LTF, lactoferrin can enhance the body's immune response by maintaining the balance of iron ions [22]. HLA-DRA encodes α chain in Class II HLA molecules which plays a significant apart in human immune response (especially allograft rejection) by being presented on antigen-presenting cells, particularly dendritic cells [23] and macrophages [24]. SAA1, Serum Amyloid A1 is an acute phase protein secreted by liver cells under the regulation of pro-inflammatory cytokines [26]. It has been recognized overexpression in multiple cancers, including lung and breast cancer [27]. MDK, midkine, serves as a vital pluripotent cytokine in the growth and development of the nervous system [28]. MDK promotes the occurrence and development of various tumors by activating signaling pathways like PI3K/AKT [29]. ISG15, Interferon-stimulated gene 15, is a gene encodes a specific protein which can interacts with cell cycle proteins, promote the progression of the cell cycle [30]. GSEA result can also offer clues of the mechanism for FIGs to KIRC. Active coagulation pathways may promote cancer growth and metastasis. Thrombin, as a core member of coagulation, can stimulate platelet release of TGFβ1 which can accelerate cancer cell proliferation and metastasis [31]. Thrombin also can trigger a series of intracellular signal transduction, including the PI3K/AKT pathway, enhancing the cell's proliferation, migration, and invasions [32]. Complements can promote tumor cell migration (loss of adhesion molecules) by combing with integrins which is on tumor cells surface [33]. Epithelial-mesenchymal transition may be mediated by overexpression of CLDN4, is considered a risk factor for KIRC, for its aiding cancer metastasis [34]. Heme metabolism is considered a protective factor, it may be due to heme can reduce the angiogenesis of tumor environment which reduce the metastasis [35]. Oxidative phosphorylation can inhibit the aerobic glycolysis [36] which can inhibit cancer development. Protein secretion can enhance the immunity which help the body to fight tumors [37]. We have down TME analysis which helps us finding out the unknown of KIRC patients' TME. Stromal cells are higher in high-risk group, it may be caused by the elevated tumor-stromal cell interaction which can promote tumor growth and angiogenesis. Regulatory T cells are responsible for calming hyper-activated immune response down, avoiding excessive immune response damage to the body. Their large infiltration in high-risk samples might indicate poor prognosis, which make them become a potential target for immunotherapy, CD4+ T cells can play apart in better prognosis for its number raise with the decrease of risk score. This information provides clues for future immunotherapy targets.
Drug sensitivity analysis has identified two key pathways: the PI3K/AKT and EGFR signaling pathways, both of which are essential in controlling cellular functions including growth, survival, and differentiation [38]. These pathways represent potential focal points for developing personalized treatments for KIRC. It is hypothesized that stromal cells, particularly fibroblasts, may secrete TGFβ. This protein could interact with receptor tyrosine kinases on tumor cells, thereby activating the PI3K/AKT pathway, which is believed to be upregulated in patients from high-risk group, suggesting a target for therapeutic intervention.
Our study offers several advantages. Notably, we developed a nomogram based on FIGs that has not been previously reported and successfully used it to predict survival time in KIRC patients, setting it apart from other studies. For comparison, the prognostic model for KIRC developed by Wang, C., et al. (2023) [2] also utilized transcriptomic data and single-cell multi-omics information and showed predictive utility for KIRC. However, their study did not incorporate TMB, nor did it explore the selection of anti-cancer drugs, we also summarized the classification of anti-cancer drugs that we identified vital for high- and low-risk groups. Comparing to the KIRC model creating by Muhammad Khan et al. (2022) [10] using pyroptosis related genes, we used RT-qPCR to validate the expression of the core genes used to construct risk score, while they did not. In contrast to the cuproptosis-related gene model by Liu, Y., et al. (2023) [4], our risk score was validated more extensively across all clinical subgroups, leading to more robust findings. Moreover, our risk score demonstrated a higher accuracy with an AUC of 0.744 compared to the telomere-related gene risk prognostic model by Li, S. C., et al. (2022) [39], which had an AUC of 0.721. Despite these strengths, it is critical to recognize the constraints on our research. The data utilized were sourced solely from a single database and have not been validated with external datasets. Consequently, additional clinical experiments are required to further substantiation.
Conclusions
The risk score and accompanying nomogram effectively predict outcomes for KIRC patients. Raised TMB and an active coagulation pathway may be linked to a worse outcome in high-risk group. According to drug sensitivity research, medications that target the PI3K/AKT signaling pathway are effective for patients in high-risk category, whereas those in the low-risk category show greater sensitivity to inhibitors of the EGFR pathway. Nonetheless, these findings need to be confirmed through additional experimental and clinical studies.
Abbreviations
AUC: area under the curve; CI: Confidence Interval; EGFR: epithelial growth factor receptor; FIG: fibroblast immune-related genes; GSEA: Gene set enrichment analysis; HIF: Hypoxia Inducible Factor; HR: Hazard ratios; KEGG: Kyoto Encyclopedia of Genes and Genomes; KIRC: renal clear cell carcinoma; K-M: Kaplan-Meier; K-SFM: Keratinocyte SFM; LASSO: Least absolute shrinkage and selection operator; LncRNA: Long non-coding RNA; OS: Overall survival; PCA: Principal component analysis; PFS: progression free survival; PPI: protein-protein interaction; RCC: renal cell carcinoma; ROC: Receiver operating characteristic; ssGSEA: Single-Sample Gene Set Enrichment Analysis; TCGA: The Cancer Genome Atlas; TGF: transforming growth factor; TIDE: Tumor immune dysfunction and exclusion; TISCH: Tumor Immuno-Single Cell Hub; TMB: Tumor Mutation Burden; TME: Tumor microenvironment; TNF: tumor necrosis factor.
Supplementary Material
Supplementary figures and tables.
Acknowledgements
The authors thank all public health workers involved in the development of the TCGA database and R language.
Funding
This study was supported by National Natural Science Foundation of China (NSFC, Grant number: 82360549). Role of the Funding: The funding had no role in the design and conduct of the study; collection, management, analysis, and interpretation of the data; preparation, review, or approval of the manuscript; and decision to submit the manuscript for publication.
Author contributions
Wenxiong Zhang had full access to all the data in the manuscript and takes responsibility for the integrity of the data and the accuracy of the data analysis. All authors read and approved the final manuscript.
Concept and design: Shuwen Zhang, Yuqian Yang, Liyi Zhang, Yijiang Liu, Zihun Guo, Jiajun Wu, Weijun Zhou, Zhengdong Hong, and Wenxiong Zhang.
Experiments: Shuwen Zhang, Yuqian Yang, Liyi Zhang, and Wenxiong Zhang.
Acquisition, analysis, or interpretation of data: Shuwen Zhang, Yuqian Yang, Liyi Zhang, Yijiang Liu, Zihun Guo, Jiajun Wu, Weijun Zhou, Zhengdong Hong, and Wenxiong Zhang.
Statistical analysis: Shuwen Zhang, Yuqian Yang, Zhengdong Hong, and Wenxiong Zhang.
Drafting of the manuscript: Shuwen Zhang, Zhengdong Hong, and Wenxiong Zhang.
Critical revision of the manuscript for important intellectual content: Shuwen Zhang, Zhengdong Hong, and Wenxiong Zhang.
Supervision: Shuwen Zhang, Zhengdong Hong, and Wenxiong Zhang.
Availability of data and material
Data is provided within the manuscript or supplementary information files.
Competing Interests
The authors have declared that no competing interest exists.
References
1. Siegel RL, Giaquinto AN, Jemal A. Cancer statistics, 2024. CA: A Cancer Journal for Clinicians. 2024;74(1):12-49
2. Wang C, He Y, Zheng J, Wang X, Chen S. Dissecting order amidst chaos of programmed cell deaths: construction of a diagnostic model for KIRC using transcriptomic information in blood-derived exosomes and single-cell multi-omics data in tumor microenvironment. Frontiers in immunology. 2023;14:1130513
3. Motzer RJ, Jonasch E, Agarwal N, Alva A, Baine M, Beckermann K. et al. Kidney Cancer, Version 3.2022, NCCN Clinical Practice Guidelines in Oncology. Journal of the National Comprehensive Cancer Network. J Natl Compr Canc Netw. 2022;20(1):71-90
4. Liu Y, Shao Y, Hao Z, Lei X, Liang P, Chang Q. et al. Cuproptosis gene-related, neural network-based prognosis prediction and drug-target prediction for KIRC. Cancer medicine. 2023;13(1):e6763
5. Cialdai F, Risaliti C, Monici M. Role of fibroblasts in wound healing and tissue remodeling on Earth and in space. Frontiers in Bioengineering and Biotechnology. 2022;10:958381
6. Peterfi L, Yusenko MV, Kovacs G, Beothe T. FAPα and αSMA mark different subsets of fibroblasts in normal kidney and conventional renal cell carcinoma. Neoplasia (New York, N.Y.). 2023;35:100854
7. Hu H, Piotrowska Z, Hare PJ, Chen H, Mulvey HE, Mayfield A. et al. Three subtypes of lung cancer fibroblasts define distinct therapeutic paradigms. Cancer cell. 2021;39(11):1531-1547
8. Hu D, Li Z, Zheng B, Lin X, Pan Y, Gong P. et al. Cancer-associated fibroblasts in breast cancer: Challenges and opportunities. Cancer communications (London, England). 2022;42(5):401-434
9. Czekay R-P, Cheon D-J, Samarakoon R, Kutz SM, Higgins PJ. Cancer-Associated Fibroblasts: Mechanisms of Tumor Progression and Novel Therapeutic Targets. Cancers. 2022;14(5):1231
10. Khan M, Ai M, Du K, Song J, Wang B, Lin J. et al. Pyroptosis relates to tumor microenvironment remodeling and prognosis: A pan-cancer perspective. Frontiers in Immunology. 2022;13:1062225
11. Li S-C, Jia Z-K, Yang J-J, Ning X-h. Telomere-related gene risk model for prognosis and drug treatment efficiency prediction in kidney cancer. Frontiers in Immunology. 2022;13:975057
12. Liu Y, Shao Y, Hao Z, Lei X, Liang P, Chang Q, Wang X. Cuproptosis gene-related, neural network-based prognosis prediction and drug-target prediction for KIRC. Cancer Medicine. 2023;13(1):e6763
13. Han X, Zhou Z, Fei L, Sun H, Wang R, Chen Y. et al. Construction of a human cell landscape at single-cell level. Nature. 2020;581(7808):303-309
14. Zhang J, Lu T, Lu S, Ma S, Han D, Zhang K. et al. Single-cell analysis of multiple cancer types reveals differences in endothelial cells between tumors and normal tissues. Computational and structural biotechnology journal. 2023;21:665-676
15. Zhang J, Deng Y, Zhang H, Zhang Z, Jin X, Xuan Y. et al. Single-Cell RNA-Seq Analysis Reveals Ferroptosis in the Tumor Microenvironment of Clear Cell Renal Cell Carcinoma. International journal of molecular sciences. 2023;24(10):9092
16. Zhao L, Chen J, Pang Y, Fu K, Shang Q, Wu H. et al. Fibroblast activation protein-based theranostics in cancer research: A state-of-the-art review. Theranostics. 2022;12(4):1557-1569
17. Webster JD, Vucic D. The Balance of TNF Mediated Pathways Regulates Inflammatory Cell Death Signaling in Healthy and Diseased Tissues. Frontiers in Cell and Developmental Biology. 2020;8:365
18. Wang X, Lin Y. Tumor necrosis factor and cancer, buddies or foes? Acta pharmacologica Sinica. 2008;29(11):1275-1288
19. Sethi JK, Hotamisligil GS. Metabolic Messengers: tumour necrosis factor. Nature Metabolism. 2021;3(10):1302-1312
20. Kalliolias GD, Ivashkiv LB. TNF biology, pathogenic mechanisms and emerging therapeutic strategies. Nature reviews. Rheumatology. 2016;12(1):49-62
21. Hao S, Yang C, Song P, Shi H, Zou Y, Chen M. et al. CLDN4 promotes growth of acute myeloid leukemia cells via regulating A. Biochemical and Biophysical Research Communications. 2022;619:137-143
22. Wang F, Gao Y, Tang L, Ning K, Geng N, Zhang H. et al. A novel PAK4-CEBPB-CLDN4 axis involving in breast cancer cell migration and invasion. Biochemical and Biophysical Research Communications. 2019;511(2):404-408
23. Xu Y, Wang Y, He J, Zhu W. Antibacterial properties of lactoferrin: A bibliometric analysis from 2000 to early 2022. Frontiers in Microbiology. 2022;13:947102
24. Matsushima GK, Itoh-Lindstrom Y, Ting JP. Activation of the HLA-DRA gene in primary human T lymphocytes: novel usage of TATA and the X and Y promoter elements. Molecular and cellular biology. 1992;12(12):5610-5619
25. Choo SY. The HLA system: genetics, immunology, clinical testing, and clinical implications. Yonsei medical journal. 2007;48(1):11-23
26. Sack GH. Serum amyloid A - a review. Molecular Medicine. 2018;24(1):46
27. Sorić Hosman I, Kos I, Lamot L. Serum Amyloid A in Inflammatory Rheumatic Diseases: A Compendious Review of a Renowned Biomarker. Frontiers in Immunology. 2021;11:631299
28. Hu B, Qin C, Li L, Wei L, Mo X, Fan H. et al. Midkine promotes glioblastoma progression via PI3K-Akt signaling. Cancer Cell International. 2021;21(1):509
29. Saikia M, Cheung N, Singh AK, Kapoor V. Role of Midkine in Cancer Drug Resistance: Regulators of Its Expression and Its Molecular Targeting. International journal of molecular sciences. 2023;24(10):8739
30. Held T, Basler M, Knobeloch KP, Groettrup M. Evidence for an involvement of the ubiquitin-like modifier ISG15 in MHC class I antigen presentation. European Journal of Immunology. 2021;51(1):138-150
31. Ahamed J, Burg N, Yoshinaga K, Janczak CA, Rifkin DB, Coller BS. In vitro and in vivo evidence for shear-induced activation of latent transforming growth factor-beta1. Blood. 2008;112(9):3650-3660
32. Takemoto A, Okitaka M, Takagi S, Takami M, Sato S, Nishio M. et al. A critical role of platelet TGF-β release in podoplanin-mediated tumour invasion and metastasis. Scientific Reports. 2017;7(1):42186
33. Janiszewska M, Primi MC, Izard T. Cell adhesion in cancer: Beyond the migration of single cells. The Journal of biological chemistry. 2020;295(8):2495-2505
34. Santos Ramos F, Wons L, João Cavalli I, MSF Ribeiro E. Epithelial-mesenchymal transition in cancer: An overview. Integrative Cancer Science and Therapeutics. 2017;4(3):1-5
35. Magri S, Musca B, Pinton L, Orecchini E, Belladonna ML, Orabona C. et al. The immunosuppression pathway of tumor-associated macrophages is controlled by heme oxygenase-1 in glioblastoma patients. International Journal of Cancer. 2022;151(12):2265-2277
36. Delaunay S, Pascual G, Feng B, Klann K, Behm M, Hotz-Wagenblatt A. et al. Mitochondrial RNA modifications shape metabolic plasticity in metastasis. Nature. 2022;607(7919):593-603
37. Zefferino R, Piccoli C, Di Gioia S, Capitanio N, Conese M. How Cells Communicate with Each Other in the Tumor Microenvironment: Suggestions to Design Novel Therapeutic Strategies in Cancer Disease. International journal of molecular sciences. 2021;22(5):2550
38. Hernandez-Aya LF, Gonzalez-Angulo AM. Targeting the phosphatidylinositol 3-kinase signaling pathway in breast cancer. The oncologist. 2011;16(4):404-414
39. Chen J, Zhang D, Ren X. et al. A comprehensive prognostic and immunological analysis of telomere-related lncRNAs in kidney renal clear cell carcinoma. Aging. 2023;15:11012-11032
Author contact
![]() Corresponding authors: Zhengdong Hong, MD, Department of Urology Surgery, The Second Affiliated Hospital, Jiangxi Medical College, Nanchang University, 1 Minde Road, Nanchang, 330006, China. Email: zdhong2015com; Wenxiong Zhang, MD, Department of Thoracic Surgery, The Second Affiliated Hospital, Jiangxi Medical College, Nanchang University, 1 Minde Road, Nanchang, 330006, China. Email: Ndefy01261edu.cn.
Corresponding authors: Zhengdong Hong, MD, Department of Urology Surgery, The Second Affiliated Hospital, Jiangxi Medical College, Nanchang University, 1 Minde Road, Nanchang, 330006, China. Email: zdhong2015com; Wenxiong Zhang, MD, Department of Thoracic Surgery, The Second Affiliated Hospital, Jiangxi Medical College, Nanchang University, 1 Minde Road, Nanchang, 330006, China. Email: Ndefy01261edu.cn.